Simple Summary
Near-infrared imaging of tumors during surgery facilitates the oncologic surgeon to distinguish malignant from healthy tissue. The technique is based on fluorescent tracers binding to tumor biomarkers on malignant cells. Currently, there are no clinically available fluorescent tracers that specifically target soft tissue sarcomas. This review searched the literature to find candidate biomarkers for soft tissue sarcomas, based on clinically used therapeutic antibodies. The search revealed 7 biomarkers: TEM1, VEGFR-1, EGFR, VEGFR-2, IGF-1R, PDGFRα, and CD40. These biomarkers are abundantly present on soft tissue sarcoma tumor cells and are already being targeted with humanized monoclonal antibodies. The conjugation of these antibodies with a fluorescent dye will yield in specific tracers for image-guided surgery of soft tissue sarcomas to improve the success rates of tumor resections.
Abstract
Surgery is the mainstay of treatment for localized soft tissue sarcomas (STS). The curative treatment highly depends on complete tumor resection, as positive margins are associated with local recurrence (LR) and prognosis. However, determining the tumor margin during surgery is challenging. Real-time tumor-specific imaging can facilitate complete resection by visualizing tumor tissue during surgery. Unfortunately, STS specific tracers are presently not clinically available. In this review, STS-associated cell surface-expressed biomarkers, which are currently already clinically targeted with monoclonal antibodies for therapeutic purposes, are evaluated for their use in near-infrared fluorescence (NIRF) imaging of STS. Clinically targeted biomarkers in STS were extracted from clinical trial registers and a PubMed search was performed. Data on biomarker characteristics, sample size, percentage of biomarker-positive STS samples, pattern of biomarker expression, biomarker internalization features, and previous applications of the biomarker in imaging were extracted. The biomarkers were ranked utilizing a previously described scoring system. Eleven cell surface-expressed biomarkers were identified from which 7 were selected as potential biomarkers for NIRF imaging: TEM1, VEGFR-1, EGFR, VEGFR-2, IGF-1R, PDGFRα, and CD40. Promising biomarkers in common and aggressive STS subtypes are TEM1 for myxofibrosarcoma, TEM1, and PDGFRα for undifferentiated soft tissue sarcoma and EGFR for synovial sarcoma.
Keywords:
TEM1; VEGFR-1; EGFR; VEGFR-2; IGF-1R; PDGFRα; CD40; image guided surgery; near-infra red fluorescence; soft tissue sarcomas 1. Introduction
Soft tissue sarcomas (STS) are a heterogeneous group of mesenchymal tumors that represent 1% of all malignancies [1]. The incidence in Europe is estimated at 4–5/100,000 per year, accumulating to approximately 18,000 new patients in Europe per year [2,3]. While most STS are diagnosed in the extremities (60%), they can arise anywhere in the body [4]. There are over 50 histological subtypes of STS, each with distinct behavioral, clinical, and prognostic features [5]. Surgery of STS is the mainstay of treatment for localized disease. For the aim of curative surgery, a tumor needs to be removed with a margin of normal tissue as the tumor pseudocapsule and reactive zone are expected to contain tumor cells [6]. Clinical outcome after surgical treatment is highly dependent on surgical resection margins, as tumor-positive margins are clearly associated with local recurrence (LR), and indirectly associated with overall survival [7,8,9,10]. Further, close or positive margins often necessitate the need for adjuvant radiotherapy to reduce the risk for LR with about 50%, but this increases the risk for local complications [11,12]. However, determining the surgical margin is challenging, particularly when tumor tissue is surrounded by vital structures or in STS subtypes with a highly infiltrative growth pattern, such as myxofibrosarcoma (MFS), undifferentiated soft tissue sarcoma (USTS, previously called undifferentiated pleomorphic sarcoma), and synovial sarcoma (SS). In these specific tumors, preoperative surgical planning is complicated by current limitations in preoperative radiological imaging. The infiltrative growth of sarcoma with long slender tails, clearly diagnosed by histology after surgical resection, is sometimes difficult to detect with preoperative imaging [13]. Consequently, despite centralizing STS treatment and (neo)adjuvant treatment modalities, positive margins and LR are still common. Positive margins are 13%, 20% and 28%, with LR rates of 12% (5-year follow up), 40% (10-year follow up), and 45% (5-year follow up) in SS, MFS, and USTS respectively [14,15,16,17,18]. The real-time intraoperative tumor-specific imaging of STS could help the surgeon to discriminate tumor from normal tissue, improving complete tumor resections and reducing LR rates. Near-infrared fluorescence (NIRF) imaging is one of the most upcoming technologies in real-time targeted imaging as it facilitates surgeons to visualize tumor tissue during surgery. It has been explored for various tumor types with promising results and is expected to play an important role in future surgery of STS [19].
Three important parameters define successful NIRF tumor-specific imaging: a tumor-specific biomarker, a targeting moiety conjugated to a fluorescent dye/fluorophore (tracer), and a NIRF camera system. In NIRF imaging, light in the near-infrared (NIR) wavelength is used (650–900 nm). In this region, tissue penetration of light is relatively high, due to low tissue absorption, and the autofluorescence of normal tissue is limited [20]. Light in the NIR region is invisible to the human eye and therefore a dedicated NIRF camera system is needed, which has the advantage that the surgical field is not altered by the fluorescence from the tracer. Clinical NIRF cameras of various companies are available [21].
The search for a tumor-specific biomarker for NIRF imaging of STS is complex, because of the rarity and heterogeneity of the disease. The ideal biomarker should be highly and homogenously expressed on tumor cells of most subtypes of STS, while being absent on adjacent healthy tissue. Like for other cancers, the biomarker should preferably be located on the cell surface of malignant cells to permit direct targeting and have the possibility of internalization (endocytosis of an extracellular molecule upon binding to a specific protein on the cell surface) to facilitate a long-lasting fluorescence signal. Ideally, this biomarker is still present on residual cells after neoadjuvant therapy.
Fluorescent tracers for tumor biomarkers are generated by the conjugation of a fluorescent dye/fluorophore to a targeting moiety. Various fluorophores are available and some are clinically approved [22]. Targeting moieties consist of proteins, like monoclonal antibodies or fragments thereof, peptides, RNA aptamers, or other small synthetic molecules. Monoclonal antibodies are the most widely used targeting moieties in biotherapy and imaging. The advantages of antibodies are their specificity, affinity, flexibility, and relatively long plasma half-life. To minimize immune reactions, human(ized) versions are mostly used. A disadvantage of antibodies for the use of imaging is the relatively high costs of development, which is particularly relevant for rare diseases like STS. In the past decade, therapeutic antibodies have been equipped with NIRF dyes and evaluated for imaging of common cancer types, like breast and colorectal cancer [19].
Elaborating on this approach, the aim of this systematic review is to select candidate biomarkers for specific intraoperative NIRF imaging of soft tissue sarcomas. STS are a rare and heterogeneous group of tumors. The development of a specific tracer for NIRF imaging that is not already clinically used in therapy would be very challenging as it would be costly and time consuming. Therefore, the search is restricted to clinically available monoclonal antibodies of which the safety profiles are already demonstrated and a translation towards a tracer for NIRF imaging can be expected. The overall purpose of this evaluation is to find optimal biomarkers for the three most common and aggressive STS subtypes MFS, USTS, and SS, which account for challenging resections and currently result in high rates of local recurrences.
2. Materials and Methods
2.1. Search Strategy
An initial search was performed to find clinically available monoclonal antibodies targeting STS. The EU Clinical Trials Register (www.clinicaltrialsregister.eu/) and clinical trials.gov (clinicaltrials.gov/) databases were searched with the keyword “Soft tissue sarcoma”, and all clinically available monoclonal antibodies targeting STS were listed. Next, a PubMed search with the respective biomarkers targeted by those monoclonal antibodies was created with the assistance of a medical librarian (Appendix A). The search was done in August 2019 and updated in September 2020 due to the publication of multiple relevant articles between August 2019 and September 2020. This systematic review was performed following the Preferred Reporting Items for Systematic Reviews and Meta-Analysis (PRISMA) guidelines of 2009 (registration ID: CRD42020206473) [23].
2.2. Eligibility Criteria
Studies were eligible for inclusion if they met the following criteria: (1) report of expression of cell surface-expressed biomarkers in STS for which a clinically available antibody was present, (2) at least 95% of the included tumor samples were primary STS, (3) sample size of at least 4, (4) published in the English language, and (5) full text was available. The eligibility of the studies was assessed by two authors (Z.R. and A.N.S.). Disagreements were discussed with a third reviewer (P.B.A.A.v.D.). Animal studies, xenograft studies, cell line studies, articles without positive and negative control samples, case reports, reviews, viewpoints, conference reports, meeting abstracts, letters to journals, or editors were excluded.
2.3. Data Extraction
The following data were extracted from eligible studies: target characteristics, sample size, type of sample, percentage of positive STS samples, localization of expression, pattern of expression, positive and negative controls, internalization, and previously imaged. A second tumor type-independent search was performed for data on internalization and previous imaging of targets where no information was found after the first search (Appendix B). Data on safety profiles of monoclonal antibodies was acquired through the search of Appendix A.
2.4. Biomarker Selection Scoring System
In order to select the optimal biomarkers for tumor specific NIRF imaging in STS, we developed a target selection scoring system. The scoring system is based on the modified version of the Target Selection Criteria (TASC), developed by Bosma et al. [24]. The scoring system is based on five domains (see Table 1).

Table 1.
Target selection scoring system.
- Sample size. The number of samples indicate how much evidence is acquired.
- Percentage of biomarker-positive STS samples. This is calculated based on the amount of STS samples that positively showed presence of the biomarker in each included article, independent of the percentage of positive tumor cells within each sample. Immunohistochemistry was used to assess the percentage of positive STS in tissue samples.
- Pattern of expression. Ideally, the target is expressed diffusely by all tumor cells (particularly at the tumor border) to guide surgical resection. The pattern of expression is defined as diffuse when expression is randomly spread throughout the tumor sample and focal when expression is located in a specific region of the tumor sample. When different samples show variable expression patterns (diffuse and focal), the expression pattern for the whole cohort is defined as heterogeneous. No distinction was made based on exact location of expression within tumor samples. While this review included studies evaluating tissue samples and tissue microarrays, data regarding the pattern of expression was extracted from studies including tissue samples.
- Internalization. This is important because internalization after binding of the tracer creates a long-lasting signal for tumor-specific imaging.
- Previously imaged. If there is prove that imaging is possible, it has more potential to be translated to the clinics. The distinction between imaging with or without NIRF is important for its applicability in NIRF imaging. This criterium was tumor type independent.
The maximum score for a target is 9 points, 7 was chosen as the cut-off value for promising targets for tumor specific NIRF imaging in STS.
3. Results
3.1. Study Selection
Our analysis of the EU Clinical Trials Register (https://www.clinicaltrialsregister.eu/) and clinical trials.gov (https://clinicaltrials.gov/) revealed the following clinically available monoclonal antibodies targeting STS-associated cell surface-expressed biomarkers (Table 2): Ontuxizumab (MORAb-004) [trial number: NCT01574716] targeting tumor endothelial marker 1 (TEM1), recombinant monoclonal antibody Aflibercept [NCT00390234], and humanized monoclonal antibody Bevacizumab [NCT03913806] targeting vascular endothelial growth factor A (VEGF-A), thereby indirectly targeting vascular endothelial growth factor receptor-1 (VEGFR-1) and vascular endothelial growth factor receptor-2 (VEGFR-2), Ramucirumab [NCT04145700] targeting VEGFR-2, Cetuximab [NCT00148109] targeting epidermal growth factor receptor (EGFR), Ganitumab (AMG 479) [NCT03041701], Teprotumumab [NCT00642941], Cixutumumab [NCT01016015] and Figitumumab [NCT00927966] targeting insulin-like growth factor 1 receptor (IGF-1R), Olaratumab [NCT03126591] targeting platelet derived growth factor α (PDGFRα), APX005M [NCT03719430] targeting cluster of differentiation 40 (CD40), Atezolizumab [NCT03474094], Avelumab [NCT04242238], Durvalumab [NCT03317457], and Envafolimab [NCT04480502] targeting programmed death-ligand 1 (PD-L1), ABBV-085 [NCT02565758] targeting leucine-rich repeat containing 15 (LRRC15), CAB-ROR2-ADC [NCT03504488] targeting receptor tyrosine kinase-like orphan receptor 2 (ROR2) and Ipilimumab [NCT04118166], and Tremelimumab [NCT03317457] targeting cytotoxic T-Lymphocyte-associated protein 4 (CTLA-4).
Table 2.
Summarized data regarding eleven reviewed biomarkers (in descending order of the modified target selection criteria score).
The PubMed search based on the cell surface-expressed biomarkers targeted by clinically available monoclonal antibodies identified 1856 articles (Figure 1). After screening the titles and abstracts, 1604 articles were excluded. Subsequently, 252 full-text articles were assessed for eligibility, of which 171 articles did not meet eligibility criteria; 107 articles did not study expression of the included biomarkers on human STS cells, for 19 articles data was not suitable for extraction, 16 articles had a sample size of less than 4 samples, 11 articles did not have full-text available, 10 articles had more than 5% of samples which were not primary STS and therefore their results were no longer a valid representation of STS samples, and 8 articles were reviews or letters to journals without an accompanying methods section. Data regarding internalization and previously imaged was not always described in STS. Therefore, a separate search was performed to obtain these data from other tissue types (Appendix B). This resulted in an additional 16 included articles. Ultimately, 97 articles were included for this review.
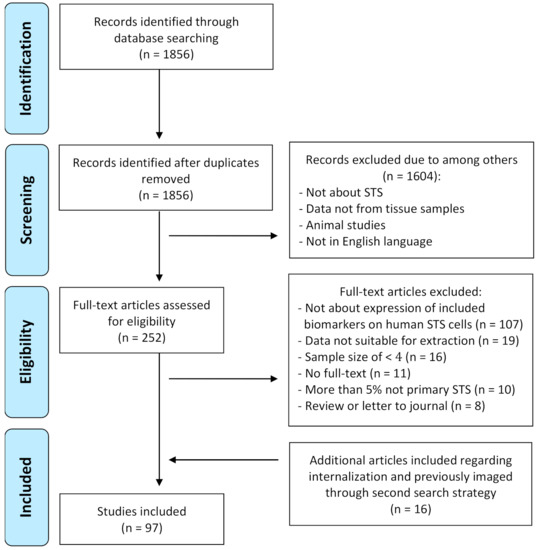
Figure 1.
Flowchart of study selection process.
3.2. Candidate Biomarkers
A modified Target Selection Criteria TASC)-scoring system was applied to eleven cell surface-expressed biomarkers (Table 1). Seven promising candidate targets for NIRF imaging emerged with a minimum score of 7 out of 9. The biomarkers arranged in descending order based on their scores were: TEM1 (9), VEGFR-1 (8), EGFR (8), VEGFR-2 (7), IGF-1R (7), PDGFRα (7) and CD40 (7). Further details of these biomarkers are described below and in Table 2, focusing on their physiological role, expression in STS, the availability of clinically used monoclonal antibodies targeting these biomarkers, and latest developments.
3.2.1. TEM1
Tumor Endothelial Marker 1, also referred to as Endosialin or CD248, is a highly glycosylated type I transmembrane protein classified among the C-type lectin-like domain superfamily 14. It has been suggested that TEM1 plays a critical role in wound healing and angiogenesis [121,122]. Moreover, while it is expressed minimally in normal conditions, it is markedly upregulated in the setting of injury and malignant tumor growth. In (soft tissue) sarcomas TEM1 was observed to be present on malignant cells [28]. Stromal TEM1 promotes spontaneous metastasis and TEM1-expressing pericytes were shown to facilitate distant site metastasis by stimulating tumor cell intravasation [123]. Furthermore, TEM1 expression is associated with enhanced tumor growth, presumably due to tumor-specific angiogenesis [124].
The presence of the biomarker in STS samples, regardless of the percentage of positive tumor cells, was determined on both tumor and stromal cells for TEM1. In STS, 77% (range 55–100%, n = 768) of the samples showed presence of TEM1 on average, reported in 4 different articles [26,27,28,29]. Staining was performed in 17 subtypes of STS (Appendix C). The expression pattern for TEM1 was diffuse. Corresponding to the expression in other cancer types, TEM1 expression is correlated with advanced tumor grade in STS [121,125].
In MFS it was demonstrated that TEM1 was present in all 34 investigated samples, with a diffuse pattern of expression [27]. Staining was negative or very limited in normal adjacent tissue such as muscular fascia and peripheral nerve bundles. For USTS an average of 81% (range 73–89%, n = 128) of the samples expressed TEM1, with a diffuse pattern of expression [28,29]. In SS, 71% (range 62–80%, n = 70) of the tissue samples stained positive for TEM1. The pattern of expression was heterogeneous with samples expressing TEM1 either focally or diffusely. Besides, Thway et al. [29] demonstrated in representative images that the spindle cell component of biphasic SS samples is positive, while the glandular epithelial areas are negative. Regarding monophasic SS, both positive and negative samples were reported [28,29]. Data are summarized in Table 3.
Table 3.
Summarized data regarding biomarkers in myxofibrosarcoma, undifferentiated soft tissue sarcoma, and synovial sarcoma.
Exclusively Ontuxizumab has been clinically investigated as a therapeutic drug in STS [130]. However, it still needs to be modified into a NIRF imaging tracer. A high-affinity human single-chain variable fragment (scFv)-Fc fusion protein (78Fc) targeting TEM1 has been engineered and conjugated with the near-infrared fluorochrome VivoTag-S750, which proved to be an efficient tracer in preclinical osteosarcoma and lung cancer models [25,27,124,127].
In conclusion, TEM1 can be targeted in NIRF imaging by Ontuxizumab upon conjugation to a NIRF dye and small proteins have been produced pre-clinically for similar purposes. A major advantage of TEM1 is that it has minimal to no expression on adjacent normal tissue and therefore it is characterized by a high tumor-to-background ratio. Additional benefits are its diffuse pattern of expression, the high frequency of positivity (STS 77%, MFS 100%, USTS 81% and SS 71%), and its correlation with advanced tumor grades. A disadvantage is its heterogeneous pattern of expression in the SS subtype with samples illustrating focal expression of TEM1.
3.2.2. VEGFR
The VEGFR family consists of the 3 members VEGFR-1, -2 and -3 which are receptors for ligands VEGF-A, -B, -C, -D, and Placenta Growth Factor [22]. The receptors contain a split tyrosine kinase domain and a ligand-binding part. The individual VEGFR members have separate roles in various signaling pathways, but as a family they collectively function as the principal driver of angiogenesis and lymph angiogenesis. Hence, VEGFRs are mainly expressed on vascular and lymphatic endothelial cells in healthy tissue [21,130,131]. In various tumor types, including STS, they are expressed by both endothelial cells and tumor cells [131]. Here they stimulate tumor growth [132]. VEGFR-1 and VEGFR-2 have been clinically targeted by antibodies in STS, in contrast to VEGFR-3. Therefore, only VEGFR-1 and VEGFR-2 will be evaluated.
VEGFR-1 presence was found in an average of 76% (range 22–100%, n = 477) of the STS patients in 8 different studies [32,33,34,35,36,37,38,39]. Staining was performed in 15 STS subtypes (Appendix C). The VEGFR-1 expression pattern was demonstrated to be diffuse. Expression was found in the cytoplasm, and on the nuclear and cell membrane [32,35]. VEGFR-2 expression was present in 71% (range 11–100%, n = 449) on average in 9 different studies, and 16 STS subtypes were evaluated [33,34,35,36,38,39,79,80,81]. The pattern of expression was heterogeneous, and expression was found in the cytoplasm, and on the nuclear and cell membrane [35,81]. Interestingly, Kilvaer et al. [131] states that VEGFR overexpression is correlated with an increased tumor grade.
No data were found for VEGFR immunohistochemical staining in MFS. One paper reported on the presence of VEGFR-1 and VEGFR-2 in USTS and SS [36]. VEGFR-1 and VEGFR-2 expression was found in 68% and 6% of 81 USTS samples, respectively. In SS, this was 70% and 4% for respectively VEGFR-1 and VEGFR-2 in 27 samples (Table 3). Moreover, the pattern of expression was described for neither USTS nor SS [36]. Additionally, no distinction was made between monophasic and biphasic SS in the published data.
Ramucirumab binds to VEGFR-2 and is currently in its recruitment phase for clinical testing in SS [133]. Besides, VEGFR-1 and VEGFR-2 may be targeted indirectly using Bevacizumab-IRDye800CW or Aflibercept upon conjugation to a NIRF dye [29,30,134,135]. Recently published study results showed visualization of all 15 included STS patients with Bevacizumab-IRDye800CW targeting VEGF-A. In this paper, in vivo tumor-to-background ratios of 2.0-2.5 were found with doses of 10-25mg tracer and no tracer-related adverse events occurred within 2 weeks after surgery [136]. Additionally, targeting tumors with Bevacizumab-IRDye800CW has been investigated extensively in clinical trials for several tumor types [134,135,136,137]. Here, its tolerable safety profile was confirmed in primary breast cancer patients [138].
In conclusion, VEGFR-1 and VEGFR-2 are receptors that may be targeted indirectly with a tracer, Bevacizumab-IRDye800CW, that has already widely proven its benefit in multiple cancer types. The direct targeting of VEGFR-2, however, may additionally be performed with Ramucirumab. Major advantages of VEGFR-1 are the high frequency of positivity in STS (76%), the diffuse pattern of expression in tumors and increasing expression associated with enhanced tumor grade. However, while VEGFR-1 is commonly present in USTS and SS, there is no data concerning its pattern of expression in these STS subtypes. Furthermore, advantages of VEGFR-2 are its high presence of 71% in STS samples and increasing expression associated with enhanced tumor grade. Disadvantages are a heterogeneous, and therefore unpredictable, pattern of expression in the evaluated tissue samples and the fact that only 6% of USTS and 4% of SS are positive. Additionally, both VEGFRs are commonly expressed in healthy tissue, potentially resulting in a low tumor-to-background ratio.
3.2.3. EGFR
Epidermal Growth Factor Receptor is a transmembrane glycoprotein belonging to the ErbB/HER family together with 3 additional distinct receptor tyrosine kinases: ErbB2/HER2, ErbB3/HER3, and ErbB4/HER4 [139]. Seven different ligands trigger intracellular signals for fundamental cellular functions including proliferation, differentiation, migration and survival of tumor cells [140,141]. EGFR is mainly expressed in proliferating keratinocytes [142,143]. In tumors, EGFR overexpression can trigger tumor invasion and metastasis. Furthermore, it is a central regulator of autophagy, which is strongly involved in resistance to cancer therapies [144,145].
EGFR expression in STS was described in 36 scientific papers [27,42,43,44,45,46,47,48,49,50,51,52,53,54,55,56,57,58,59,60,61,62,63,64,65,66,67,68,69,70,71,72,73,74,75,76]. The presence of EGFR on STS tissue was observed in an average of 53% of the samples (range 0–100%, n = 1918). Expression was evaluated in 29 different subtypes of STS (Appendix C). The pattern of expression was diffuse. Importantly, EGFR expression in STS was strongly correlated to higher histological grade [46,48,70].
In MFS, EGFR presence was observed in an average of 38% (range 0–89%, n = 97) of the samples in 3 articles (Table 3) [26,53,65]. This wide range might be explained by the fact that 1 article included 10 low-grade MFS samples of which none expressed EGFR. The remaining 2 articles had a higher percentage of positive samples with a diffuse pattern of expression. This confirms the positive correlation of EGFR expression with increased histological grade STS [26,53,65]. For USTS, EGFR expression was detected in an average of 62% (range 5–95%, n = 287) of the samples with a heterogeneous pattern of expression. Similar to MFS, a wide range was observed with 1 article reporting 5% of 200 samples to be positive for EGFR staining, 1 article reporting 58% in 24 samples, and 2 articles reporting 91% and 95% positive samples in 44 and 19 samples, respectively. Here, the correlation to increased histological grade could not explain the variable expression [50,57,65,70]. Lastly, EGFR presence was seen in an average of 86% (range 71–100%, n = 160) of the SS samples. The pattern of expression was noticeably heterogeneous, extending from focal to diffuse expression [52,58,66,69,70,71]. Furthermore, Gusterson et al. [58] and Sato et al. [66] compared the spindle cell and epithelial components of biphasic SS samples. They described that the former is strongly positive, whereas the latter is mainly negative for EGFR expression. Regarding monophasic SS, both positive and negative samples were reported.
Currently, Cetuximab is the only clinically investigated EGFR-targeting monoclonal antibody for STS [146]. It has been conjugated to IRDye800 and examined in several clinical trials in other tumor types. To appraise its utility in the detection of metastatic lymph nodes in pancreatic cancer, a total of 144 human lymph nodes were evaluated ex-vivo. The Cetuximab-IRDye800 conjugate demonstrated a sensitivity and specificity of 100% and 78% [147]. Additionally, no grade 2 or higher adverse events were observed with Cetuximab-IRDye800 in glioblastoma and head and neck squamous cell carcinoma [148,149].
A clinical trial investigating the use of ABY-029, an affibody conjugated to IRDye800CW targeting EGFR, is in the recruitment phase for targeting STS [150]. Based on pre-clinical research it is a promising tracer for STS and is safe for human use [41,151]. Other clinical trials in their recruitment phase explore the use of Panitumumab-IRDye800 in imaging of head and neck cancer, lung cancer, and metastatic lymph nodes [152,153,154].
In summary, there are multiple promising tracers available which can be applied for NIR fluorescence-guided surgery in STS. Main advantages of EGFR, apart from the readily available tracers, are its diffuse pattern of expression in STS in general, the increased expression in STS of higher histological grade, and the high frequency of expression (88%) among SS samples. Yet, some drawbacks are the mediocre percentage (54%) of positive tumor samples in STS in general and the highly heterogeneous expression pattern in SS.
3.2.4. IGF-1R
Insulin-like Growth Factor 1 Receptor is a receptor tyrosine kinase that is activated upon binding with IGF-1 or IGF-2. Under normal physiological circumstances, this provokes a chain of signaling events that induce cellular transformations such as hypertrophy in skeletal muscle. IGF-1R is upregulated in multiple malignancies, including prostate, breast and lung cancer, where it is involved in tumor growth. Besides, it enables cancer cells to resist the cytotoxic properties of radiotherapy and chemotherapeutic drugs by inducing an anti-apoptotic effect [24].
IGF-1R presence was detected in 63% (range 25–100%, n = 507) of STS samples on average in 9 different studies [63,64,82,90,126,128,129,155,156]. Staining was performed in 15 subtypes of STS (Appendix C). The receptor was dispersed diffusely in the cytoplasm, and on the nuclear and cell membrane [62,82,128]. No correlation between histological grade and IGF-1R expression was observed [64,128].
No data are available on IGF-1R presence in MFS. Presence of IGF-1R in USTS and SS was evaluated in 1 and 4 articles respectively [81,82,126,128,129]. IGF-1R presence was found in 25% of the USTS samples (n = 120), while in SS an average of 57% (range 35–100%, n = 195) of the samples stained positive. The pattern of expression was described for neither (Table 3). However, Friedrichs et al. [155] reported that vast areas of tumorous tissue showed membranous staining in monophasic (comprising spindle cells) SS. In contrast, biphasic SS samples displayed predominantly positive staining in the epithelial component. Regarding monophasic SS, both positive and negative samples were reported [81,126,128,129].
Clinical trials targeting IGF-1R in STS have been conducted with Teprotumumab, Cixutumumab, Figitumumab, and Ganitumab [157,158,159,160,161]. Nevertheless, these monoclonal antibodies have not been evaluated for their potential in NIRF imaging.
AVE-1642, a humanized anti-IGF-1R antibody, labelled with Alexa 680 has been pre-clinically investigated in in vivo breast cancer models and adequately identified receptor expression [162].
Overall, IGF-1R may be targeted in NIRF imaging by several potential antibodies after conjugation to a NIRF dye. In addition, pre-clinical advances have resulted in promising tracers that may find future clinical use. An advantage of IGF-1R is its relatively common (63%) presence in all STS samples. However, its expression has no correlation with tumor grade, and data on pattern of expression in MFS, USTS and SS is limited.
3.2.5. PDGFR
Platelet-Derived Growth Factor is a receptor tyrosine kinase characterized by two isoforms, PDGFRα and PDGFRβ [163]. The receptors can be activated after binding by ligands from the PDGF-family. Upon activation, PDGFR is known to control angiogenesis in endothelial cells, and cell migration and growth in mesenchymal cells. Moreover, in healthy tissue both PDGFRs are mainly expressed in mesenchymal cells during inflammation, whereas during non-inflammatory conditions the expression is minimal [164,165]. In tumor biology, PDGFR activation stimulates cell growth and enhances metastatic behavior by attracting fibroblasts, which secrete factors that promote proliferation and migration of tumor cells. Both PDGFRα and -β are expressed by tumor cells of STS, yet expression of specifically PDGFRα is evaluated in this review as a monoclonal antibody against this receptor has been clinically tested in STS, while not against PDGFRβ [42,46,166,167].
Based on the literature search, PDGFRα was present in 64% of STS samples on average (range 0–100%, n = 1536) in 21 different articles [27,34,36,38,42,43,44,45,46,47,48,49,51,82,86,87,88,89,90,91,92]. Expression was evaluated in 22 different subtypes of STS (Appendix C). The pattern of expression was diffuse, and expression was identified in the cytoplasm, and on the nuclear and cell membrane of the tumor cells [45,86,168].
PDGFRα expression in the specific STS subtypes of interest, MFS, USTS, and SS, were evaluated separately in 1, 4, and 5 articles, respectively. In MFS PDGFRα was present in 77% of 34 tissue samples [27]. In USTS, 78% of the tumors (range 63–99%, n = 475) were positive for PDGFRα, while for SS 69% (range 44–84%, n = 136) stained positive. Moreover, expression was reported to be diffuse in USTS. No data regarding the pattern of expression of MFS and SS were reported [35,50,88,91,126,155]. However, opposing data was published regarding differences in expression of either spindle cell or epithelial components in biphasic SS. While Fleuren et al. [89] displayed images where exclusively the spindle cell component expressed PDGFRα, Lopez-Guerrero et al. [92] reported that membranous staining was more prominent in the epithelial component. Regarding monophasic SS, both positive and negative samples were reported. Data are summarized in Table 3.
Multiple drugs targeting PDGFRα are currently FDA approved or subject to clinical trials. However, Olaratumab is the only monoclonal antibody that has been clinically investigated for STS. It binds specifically PDGFRα [169]. No clinical NIRF imaging studies have been performed using Olaratumab conjugated with a fluorophore in any cancer type.
In summary, PDGFRα may be targeted in NIRF imaging by Olaratumab after conjugation to a NIRF dye. The advantages of PDGFRα are its relatively regular (65%) presence in STS samples and its diffuse pattern of expression in specifically USTS with 78% of samples expressing PDGFRα. The disadvantages are the non-reported patterns of expression for MFS and SS, and no article addressed a correlation between enhanced PDGFRα expression and histological grade.
3.2.6. CD40
Cluster of Differentiation 40 is a member of the tumor necrosis factor family and can be ligated by CD40 Ligand (CD40L). CD40 is detected on dendritic cells, B-cells and myeloid cells that can mediate cytotoxic T-cell priming upon CD40L ligation [170]. Moreover, it is constitutively expressed on platelets, smooth muscle cells, and endothelial cells [166]. In cancer, CD40 has been found in nearly all B-cell malignancies and many solid tumors, where it induces a direct cytotoxic effect in the absence of immune accessory cells [167]. It is hypothesized that it confers a growth and survival stimulus via signaling pathways such as PI3Kinase/Akt and NFκB and/or that it modulates anti-tumor immune responses [168].
CD40 was present in 62% of STS samples (range 17–86%, n = 153) on average in 4 different scientific papers [95,96,97,98]. The pattern of expression was diffuse, when assessed in 7 subtypes (Appendix C). Expression was observed on the membrane and in the cytoplasm of tumor cells [95,96,97,98]. No association between enhanced CD40 expression and histological grade was found after comparing low-grade to high-grade STS samples [97]. Furthermore, no articles published data regarding CD40 expression on MFS, USTS and SS separately.
A phase II clinical trial applying APX005M, a second-generation agonistic CD40 monoclonal antibody, combined with Doxorubicin in STS is currently recruiting participants [171]. Nonetheless, the antibody has not yet been evaluated for NIRF imaging and no other CD40-targeting drug has thus far been clinically examined for CD40.
Apart from 2 articles focusing on respectively B-cell activation by targeting CD40 with nanoparticles and cerebral ischemia by targeting CD40 with an anti-CD40 antibody conjugated to Cy5.5, no pre-clinical advances in the field of NIRF imaging can be addressed using CD40 as a target [94,172].
In conclusion, APX005M may be utilized as tracer after conjugation to a NIRF dye for imaging in STS. Pre-clinical studies have developed tracers targeting CD40, yet these have not been tested in STS models thus far. Advantages of CD40 are a diffuse pattern of expression and the fact that expression is relatively common (62%) in STS samples in general. Disadvantages are the small number of evaluated STS samples and the lack of data regarding CD40 expression in MFS, USTS and SS.
3.3. Potential NIRF Imaging Tracers Safety Profile
In this review, 7 potential targets for fluorescence-guided surgery of STS (TEM1, VEGFR-1, EGFR, VEGFR-2, IGF-1R, PDGFRα, and CD40) were selected based on antibodies that are clinically available and mostly used in the antibody-based therapy of STS. Several tracers have already proven to be well suitable for NIRF imaging. Among these tracers, Bevacizumab-IRDye800CW targeting VEGF-A (indirectly VEGFR-1 and VEGFR-2) has already shown promising results in STS [136]. Besides, Cetuximab-IRDye800 targeting EGFR is an adequate tracer in several tumor types [147,148,149]. This section elaborates on clinically available monoclonal antibodies which can be modified into tracers: Ontuxizumab targeting TEM1, Teprotumumab, Cixutumumab and Figitumumab targeting IGF-1R, and Olaratumab targeting PDGFRα [130,159,160,161,173,174,175,176]. APX005M targeting CD40 is currently under investigation and therefore its efficacy and safety profile in STS are yet to be determined. In contrast to therapy, a single dose of tracer is injected for imaging and an increase in adverse effects compared to therapy is not expected. Further, no increase in adverse effects is expected after conjugation of a fluorophore and antibody [136,177,178,179]. This paragraph summarizes the safety profiles of each clinically available monoclonal antibody extracted from advanced clinical trials conducted with STS-patients to evaluate their potential for translation towards NIRF imaging. Only high grade (grade ≥ 3) Adverse Events (AE) are displayed.
Ontuxizumab was compared to a placebo when both were combined with Gemcitabine and Docetaxel. While the total of grade ≥3 AEs was not reported, the incidence of Serious Adverse Events (SAE) was comparable between Ontuxizumab and placebo (50% vs. 48%). The most frequent treatment related SAEs were pyrexia (4% vs. 0%) and anemia (1% vs. 3%) (Appendix D). No substantial differences were observed in laboratory values or electrocardiogram parameters [130].
Targeting IGF-1R, Teprotumumab, Cixutumab, and Figitumumab were investigated as a monotherapy. These trials have reported a minor incidence of high-grade AEs. AEs such as hyperglycemia, pain, thrombocytopenia, and vomiting were the most common high-grade AEs with incidences ranging from 3–5%. Of all included study subjects, 10% and 17% of patients acquired grade ≥3 AEs for Teprotumumab and Figitumumab, respectively. Among these 3 antibodies, Teprotumumab was demonstrated to have the most tolerable and Cixutumumab the most toxic safety profile in STS [159,160,161].
Two studies on Olaratumab reported grade ≥3 Adverse Events (AE) in 58–67% of the patients when combined with Doxorubicin alone [174,180]. In addition, 2 studies observed contrasting AEs when Olaratumab plus Doxorubicin was compared to Doxorubicin. A phase 2 trial observed an increased incidence of high-grade AEs for the combination therapy while a phase 3 trial found no significant differences and therefore concluded no additional adverse events to be attributed to Olaratumab [179,180,181]. Hematologic grade ≥3 AEs were most common in these trials with incidences reaching 40–50% (Appendix D).
4. Discussion
4.1. Research Aim
The success of surgical treatment for localized STS highly depends on complete tumor resection as positive margins are associated with LR and decreased overall survival. Determining the surgical margin is a major challenge for STS surgeons as they generally try to balance the aim of a functional limb against the risk of LR. Real-time tumor-specific imaging can improve surgical margins by visualizing tumor tissue during resection. This review selected TEM1 (score 9), VEGFR-1 (score 8), EGFR (score 8), VEGFR-2 (score 7), IGF-1R (score 7), PDGFRα (score 7), and CD40 (score 7) as the most promising cell surface-expressed biomarkers for tumor-specific NIRF imaging in STS, for which clinically available monoclonal antibodies are already present. Additionally, these potential future NIRF tracers, which are antibodies that have already been clinically tested in STS but not yet conjugated to a NIRF-dye for imaging practices, are expected to be safe for their use in NIRF guided surgery.
4.2. Comparing the Selected Biomarkers
All the suitable biomarkers have already been evaluated for NIRF imaging pre-clinically, demonstrating their potential [25,29,30,77,82,84,93]. Furthermore, all the selected cell surface-expressed biomarkers internalize after binding with an antibody (derivative) [24,29,39,76,81,92,156]. This causes a better tumor-to-background ratio and a long-lasting signal important for fluorescence-guided surgery [19,20]. However, the indirect targeting of VEGFR-1 and VEGFR-2 by targeting VEGF-A with, for instance, Bevacizumab-IRDye800CW, has not been proven to result in internalization of tracers.
TEM1 and VEGFR-1 were most frequently present in STS samples, 77% and 76% respectively. VEGFR-2 was third most frequently expressed (71%), followed by PDGFRα (64%), IGF-1R (63%), CD40 (62%), and EGFR (53%). Furthermore, apart from CD40 (n = 153), presence of every biomarker of the top 7 has been studied in a large number of STS samples. Therefore, the summarized data in this review are a good representation of biomarker presence in STS patients: EGFR (n = 1918), PDGFRα (n = 1536), TEM1 (n = 768), IGF-1R (n = 507), VEGFR-1 (n = 477), and VEGFR-2 (n = 449).
A particularly important parameter for successful NIRF imaging, which is not included in the TASC score, is the tumor-to-background ratio of a biomarker. With the currently available literature it is impossible to address the expression of each biomarker in healthy tissue, and thus the tumor-to-background ratio, because data on the expression of the biomarkers in normal tissue is very limited. Nevertheless, VEGFR-1 and VEGFR-2 are highly expressed in healthy tissue, while TEM1 and PDGFRα are biomarkers with low expression in healthy tissue. TEM1 has already shown high tumor-to-background ratios with immunohistochemistry [27]. However, both biomarkers are expressed in inflammatory tissue as well as in tumors [28,182]. As STS can be surrounded by inflammation during their growth, it is possible that no clear distinction can be made between tumor and surrounding inflammatory tissue [183]. Unfortunately, none of the selected studies reported on inflammation status of surrounding tissue. In addition, neoadjuvant therapy is frequently used in STS treatment. Successful fluorescence guided surgery is only possible if the overexpression of cell surface-expressed biomarkers is preserved after neoadjuvant therapy. It was demonstrated that EGFR, TEM1, and PDGFRα expression is preserved after neoadjuvant radiotherapy of MFS [27]. This has also been confirmed for EGFR in SS [127]. No other data is available on the expression of these or the remaining evaluated biomarkers after neoadjuvant therapy in STS. Therefore, further research is needed to assess if surrounding inflammatory tissue or neoadjuvant therapy interferes with tumor border identification in STS.
4.3. MFS, USTS and SS
We chose to focus on MFS, USTS, and SS because of their aggressive and infiltrative growth pattern. TEM1 was present in 100% of the MFS samples (Table 3). Besides, its pattern of expression was diffuse in all tested MFS samples [27]. This indicates that TEM1 is likely to be extensively expressed in tumors of every individual MFS patient. Besides, a sharp contrast between tumor and adjacent normal tissue, such as fascia, muscle, and fat, was seen on microscopic pictures of stained MFS samples. This clearly identifies the tumor border and therefore TEM1 seems the most promising biomarker to facilitate complete MFS resections using NIRF imaging [27].
For USTS the average presence of TEM1 and PDGFRα was 81 and 79% of the tumor samples. Apart from being expressed in a substantial percentage of USTS samples, TEM1 and PDGFRα were primarily expressed diffusely [27,28,35,50,126]. However, there is no data published regarding contrast between expression on tumor and normal tissue in USTS. According to the human protein atlas TEM1 and PDGFRα expression is not detected in skeletal muscle tissue and adipose tissue. For smooth muscle tissue, TEM1 displays low expression, while PDGFRα is not detected [184,185]. These characteristics suggest that TEM1 and PDGFRα are promising biomarkers for NIRF imaging in USTS patients.
In SS, the presence of TEM1 and EGFR was demonstrated in 71% and 86% of the assessed samples, respectively. EGFR and TEM1 are both characterized by a variable expression pattern in SS [28,29,52,58,66,69,70,71]. Moreover, both targets are reported to be not or minimally expressed in the epithelial components of biphasic SS tumors, while it was expressed in the spindle cell components. This might complicate NIRF imaging of biphasic SS tumors when solely targeting either of these biomarkers. Interestingly, EGFR remains present on SS after neoadjuvant radiotherapy. This has not been researched for TEM1, therefore providing EGFR a further advantage over TEM1 [127].
Lastly, most biomarkers are not present in 100% of the evaluated STS (subtype) tumor samples. The disadvantage of not knowing expression in advance to surgery can be overcome by evaluating the expression of each biomarker in preoperative biopsies to assess which biomarker would be most appropriate to target for NIRF imaging during surgery.
4.4. Comparison of Potential NIRF Imaging Tracers
Several monoclonal antibodies targeting STS have already been adjusted to tracers suitable for NIRF imaging and additional monoclonal antibodies used in therapy may be applicable for future NIRF imaging in STS after conjugation to a fluorescent dye/fluorophore. Five distinct antibodies have been assessed for their toxicity profile in STS (Appendix D). Nevertheless, comparing the results of these drugs is complicated, since Olaratumab and Ontuxizumab have solely been investigated combined with chemotherapeutic agents. Still, no evident increase in high-grade toxicity was detected for either antibodies when compared to placebo suggesting a tolerable safety profile. These results are confirmed in trials investigating Olaratumab in metastatic gastrointestinal stromal tumor (GIST) and Ontuxizumab in metastatic colorectal cancer where respectively 10 and 11% grade of ≥3 treatment-related adverse events were reported [175,186]. These data are similar to the percentages of patients acquiring grade ≥3 AE after treatment with IGF-1R targeting antibodies (Teprotomumab, Figitumumab and Cixutumumab) and therefore all antibodies studied here can be safely modified into NIRF imaging tracers.
It should, however, be emphasized that data on toxicity in antibody-based therapy are presumably an overestimation for imaging, because doses of antibodies injected for NIRF imaging are substantially lower compared to therapeutic doses. For instance, a single dose of 10mg Bevacizumab-IRDye800CW was found to be optimal for NIRF imaging in STS, whereas therapeutic doses comprise of 5–15mg/kg Bevacizumab every 2–3 weeks [134,185,186]. Consequently, the serum concentration of the antibody (conjugated to a fluorophore) is lower when used for NIRF imaging and less toxicity of these monoclonal antibodies is expected [181]. Preferably, dose-finding studies, where single and low doses of the five evaluated compounds have been given to STS patients, should be reviewed to predict toxicity when used for NIRF imaging, yet such articles have not been published.
4.5. Strengths and Limitations
The first limitation is that the heterogeneity of the included studies complicates ranking of the biomarkers. Studies have used various antibodies for immunohistochemistry. The percentage of positive tumors may be variable depending on type of antibodies, dilutions, epitope, and clone used [187]. Also, immunohistochemistry protocols differ between labs which may cause variable results while the same type of antibodies is used. This creates discrepancy in immunohistochemical results published by different researchers. Secondly, the heterogeneity of STS complicates selecting the optimal biomarkers. There are over 50 subtypes of STS, and different subtypes have different biomarker expression patterns [71]. Therefore, finding one optimal biomarker for each subtype is challenging.
A strength of this study is our focus on MFS, USTS, and SS as they are STS subtypes which show an infiltrative growth pattern, and consequently have high percentages of positive margins and high percentages of LR. Patients with these subtypes might benefit the most from implementation of NIRF imaging. Nevertheless, published data regarding some biomarkers in MFS is scarce. Another strength is that clinically available monoclonal antibodies were the starting point of this systematic review. This was because primary development of a NIRF tumor-specific tracer for a rare disease such as STS is time consuming and costly which hampers rapid clinical implementation. However, alternative antigens that might be interesting for tumor-specific imaging in STS can be missed because no clinically available antibodies (or antibody derivatives) are available. Nevertheless, clinical implementation is of utmost importance to prove feasibility of NIRF imaging for STS surgery and subsequently stimulate primary development of STS specific tracers. This progression is enabled by this review as each evaluated biomarker is accompanied by a clinically available antibody (derivative) that can be transformed into a NIRF tracer.
5. Conclusions
In STS, TEM1, VEGFR-1, EGFR, VEGFR-2, IGF-1R, PDGFRα, and CD40 were identified in descending order as the most suitable biomarkers for NIRF imaging according to the modified TASC-scoring system. However, as the category of STS comprises an extensive and heterogenous group of tumors, it was chosen to specify the most optimal target for three common subtypes with infiltrative growth that are characterized by high rates of local recurrence: MFS, USTS and SS. While TEM1 was the optimal target for MFS, both TEM1 and PDGFRα were concluded to be most promising for USTS. In SS EGFR was considered most promising, yet closely followed by TEM1, VEGFR-1, and PDGFRα. However, as the expression of biomarkers and its extent is often not certain, an evaluation of the expression of biomarkers in preoperative biopsies could assist in designating the appropriate tracer for every patient. More importantly, for their potential use in NIRF imaging, data on contrast of expression on malignant and adjacent normal tissue is needed. Altogether, this systematic review paves the way for implementing fluorescence-guided surgery to optimize STS treatment.
Author Contributions
Conceptualization, Z.R., A.N.S., S.E.B., P.J.K.K., A.L.V., S.K., J.V.M.G.B., M.A.J.v.d.S., C.F.M.S. and P.B.A.A.v.D.; methodology, Z.R., A.N.S., C.F.M.S. and P.B.A.A.v.D.; software, Z.R.; validation, Z.R., A.N.S., C.F.M.S. and P.B.A.A.v.D.; formal analysis, not applicable; investigation, Z.R., A.N.S., S.E.B., C.F.M.S. and P.B.A.A.v.D.; resources, Z.R. and A.N.S.; data curation, Z.R. and A.N.S.; writing—original draft preparation, Z.R. and A.N.S.; writing—review and editing, Z.R., A.N.S., S.E.B., P.J.K.K., A.L.V., S.K., J.V.M.G.B., M.A.J.v.d.S., C.F.M.S. and P.B.A.A.v.D.; visualization, Z.R., A.N.S. and C.F.M.S.; supervision, M.A.J.v.d.S., C.F.M.S. and P.B.A.A.v.D.; project administration, Z.R. All authors have read and agreed to the published version of the manuscript.
Funding
This research received no external funding. CS was in part funded by the European Commission under two Marie Skłodowska-Curie Action awards: H2020-MSCA-RISE-2019 (Project number: 872860-PRISAR2) and H2020-MSCA-ITN-2019 (Project number: 857894-CAST).
Institutional Review Board Statement
Not applicable.
Informed Consent Statement
Not applicable.
Data Availability Statement
No new data were created or analyzed in this study. Data sharing is not applicable to this article.
Acknowledgments
The authors would like to acknowledge J.W.M. Plevier, MA (medical librarian, LUMC) for her assistance with the PubMed search.
Conflicts of Interest
The authors declare no conflict of interest.
Appendix A. Search Strategy
(“Sarcoma”[Mesh] OR “soft tissue sarcoma*”[tw]) AND (“Receptors, Vascular Endothelial Growth Factor”[Mesh] OR “VEGF”[tw] OR “vascular endothelial growth factor receptor”[tw] OR “EGFR”[tw] OR “epithelial growth factor receptor”[tw] OR “Endosialin”[tw] OR “TEM1”[tw] OR “CD248”[tw] OR “Receptors, Platelet-Derived Growth Factor”[Mesh] OR “Platelet-Derived Growth Factor Receptor*”[tw] OR “PDGFR”[tw] OR “programmed death ligand 1”[tw] OR “PD-L1”[tw] OR “Insulin-Like Growth Factor I”[Mesh] OR “Insulin-Like Growth Factor I”[tw] OR “IGF-1R”[tw] OR “TRAIL-R2”[tw] OR “CTLA-4 Antigen” [Mesh] OR “CTLA-4”[tw] OR “CD40 Antigens”[Mesh] OR “CD40”[tw] OR “Receptor Tyrosine Kinase-like Orphan Receptors”[Mesh] OR “Receptor Tyrosine Kinase-like Orphan Receptor*”[tw] OR “ROR2”[tw] OR “LRRC15”[tw]) NOT (“Animals” [Mesh] NOT “Humans”[Mesh])
Appendix B. Search Previously Imaged and Search Internalization
(“Spectroscopy, Near-Infrared”[Mesh] OR “Near-Infrared”[tw] OR “Near infrared”[tw] OR “NIR”[tw] OR “fluorescence”[MeSH] OR “fluorescence”[tw] OR “fluorescent”[tw] OR “imaging”[tw] OR “Positron Emission Tomography Computed Tomography”[tw] OR “PET-CT”[tw] OR “PET”[tw] OR “immune-pet”[tw] OR “tomography, emission-computed, single-photon”[MeSH] OR “spect”[tw] OR “radiolabelled”[tw] OR “radio-labelled”[tw) AND (“Receptors, Vascular Endothelial Growth Factor”[Mesh] OR “VEGF”[tw] OR “vascular endothelial growth factor receptor”[tw] OR “EGFR”[tw] OR “epithelial growth factor receptor”[tw] OR “Endosialin”[tw] OR “TEM1”[tw] OR “CD248”[tw] OR “Receptors, Platelet-Derived Growth Factor”[Mesh] OR “Platelet-Derived Growth Factor Receptor*”[tw] OR “PDGFR”[tw] OR “programmed death ligand 1”[tw] OR “PD-L1”[tw] OR “Insulin-Like Growth Factor I”[Mesh] OR “Insulin-Like Growth Factor I”[tw] OR “IGF-1R”[tw] OR “TRAIL-R2”[tw] OR “CTLA-4 Antigen” [Mesh] OR “CTLA-4”[tw] OR “CD40 Antigens”[Mesh] OR “CD40”[tw] OR “Receptor Tyrosine Kinase-like Orphan Receptors”[Mesh] OR “Receptor Tyrosine Kinase-like Orphan Receptor*”[tw] OR “ROR2”[tw] OR “LRRC15”[tw])
(“Internalization”[tw] OR “Internalize”[tw] OR “Internalisation”[tw] OR “Internalise”[tw] OR “Endocytosis”[Mesh] OR “Endocytosis”[tw] OR “Endocyte”[tw]) AND (“Receptors, Vascular Endothelial Growth Factor”[Mesh] OR “VEGF”[tw] OR “vascular endothelial growth factor receptor”[tw] OR “EGFR”[tw] OR “epithelial growth factor receptor”[tw] OR “Endosialin”[tw] OR “TEM1”[tw] OR “CD248”[tw] OR “Receptors, Platelet-Derived Growth Factor”[Mesh] OR “Platelet-Derived Growth Factor Receptor*”[tw] OR “PDGFR”[tw] OR “programmed death ligand 1”[tw] OR “PD-L1”[tw] OR “Insulin-Like Growth Factor I”[Mesh] OR “Insulin-Like Growth Factor I”[tw] OR “IGF-1R”[tw] OR “TRAIL-R2”[tw] OR “CTLA-4 Antigen” [Mesh] OR “CTLA-4”[tw] OR “CD40 Antigens”[Mesh] OR “CD40”[tw] OR “Receptor Tyrosine Kinase-like Orphan Receptors”[Mesh] OR “Receptor Tyrosine Kinase-like Orphan Receptor*”[tw] OR “ROR2”[tw] OR “LRRC15”[tw])
Appendix C. STS Subtypes Examined for Each of the Top 7 Biomarkers
Table A1.
Overview of the studied STS subtypes for each of the top 7 biomarkers.
Table A1.
Overview of the studied STS subtypes for each of the top 7 biomarkers.
| Biomarker | STS Subtypes |
|---|---|
| TEM1 | Angiosarcoma, desmoplastic small round cell, epithelioid haemangioendothelioma, epithelioid sarcoma, fibrosarcoma, inflammatory myofibroblastic sarcoma, kaposi sarcoma, LMS, liposarcoma, MPNST, malignant solitary fibrous tumor, myxofibrosarcoma, RMS, spindle cell sarcoma NOS, synovial sarcoma, USTS, and uterine sarcoma |
| VEGFR-1 | Alveolar STS, angiosarcoma, endometrial stromal sarcoma, Kaposi sarcoma, LMS, liposarcoma, MPNST, malignant solitary fibrous tumor, myxofibrosarcoma, myxoid liposarcoma, pulmonary artery sarcoma, RMS, sarcoma NOS, synovial sarcoma, and USTS |
| VEGFR-2 | Alveolar STS, angiosarcoma, endometrial stromal sarcoma, epithelioid hemangioendotheliomas, fibrosarcoma, LMS, liposarcoma, MPNST, malignant solitary fibrous tumor, myxofibrosarcoma, pulmonary artery sarcoma, RMS, sarcoma NOS, synovial sarcoma, and USTS |
| EGFR | Acral myxoinflammatory fibroblastic sarcoma, alveolar soft part sarcoma, atypical fibroxanthoma, desmoplastic tumor, endometrial stromal sarcoma, epithelioid sarcoma, fibromatosis, fibromyxoid sarcoma, fibrosarcoma, follicular dendritic cell sarcoma, intimal sarcoma, liposarcoma, LMS, MPNST, myofibroblastic sarcoma, myoxyoinflammatory fibroblastic sarcoma, myxofibrosarcoma, myxoid lipsarcoma, myxoid sarcoma, pleomorphic dermal sarcoma, RMS, sarcoma NOS, synovial sarcoma, endifferentiated endometrial sarcoma, USTS, and undifferentiated stromal sarcoma |
| IGF-1R | Alveolar STS, angiosarcoma, desmoplastic tumor, fibrosarcoma, LMS, liposarcoma, MPNST, mesenchyoma, myxofibrosarcoma, RMS, sarcoma NOS, spindle cell sarcoma, synovial sarcoma, and USTS |
| PDGFRα | Alveolar soft part sarcoma, Angiosarcoma, dermatofibrosarcoma protuberans, endometrial stromal sarcoma, fibromyxoid sarcoma, fibrosarcoma, liposarcoma, LMS, MPNST, myofibroblastic sarcoma, myoxyoinflammatory fibroblastic sarcoma, myxofibrosarcoma, myxoid liposarcoma, pulmonary artery sarcoma, RMS, sarcoma NOS, solitary fibrous tumor, synovial sarcoma, undifferentiated endometrial sarcoma, undifferentiated uterine sarcoma, undifferentiated stromal sarcoma, and USTS |
| CD40 | Kaposi sarcoma, liposarcoma, LMS, MPNST, RMS, and USTS |
Appendix D. Toxicity of Clinically Available Monoclonal Antibodies in Patients with STS
Table A2.
Overview of the Toxicity of Clinically Available Monoclonal Antibodies in STS Patients.
Table A2.
Overview of the Toxicity of Clinically Available Monoclonal Antibodies in STS Patients.
| Clinical Trial | Phase | Tumor Type | Evaluable for Toxicity | Median a,* Age (Years) | Treatment | Most Common Adverse Events | Percentage Patients with ≥3 Adverse Events (vs. Placebo) | Most Common Grade ≥ 3 Adverse Events |
|---|---|---|---|---|---|---|---|---|
| TEM1 (Ontuxizumab) | ||||||||
| Jones et al., 2019 | 2 | STS | 209 | 55 | Ontuxizumab 8mg/kg + G/D vs. placebo + G/D b | Fatigue (74% vs. 66%), anemia (61% vs. 60%), nausea (56% vs. 52%), diarrhea (44% vs. 36%), and peripheral edema (42% vs. 45%) | Not reported | Pyrexia (4% vs. 0%) and anemia (1% vs. 3%) c |
| IGF-1R (Teprotomumab, Figitumumab and Cixutumumab) | ||||||||
| Pappo et al., 2014 | 2 | STS + osteosarcoma | 163 | 31 | Teprotumumab 9 mg/kg; 1 dose per week | Fatigue (20.2%), nausea (14.1%), hyperglycemia (9.2%), and muscle spasms (8.6%) | 10.4% | Hyperglycemia (2.5%), dehydration (1.8%), fatigue (1.8%), and hyponatremia (1.2%) |
| Olmos et al., 2010 | 1 | STS + Ewing sarcoma + myxoid chondrosarcoma | 29 | 30 | Figitumumab 20 mg/kg; 1 dose per 3–4 weeks | Hyperglycemia (17%), skin reactions (rash, urticaria, infection, eczema) (13.8%), increased GGT (10.3%), headache (10.3%), and fatigue (10.3%) | 17.2% | Vomiting (3.4%), back pain (3.4%), DVT (3.4%), increased uric acid concentration (3.4%), and increased AST, ALT or GGT (3.4%) |
| Wagner et al., 2015 | 2 | STS + Ewing sarcoma + osteosarcoma | 44 | 14–181 | Cixutumumab 6 mg/kg and Temsirolimus 8 mg/m2; 1 dose per week | Mucositis, electrolyte disturbances and myelosuppression | Not reported | Neutropenia (13.6%), thrombocytopenia (11.4%), hypokalemia (11.4%), oral mucositis (9.1%), and hypophosphatemia (9.1%) |
| Schöffski et al., 2013 | 2 | STS + Ewing family of tumors | 113 | 27.5–33.1 | Cixutumumab 10 mg/kg; 1 dose per 2 weeks | Nausea (26.1%), fatigue (23.4%), diarrhea (22.5%), hyperglycemia (19.8%), and anorexia (17.1%) | Not reported | Hyperglycemia (5.4%), pain (5.4%), thrombocytopenia (4.5%), asthenia (4.5%), and anemia (3.6%) |
| Schwartz et al., 2013 | 2 | STS + sarcoma of bone | 174 | Mean: 48.1 | Cixutumumab 6 mg/kg and Temsirolimus 25 mg; 1 dose per week | Oral mucositis (71.3%), hypercalcemia (68.4%), fatigue (65.5%), thrombocytopenia (63.8%), and anemia (62.6%) | Not reported | Anemia (9%), hyperglycemia (10%), hypophosphatemia (9%), lymphopenia (14%), oral mucositis (11%), and thrombocytopenia (11%) |
| PDGFR (Olaratumab) | ||||||||
| Tap et al., 2020 | 3 | STS | 506 | Mean: 56.9 | Olaratumab 15 mg/kg + Doxorubicin 75 mg/m2 vs. Placebo + Doxorubicin 75 mg/m2 d | Nausea (59.5% vs. 66.7%), neutropenia (55.3% vs. 57.8%), fatigue (54.1% vs. 59%), alopecia (43.6% vs. 49.8%), and anemia (42.8% vs. 45.4%) | Not reported | Neutropenia (46.3% vs. 49%), leukopenia (23.3% vs. 23.7%), febrile neutropenia (17.5% vs. 16.5%), anemia (13.6% vs. 12.4%), and thrombocytopenia (9.3% vs. 8.4%) |
| Yonemori et al., 2018 | 1 | STS | 19 | 41.5–52 a | Olaratumab 15 mg/kg + Doxorubicin 25-75 mg/m2 e | ALT increased (52.6%), neutrophil count decreased (52.6%), WBC count decreased (47.4%), anemia (36.8%), and GGT increased (31.6%) | 57.9% | Decreased neutrophil count (42.1%), decreased WBC count (42.1%), increased ALT (15.8%), anemia (10.5%), and febrile neutropenia (10.5%) |
| Tap et al., 2016 | 2 | STS | 133 | 58.5 | Olaratumab 15 mg/kg + Doxorubicin 75 mg/m2 vs. Doxorubicin f | Nausea (73.4% vs. 52.3%), fatigue (68.8% vs. 69.2%), neutropenia (57.8% vs. 35.4%), mucositis (53.1% vs. 35.4%), and alopecia (51.6% vs. 40%) | 67% vs. 55% | Neutropenia (53.2% vs. 32.3%), leukopenia (36% vs. 16.9%), febrile neutropenia (12.5% vs. 13.8%), anemia (12.5% vs. 9.2%), and fatigue (9.4% vs. 3.1%) |
Note. Abbreviations: STS, soft tissue sarcoma; ALT, alanine aminotransferase; WBC, white blood cell; GGT, gamma-glutamyl transferase; DVT, deep venous thrombosis; AST, aspartate aminotransferase. * Unless reported differently as some articles published mean data instead of median. a These trials had several cohorts with each a separate median age. Reported in the table is the range of median ages. b Full treatment schedule was: Ontuxizumab 8mg/kg (day 1 and 8) of a 21-day cycle or a placebo with G/D (G/D; 900 mg/m2 gemcitabine (day 1 and 8) and 75 mg/m2 docetaxel (day 8)).c These are the serious adverse events instead of all grade ≥3 adverse events, as the latter was not reported. d Full treatment schedule was: Olaratumab 20 mg/kg in cycle 1 and 15 mg/kg in subsequent cycles or placebo (days 1 and 8) combined with Doxorubicin 75 mg/m2 (day 1) for up to 8 21-day cycles, followed by Olaratumab/placebo monotherapy. e Full treatment schedule was: Olaratumab 15 mg/kg (day 1 and 8) of each 21-day cycle until progressive disease (PD) or other discontinuation criteria were met. Patients in Cohort 3 received a 20 mg/kg loading dose of Olaratumab (Day 1 and 8) in Cycle 1. Doxorubicin was administered for up to 6 cycles (or a cumulative dose of 500 mg/m2, whichever came later) until PD or other discontinuation criteria were met. Patients in Cohort 1 received doxorubicin 25mg/m2 (day 1, 2, and 3) in each cycle, Cohorts 2 and 3 received doxorubicin 75 mg/m2 (day 1) in each cycle. f Full treatment schedule was: Olaratumab 15 mg/kg (day 1 and 8) combined with doxorubicin 75mg/m2 or doxorubicin alone 75 mg/m2 (day 1) of each 21-day cycle for up to eight cycles.
References
- Vos, M.; Blaauwgeers, H.G.T.; Ho, V.K.Y.; van Houdt, W.J.; van der Hage, J.A.; Been, L.B.; Bonenkamp, J.J.; Bemelmans, M.H.A.; van Dalen, T.; Haas, R.L.; et al. Increased survival of non low-grade and deep-seated soft tissue sarcoma after surgical management in high-volume hospitals: A nationwide study from the Netherlands. Eur. J. Cancer 2019, 110, 98–106. [Google Scholar] [CrossRef] [PubMed]
- ESMO/European Sarcoma Network Working Group. Soft tissue and visceral sarcomas: ESMO Clinical Practice Guidelines for diagnosis, treatment and follow-up. Ann. Oncol. 2014, 25 (Suppl. 3), iii102–iii112. [Google Scholar] [CrossRef]
- Stiller, C.A.; Trama, A.; Serraino, D.; Rossi, S.; Navarro, C.; Chirlaque, M.D.; Casali, P.G. Descriptive epidemiology of sarcomas in Europe: Report from the RARECARE project. Eur. J. Cancer 2013, 49, 684–695. [Google Scholar] [CrossRef] [PubMed]
- Lawrence, W., Jr.; Donegan, W.L.; Natarajan, N.; Mettlin, C.; Beart, R.; Winchester, D. Adult soft tissue sarcomas. A pattern of care survey of the American College of Surgeons. Ann. Surg. 1987, 205, 349–359. [Google Scholar] [CrossRef] [PubMed]
- WHO Classification of Tumours. Tissue and Bone Tumours: WHO Classification of Tumours, 5th ed.; IARC Publications: Lyon, France, 2020; Volume 3. [Google Scholar]
- Enneking, W.F.; Spanier, S.S.; Goodman, M.A. A system for the surgical staging of musculoskeletal sarcoma. Clin. Orthop. Relat. Res. 1980. [Google Scholar] [CrossRef]
- Pasquali, S.; Colombo, C.; Pizzamiglio, S.; Verderio, P.; Callegaro, D.; Stacchiotti, S.; Martin Broto, J.; Lopez-Pousa, A.; Ferrari, S.; Poveda, A.; et al. High-risk soft tissue sarcomas treated with perioperative chemotherapy: Improving prognostic classification in a randomised clinical trial. Eur. J. Cancer 2018, 93, 28–36. [Google Scholar] [CrossRef]
- Smolle, M.A.; Sande, M.V.; Callegaro, D.; Wunder, J.; Hayes, A.; Leitner, L.; Bergovec, M.; Tunn, P.U.; van Praag, V.; Fiocco, M.; et al. Individualizing Follow-Up Strategies in High-Grade Soft Tissue Sarcoma with Flexible Parametric Competing Risk Regression Models. Cancers 2019, 12, 47. [Google Scholar] [CrossRef]
- Willeumier, J.; Fiocco, M.; Nout, R.; Dijkstra, S.; Aston, W.; Pollock, R.; Hartgrink, H.; Bovee, J.; van de Sande, M. High-grade soft tissue sarcomas of the extremities: Surgical margins influence only local recurrence not overall survival. Int. Orthop. 2015, 39, 935–941. [Google Scholar] [CrossRef]
- Zagars, G.K.; Ballo, M.T.; Pisters, P.W.; Pollock, R.E.; Patel, S.R.; Benjamin, R.S.; Evans, H.L. Prognostic factors for patients with localized soft-tissue sarcoma treated with conservation surgery and radiation therapy: An analysis of 1225 patients. Cancer 2003, 97, 2530–2543. [Google Scholar] [CrossRef]
- Kandel, R.; Coakley, N.; Werier, J.; Engel, J.; Ghert, M.; Verma, S. Surgical margins and handling of soft-tissue sarcoma in extremities: A clinical practice guideline. Curr. Oncol. 2013, 20, e247–e254. [Google Scholar] [CrossRef]
- O’Sullivan, B.; Davis, A.M.; Turcotte, R.; Bell, R.; Catton, C.; Chabot, P.; Wunder, J.; Kandel, R.; Goddard, K.; Sadura, A.; et al. Preoperative versus postoperative radiotherapy in soft-tissue sarcoma of the limbs: A randomised trial. Lancet 2002, 359, 2235–2241. [Google Scholar] [CrossRef]
- Yoo, H.J.; Hong, S.H.; Kang, Y.; Choi, J.Y.; Moon, K.C.; Kim, H.S.; Han, I.; Yi, M.; Kang, H.S. MR imaging of myxofibrosarcoma and undifferentiated sarcoma with emphasis on tail sign; diagnostic and prognostic value. Eur. Radiol. 2014, 24, 1749–1757. [Google Scholar] [CrossRef] [PubMed]
- Bhangu, A.A.; Beard, J.A.S.; Grimer, R.J. Should Soft Tissue Sarcomas be Treated at a Specialist Centre? Sarcoma 2004, 8, 1–6. [Google Scholar] [CrossRef] [PubMed]
- Chen, S.; Huang, W.; Luo, P.; Cai, W.; Yang, L.; Sun, Z.; Zheng, B.; Yan, W.; Wang, C. Undifferentiated Pleomorphic Sarcoma: Long-Term Follow-Up from a Large Institution. Cancer Manag. Res. 2019, 11, 10001–10009. [Google Scholar] [CrossRef] [PubMed]
- Lewis, J.J.; Antonescu, C.R.; Leung, D.H.; Blumberg, D.; Healey, J.H.; Woodruff, J.M.; Brennan, M.F. Synovial sarcoma: A multivariate analysis of prognostic factors in 112 patients with primary localized tumors of the extremity. J. Clin. Oncol. 2000, 18, 2087–2094. [Google Scholar] [CrossRef] [PubMed]
- Look Hong, N.J.; Hornicek, F.J.; Raskin, K.A.; Yoon, S.S.; Szymonifka, J.; Yeap, B.; Chen, Y.L.; DeLaney, T.F.; Nielsen, G.P.; Mullen, J.T. Prognostic factors and outcomes of patients with myxofibrosarcoma. Ann. Surg. Oncol. 2013, 20, 80–86. [Google Scholar] [CrossRef]
- Odei, B.; Rwigema, J.C.; Eilber, F.R.; Eilber, F.C.; Selch, M.; Singh, A.; Chmielowski, B.; Nelson, S.D.; Wang, P.C.; Steinberg, M.; et al. Predictors of Local Recurrence in Patients With Myxofibrosarcoma. Am. J. Clin. Oncol. 2018, 41, 827–831. [Google Scholar] [CrossRef]
- Hernot, S.; van Manen, L.; Debie, P.; Mieog, J.S.D.; Vahrmeijer, A.L. Latest developments in molecular tracers for fluorescence image-guided cancer surgery. Lancet. Oncol. 2019, 20, e354–e367. [Google Scholar] [CrossRef]
- Keereweer, S.; Van Driel, P.B.; Snoeks, T.J.; Kerrebijn, J.D.; Baatenburg de Jong, R.J.; Vahrmeijer, A.L.; Sterenborg, H.J.; Lowik, C.W. Optical image-guided cancer surgery: Challenges and limitations. Clin. Cancer Res. 2013, 19, 3745–3754. [Google Scholar] [CrossRef]
- Barth, C.W.; Gibbs, S.L. Fluorescence Image-Guided Surgery—A Perspective on Contrast Agent Development. Proc. Spie. Int. Soc. Opt. Eng. 2020, 11222. [Google Scholar] [CrossRef]
- Karaman, S.; Leppanen, V.M.; Alitalo, K. Vascular endothelial growth factor signaling in development and disease. Development 2018, 145. [Google Scholar] [CrossRef] [PubMed]
- Moher, D.; Liberati, A.; Tetzlaff, J.; Altman, D.G. Preferred reporting items for systematic reviews and meta-analyses: The PRISMA statement. PLoS Med. 2009, 6, e1000097. [Google Scholar] [CrossRef] [PubMed]
- Bosma, S.E.; van Driel, P.B.; Hogendoorn, P.C.; Dijkstra, P.S.; Sier, C.F. Introducing fluorescence guided surgery into orthopedic oncology: A systematic review of candidate protein targets for Ewing sarcoma. J. Surg. Oncol. 2018, 118, 906–914. [Google Scholar] [CrossRef] [PubMed]
- Lange, S.E.; Zheleznyak, A.; Studer, M.; O’Shannessy, D.J.; Lapi, S.E.; Van Tine, B.A. Development of 89Zr-Ontuxizumab for in vivo TEM-1/endosialin PET applications. Oncotarget 2016, 7, 13082–13092. [Google Scholar] [CrossRef]
- Guo, Y.; Hu, J.; Wang, Y.; Peng, X.; Min, J.; Wang, J.; Matthaiou, E.; Cheng, Y.; Sun, K.; Tong, X.; et al. Tumour endothelial marker 1/endosialin-mediated targeting of human sarcoma. Eur. J. Cancer 2018, 90, 111–121. [Google Scholar] [CrossRef]
- De Gooyer, J.M.; Versleijen-Jonkers, Y.M.H.; Hillebrandt-Roeffen, M.H.S.; Frielink, C.; Desar, I.M.E.; de Wilt, J.H.W.; Flucke, U.; Rijpkema, M. Immunohistochemical selection of biomarkers for tumor-targeted image-guided surgery of myxofibrosarcoma. Sci. Rep. 2020, 10, 2915. [Google Scholar] [CrossRef]
- Rouleau, C.; Curiel, M.; Weber, W.; Smale, R.; Kurtzberg, L.; Mascarello, J.; Berger, C.; Wallar, G.; Bagley, R.; Honma, N.; et al. Endosialin protein expression and therapeutic target potential in human solid tumors: Sarcoma versus carcinoma. Clin. Cancer Res. 2008, 14, 7223–7236. [Google Scholar] [CrossRef]
- Thway, K.; Robertson, D.; Jones, R.L.; Selfe, J.; Shipley, J.; Fisher, C.; Isacke, C.M. Endosialin expression in soft tissue sarcoma as a potential marker of undifferentiated mesenchymal cells. Br. J. Cancer 2016, 115, 473–479. [Google Scholar] [CrossRef]
- Zhang, J.; Razavian, M.; Tavakoli, S.; Nie, L.; Tellides, G.; Backer, J.M.; Backer, M.V.; Bender, J.R.; Sadeghi, M.M. Molecular imaging of vascular endothelial growth factor receptors in graft arteriosclerosis. Arter. Thromb. Vasc. Biol. 2012, 32, 1849–1855. [Google Scholar] [CrossRef]
- Saban, M.R.; Backer, J.M.; Backer, M.V.; Maier, J.; Fowler, B.; Davis, C.A.; Simpson, C.; Wu, X.R.; Birder, L.; Freeman, M.R.; et al. VEGF receptors and neuropilins are expressed in the urothelial and neuronal cells in normal mouse urinary bladder and are upregulated in inflammation. Am. J. Physiol. Ren. Physiol. 2008, 295, F60–F72. [Google Scholar] [CrossRef]
- Andersson, M.K.; Goransson, M.; Olofsson, A.; Andersson, C.; Aman, P. Nuclear expression of FLT1 and its ligand PGF in FUS-DDIT3 carrying myxoid liposarcomas suggests the existence of an intracrine signaling loop. BMC Cancer 2010, 10, 249. [Google Scholar] [CrossRef] [PubMed]
- Arita, S.; Kikkawa, F.; Kajiyama, H.; Shibata, K.; Kawai, M.; Mizuno, K.; Nagasaka, T.; Ino, K.; Nomura, S. Prognostic importance of vascular endothelial growth factor and its receptors in the uterine sarcoma. Int. J. Gynecol. Cancer Off. J. Int. Gynecol. Cancer Soc. 2005, 15, 329–336. [Google Scholar] [CrossRef]
- Gaumann, A.; Strubel, G.; Bode-Lesniewska, B.; Schmidtmann, I.; Kriegsmann, J.; Kirkpatrick, C.J. The role of tumor vascularisation in benign and malignant cardiovascular neoplasms: A comparison of cardiac myxoma and sarcomas of the pulmonary artery. Oncol. Rep. 2008, 20, 309–318. [Google Scholar] [CrossRef] [PubMed]
- Itakura, E.; Yamamoto, H.; Oda, Y.; Tsuneyoshi, M. Detection and characterization of vascular endothelial growth factors and their receptors in a series of angiosarcomas. J. Surg. Oncol. 2008, 97, 74–81. [Google Scholar] [CrossRef]
- Kampmann, E.; Altendorf-Hofmann, A.; Gibis, S.; Lindner, L.H.; Issels, R.; Kirchner, T.; Knosel, T. VEGFR2 predicts decreased patients survival in soft tissue sarcomas. Pathol. Res. Pract. 2015, 211, 726–730. [Google Scholar] [CrossRef]
- Lee, Y.J.; Chung, J.G.; Chien, Y.T.; Lin, S.S.; Hsu, F.T. Suppression of ERK/NF-κB Activation Is Associated With Amentoflavone-Inhibited Osteosarcoma Progression In Vivo. Anticancer Res. 2019, 39, 3669–3675. [Google Scholar] [CrossRef]
- Yonemori, K.; Tsuta, K.; Ando, M.; Hirakawa, A.; Hatanaka, Y.; Matsuno, Y.; Chuman, H.; Yamazaki, N.; Fujiwara, Y.; Hasegawa, T. Contrasting prognostic implications of platelet-derived growth factor receptor-beta and vascular endothelial growth factor receptor-2 in patients with angiosarcoma. Ann. Surg. Oncol. 2011, 18, 2841–2850. [Google Scholar] [CrossRef]
- Young, R.J.; Woll, P.J.; Staton, C.A.; Reed, M.W.; Brown, N.J. Vascular-targeted agents for the treatment of angiosarcoma. Cancer Chemother. Pharmacol. 2014, 73, 259–270. [Google Scholar] [CrossRef]
- Harding, J.; Burtness, B. Cetuximab: An epidermal growth factor receptor chemeric human-murine monoclonal antibody. Drugs Today 2005, 41, 107–127. [Google Scholar] [CrossRef]
- Samkoe, K.S.; Sardar, H.S.; Bates, B.D.; Tselepidakis, N.N.; Gunn, J.R.; Hoffer-Hawlik, K.A.; Feldwisch, J.; Pogue, B.W.; Paulsen, K.D.; Henderson, E.R. Preclinical imaging of epidermal growth factor receptor with ABY-029 in soft-tissue sarcoma for fluorescence-guided surgery and tumor detection. J. Surg. Oncol. 2019, 119, 1077–1086. [Google Scholar] [CrossRef]
- Anderson, S.E.; Nonaka, D.; Chuai, S.; Olshen, A.B.; Chi, D.; Sabbatini, P.; Soslow, R.A. p53, epidermal growth factor, and platelet-derived growth factor in uterine leiomyosarcoma and leiomyomas. Int. J. Gynecol. Cancer Off. J. Int. Gynecol. Cancer Soc. 2006, 16, 849–853. [Google Scholar] [CrossRef] [PubMed]
- Armistead, P.M.; Salganick, J.; Roh, J.S.; Steinert, D.M.; Patel, S.; Munsell, M.; El-Naggar, A.K.; Benjamin, R.S.; Zhang, W.; Trent, J.C. Expression of receptor tyrosine kinases and apoptotic molecules in rhabdomyosarcoma: Correlation with overall survival in 105 patients. Cancer 2007, 110, 2293–2303. [Google Scholar] [CrossRef] [PubMed]
- Baek, M.H.; Park, J.Y.; Rhim, C.C.; Kim, J.H.; Park, Y.; Kim, K.R.; Nam, J.H. Investigation of New Therapeutic Targets in Undifferentiated Endometrial Sarcoma. Gynecol. Obstet. Investig. 2017, 82, 329–339. [Google Scholar] [CrossRef] [PubMed]
- Cheng, X.; Yang, G.; Schmeler, K.M.; Coleman, R.L.; Tu, X.; Liu, J.; Kavanagh, J.J. Recurrence patterns and prognosis of endometrial stromal sarcoma and the potential of tyrosine kinase-inhibiting therapy. Gynecol. Oncol. 2011, 121, 323–327. [Google Scholar] [CrossRef] [PubMed]
- Cossu-Rocca, P.; Contini, M.; Uras, M.G.; Muroni, M.R.; Pili, F.; Carru, C.; Bosincu, L.; Massarelli, G.; Nogales, F.F.; De Miglio, M.R. Tyrosine kinase receptor status in endometrial stromal sarcoma: An immunohistochemical and genetic-molecular analysis. Int. J. Gynecol. Pathol. 2012, 31, 570–579. [Google Scholar] [CrossRef]
- Cuppens, T.; Annibali, D.; Coosemans, A.; Trovik, J.; Ter Haar, N.; Colas, E.; Garcia-Jimenez, A.; Van de Vijver, K.; Kruitwagen, R.P.; Brinkhuis, M.; et al. Potential Targets’ Analysis Reveals Dual PI3K/mTOR Pathway Inhibition as a Promising Therapeutic Strategy for Uterine Leiomyosarcomas-an ENITEC Group Initiative. Clin. Cancer. Res. 2017, 23, 1274–1285. [Google Scholar] [CrossRef]
- Hoffman, A.; Ghadimi, M.P.; Demicco, E.G.; Creighton, C.J.; Torres, K.; Colombo, C.; Peng, T.; Lusby, K.; Ingram, D.; Hornick, J.L.; et al. Localized and metastatic myxoid/round cell liposarcoma: Clinical and molecular observations. Cancer 2013, 119, 1868–1877. [Google Scholar] [CrossRef]
- Iwasaki, S.; Sudo, T.; Miwa, M.; Ukita, M.; Morimoto, A.; Tamada, M.; Ueno, S.; Wakahashi, S.; Yamaguchi, S.; Fujiwara, K.; et al. Endometrial stromal sarcoma: Clinicopathological and immunophenotypic study of 16 cases. Arch. Gynecol. Obs. 2013, 288, 385–391. [Google Scholar] [CrossRef]
- Park, J.Y.; Kim, K.R.; Nam, J.H. Immunohistochemical analysis for therapeutic targets and prognostic markers in low-grade endometrial stromal sarcoma. Int. J. Gynecol. Cancer Off. J. Int. Gynecol. Cancer Soc. 2013, 23, 81–89. [Google Scholar] [CrossRef]
- Ruping, K.; Altendorf-Hofmann, A.; Chen, Y.; Kampmann, E.; Gibis, S.; Lindner, L.; Katenkamp, D.; Petersen, I.; Knosel, T. High IGF2 and FGFR3 are associated with tumour progression in undifferentiated pleomorphic sarcomas, but EGFR and FGFR3 mutations are a rare event. J. Cancer Res. Clin. Oncol 2014, 140, 1315–1322. [Google Scholar] [CrossRef]
- Barbashina, V.; Benevenia, J.; Aviv, H.; Tsai, J.; Patterson, F.; Aisner, S.; Cohen, S.; Fernandes, H.; Skurnick, J.; Hameed, M. Oncoproteins and proliferation markers in synovial sarcomas: A clinicopathologic study of 19 cases. J. Cancer Res. Clin. Oncol. 2002, 128, 610–616. [Google Scholar] [CrossRef] [PubMed]
- Cascio, M.J.; O’Donnell, R.J.; Horvai, A.E. Epithelioid sarcoma expresses epidermal growth factor receptor but gene amplification and kinase domain mutations are rare. Mod. Pathol. 2010, 23, 574–580. [Google Scholar] [CrossRef] [PubMed]
- Cates, J.M.; Memoli, V.A.; Gonzalez, R.S. Cell cycle and apoptosis regulatory proteins, proliferative markers, cell signaling molecules, CD209, and decorin immunoreactivity in low-grade myxofibrosarcoma and myxoma. Virchows Arch. 2015, 467, 211–216. [Google Scholar] [CrossRef] [PubMed]
- Dewaele, B.; Floris, G.; Finalet-Ferreiro, J.; Fletcher, C.D.; Coindre, J.M.; Guillou, L.; Hogendoorn, P.C.; Wozniak, A.; Vanspauwen, V.; Schoffski, P.; et al. Coactivated platelet-derived growth factor receptor {alpha} and epidermal growth factor receptor are potential therapeutic targets in intimal sarcoma. Cancer Res. 2010, 70, 7304–7314. [Google Scholar] [CrossRef]
- Ganti, R.; Skapek, S.X.; Zhang, J.; Fuller, C.E.; Wu, J.; Billups, C.A.; Breitfeld, P.P.; Dalton, J.D.; Meyer, W.H.; Khoury, J.D. Expression and genomic status of EGFR and ErbB-2 in alveolar and embryonal rhabdomyosarcoma. Mod. Pathol. 2006, 19, 1213–1220. [Google Scholar] [CrossRef]
- Garcia, C.; Kubat, J.S.; Fulton, R.S.; Anthony, A.T.; Combs, M.; Powell, C.B.; Littell, R.D. Clinical outcomes and prognostic markers in uterine leiomyosarcoma: A population-based cohort. Int. J. Gynecol. Cancer Off. J. Int. Gynecol. Cancer Soc. 2015, 25, 622–628. [Google Scholar] [CrossRef]
- Gusterson, B.; Cowley, G.; McIlhinney, J.; Ozanne, B.; Fisher, C.; Reeves, B. Evidence for increased epidermal growth factor receptors in human sarcomas. Int. J. Cancer 1985, 36, 689–693. [Google Scholar] [CrossRef]
- Helbig, D.; Ihle, M.A.; Putz, K.; Tantcheva-Poor, I.; Mauch, C.; Buttner, R.; Quaas, A. Oncogene and therapeutic target analyses in atypical fibroxanthomas and pleomorphic dermal sarcomas. Oncotarget 2016, 7, 21763–21774. [Google Scholar] [CrossRef]
- Kovarik, C.L.; Barrett, T.; Auerbach, A.; Cassarino, D.S. Acral myxoinflammatory fibroblastic sarcoma: Case series and immunohistochemical analysis. J. Cutan. Pathol. 2008, 35, 192–196. [Google Scholar] [CrossRef]
- Leibl, S.; Moinfar, F. Mammary NOS-type sarcoma with CD10 expression: A rare entity with features of myoepithelial differentiation. Am. J. Surg. Pathol. 2006, 30, 450–456. [Google Scholar] [CrossRef]
- Moinfar, F.; Gogg-Kamerer, M.; Sommersacher, A.; Regitnig, P.; Man, Y.G.; Zatloukal, K.; Denk, H.; Tavassoli, F.A. Endometrial stromal sarcomas frequently express epidermal growth factor receptor (EGFR, HER-1): Potential basis for a new therapeutic approach. Am. J. Surg. Pathol. 2005, 29, 485–489. [Google Scholar] [CrossRef] [PubMed]
- Asmane, I.; Watkin, E.; Alberti, L.; Duc, A.; Marec-Berard, P.; Ray-Coquard, I.; Cassier, P.; Decouvelaere, A.V.; Ranchere, D.; Kurtz, J.E.; et al. Insulin-like growth factor type 1 receptor (IGF-1R) exclusive nuclear staining: A predictive biomarker for IGF-1R monoclonal antibody (Ab) therapy in sarcomas. Eur. J. Cancer 2012, 48, 3027–3035. [Google Scholar] [CrossRef] [PubMed]
- Conti, A.; Espina, V.; Chiechi, A.; Magagnoli, G.; Novello, C.; Pazzaglia, L.; Quattrini, I.; Picci, P.; Liotta, L.A.; Benassi, M.S. Mapping protein signal pathway interaction in sarcoma bone metastasis: Linkage between rank, metalloproteinases turnover and growth factor signaling pathways. Clin. Exp. Metastasis 2014, 31, 15–24. [Google Scholar] [CrossRef] [PubMed]
- Lazar, A.J.; Lahat, G.; Myers, S.E.; Smith, K.D.; Zou, C.; Wang, W.L.; Lopez-Terrada, D.; Lev, D. Validation of potential therapeutic targets in alveolar soft part sarcoma: An immunohistochemical study utilizing tissue microarray. Histopathology 2009, 55, 750–755. [Google Scholar] [CrossRef] [PubMed]
- Sato, O.; Wada, T.; Kawai, A.; Yamaguchi, U.; Makimoto, A.; Kokai, Y.; Yamashita, T.; Chuman, H.; Beppu, Y.; Tani, Y.; et al. Expression of epidermal growth factor receptor, ERBB2 and KIT in adult soft tissue sarcomas: A clinicopathologic study of 281 cases. Cancer 2005, 103, 1881–1890. [Google Scholar] [CrossRef]
- Sun, X.; Chang, K.C.; Abruzzo, L.V.; Lai, R.; Younes, A.; Jones, D. Epidermal growth factor receptor expression in follicular dendritic cells: A shared feature of follicular dendritic cell sarcoma and Castleman’s disease. Hum. Pathol. 2003, 34, 835–840. [Google Scholar] [CrossRef]
- Tamborini, E.; Casieri, P.; Miselli, F.; Orsenigo, M.; Negri, T.; Piacenza, C.; Stacchiotti, S.; Gronchi, A.; Pastorino, U.; Pierotti, M.A.; et al. Analysis of potential receptor tyrosine kinase targets in intimal and mural sarcomas. J. Pathol. 2007, 212, 227–235. [Google Scholar] [CrossRef]
- Tawbi, H.; Thomas, D.; Lucas, D.R.; Biermann, J.S.; Schuetze, S.M.; Hart, A.L.; Chugh, R.; Baker, L.H. Epidermal growth factor receptor expression and mutational analysis in synovial sarcomas and malignant peripheral nerve sheath tumors. Oncologist 2008, 13, 459–466. [Google Scholar] [CrossRef]
- Teng, H.W.; Wang, H.W.; Chen, W.M.; Chao, T.C.; Hsieh, Y.Y.; Hsih, C.H.; Tzeng, C.H.; Chen, P.C.; Yen, C.C. Prevalence and prognostic influence of genomic changes of EGFR pathway markers in synovial sarcoma. J. Surg. Oncol. 2011, 103, 773–781. [Google Scholar] [CrossRef]
- Vesely, K.; Jurajda, M.; Nenutil, R.; Vesela, M. Expression of p53, cyclin D1 and EGFR correlates with histological grade of adult soft tissue sarcomas: A study on tissue microarrays. Neoplasma 2009, 56, 239–244. [Google Scholar] [CrossRef]
- Xie, X.; Ghadimi, M.P.; Young, E.D.; Belousov, R.; Zhu, Q.S.; Liu, J.; Lopez, G.; Colombo, C.; Peng, T.; Reynoso, D.; et al. Combining EGFR and mTOR blockade for the treatment of epithelioid sarcoma. Clin. Cancer Res. 2011, 17, 5901–5912. [Google Scholar] [CrossRef] [PubMed]
- Yang, J.L.; Gupta, R.D.; Goldstein, D.; Crowe, P.J. Significance of Phosphorylated Epidermal Growth Factor Receptor and Its Signal Transducers in Human Soft Tissue Sarcoma. Int. J. Mol. Sci. 2017, 18, 1159. [Google Scholar] [CrossRef] [PubMed]
- Yang, J.L.; Hannan, M.T.; Russell, P.J.; Crowe, P.J. Expression of HER1/EGFR protein in human soft tissue sarcomas. Eur. J. Surg. Oncol. 2006, 32, 466–468. [Google Scholar] [CrossRef] [PubMed]
- Alves, P.M.; de Arruda, J.A.A.; Arantes, D.A.C.; Costa, S.F.S.; Souza, L.L.; Pontes, H.A.R.; Fonseca, F.P.; Mesquita, R.A.; Nonaka, C.F.W.; Mendonça, E.F.; et al. Evaluation of tumor-infiltrating lymphocytes in osteosarcomas of the jaws: A multicenter study. Virchows Arch. 2019, 474, 201–207. [Google Scholar] [CrossRef] [PubMed]
- Capobianco, G.; Pili, F.; Contini, M.; De Miglio, M.R.; Marras, V.; Santeufemia, D.A.; Cherchi, C.; Dessole, M.; Cherchi, P.L.; Cossu-Rocca, P. Analysis of epidermal growth factor receptor (EGFR) status in endometrial stromal sarcoma. Eur. J. Gynaecol. Oncol. 2012, 33, 629–632. [Google Scholar]
- Backer, M.V.; Levashova, Z.; Patel, V.; Jehning, B.T.; Claffey, K.; Blankenberg, F.G.; Backer, J.M. Molecular imaging of VEGF receptors in angiogenic vasculature with single-chain VEGF-based probes. Nat. Med. 2007, 13, 504–509. [Google Scholar] [CrossRef]
- Winkler, A.M.; Rice, P.F.; Weichsel, J.; Watson, J.M.; Backer, M.V.; Backer, J.M.; Barton, J.K. In vivo, dual-modality OCT/LIF imaging using a novel VEGF receptor-targeted NIR fluorescent probe in the AOM-treated mouse model. Mol. Imaging Biol. 2011, 13, 1173–1182. [Google Scholar] [CrossRef]
- Liu, L.; Kakiuchi-Kiyota, S.; Arnold, L.L.; Johansson, S.L.; Wert, D.; Cohen, S.M. Pathogenesis of human hemangiosarcomas and hemangiomas. Hum. Pathol. 2013, 44, 2302–2311. [Google Scholar] [CrossRef]
- Pakos, E.E.; Goussia, A.C.; Tsekeris, P.G.; Papachristou, D.J.; Stefanou, D.; Agnantis, N.J. Expression of vascular endothelial growth factor and its receptor, KDR/Flk-1, in soft tissue sarcomas. Anticancer Res. 2005, 25, 3591–3596. [Google Scholar]
- Stacher, E.; Gruber-Mosenbacher, U.; Halbwedl, I.; Dei Tos, A.P.; Cavazza, A.; Papotti, M.; Carvalho, L.; Huber, M.; Ermert, L.; Popper, H.H. The VEGF-system in primary pulmonary angiosarcomas and haemangioendotheliomas: New potential therapeutic targets? Lung Cancer 2009, 65, 49–55. [Google Scholar] [CrossRef]
- Ho, A.L.; Vasudeva, S.D.; Lae, M.; Saito, T.; Barbashina, V.; Antonescu, C.R.; Ladanyi, M.; Schwartz, G.K. PDGF receptor alpha is an alternative mediator of rapamycin-induced Akt activation: Implications for combination targeted therapy of synovial sarcoma. Cancer Res. 2012, 72, 4515–4525. [Google Scholar] [CrossRef] [PubMed]
- Zhou, H.; Qian, W.; Uckun, F.M.; Zhou, Z.; Wang, L.; Wang, A.; Mao, H.; Yang, L. IGF-1 receptor targeted nanoparticles for image-guided therapy of stroma-rich and drug resistant human cancer. Proc. SPIE Int. Soc. Opt. Eng. 2016, 9836. [Google Scholar] [CrossRef]
- Moroncini, G.; Maccaroni, E.; Fiordoliva, I.; Pellei, C.; Gabrielli, A.; Berardi, R. Developments in the management of advanced soft-tissue sarcoma—Olaratumab in context. Onco. Targets 2018, 11, 833–842. [Google Scholar] [CrossRef] [PubMed]
- Camorani, S.; Hill, B.S.; Collina, F.; Gargiulo, S.; Napolitano, M.; Cantile, M.; Di Bonito, M.; Botti, G.; Fedele, M.; Zannetti, A.; et al. Targeted imaging and inhibition of triple-negative breast cancer metastases by a PDGFRbeta aptamer. Theranostics 2018, 8, 5178–5199. [Google Scholar] [CrossRef]
- Adams, S.F.; Hickson, J.A.; Hutto, J.Y.; Montag, A.G.; Lengyel, E.; Yamada, S.D. PDGFR-alpha as a potential therapeutic target in uterine sarcomas. Gynecol. Oncol. 2007, 104, 524–528. [Google Scholar] [CrossRef]
- Liegl, B.; Gully, C.; Reich, O.; Nogales, F.F.; Beham, A.; Regauer, S. Expression of platelet-derived growth factor receptor in low-grade endometrial stromal sarcomas in the absence of activating mutations. Histopathology 2007, 50, 448–452. [Google Scholar] [CrossRef]
- Rossi, G.; Valli, R.; Bertolini, F.; Marchioni, A.; Cavazza, A.; Mucciarini, C.; Migaldi, M.; Federico, M.; Trentini, G.P.; Sgambato, A. PDGFR expression in differential diagnosis between KIT-negative gastrointestinal stromal tumours and other primary soft-tissue tumours of the gastrointestinal tract. Histopathology 2005, 46, 522–531. [Google Scholar] [CrossRef]
- Fleuren, E.D.G.; Vlenterie, M.; van der Graaf, W.T.A.; Hillebrandt-Roeffen, M.H.S.; Blackburn, J.; Ma, X.; Chan, H.; Magias, M.C.; van Erp, A.; van Houdt, L.; et al. Phosphoproteomic Profiling Reveals ALK and MET as Novel Actionable Targets across Synovial Sarcoma Subtypes. Cancer Res. 2017, 77, 4279–4292. [Google Scholar] [CrossRef]
- Roland, C.L.; May, C.D.; Watson, K.L.; Al Sannaa, G.A.; Dineen, S.P.; Feig, R.; Landers, S.; Ingram, D.R.; Wang, W.L.; Guadagnolo, B.A.; et al. Analysis of Clinical and Molecular Factors Impacting Oncologic Outcomes in Undifferentiated Pleomorphic Sarcoma. Ann. Surg. Oncol. 2016, 23, 2220–2228. [Google Scholar] [CrossRef]
- Hiraki-Hotokebuchi, Y.; Yamada, Y.; Kohashi, K.; Yamamoto, H.; Endo, M.; Setsu, N.; Yuki, K.; Ito, T.; Iwamoto, Y.; Furue, M.; et al. Alteration of PDGFRbeta-Akt-mTOR pathway signaling in fibrosarcomatous transformation of dermatofibrosarcoma protuberans. Hum. Pathol. 2017, 67, 60–68. [Google Scholar] [CrossRef]
- Lopez-Guerrero, J.A.; Navarro, S.; Noguera, R.; Carda, C.; Farinas, S.C.; Pellin, A.; Llombart-Bosch, A. Mutational analysis of the c-KIT AND PDGFRalpha in a series of molecularly well-characterized synovial sarcomas. Diagn. Mol. Pathol. Am. J. Surg. Pathol. Part B 2005, 14, 134–139. [Google Scholar] [CrossRef] [PubMed]
- Sieber, T.; Schoeler, D.; Ringel, F.; Pascu, M.; Schriever, F. Selective internalization of monoclonal antibodies by B-cell chronic lymphocytic leukaemia cells. Br. J. Haematol. 2003, 121, 458–461. [Google Scholar] [CrossRef]
- Klohs, J.; Grafe, M.; Graf, K.; Steinbrink, J.; Dietrich, T.; Stibenz, D.; Bahmani, P.; Kronenberg, G.; Harms, C.; Endres, M.; et al. In vivo imaging of the inflammatory receptor CD40 after cerebral ischemia using a fluorescent antibody. Stroke 2008, 39, 2845–2852. [Google Scholar] [CrossRef] [PubMed]
- Kennedy, M.M.; Biddolph, S.; Lucas, S.B.; Howells, D.D.; Picton, S.; McGee, J.O.; O’Leary, J.J. CD40 upregulation is independent of HHV-8 in the pathogenesis of Kaposi’s sarcoma. Mol. Pathol. 1999, 52, 32–36. [Google Scholar] [CrossRef] [PubMed]
- Mechtersheimer, G.; Barth, T.; Ludwig, R.; Staudter, M.; Moller, P. Differential expression of leukocyte differentiation antigens in small round blue cell sarcomas. Cancer 1993, 71, 237–248. [Google Scholar] [CrossRef]
- Ottaiano, A.; De Chiara, A.; Perrone, F.; Botti, G.; Fazioli, F.; De Rosa, V.; Mozzillo, N.; Ravo, V.; Morrica, B.; Gallo, C.; et al. Prognostic value of CD40 in adult soft tissue sarcomas. Clin. Cancer Res. 2004, 10, 2824–2831. [Google Scholar] [CrossRef] [PubMed]
- Pammer, J.; Plettenberg, A.; Weninger, W.; Diller, B.; Mildner, M.; Uthman, A.; Issing, W.; Sturzl, M.; Tschachler, E. CD40 antigen is expressed by endothelial cells and tumor cells in Kaposi’s sarcoma. Am. J. Pathol. 1996, 148, 1387–1396. [Google Scholar]
- Kalim, M.; Wang, S.; Liang, K.; Khan, M.S.I.; Zhan, J. Engineered scPDL1-DM1 drug conjugate with improved in vitro analysis to target PD-L1 positive cancer cells and intracellular trafficking studies in cancer therapy. Genet. Mol. Biol. 2020, 42, e20180391. [Google Scholar] [CrossRef]
- Zhang, M.; Jiang, H.; Zhang, R.; Jiang, H.; Xu, H.; Pan, W.; Gao, X.; Sun, Z. Near-infrared fluorescence-labeled anti-PD-L1-mAb for tumor imaging in human colorectal cancer xenografted mice. J. Cell. Biochem. 2019, 120, 10239–10247. [Google Scholar] [CrossRef]
- Asanuma, K.; Nakamura, T.; Hayashi, A.; Okamoto, T.; Iino, T.; Asanuma, Y.; Hagi, T.; Kita, K.; Nakamura, K.; Sudo, A. Soluble programmed death-ligand 1 rather than PD-L1 on tumor cells effectively predicts metastasis and prognosis in soft tissue sarcomas. Sci. Rep. 2020, 10, 9077. [Google Scholar] [CrossRef]
- Ben-Ami, E.; Barysauskas, C.M.; Solomon, S.; Tahlil, K.; Malley, R.; Hohos, M.; Polson, K.; Loucks, M.; Severgnini, M.; Patel, T.; et al. Immunotherapy with single agent nivolumab for advanced leiomyosarcoma of the uterus: Results of a phase 2 study. Cancer 2017, 123, 3285–3290. [Google Scholar] [CrossRef]
- D’Angelo, S.P.; Shoushtari, A.N.; Agaram, N.P.; Kuk, D.; Qin, L.X.; Carvajal, R.D.; Dickson, M.A.; Gounder, M.; Keohan, M.L.; Schwartz, G.K.; et al. Prevalence of tumor-infiltrating lymphocytes and PD-L1 expression in the soft tissue sarcoma microenvironment. Hum. Pathol. 2015, 46, 357–365. [Google Scholar] [CrossRef] [PubMed]
- Gabrych, A.; Pęksa, R.; Kunc, M.; Krawczyk, M.; Izycka-Swieszewska, E.; Biernat, W.; Bień, E. The PD-L1/PD-1 axis expression on tumor-infiltrating immune cells and tumor cells in pediatric rhabdomyosarcoma. Pathol. Res. Pract. 2019, 215, 152700. [Google Scholar] [CrossRef] [PubMed]
- Kawamura, A.; Kawamura, T.; Riddell, M.; Hikita, T.; Yanagi, T.; Umemura, H.; Nakayama, M. Regulation of programmed cell death ligand 1 expression by atypical protein kinase C lambda/iota in cutaneous angiosarcoma. Cancer Sci. 2019, 110, 1780–1789. [Google Scholar] [CrossRef] [PubMed]
- Kim, C.; Kim, E.K.; Jung, H.; Chon, H.J.; Han, J.W.; Shin, K.H.; Hu, H.; Kim, K.S.; Choi, Y.D.; Kim, S.; et al. Prognostic implications of PD-L1 expression in patients with soft tissue sarcoma. BMC Cancer 2016, 16, 434. [Google Scholar] [CrossRef] [PubMed]
- Kim, J.S.; Kim, M.W.; Park, D.Y. Indirect ultrasound guidance increased accuracy of the glenohumeral injection using the superior approach: A cadaveric study of injection accuracy. Ann. Rehabil. Med. 2013, 37, 202–207. [Google Scholar] [CrossRef]
- Klein, S.; Mauch, C.; Wagener-Ryczek, S.; Schoemmel, M.; Buettner, R.; Quaas, A.; Helbig, D. Immune-phenotyping of pleomorphic dermal sarcomas suggests this entity as a potential candidate for immunotherapy. Cancer Immunol. Immunother. 2019, 68, 973–982. [Google Scholar] [CrossRef]
- Kosemehmetoglu, K.; Ozogul, E.; Babaoglu, B.; Tezel, G.G.; Gedikoglu, G. Programmed Death Ligand 1 (PD-L1) Expression in Malignant Mesenchymal Tumors. Turk. Patoloji. Derg. 2017, 1, 192–197. [Google Scholar] [CrossRef]
- Orth, M.F.; Buecklein, V.L.; Kampmann, E.; Subklewe, M.; Noessner, E.; Cidre-Aranaz, F.; Romero-Pérez, L.; Wehweck, F.S.; Lindner, L.; Issels, R.; et al. A comparative view on the expression patterns of PD-L1 and PD-1 in soft tissue sarcomas. Cancer Immunol. Immunother. 2020, 69, 1353–1362. [Google Scholar] [CrossRef]
- Park, H.K.; Kim, M.; Sung, M.; Lee, S.E.; Kim, Y.J.; Choi, Y.L. Status of programmed death-ligand 1 expression in sarcomas. J. Transl. Med. 2018, 16, 303. [Google Scholar] [CrossRef]
- Paydas, S.; Bagir, E.K.; Deveci, M.A.; Gonlusen, G. Clinical and prognostic significance of PD-1 and PD-L1 expression in sarcomas. Med Oncol. 2016, 33, 93. [Google Scholar] [CrossRef] [PubMed]
- Pollack, S.M.; He, Q.; Yearley, J.H.; Emerson, R.; Vignali, M.; Zhang, Y.; Redman, M.W.; Baker, K.K.; Cooper, S.; Donahue, B.; et al. T-cell infiltration and clonality correlate with programmed cell death protein 1 and programmed death-ligand 1 expression in patients with soft tissue sarcomas. Cancer 2017, 123, 3291–3304. [Google Scholar] [CrossRef] [PubMed]
- Shanes, E.D.; Friedman, L.A.; Mills, A.M. PD-L1 Expression and Tumor-infiltrating Lymphocytes in Uterine Smooth Muscle Tumors: Implications for Immunotherapy. Am. J. Surg. Pathol. 2019, 43, 792–801. [Google Scholar] [CrossRef] [PubMed]
- Torabi, A.; Amaya, C.N.; Wians, F.H., Jr.; Bryan, B.A. PD-1 and PD-L1 expression in bone and soft tissue sarcomas. Pathology 2017, 49, 506–513. [Google Scholar] [CrossRef] [PubMed]
- Vargas, A.C.; Maclean, F.M.; Sioson, L.; Tran, D.; Bonar, F.; Mahar, A.; Cheah, A.L.; Russell, P.; Grimison, P.; Richardson, L.; et al. Prevalence of PD-L1 expression in matched recurrent and/or metastatic sarcoma samples and in a range of selected sarcomas subtypes. PLoS ONE 2020, 15, e0222551. [Google Scholar] [CrossRef]
- Yan, L.; Wang, Z.; Cui, C.; Guan, X.; Dong, B.; Zhao, M.; Wu, J.; Tian, X.; Hao, C. Comprehensive immune characterization and T-cell receptor repertoire heterogeneity of retroperitoneal liposarcoma. Cancer Sci. 2019, 110, 3038–3048. [Google Scholar] [CrossRef]
- Zheng, B.; Wang, J.; Cai, W.; Lao, I.; Shi, Y.; Luo, X.; Yan, W. Changes in the tumor immune microenvironment in resected recurrent soft tissue sarcomas. Ann. Transl. Med. 2019, 7, 387. [Google Scholar] [CrossRef]
- Edris, B.; Espinosa, I.; Muhlenberg, T.; Mikels, A.; Lee, C.H.; Steigen, S.E.; Zhu, S.; Montgomery, K.D.; Lazar, A.J.; Lev, D.; et al. ROR2 is a novel prognostic biomarker and a potential therapeutic target in leiomyosarcoma and gastrointestinal stromal tumour. J. Pathol. 2012, 227, 223–233. [Google Scholar] [CrossRef]
- Ehlerding, E.B.; England, C.G.; Majewski, R.L.; Valdovinos, H.F.; Jiang, D.; Liu, G.; McNeel, D.G.; Nickles, R.J.; Cai, W. ImmunoPET Imaging of CTLA-4 Expression in Mouse Models of Non-small Cell Lung Cancer. Mol. Pharm. 2017, 14, 1782–1789. [Google Scholar] [CrossRef]
- Hong, Y.K.; Lee, Y.C.; Cheng, T.L.; Lai, C.H.; Hsu, C.K.; Kuo, C.H.; Hsu, Y.Y.; Li, J.T.; Chang, B.I.; Ma, C.Y.; et al. Tumor Endothelial Marker 1 (TEM1/Endosialin/CD248) Enhances Wound Healing by Interacting with Platelet-Derived Growth Factor Receptors. J. Investig. Derm. 2019, 139, 2204–2214.e7. [Google Scholar] [CrossRef]
- Naylor, A.J.; McGettrick, H.M.; Maynard, W.D.; May, P.; Barone, F.; Croft, A.P.; Egginton, S.; Buckley, C.D. A differential role for CD248 (Endosialin) in PDGF-mediated skeletal muscle angiogenesis. PLoS ONE 2014, 9, e107146. [Google Scholar] [CrossRef] [PubMed]
- Teicher, B.A. CD248: A therapeutic target in cancer and fibrotic diseases. Oncotarget 2019, 10, 993–1009. [Google Scholar] [CrossRef] [PubMed]
- Pietrzyk, Ł. Biomarkers Discovery for Colorectal Cancer: A Review on Tumor Endothelial Markers as Perspective Candidates. Dis. Markers 2016, 2016, 4912405. [Google Scholar] [CrossRef] [PubMed]
- Rouleau, C.; Smale, R.; Fu, Y.S.; Hui, G.; Wang, F.; Hutto, E.; Fogle, R.; Jones, C.M.; Krumbholz, R.; Roth, S.; et al. Endosialin is expressed in high grade and advanced sarcomas: Evidence from clinical specimens and preclinical modeling. Int. J. Oncol. 2011, 39, 73–89. [Google Scholar] [CrossRef]
- Palmerini, E.; Benassi, M.S.; Quattrini, I.; Pazzaglia, L.; Donati, D.; Benini, S.; Gamberi, G.; Gambarotti, M.; Picci, P.; Ferrari, S. Prognostic and predictive role of CXCR4, IGF-1R and Ezrin expression in localized synovial sarcoma: Is chemotaxis important to tumor response? Orphanet. J. Rare. Dis. 2015, 10, 6. [Google Scholar] [CrossRef]
- Ptaszyński, K.; Szumera-Ciećkiewicz, A.; Zakrzewska, K.; Tuziak, T.; Mrozkowiak, A.; Rutkowski, P. Her2, EGFR and TOPIIA gene amplification and protein expression in synovial sarcoma before and after combined treatment. Pol. J. Pathol. 2009, 60, 10–18. [Google Scholar]
- Ahlen, J.; Wejde, J.; Brosjo, O.; von Rosen, A.; Weng, W.H.; Girnita, L.; Larsson, O.; Larsson, C. Insulin-like growth factor type 1 receptor expression correlates to good prognosis in highly malignant soft tissue sarcoma. Clin. Cancer Res. 2005, 11, 206–216. [Google Scholar]
- Van der Ven, L.T.; Roholl, P.J.; Gloudemans, T.; Van Buul-Offers, S.C.; Welters, M.J.; Bladergroen, B.A.; Faber, J.A.; Sussenbach, J.S.; Den Otter, W. Expression of insulin-like growth factors (IGFs), their receptors and IGF binding protein-3 in normal, benign and malignant smooth muscle tissues. Br. J. Cancer 1997, 75, 1631–1640. [Google Scholar] [CrossRef]
- Jones, R.L.; Chawla, S.P.; Attia, S.; Schöffski, P.; Gelderblom, H.; Chmielowski, B.; Le Cesne, A.; Van Tine, B.A.; Trent, J.C.; Patel, S.; et al. A phase 1 and randomized controlled phase 2 trial of the safety and efficacy of the combination of gemcitabine and docetaxel with ontuxizumab (MORAb-004) in metastatic soft-tissue sarcomas. Cancer 2019, 125, 2445–2454. [Google Scholar] [CrossRef]
- Kilvaer, T.K.; Valkov, A.; Sorbye, S.; Smeland, E.; Bremnes, R.M.; Busund, L.T.; Donnem, T. Profiling of VEGFs and VEGFRs as prognostic factors in soft tissue sarcoma: VEGFR-3 is an independent predictor of poor prognosis. PLoS ONE 2010, 5, e15368. [Google Scholar] [CrossRef]
- Patwardhan, P.P.; Musi, E.; Schwartz, G.K. Preclinical Evaluation of Nintedanib, a Triple Angiokinase Inhibitor, in Soft-tissue Sarcoma: Potential Therapeutic Implication for Synovial Sarcoma. Mol. Cancer 2018, 17, 2329–2340. [Google Scholar] [CrossRef] [PubMed]
- Clinicaltrials.gov Ramucirumab. Available online: https://clinicaltrials.gov/ct2/show/NCT04145700?term=ramucirumab&cond=Soft+Tissue+Sarcoma&draw=2&rank=1 (accessed on 22 June 2020).
- Harlaar, N.J.; Koller, M.; de Jongh, S.J.; van Leeuwen, B.L.; Hemmer, P.H.; Kruijff, S.; van Ginkel, R.J.; Been, L.B.; de Jong, J.S.; Kats-Ugurlu, G.; et al. Molecular fluorescence-guided surgery of peritoneal carcinomatosis of colorectal origin: A single-centre feasibility study. Lancet. Gastroenterol. Hepatol. 2016, 1, 283–290. [Google Scholar] [CrossRef]
- Mitsiades, N.; Yu, W.H.; Poulaki, V.; Tsokos, M.; Stamenkovic, I. Matrix metalloproteinase-7-mediated cleavage of Fas ligand protects tumor cells from chemotherapeutic drug cytotoxicity. Cancer Res. 2001, 61, 577–581. [Google Scholar] [PubMed]
- Steinkamp, P.J.; Pranger, B.K.; Li, M.; Linssen, M.D.; Voskuil, F.J.; Been, L.B.; van Leeuwen, B.L.; Suurmeijer, A.J.H.; Nagengast, W.B.; Kruijff, S.K.; et al. Fluorescence-guided visualization of soft tissue sarcomas by targeting vascular endothelial growth factor-A: A phase 1 single-center clinical trial. J. Nucl. Med. 2020. [Google Scholar] [CrossRef] [PubMed]
- De Jongh, S.J.; Tjalma, J.J.J.; Koller, M.; Linssen, M.D.; Vonk, J.; Dobosz, M.; Jorritsma-Smit, A.; Kleibeuker, J.H.; Hospers, G.A.P.; Havenga, K.; et al. Back-Table Fluorescence-Guided Imaging for Circumferential Resection Margin Evaluation Using Bevacizumab-800CW in Patients with Locally Advanced Rectal Cancer. J. Nucl. Med. 2020, 61, 655–661. [Google Scholar] [CrossRef] [PubMed]
- Lamberts, L.E.; Koch, M.; de Jong, J.S.; Adams, A.L.L.; Glatz, J.; Kranendonk, M.E.G.; Terwisscha van Scheltinga, A.G.T.; Jansen, L.; de Vries, J.; Lub-de Hooge, M.N.; et al. Tumor-Specific Uptake of Fluorescent Bevacizumab-IRDye800CW Microdosing in Patients with Primary Breast Cancer: A Phase I Feasibility Study. Clin. Cancer Res. 2017, 23, 2730–2741. [Google Scholar] [CrossRef]
- Wang, Z. ErbB Receptors and Cancer. Methods Mol. Biol. 2017, 1652, 3–35. [Google Scholar] [CrossRef]
- Pellat, A.; Vaquero, J.; Fouassier, L. Role of ErbB/HER family of receptor tyrosine kinases in cholangiocyte biology. Hepatology 2018, 67, 762–773. [Google Scholar] [CrossRef]
- Singh, B.; Carpenter, G.; Coffey, R.J. EGF receptor ligands: Recent advances. F1000Research 2016, 5. [Google Scholar] [CrossRef]
- Duan, C.; Li, C.W.; Zhao, L.; Subramaniam, S.; Yu, X.M.; Li, Y.Y.; de Chen, H.; Li, T.Y.; Shen, L.; Shi, L.; et al. Differential Expression Patterns of EGF, EGFR, and ERBB4 in Nasal Polyp Epithelium. PLoS ONE 2016, 11, e0156949. [Google Scholar] [CrossRef]
- Huisman, B.W.; Burggraaf, J.; Vahrmeijer, A.L.; Schoones, J.W.; Rissmann, R.A.; Sier, C.F.M.; van Poelgeest, M.I.E. Potential targets for tumor-specific imaging of vulvar squamous cell carcinoma: A systematic review of candidate biomarkers. Gynecol. Oncol. 2020, 156, 734–743. [Google Scholar] [CrossRef] [PubMed]
- Sasaki, T.; Hiroki, K.; Yamashita, Y. The role of epidermal growth factor receptor in cancer metastasis and microenvironment. Biomed. Res. Int. 2013, 2013, 546318. [Google Scholar] [CrossRef] [PubMed]
- Sigismund, S.; Avanzato, D.; Lanzetti, L. Emerging functions of the EGFR in cancer. Mol. Oncol. 2018, 12, 3–20. [Google Scholar] [CrossRef] [PubMed]
- Clinicaltrials.gov Cetuximab. Available online: https://clinicaltrials.gov/ct2/show/NCT00148109?term=cetuximab&cond=Soft+Tissue+Sarcoma&draw=3&rank=1 (accessed on 22 June 2020).
- Tummers, W.S.; Miller, S.E.; Teraphongphom, N.T.; Gomez, A.; Steinberg, I.; Huland, D.M.; Hong, S.; Kothapalli, S.R.; Hasan, A.; Ertsey, R.; et al. Intraoperative Pancreatic Cancer Detection using Tumor-Specific Multimodality Molecular Imaging. Ann. Surg. Oncol. 2018, 25, 1880–1888. [Google Scholar] [CrossRef] [PubMed]
- Miller, S.E.; Tummers, W.S.; Teraphongphom, N.; van den Berg, N.S.; Hasan, A.; Ertsey, R.D.; Nagpal, S.; Recht, L.D.; Plowey, E.D.; Vogel, H.; et al. First-in-human intraoperative near-infrared fluorescence imaging of glioblastoma using cetuximab-IRDye800. J. Neurooncol. 2018, 139, 135–143. [Google Scholar] [CrossRef] [PubMed]
- Rosenthal, E.L.; Warram, J.M.; de Boer, E.; Chung, T.K.; Korb, M.L.; Brandwein-Gensler, M.; Strong, T.V.; Schmalbach, C.E.; Morlandt, A.B.; Agarwal, G.; et al. Safety and Tumor Specificity of Cetuximab-IRDye800 for Surgical Navigation in Head and Neck Cancer. Clin. Cancer. Res. 2015, 21, 3658–3666. [Google Scholar] [CrossRef]
- Colman, R.W.; Pixley, R.A.; Sainz, I.M.; Song, J.S.; Isordia-Salas, I.; Muhamed, S.N.; Powell, J.A., Jr.; Mousa, S.A. Inhibition of angiogenesis by antibody blocking the action of proangiogenic high-molecular-weight kininogen. J. Thromb. Haemost. 2003, 1, 164–170. [Google Scholar] [CrossRef]
- Samkoe, K.S.; Gunn, J.R.; Marra, K.; Hull, S.M.; Moodie, K.L.; Feldwisch, J.; Strong, T.V.; Draney, D.R.; Hoopes, P.J.; Roberts, D.W.; et al. Toxicity and Pharmacokinetic Profile for Single-Dose Injection of ABY-029: A Fluorescent Anti-EGFR Synthetic Affibody Molecule for Human Use. Mol. Imaging Biol. 2017, 19, 512–521. [Google Scholar] [CrossRef]
- Clinicaltrials.gov Panitumumab (Head&Neck Cancer). Available online: https://clinicaltrials.gov/ct2/show/NCT03405142?term=Panitumumab-IRDye800&draw=2&rank=4 (accessed on 22 June 2020).
- Clinicaltrials.gov Panitumumab (Lung Cancer). Available online: https://clinicaltrials.gov/ct2/show/NCT03582124?term=Panitumumab-IRDye800&draw=2&rank=3 (accessed on 22 June 2020).
- Clinicaltrials.gov Panitumumab. Available online: https://clinicaltrials.gov/ct2/show/NCT02415881?term=Panitumumab-IRDye800&draw=2&rank=2 (accessed on 22 June 2020).
- Friedrichs, N.; Kuchler, J.; Endl, E.; Koch, A.; Czerwitzki, J.; Wurst, P.; Metzger, D.; Schulte, J.H.; Holst, M.I.; Heukamp, L.C.; et al. Insulin-like growth factor-1 receptor acts as a growth regulator in synovial sarcoma. J. Pathol. 2008, 216, 428–439. [Google Scholar] [CrossRef]
- Xie, Y.; Skytting, B.; Nilsson, G.; Brodin, B.; Larsson, O. Expression of insulin-like growth factor-1 receptor in synovial sarcoma: Association with an aggressive phenotype. Cancer Res. 1999, 59, 3588–3591. [Google Scholar]
- Clinicaltrials.gov Ganitumab. Available online: https://clinicaltrials.gov/ct2/show/NCT00819169?term=Ganitumab&cond=Soft+Tissue+Sarcoma&draw=2&rank=8 (accessed on 22 June 2020).
- Clinicaltrials.gov AMG-479. Available online: https://clinicaltrials.gov/ct2/show/NCT00562380?term=Ganitumab&cond=Soft+Tissue+Sarcoma&draw=2&rank=6 (accessed on 22 June 2020).
- Olmos, D.; Postel-Vinay, S.; Molife, L.R.; Okuno, S.H.; Schuetze, S.M.; Paccagnella, M.L.; Batzel, G.N.; Yin, D.; Pritchard-Jones, K.; Judson, I.; et al. Safety, pharmacokinetics, and preliminary activity of the anti-IGF-1R antibody figitumumab (CP-751,871) in patients with sarcoma and Ewing’s sarcoma: A phase 1 expansion cohort study. Lancet. Oncol. 2010, 11, 129–135. [Google Scholar] [CrossRef]
- Pappo, A.S.; Vassal, G.; Crowley, J.J.; Bolejack, V.; Hogendoorn, P.C.; Chugh, R.; Ladanyi, M.; Grippo, J.F.; Dall, G.; Staddon, A.P.; et al. A phase 2 trial of R1507, a monoclonal antibody to the insulin-like growth factor-1 receptor (IGF-1R), in patients with recurrent or refractory rhabdomyosarcoma, osteosarcoma, synovial sarcoma, and other soft tissue sarcomas: Results of a Sarcoma Alliance for Research Through Collaboration study. Cancer 2014, 120, 2448–2456. [Google Scholar] [CrossRef] [PubMed]
- Schoffski, P.; Adkins, D.; Blay, J.Y.; Gil, T.; Elias, A.D.; Rutkowski, P.; Pennock, G.K.; Youssoufian, H.; Gelderblom, H.; Willey, R.; et al. An open-label, phase 2 study evaluating the efficacy and safety of the anti-IGF-1R antibody cixutumumab in patients with previously treated advanced or metastatic soft-tissue sarcoma or Ewing family of tumours. Eur. J. Cancer 2013, 49, 3219–3228. [Google Scholar] [CrossRef] [PubMed]
- Zhang, H.; Zeng, X.; Li, Q.; Gaillard-Kelly, M.; Wagner, C.R.; Yee, D. Fluorescent tumour imaging of type I IGF receptor in vivo: Comparison of antibody-conjugated quantum dots and small-molecule fluorophore. Br. J. Cancer 2009, 101, 71–79. [Google Scholar] [CrossRef]
- Lai, Y.T.; Chao, H.W.; Lai, A.C.; Lin, S.H.; Chang, Y.J.; Huang, Y.S. CPEB2-activated PDGFRalpha mRNA translation contributes to myofibroblast proliferation and pulmonary alveologenesis. J. Biomed. Sci. 2020, 27, 52. [Google Scholar] [CrossRef] [PubMed]
- Andrae, J.; Gallini, R.; Betsholtz, C. Role of platelet-derived growth factors in physiology and medicine. Genes Dev. 2008, 22, 1276–1312. [Google Scholar] [CrossRef] [PubMed]
- Lin, L.H.; Lin, J.S.; Yang, C.C.; Cheng, H.W.; Chang, K.W.; Liu, C.J. Overexpression of Platelet-Derived Growth Factor and Its Receptor Are Correlated with Oral Tumorigenesis and Poor Prognosis in Oral Squamous Cell Carcinoma. Int. J. Mol. Sci. 2020, 21, 2360. [Google Scholar] [CrossRef]
- Santilli, F.; Basili, S.; Ferroni, P.; Davi, G. CD40/CD40L system and vascular disease. Intern. Emerg. Med. 2007, 2, 256–268. [Google Scholar] [CrossRef]
- Vonderheide, R.H. Prospect of targeting the CD40 pathway for cancer therapy. Clin. Cancer Res. 2007, 13, 1083–1088. [Google Scholar] [CrossRef]
- Elmetwali, T.; Young, L.S.; Palmer, D.H. Fas-associated factor (Faf1) is a novel CD40 interactor that regulates CD40-induced NF-kappaB activation via a negative feedback loop. Cell Death Dis. 2014, 5, e1213. [Google Scholar] [CrossRef]
- Gennatas, S.; Chamberlain, F.; Carter, T.; Slater, S.; Cojocaru, E.; Lambourn, B.; Stansfeld, A.; Todd, R.; Verrill, M.; Ali, N.; et al. Real-world experience with doxorubicin and olaratumab in soft tissue sarcomas in England and Northern Ireland. Clin. Sarcoma Res. 2020, 10, 9. [Google Scholar] [CrossRef] [PubMed]
- Piechutta, M.; Berghoff, A.S. New emerging targets in cancer immunotherapy: The role of Cluster of Differentiation 40 (CD40/TNFR5). Esmo Open 2019, 4, e000510. [Google Scholar] [CrossRef] [PubMed]
- Clinicaltrials.gov APX005M. Available online: https://clinicaltrials.gov/ct2/show/NCT03719430?term=APX005M&cond=Soft+Tissue+Sarcoma&draw=2&rank=1 (accessed on 22 June 2020).
- Gu, L.; Ruff, L.E.; Qin, Z.; Corr, M.; Hedrick, S.M.; Sailor, M.J. Multivalent porous silicon nanoparticles enhance the immune activation potency of agonistic CD40 antibody. Adv. Mater. 2012, 24, 3981–3987. [Google Scholar] [CrossRef]
- Tap, W.D.; Wagner, A.J.; Schöffski, P.; Martin-Broto, J.; Krarup-Hansen, A.; Ganjoo, K.N.; Yen, C.C.; Abdul Razak, A.R.; Spira, A.; Kawai, A.; et al. Effect of Doxorubicin Plus Olaratumab vs Doxorubicin Plus Placebo on Survival in Patients With Advanced Soft Tissue Sarcomas: The ANNOUNCE Randomized Clinical Trial. JAMA 2020, 323, 1266–1276. [Google Scholar] [CrossRef] [PubMed]
- Yonemori, K.; Kodaira, M.; Satoh, T.; Kudo, T.; Takahashi, S.; Nakano, K.; Ando, Y.; Shimokata, T.; Mori, J.; Inoue, K.; et al. Phase 1 study of olaratumab plus doxorubicin in Japanese patients with advanced soft-tissue sarcoma. Cancer Sci. 2018, 109, 3962–3970. [Google Scholar] [CrossRef]
- Wagner, A.J.; Kindler, H.; Gelderblom, H.; Schoffski, P.; Bauer, S.; Hohenberger, P.; Kopp, H.G.; Lopez-Martin, J.A.; Peeters, M.; Reichardt, P.; et al. A phase II study of a human anti-PDGFRalpha monoclonal antibody (olaratumab, IMC-3G3) in previously treated patients with metastatic gastrointestinal stromal tumors. Ann. Oncol. 2017, 28, 541–546. [Google Scholar] [CrossRef]
- Schwartz, G.K.; Tap, W.D.; Qin, L.X.; Livingston, M.B.; Undevia, S.D.; Chmielowski, B.; Agulnik, M.; Schuetze, S.M.; Reed, D.R.; Okuno, S.H.; et al. Cixutumumab and temsirolimus for patients with bone and soft-tissue sarcoma: A multicentre, open-label, phase 2 trial. Lancet. Oncol. 2013, 14, 371–382. [Google Scholar] [CrossRef]
- Chisholm, K.M.; Chang, K.W.; Truong, M.T.; Kwok, S.; West, R.B.; Heerema-McKenney, A.E. β-Adrenergic receptor expression in vascular tumors. Mod. Pathol. 2012, 25, 1446–1451. [Google Scholar] [CrossRef]
- Federico, S.M.; Caldwell, K.J.; McCarville, M.B.; Daryani, V.M.; Stewart, C.F.; Mao, S.; Wu, J.; Davidoff, A.M.; Santana, V.M.; Furman, W.L.; et al. Phase I expansion cohort to evaluate the combination of bevacizumab, sorafenib and low-dose cyclophosphamide in children and young adults with refractory or recurrent solid tumours. Eur. J. Cancer 2020, 132, 35–42. [Google Scholar] [CrossRef]
- Hong, D.S.; Garrido-Laguna, I.; Ekmekcioglu, S.; Falchook, G.S.; Naing, A.; Wheler, J.J.; Fu, S.; Moulder, S.L.; Piha-Paul, S.; Tsimberidou, A.M.; et al. Dual inhibition of the vascular endothelial growth factor pathway: A phase 1 trial evaluating bevacizumab and AZD2171 (cediranib) in patients with advanced solid tumors. Cancer 2014, 120, 2164–2173. [Google Scholar] [CrossRef]
- Tap, W.D.; Federman, N.; Eilber, F.C. Targeted therapies for soft-tissue sarcomas. Expert Rev. Anticancer 2007, 7, 725–733. [Google Scholar] [CrossRef] [PubMed]
- Coats, S.; Williams, M.; Kebble, B.; Dixit, R.; Tseng, L.; Yao, N.S.; Tice, D.A.; Soria, J.C. Antibody-Drug Conjugates: Future Directions in Clinical and Translational Strategies to Improve the Therapeutic Index. Clin. Cancer Res. 2019, 25, 5441–5448. [Google Scholar] [CrossRef] [PubMed]
- Petrus, P.; Fernandez, T.L.; Kwon, M.M.; Huang, J.L.; Lei, V.; Safikhan, N.S.; Karunakaran, S.; O’Shannessy, D.J.; Zheng, X.; Catrina, S.B.; et al. Specific loss of adipocyte CD248 improves metabolic health via reduced white adipose tissue hypoxia, fibrosis and inflammation. EBioMedicine 2019, 44, 489–501. [Google Scholar] [CrossRef] [PubMed]
- Vodanovich, D.A.; Choong, P.F.M. Soft-tissue Sarcomas. Indian J. Orthop. 2018, 52, 35–44. [Google Scholar] [CrossRef] [PubMed]
- Uhlén, M.; Fagerberg, L.; Hallström, B.M.; Lindskog, C.; Oksvold, P.; Mardinoglu, A.; Sivertsson, Å.; Kampf, C.; Sjöstedt, E.; Asplund, A.; et al. Proteomics. Tissue-based map of the human proteome. Science 2015, 347, 1260419. [Google Scholar] [CrossRef]
- Human Protein Atlas. Available online: http://www.proteinatlas.org (accessed on 13 December 2020).
- Grothey, A.; Strosberg, J.R.; Renfro, L.A.; Hurwitz, H.I.; Marshall, J.L.; Safran, H.; Guarino, M.J.; Kim, G.P.; Hecht, J.R.; Weil, S.C.; et al. A Randomized, Double-Blind, Placebo-Controlled Phase II Study of the Efficacy and Safety of Monotherapy Ontuxizumab (MORAb-004) Plus Best Supportive Care in Patients with Chemorefractory Metastatic Colorectal Cancer. Clin. Cancer Res. 2018, 24, 316–325. [Google Scholar] [CrossRef]
- Kersting, C.; Packeisen, J.; Leidinger, B.; Brandt, B.; von Wasielewski, R.; Winkelmann, W.; van Diest, P.J.; Gosheger, G.; Buerger, H. Pitfalls in immunohistochemical assessment of EGFR expression in soft tissue sarcomas. J. Clin. Pathol. 2006, 59, 585–590. [Google Scholar] [CrossRef]

Publisher’s Note: MDPI stays neutral with regard to jurisdictional claims in published maps and institutional affiliations. |
© 2021 by the authors. Licensee MDPI, Basel, Switzerland. This article is an open access article distributed under the terms and conditions of the Creative Commons Attribution (CC BY) license (http://creativecommons.org/licenses/by/4.0/).