Article

The Oncogene MYCN Modulates Glycolytic and Invasive Genes to Enhance Cell Viability and Migration in Human Retinoblastoma

by
Swatishree Sradhanjali
1,2,
Padmalochan Rout
1,3,
Devjyoti Tripathy
4,†,
Swathi Kaliki
5,†,
Suryasnata Rath
4,†,
Rahul Modak
2,
Ruchi Mittal
6,7,
Tirumala Kumar Chowdary
8 and
Mamatha M. Reddy
1,2,*
1
The Operation Eyesight Universal Institute for Eye Cancer, LV Prasad Eye Institute, Bhubaneswar 751024, Odisha, India
2
School of Biotechnology, KIIT Deemed to Be University, Bhubaneswar 751024, Odisha, India
3
Novo Nordisk, Bangalore 560066, Karnataka, India
4
Ophthalmic Plastics, Orbit and Ocular Oncology Service, LV Prasad Eye Institute, Bhubaneswar 751024, Odisha, India
5
The Operation Eyesight Universal Institute for Eye Cancer, LV Prasad Eye Institute, Hyderabad 500034, Telangana, India
6
Kanupriya Dalmia Ophthalmic Pathology Laboratory, LV Prasad Eye Institute, Bhubaneswar 751024, Odisha, India
7
Department of Pathology, Kalinga Institute of Medical Sciences, Bhubaneswar 751024, Odisha, India
8
School of Biological Sciences, National Institute of Science Education and Research, Homi Bhabha National Institute, Bhubaneswar 752050, Odisha, India
*
Author to whom correspondence should be addressed.
These authors contributed equally.
Cancers 2021, 13(20), 5248; https://doi.org/10.3390/cancers13205248
Submission received: 9 September 2021 / Revised: 11 October 2021 / Accepted: 12 October 2021 / Published: 19 October 2021

Abstract

:

Simple Summary

Retinoblastoma (RB) is a cancer in children, caused by loss of function of RB1 gene. Additional factors such as increase in gene copy numbers of oncogenes MYCN, MDM4 and E2F3 contribute to RB pathogenesis, though their mechanism(s) are not completely understood. We sought to explain the role of MYCN in RB pathogenesis. Our data indicate that MYCN is overexpressed in RB, and that may contribute to the disease progression by altering the cancer metabolism (glucose metabolism) and cell migration related genes. We also observed that a combination of MYCN-inhibition with carboplatin, a drug that is currently used in the treatment of RB has a good synergistic activity against RB. Development of drug-related toxicity and associated long-term side effects is a problem in treatment of RB. MYCN-inhibition, in combination with existing drugs, could be a novel, effective therapeutic strategy to reduce high doses of chemotherapy for children that receive prolonged chemotherapy.

Abstract

Retinoblastoma is usually initiated by biallelic RB1 gene inactivation. In addition, MYCN copy number alterations also contribute to RB pathogenesis. However, MYCN expression, its role in disease progression and correlation with RB histological risk factors are not well understood. We studied the expression of MYCN in enucleated RB patient specimens by immunohistochemistry. MYCN is overexpressed in RB compared to control retina. Our microarray gene expression analysis followed by qRT-PCR validation revealed that genes involved in glucose metabolism and migration are significantly downregulated in MYCN knockdown cells. Further, targeting MYCN in RB cells using small molecule compounds or shRNAs led to decreased cell survival and migration, increased apoptosis and cell cycle arrest, suggesting that MYCN inhibition can be a potential therapeutic strategy. We also noted that MYCN inhibition results in reduction in glucose uptake, lactate production, ROS levels and gelatinolytic activity of active-MMP9, explaining a possible mechanism of MYCN in RB. Taking clues from our findings, we tested a combination treatment of RB cells with carboplatin and MYCN inhibitors to find enhanced therapeutic efficacy compared to single drug treatment. Thus, MYCN inhibition can be a potential therapeutic strategy in combination with existing chemotherapy drugs to restrict tumor cell growth in RB.

1. Introduction

Retinoblastoma (RB) is a pediatric intraocular neoplasm that can either be unilateral or bilateral and accounts for ~4% of total childhood malignancies [1]. RB usually arises due to loss of function of RB1 tumor suppressor gene present on chromosome 13q14 [2,3]. However, Rushlow et al., 2013 have reported a subset of retinoblastoma patients showing MYCN amplifications with no apparent alterations in RB1 [4]. These RB1 wildtype and MYCN amplified patients can show metastasis, but so far, only intraocular cases were reported. A recent study by Zugbi et al., 2020 showed that the patients with wildtype RB1 and MYCN amplification can metastasize to orbit, and lymph nodes and these patients also showed chemoresistance [5]. RB1 gene encodes the protein, pRB, which is a key regulator of cell cycle that binds to E2F transcription factors among others and represses cell proliferation in the absence of mitogenic signals [6]. Loss of function of pRB in a susceptible retinal cell initiates benign precursor, retinoma [7]. Alterations in additional pathways contribute further to RB1 mutations and drive retinoblastoma initiation and progression by activating oncogenes and suppressing tumor suppressors. These changes include copy number alterations and expression levels of DEK, E2F3, KIF14, MDM4, SYK and MYCN [8,9]. Additionally, Afshar et al., 2020 using next generation sequence analysis showed that RB tumor samples can have high frequency of somatic aberrations subsequent to RB1 deactivation that correlated with high-risk histological features [10].
MYC proteins (c-Myc, MYCL and MYCN) are transcriptional regulators that control various cellular processes including cell cycle, cell growth, proliferation, apoptosis and metabolism [11]. The MYC proto-oncoproteins exert their functions through heterodimerizing with its binding partner, MAX, which then binds to E-box sequences present in the promoters of target genes to regulate their expression [12,13]. The expression of MYC proteins is tissue and developmental stage specific. MYCN is specifically expressed in neuronal tissues and kidneys [14,15]. Targeted disruption of MYCN in mice was found to be embryonically lethal [16]. Deregulation of MYC often results from gross genetic alterations such as copy number changes, chromosomal translocations, increased enhancer activities and dysregulated signal transduction that leads to constitutive overexpression of MYC. The dysregulation of MYC family members has been implicated in a wide variety of cancers [17,18]. For example, MYCN, has been shown to be amplified and overexpressed in retinoblastoma [4,19,20,21]. Alterations in copy number or changes in expression of MYCN has also been reported in other cancers such as neuroblastoma [22], medulloblastoma [23], glioblastoma multiforme [24,25], Rhabdomyosarcoma [26] and pancreatic tumors [27]. The strategies to target MYC are currently being explored [28]. However, amplification of MYCN has been identified since long [18], the mechanisms underlying the role of MYCN in RB are just beginning to emerge. There is a need to study whether altered MYCN expression in human retinoblastoma samples correlates with any of the high-risk histological factors. Further, it is necessary to identify the genes regulated by MYCN that aid in RB progression.
In the current study, we have studied the expression of MYCN in retinoblastoma primary tumor tissues and compared it with various histological and clinical parameters. Furthermore, we have explored the possibility of targeting MYCN in retinoblastoma using small molecule inhibitors and shRNA approaches. Our data shows that MYCN is overexpressed in RB samples both in primarily enucleated as well as chemo-treated tumors. Further, our data confirms that MYCN can be targeted using small molecule inhibitors and shRNA approaches. In addition, we have identified the pathways regulated by MYCN using gene microarray analysis.

2. Materials and Methods

2.1. Ethics Approval

This study was accepted by the ethics committee of LV Prasad Eye Institute (protocol number 2019-144-IM-28), Bhubaneswar, India, and followed the tenets of the Declaration of Helsinki.

2.2. Cell Culture

Human RB cell lines Y79 and Weri-Rb1 purchased from the American Type Culture Collection (ATCC) (Manassas, VA, USA) were cultured in RPMI-1640 medium (PAN-Biotech, Aidenbach, Germany) containing 10% fetal bovine serum (FBS) (Thermo Fisher Scientific, Waltham, MA, USA) and 1% (v/v) antibiotics (penicillin-streptomycin-amphotericin B mixture; PAN- Biotech). LRB1 and LRB2 cells derived from bilateral RB patients that were RB1 negative [29] and primary tumor cells isolated from fresh RB tissues were maintained in the same way as the RB cell lines. Human embryonic kidney (HEK) 293T cells (ATCC) were grown in Dulbecco’s Modified Eagle Medium (DMEM; PAN-Biotech) supplemented with 10% FBS. Human retinal pigment epithelium cell line, ARPE-19 (ATCC) was maintained in DMEM: Nutrient Mixture F12 (DMEM/F-12; PAN-Biotech). All the cell lines were verified for the presence of Mycoplasma and were used within 3 months of revival.

2.3. Immunoblotting

Total proteins were isolated using RIPA lysis buffer that contained protease (Roche, Basel, Switzerland) and phosphatase inhibitors (Sigma-Aldrich, St. Louis, MO, USA). Bradford reagent (Bio-Rad Laboratories, Hercules, CA, USA) was used to estimate protein quantity. Proteins (equal amounts) were fractionated by sodium dodecyl sulfate polyacrylamide gel electrophoresis (SDS-PAGE) and transferred onto nitrocellulose membrane. The membranes were blocked in 5% bovine serum albumin (BSA, HiMedia laboratories, Mumbai, India) for 1 h followed by overnight incubation at 4 °C with appropriate dilutions of primary antibodies (rabbit anti-MYCN monoclonal antibody, 1:1000 dilution, Cell Signaling Technology, Danvers, MA, USA; anti-ß-actin monoclonal antibody, 1:5000 dilution, Sigma-Aldrich; mouse anti-p53 and anti-Bcl2 monoclonal antibodies, 1:500 dilution, Santa Cruz Biotechnology, Dallas, TX, USA). The next day, membranes were washed thrice with Tris-buffered saline with tween 20 (TBS-T) for 5 min each and incubated with respective secondary antibodies for 1 h at room temperature. Following 3 washes in TBS-T, membranes were visualized using chemiluminescence (ECL) reagent (Bio-Rad Laboratories).

2.4. Immunohistochemistry

Enucleated RB tissue specimens (n = 58; 2013 to 2018) were evaluated for the presence of MYCN using immunohistochemistry (IHC). The specimens that did not have significant number of viable tumor cells were excluded from the study. We have included both primarily enucleated and chemotherapy treated eyes for IHC. The enucleated eyes consisted of either group D or E tumors. Formalin fixed paraffin embedded (FFPE) tissue specimens (4 µm) were positioned on to coated glass slides. IHC was performed using the EnVision FLEX Mini Kit (Agilent Technologies, Santa Clara, CA, USA) according to the manufacturer’s instructions. Tissue specimens were immuno-stained with anti-MYCN monoclonal antibody at 1:50 dilution and images were acquired using APERIOCS2 slide scanning microscope (Leica Microsystems, Wetzlar, Germany). Images were also captured with a 100X objective on Olympus BX53 microscope (Olympus, Tokyo, Japan) for scoring and data analysis.
Immunoreactivity score was assigned to the tissue specimens showing MYCN expression based on the intensity and extent of expression as described previously [30]. Intensity of MYCN expression was scored as follows; 0 = negative, 1 = low, 2 = medium and 3 = high. The extent of MYCN expression was quantified as the percentage of positively stained cells observed relative to the entire tumor area with a score of 0 for <1%, 1 for 2–10%, 2 for 11–50%, 3 for 51–75% and 4 for >75%. The final immunoreactive score was obtained by multiplying the intensity score by the extent score, with 0 being the minimum score and 12 being the maximum score. An immunoreactive score of >3 was considered positive. The positive samples were further classified into strong, moderate and weak expression. Immunoreactive score of 10 to 12 was considered strong expression; 7 to 9, moderate expression; and 3 to 6, weak expression.

2.5. Lentiviral Mediated shRNA Knockdown

MYCN was silenced in Y79 and LRB1 cells using two shRNA constructs KD-1 (TRCN0000020695) and KD-2 (TRCN0000020698) (Dharmacon, Lafayette, CO, USA). Lentiviruses containing shRNA constructs that target MYCN or scrambled controls were produced in HEK293T cells. Viral supernatant harvested 48 and 72 h post transfection was used for transduction in serum reduced media containing polybrene (4 µg/mL; Sigma-Aldrich).

2.6. Determination of Cell Viability

RB cells were treated with either commercially available pharmacological inhibitors: JQ1 (Cayman Chemical Company, Ann Arbor, MI, USA), I-BET762 (APExBIO, Houston, TX, USA), 10058-F4 (Sigma-Aldrich) and 10074-G5 (Sigma-Aldrich) or inhibited by shRNA mediated approach. Cells were seeded at a density of 0.1 × 10⁶ cells/mL and treated for 48 h with small molecule inhibitors. Cell viability was determined by trypan blue dye (Sigma-Aldrich) exclusion assay. The reduction in cell viability was measured following inhibitor treatment or shRNA-mediated knockdown and compared to untreated or scrambled controls.

2.7. Apoptosis Assay

RB cells (1 × 10⁶ cells) were treated with inhibitors for 48 h and stained with Annexin V and Propidium Iodide (PI) as per manufacturer’s instructions (Miltenyi Biotec, Bergisch Gladbach, Germany). Stained cells were immediately analyzed on a cytoFLEX flow cytometer (Beckman Coulter Life Sciences, Brea, CA, USA).

2.8. Cell Cycle Analysis

The changes in cell-cycle distribution upon MYCN inhibition were determined by analyzing the DNA content by flow cytometry using PI (Sigma-Aldrich) staining. Briefly, 1 × 10⁶ cells were washed twice with Dulbecco’s phosphate buffered saline (DPBS; PAN-Biotech) and fixed in 70% ice cold ethanol overnight. After ethanol fixation, cells were washed twice with DPBS and treated with 50 µg/mL of RNase-A (QIAGEN, Hilden, Germany) and incubated at 37 °C for 30 min. Prior to flow cytometry analysis, cells were washed with DPBS and stained with 50 µg/mL of PI.

2.9. Glucose Uptake

Fluorescent glucose analog 2-(N-(7-nitrobenz-2-oxa-1,3-diazol-4-yl) amino)-2-deoxyglucose (2-NBDG); (Thermofisher Scientific) was used to measure glucose uptake by flow cytometry. Cells (1 × 10⁶) were incubated in 30 µM of 2-NBDG in PBS for 20 min at 37 °C, afterwards washed in cold DPBS twice and subjected to flow cytometric evaluation. Alteration in glucose uptake post 48 h of inhibitor treatment was compared relative to control cells.

2.10. Lactate Assay

The lactate content was measured using the commercially available lactate assay kit (BioVision, Mountain View, CA, USA) as per the manufacturer’s directions. Cells (1 × 10⁶) were incubated for 4 h in serum free medium prior to colorimetric analysis and relative changes in lactate levels were determined in inhibitor treated and shRNA knockdown samples compared to untreated or scrambled controls.

2.11. Measurement of Reactive Oxygen Species (ROS)

The relative intracellular ROS levels were determined by using 2′,7′-dichlorofluorescein diacetate (DCF-DA; Merck, Darmstadt, Germany). Cells (1 × 10⁶) were incubated with DCF-DA (20 µM) in phosphate-buffered saline (PBS) for 5 min at 37 °C, followed by gentle washing with ice cold PBS twice and analyzed using flow cytometry.

2.12. Drug Combination Assay

Drug synergy analysis was performed based on Chou and Talalay’s method [31]. Cells were treated with carboplatin and MYCN inhibitors either alone or in combination for 48 h. IC50 of individual drugs were calculated and drug concentrations below and above IC50 were taken for the combination assay. Cell viability was determined using trypan blue assay. Percentage of cell growth was determined in treated samples relative to control. Fraction affected (Fa) was calculated using a formula, Fa = 1 − (% growth/100). Fa values were calculated for each concentration of single drug (JQ1, 10058-F4 or carboplatin) and the combinations. Combination indices (CI) were determined for all the drug combinations tested. CI value less than 1 is considered synergistic, equal to 1 additive and more than 1 antagonistic [31].

2.13. Wound Healing Assay

Approximately 2 × 10⁶ cells were seeded onto 6-well poly-d-lysine (0.01%) coated plates, serum starved and maintained in RPMI-1640 containing 1% Penicillin/Streptomycin/Amphotericin-B mix. After 24 h, two fine scratches (perpendicular to each other) were made using 200 µL micropipette tip. Cell culture media was removed, and cells were washed gently with sterile DPBS. Fresh RPMI-1640 medium supplemented with 2% FBS and 1% Penicillin/Streptomycin/Amphotericin-B mixture was added. Microscopic pictures of the wound created were recorded at 0- and 24-hours’ time interval in scrambled and MYCN knockdown cells.

2.14. Microarray Analysis

Microarray analysis was performed to evaluate the gene expression profile in scrambled and MYCN knockdown Y79 cells. The microarray platform Human GXP 8X60k was procured from Agilent Technologies. Scrambled, MYCN KD-1 and MYCN KD-2 were subjected to microarray analysis.

2.14.1. Data Interpretation and Identification of Differentially Expressed Genes (DEGs)

The normalization was carried out using GeneSpring GX 14.5 Software. Percentile Shift Normalization method was used for normalizing the data. Analysis was carried out with respect to control samples. log2FC (fold change) > 1 or <−1 were considered significantly different between the scrambled control group and the MYCN knockdown group.

2.14.2. Gene Ontology (GO), Pathway and Function Enrichment Analysis of DEGs

To determine the GO function of the prioritized genes as well as their significantly enriched pathways, GO function and Kyoto Encyclopedia of Genes and Genomes (KEGG) pathway analysis of DEGs were performed using DAVID (The Database for Annotation, Visualization and Integrated Discovery) (http://david.abcc.ncifcrf.gov/) accessed on 14 October 2021. p-value < 0.05 was considered statistically significant.

2.15. RNA Isolation and Validation of Identified Genes

Total RNA from cell lines or tissues was extracted using Trizol reagent (Thermo Fisher Scientific). RNA was quantified using a Biospectrophotometer (Eppendorf, Hamburg, Germany). RNA was reverse transcribed using cDNA synthesis kit (Bio-Rad Laboratories). Real time quantitative polymerase chain reaction (qRT-PCR) analysis was performed using gene specific primers and SYBR green master mix (Bio-Rad Laboratories). Beta 2 microglobulin (ß2M) was used as an endogenous control.

2.16. Gelatin Zymography

Gelatinolytic activity of MMP9 and MMP2 upon MYCN inhibition in Y79 and LRB1 cells was determined by substrate gelatin zymography. Equal amount of proteins were separated on 10% SDS-PAGE gels containing 0.1% gelatin (Amresco, Solon, OH, USA). The gels were washed thrice for 15 min each in 2.5% Triton X-100 washing buffer and then incubated in incubation buffer containing 50 mM Tris-HCl, 10 mM CaCl2, 1 M ZnCl2 and 200 mM NaCl, pH 7.5 at 37 °C for 18 to 20 h. Subsequently, gels were stained with Coomassie solution (0.05% Coomassie brilliant blue R-250, in 40% methanol and 10% acetic acid) and destained with destaining solution (20% methanol and 10% acetic acid) to visualize the clear zones of gelatinolytic activity of MMPs against the blue background.

2.17. Statistical Analysis

Data were presented as the mean ± SEM and statistically significant differences were identified with Student’s t test as indicated in the figure legends.

3. Results

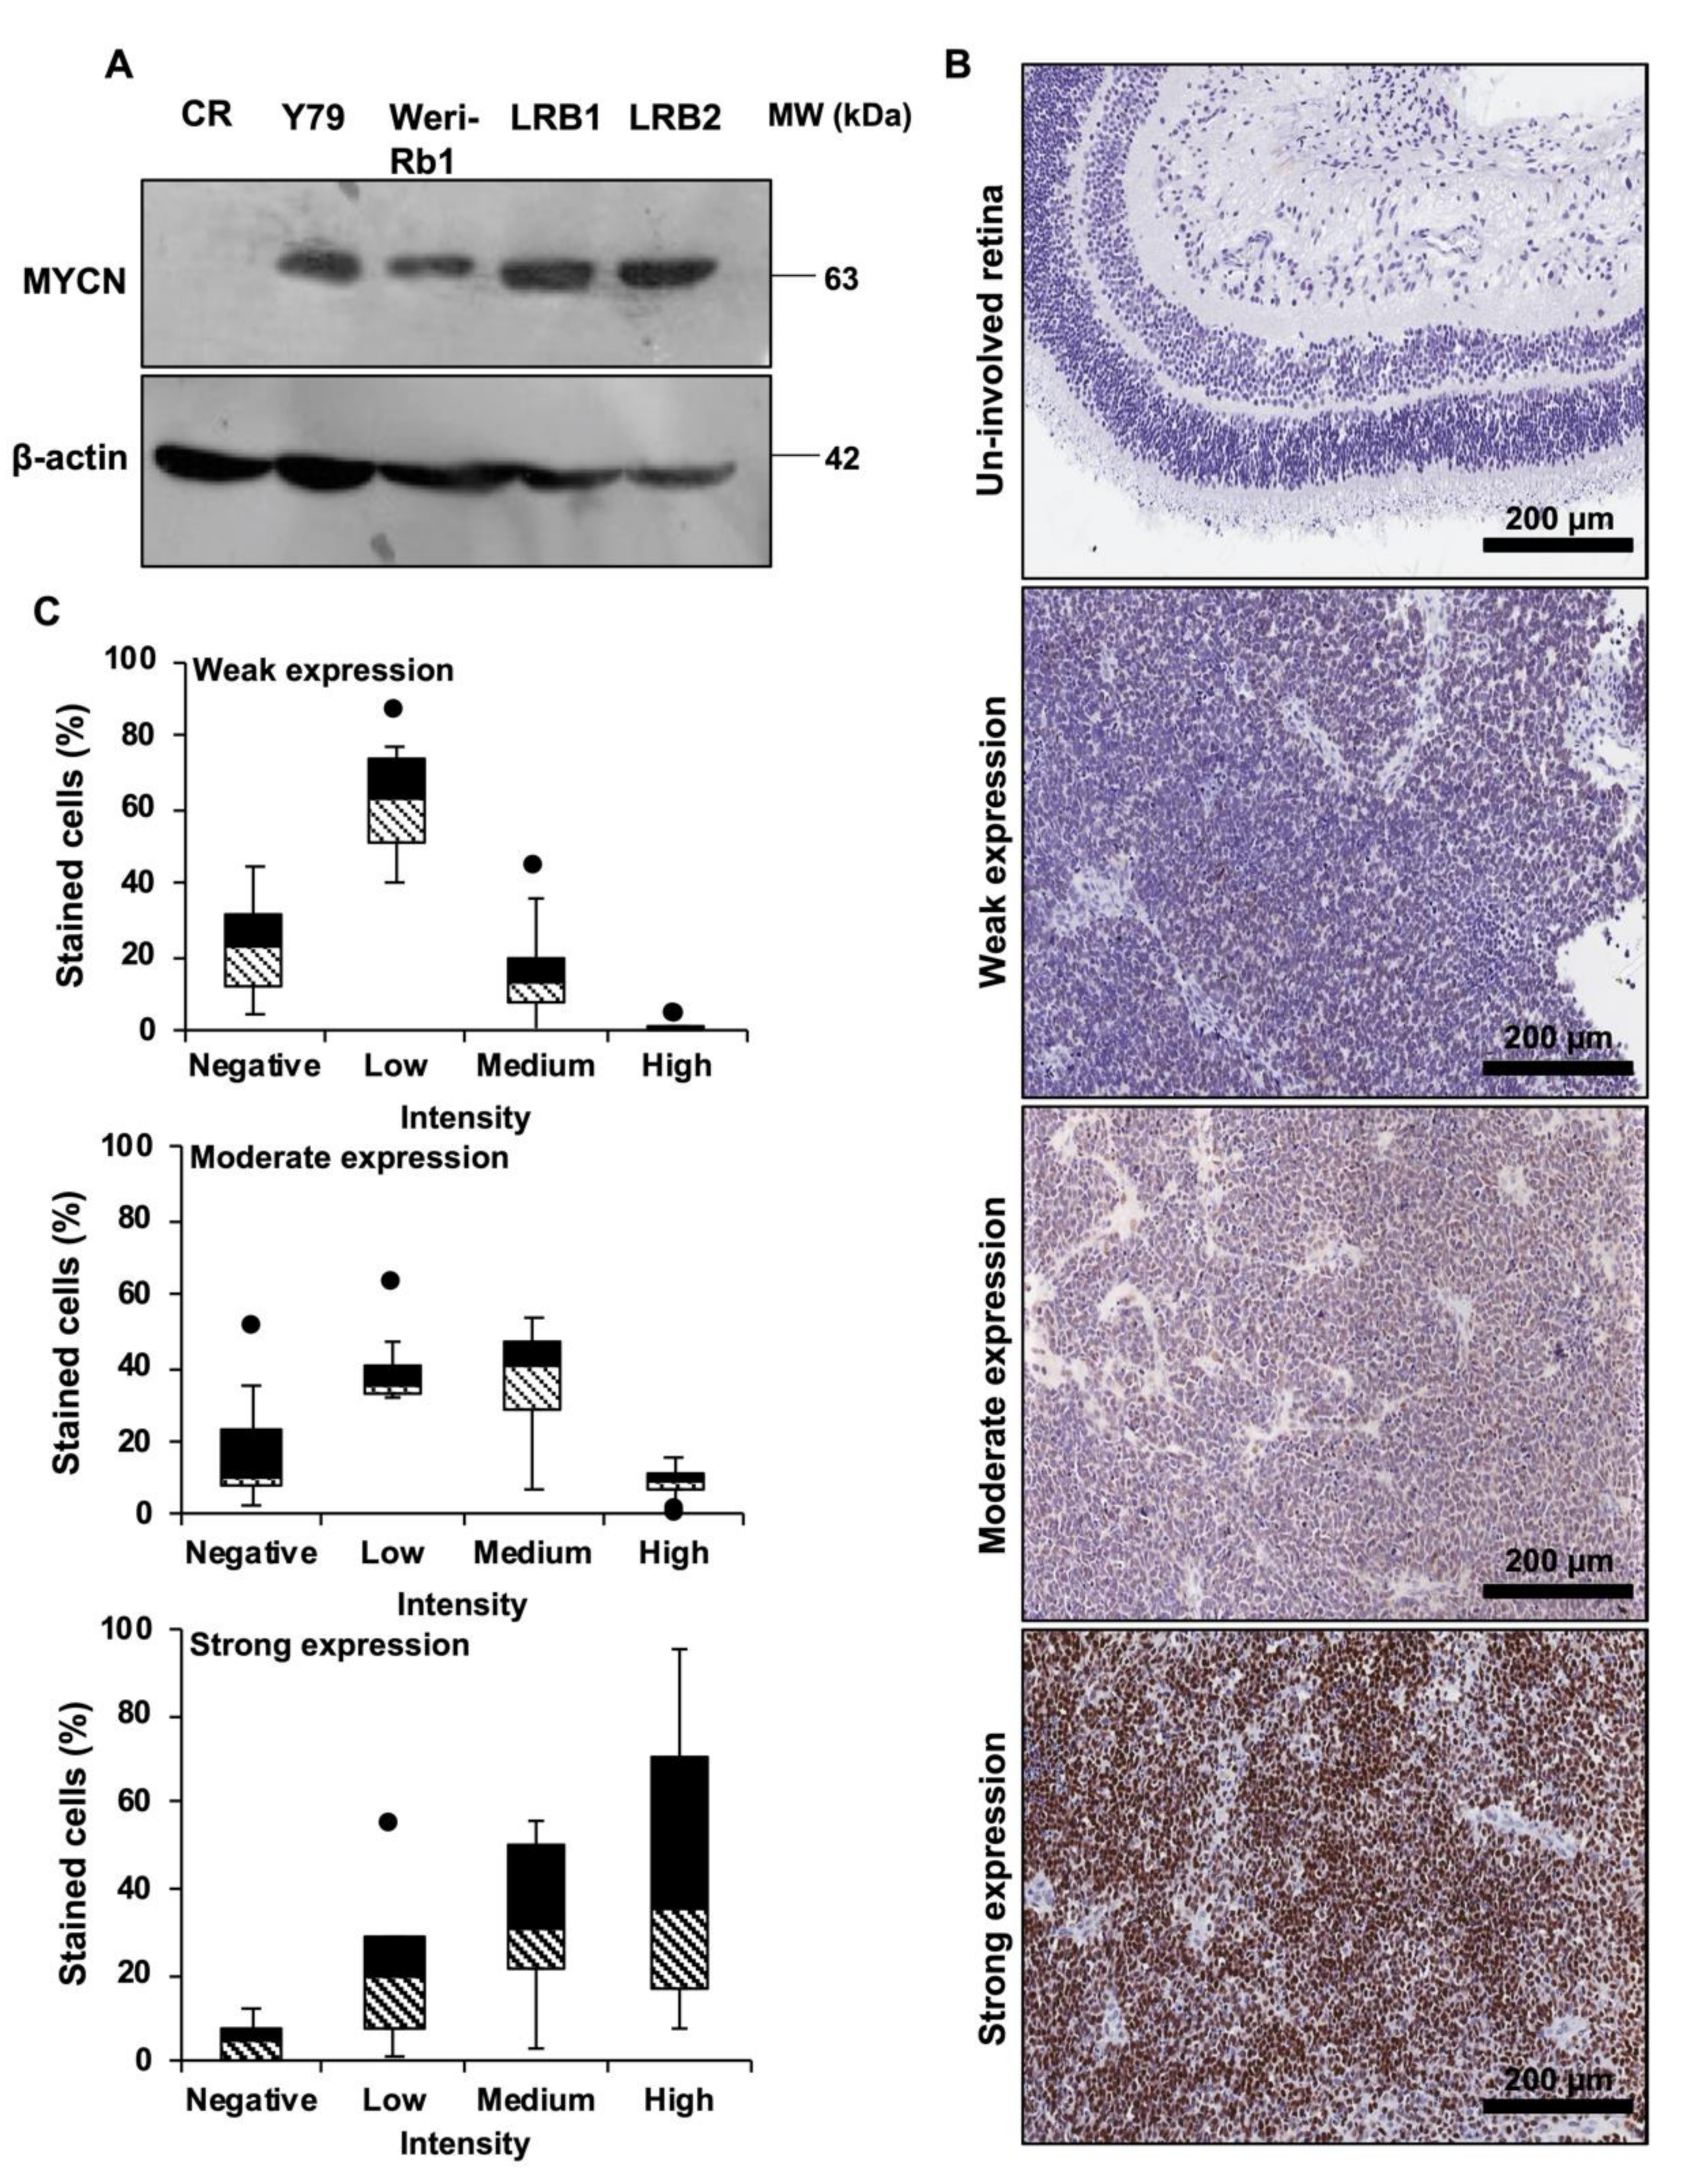
3.1. Overexpression of MYCN in Cell Lines and Enucleated Patient Specimens of Human Retinoblastoma

MYCN protein expression in human RB cell lines Y79 and Weri-Rb1 and patient derived cells LRB1 and LRB2 was determined by immunoblotting and compared it to control retina. Elevated expression of MYCN protein was observed in human RB cell lines (Figure 1A, Full blot in Figure S6). However, Weri-RB1 had relatively lower expression of MYCN compared to Y79. This could be due to gain of MYCN in Weri-RB1 and amplification in Y79 [32]. LRB1 and Y79 cells had similar expression of MYCN and these two cell lines were used in further experiments. Next, the expression level of MYCN protein was evaluated in archived RB tissue specimens (n = 58) by immunohistochemical staining and positive staining for MYCN was observed in 36 samples (62.06%). The scoring of IHC slides based on the intensity and extent of positive expression was carried out as described previously [30]. Among the 36 positively stained samples, weak, moderate and strong expression of MYCN was observed in 14 (38.88%), 13 (36.11%) and 9 (25%) specimens, respectively. No expression of MYCN protein was observed in the adjacent conserved retina. The typical microscopic images of the stained tissue samples (Figure 1B) with their respective distribution of positively stained cells based on intensity score are shown (Figure 1C). The extent of MYCN expression was correlated with demographical parameters and histological risk factors such as optic nerve, choroidal, anterior chamber and scleral invasion and no statistically significant association was found (Table 1).

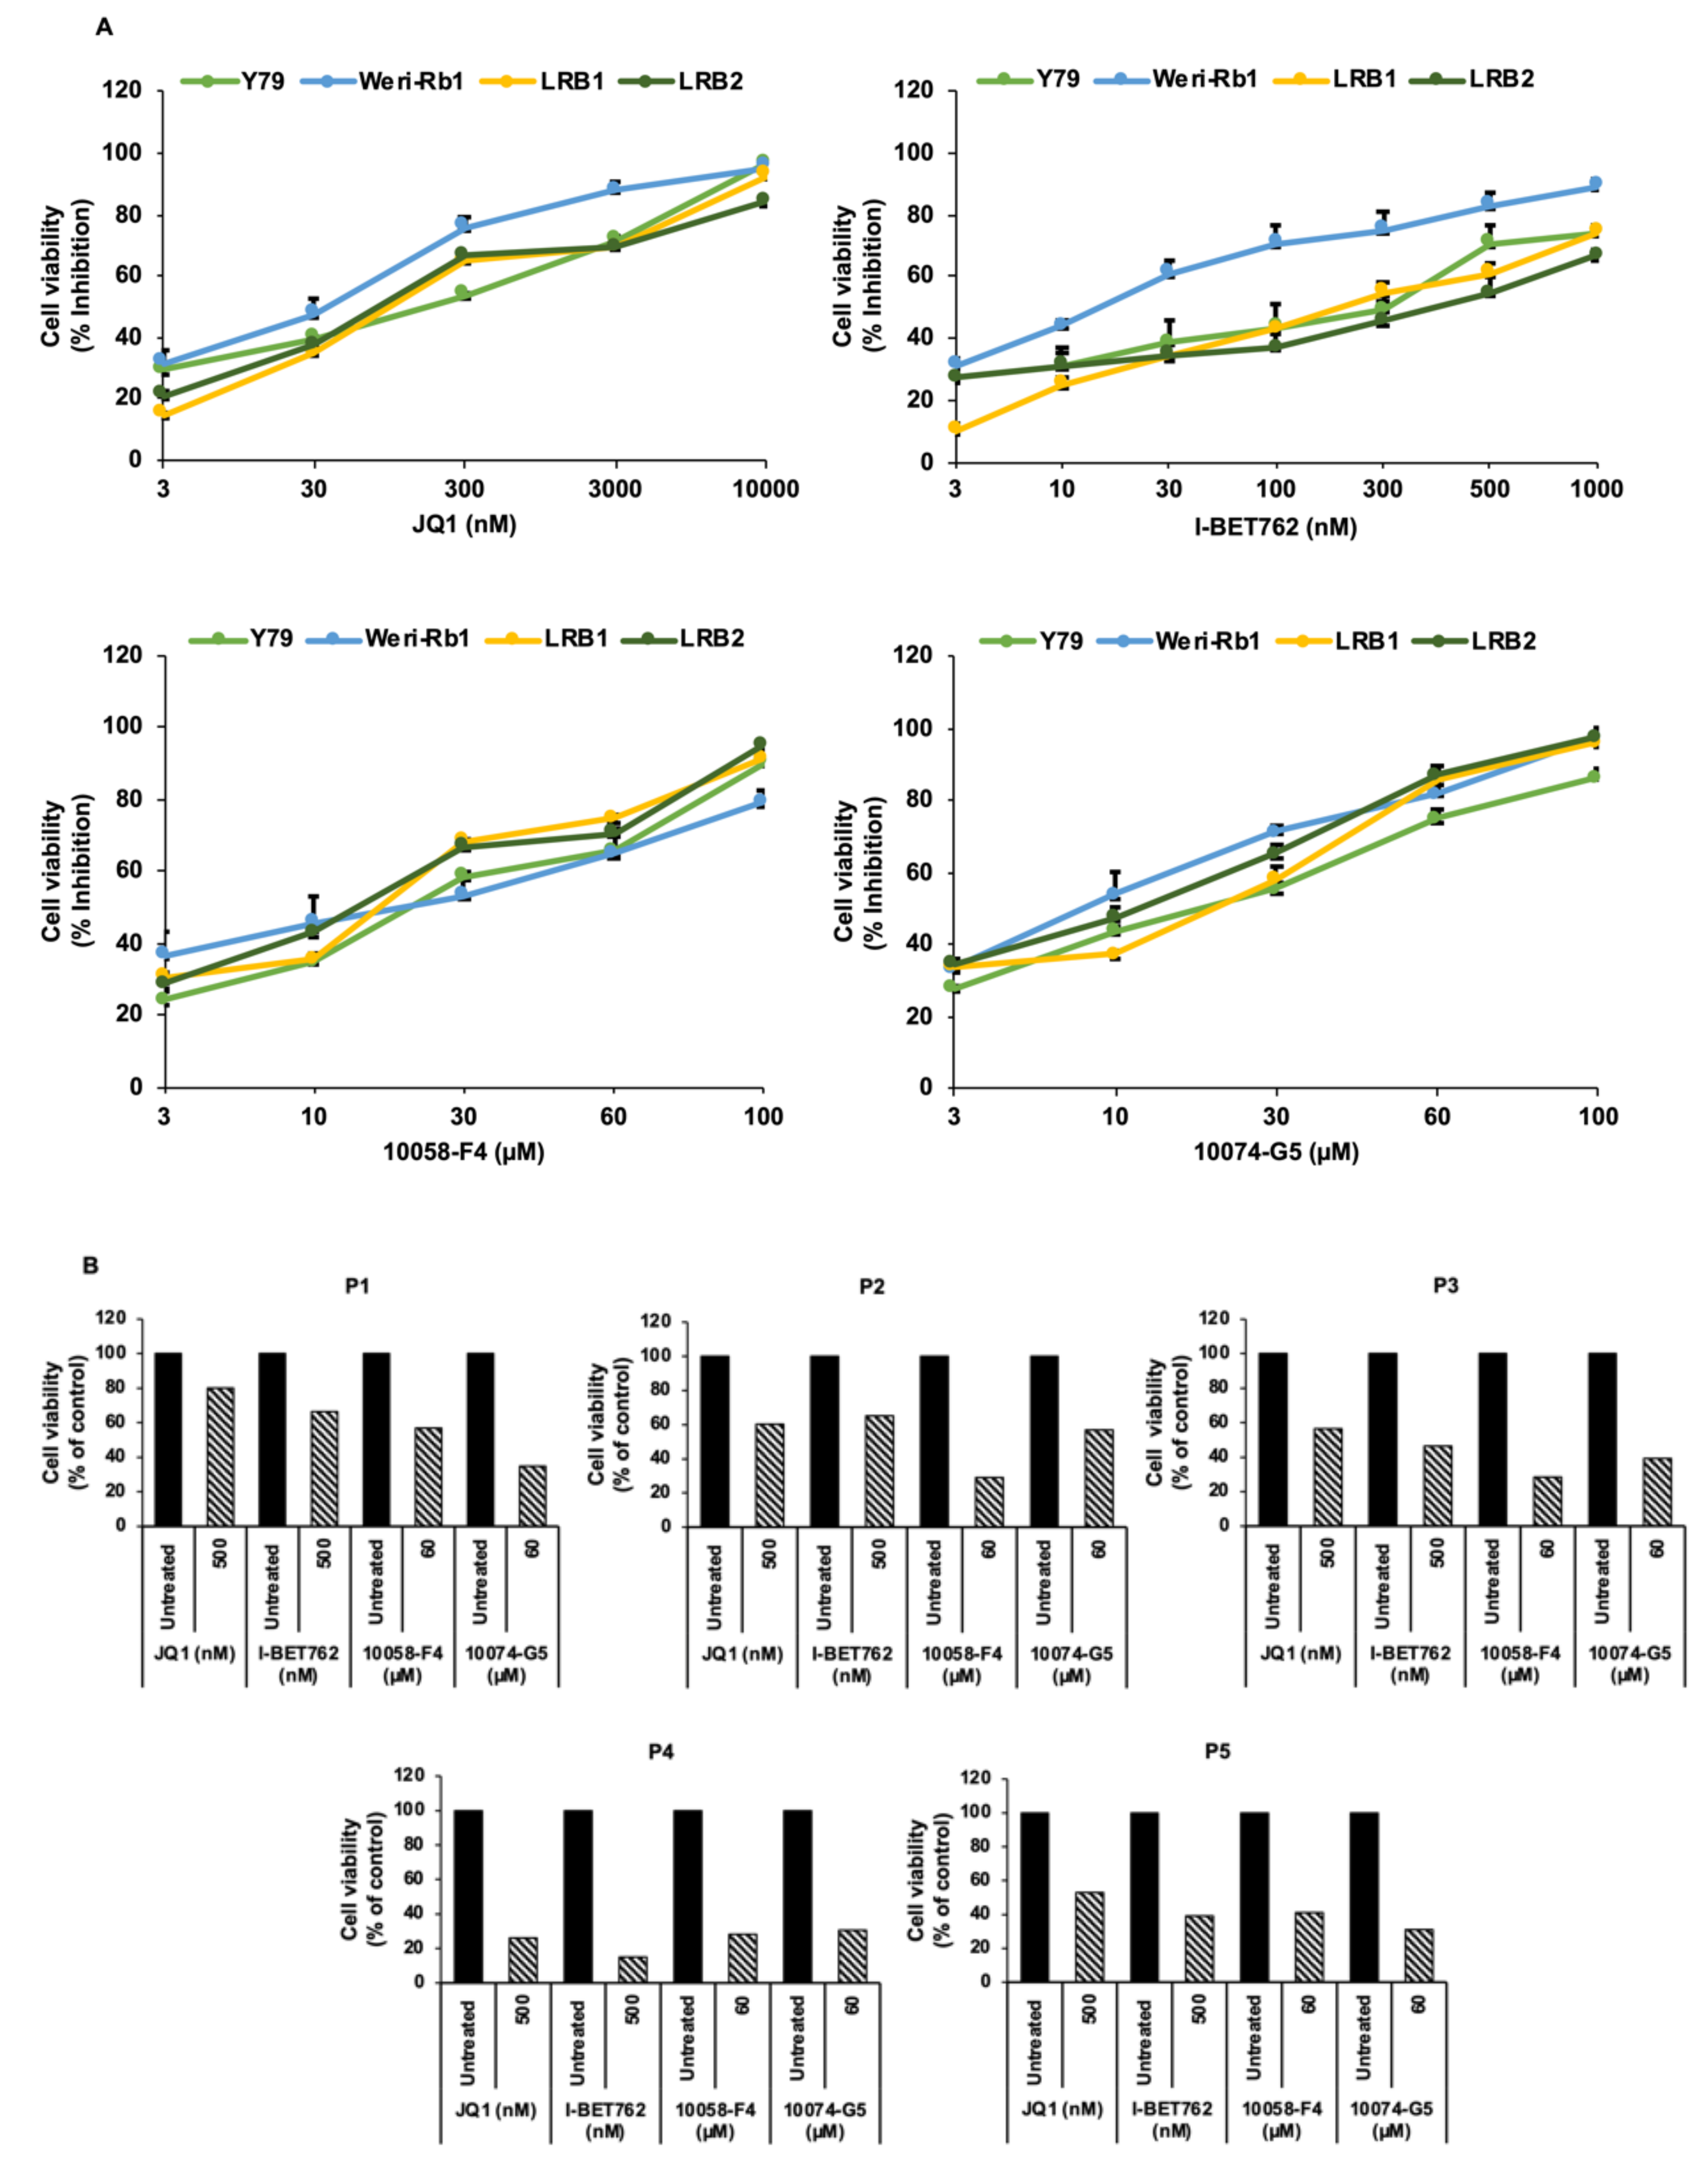
3.2. Pharmacological Inhibition of MYCN Led to Decreased RB Cell Viability

We next investigated the inhibition of MYCN as a therapeutic strategy in RB cells by using small molecule inhibitors. We have employed inhibitors based on two different mechanisms of action; 1. bromodomain inhibitors, JQ1 and I-BET762, and 2. inhibitors of MYC-MAX interaction, 10058-F4 and 10074-G5. The RB cell lines Y79 and Weri-Rb1 and patient derived cells LRB1 and LRB2 were treated with the above-mentioned inhibitors and cell viability was measured. Upon MYCN inhibition, a significant reduction in cell survival was observed in RB cells in a concentration dependent manner in comparison to untreated controls (Figure 2A). The IC50 values of all the pharmacological inhibitors for each cell line were determined and are shown in Table S1. Similarly, the changes in cell viability in response to MYCN inhibition were verified on primary RB patient samples (n = 5) that showed MYCN expression and found to show reduction in cell viability in similar manner as cell lines (Figure 2B). As the tumor sample available was limited, we could not test many concentrations. We selected drug concentration for each individual drug at which, we observed around 70–80% reduction in cell viability in cell lines. Further, to investigate the effects of MYCN inhibitors on untransformed cells, we treated retinal pigment epithelial cells (ARPE-19) with concentrations of each drug effective against RB cells and found that MYCN inhibition did not significantly change the viability of ARPE-19 cells (Figure S1).

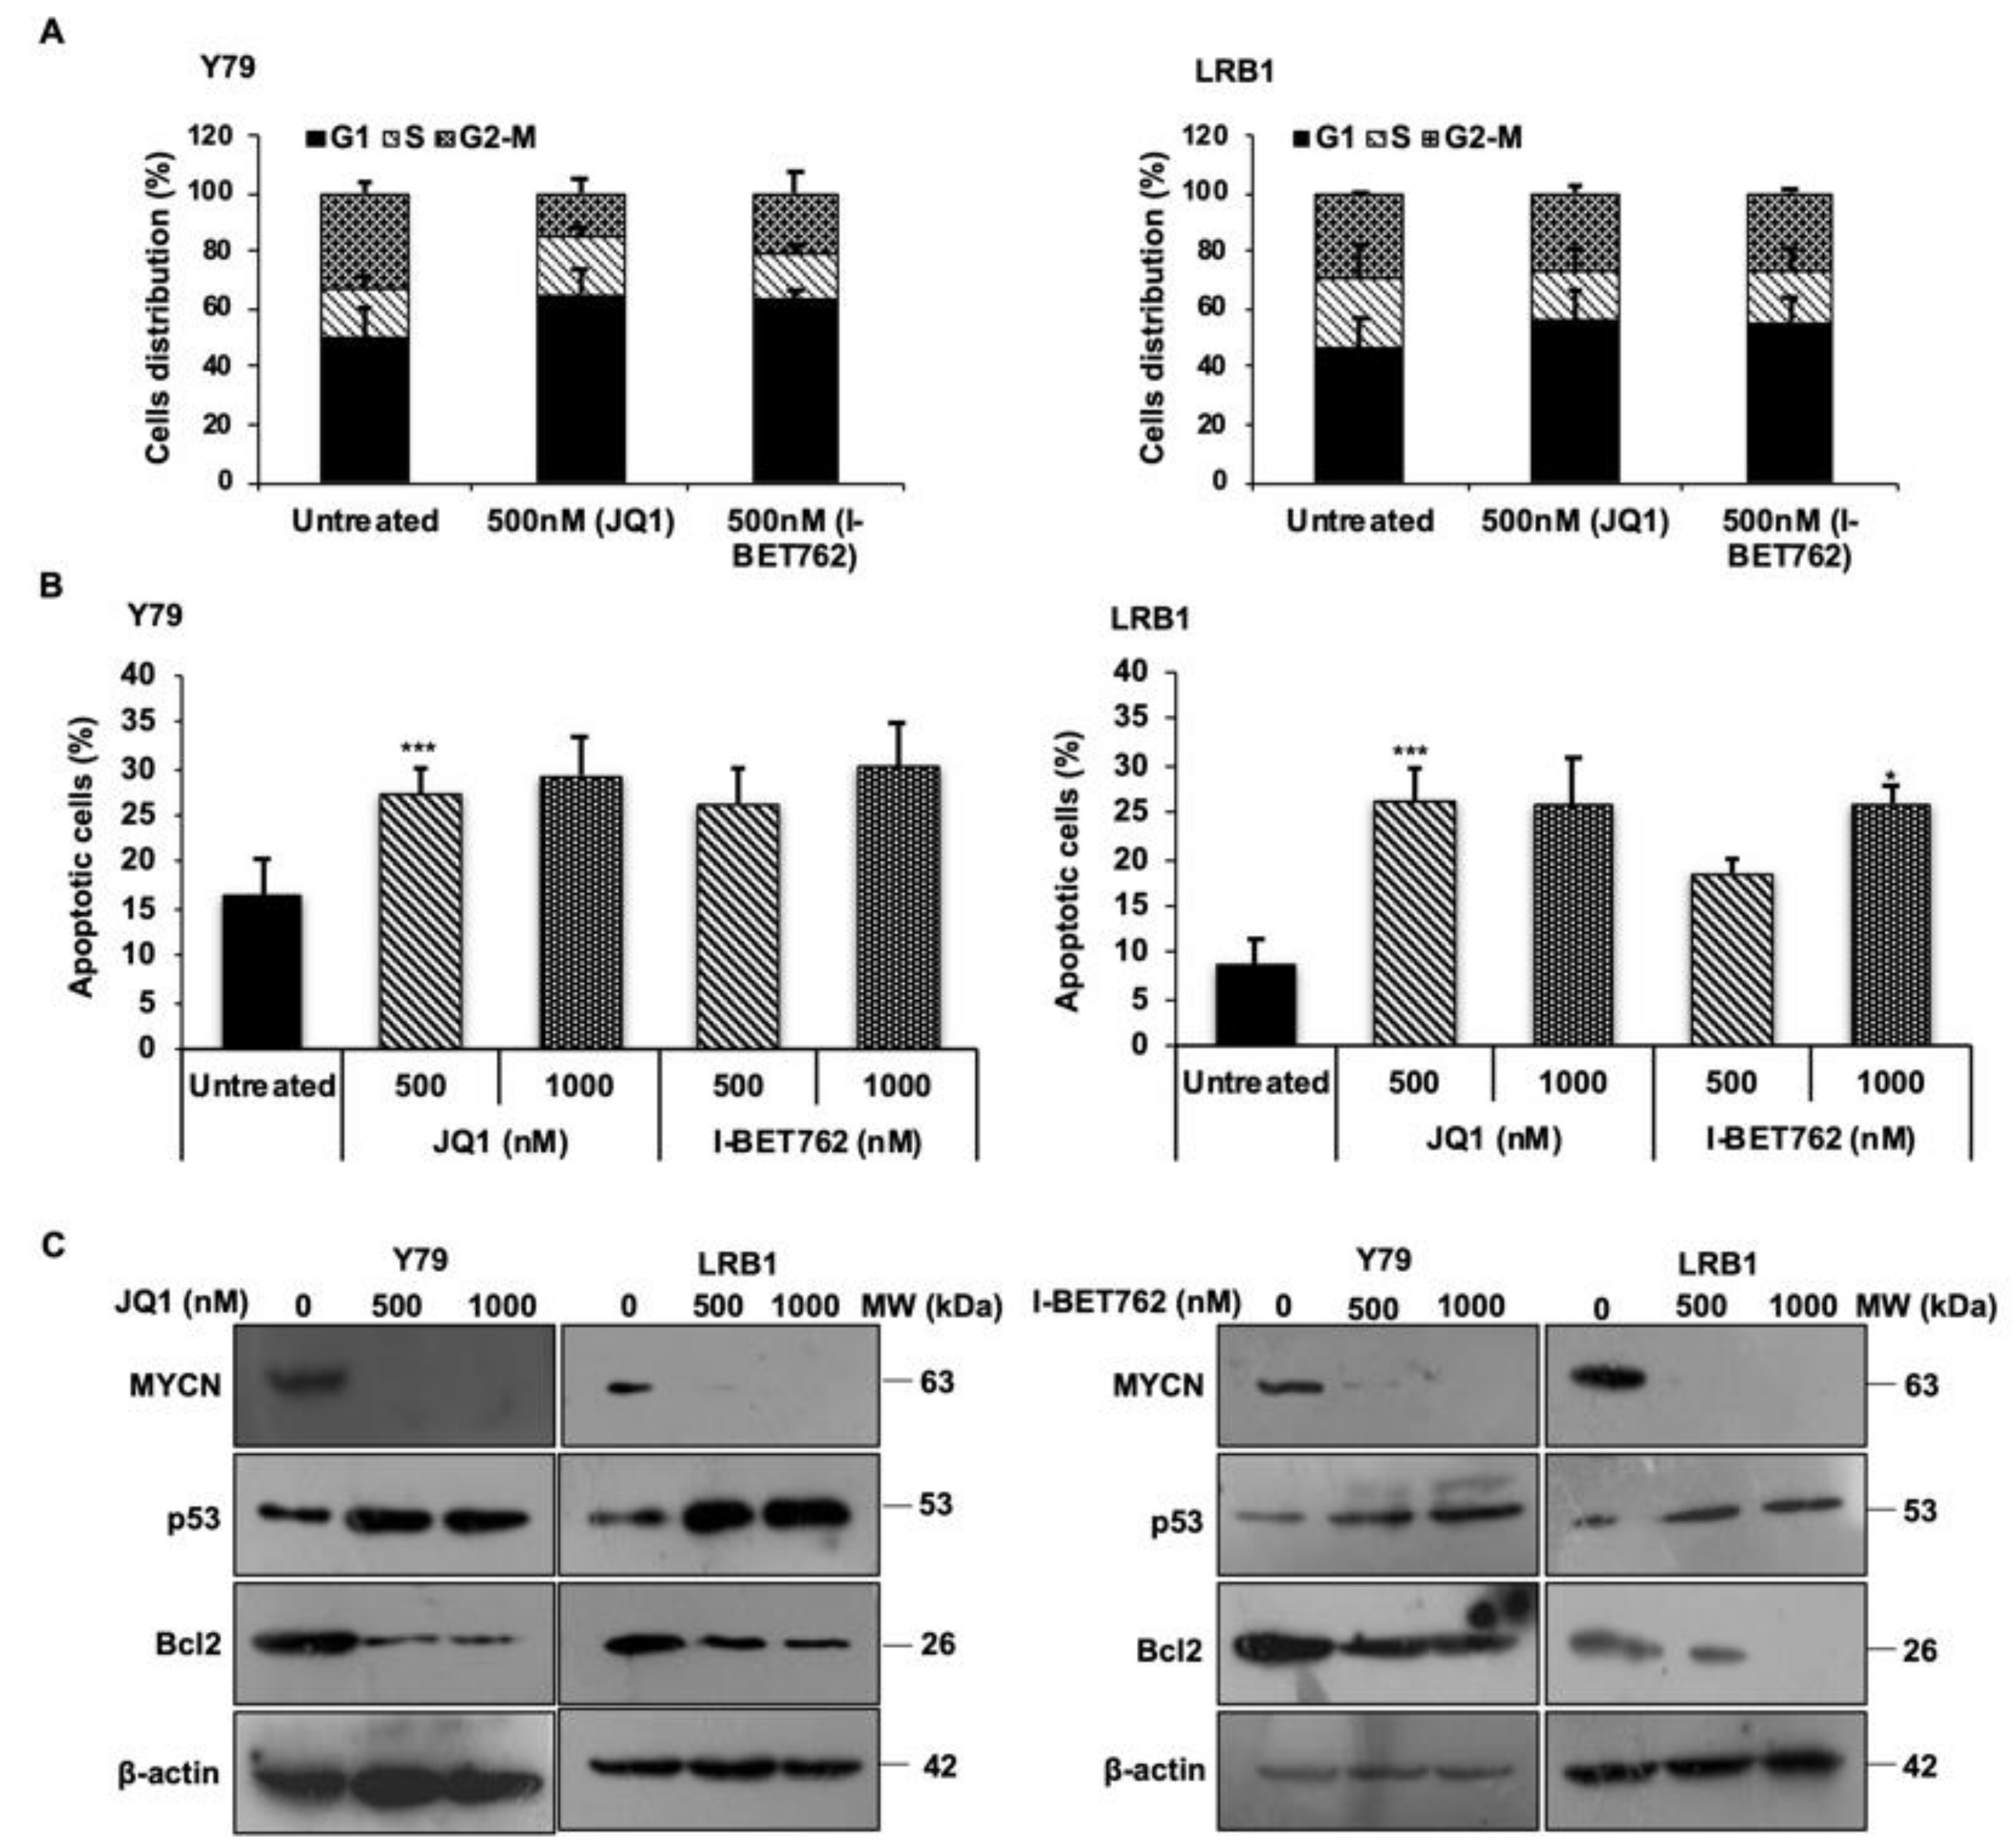
3.3. MYCN Inhibition Induces Cell Cycle Arrest at G0/G1 Phase and Triggers Apoptosis in RB Cells

To evaluate the effects of MYCN inhibition on RB cell cycle progression, we performed cell cycle analysis using PI staining. Y79 and LRB1 cells treated with JQ1 and I-BET762 were subjected to flow cytometry evaluation. It was found that cells were accumulated in G0/G1 phase of the cell cycle as shown in Figure 3A. Similar results were obtained in Y79 and LRB1 cells treated with 10058-F4 and 10074-G5 (Figure S2A). Further, MYCN inhibition also resulted in increased apoptosis in Y79 and LRB1 cells compared to untreated control cells (Figure 3B and Figure S2B). The protein levels of MYCN were measured by immunoblotting and the results showed that MYCN levels were decreased in response to treatment with JQ1 and I-BET762 inhibitors (Figure 3C, full blots in Figure S6). Additionally, the levels of p53 and Bcl2 proteins were evaluated in Y79 and LRB1 cells treated with JQ1 and I-BET762 inhibitors. The data showed a diminished expression of Bcl2 protein and an elevated expression of p53 protein upon MYCN inhibition (Figure 3C, full blots in Figure S6), which further corroborates that MYCN inhibition triggers apoptosis possibly via the induction of p53 mediated apoptotic pathway in RB.

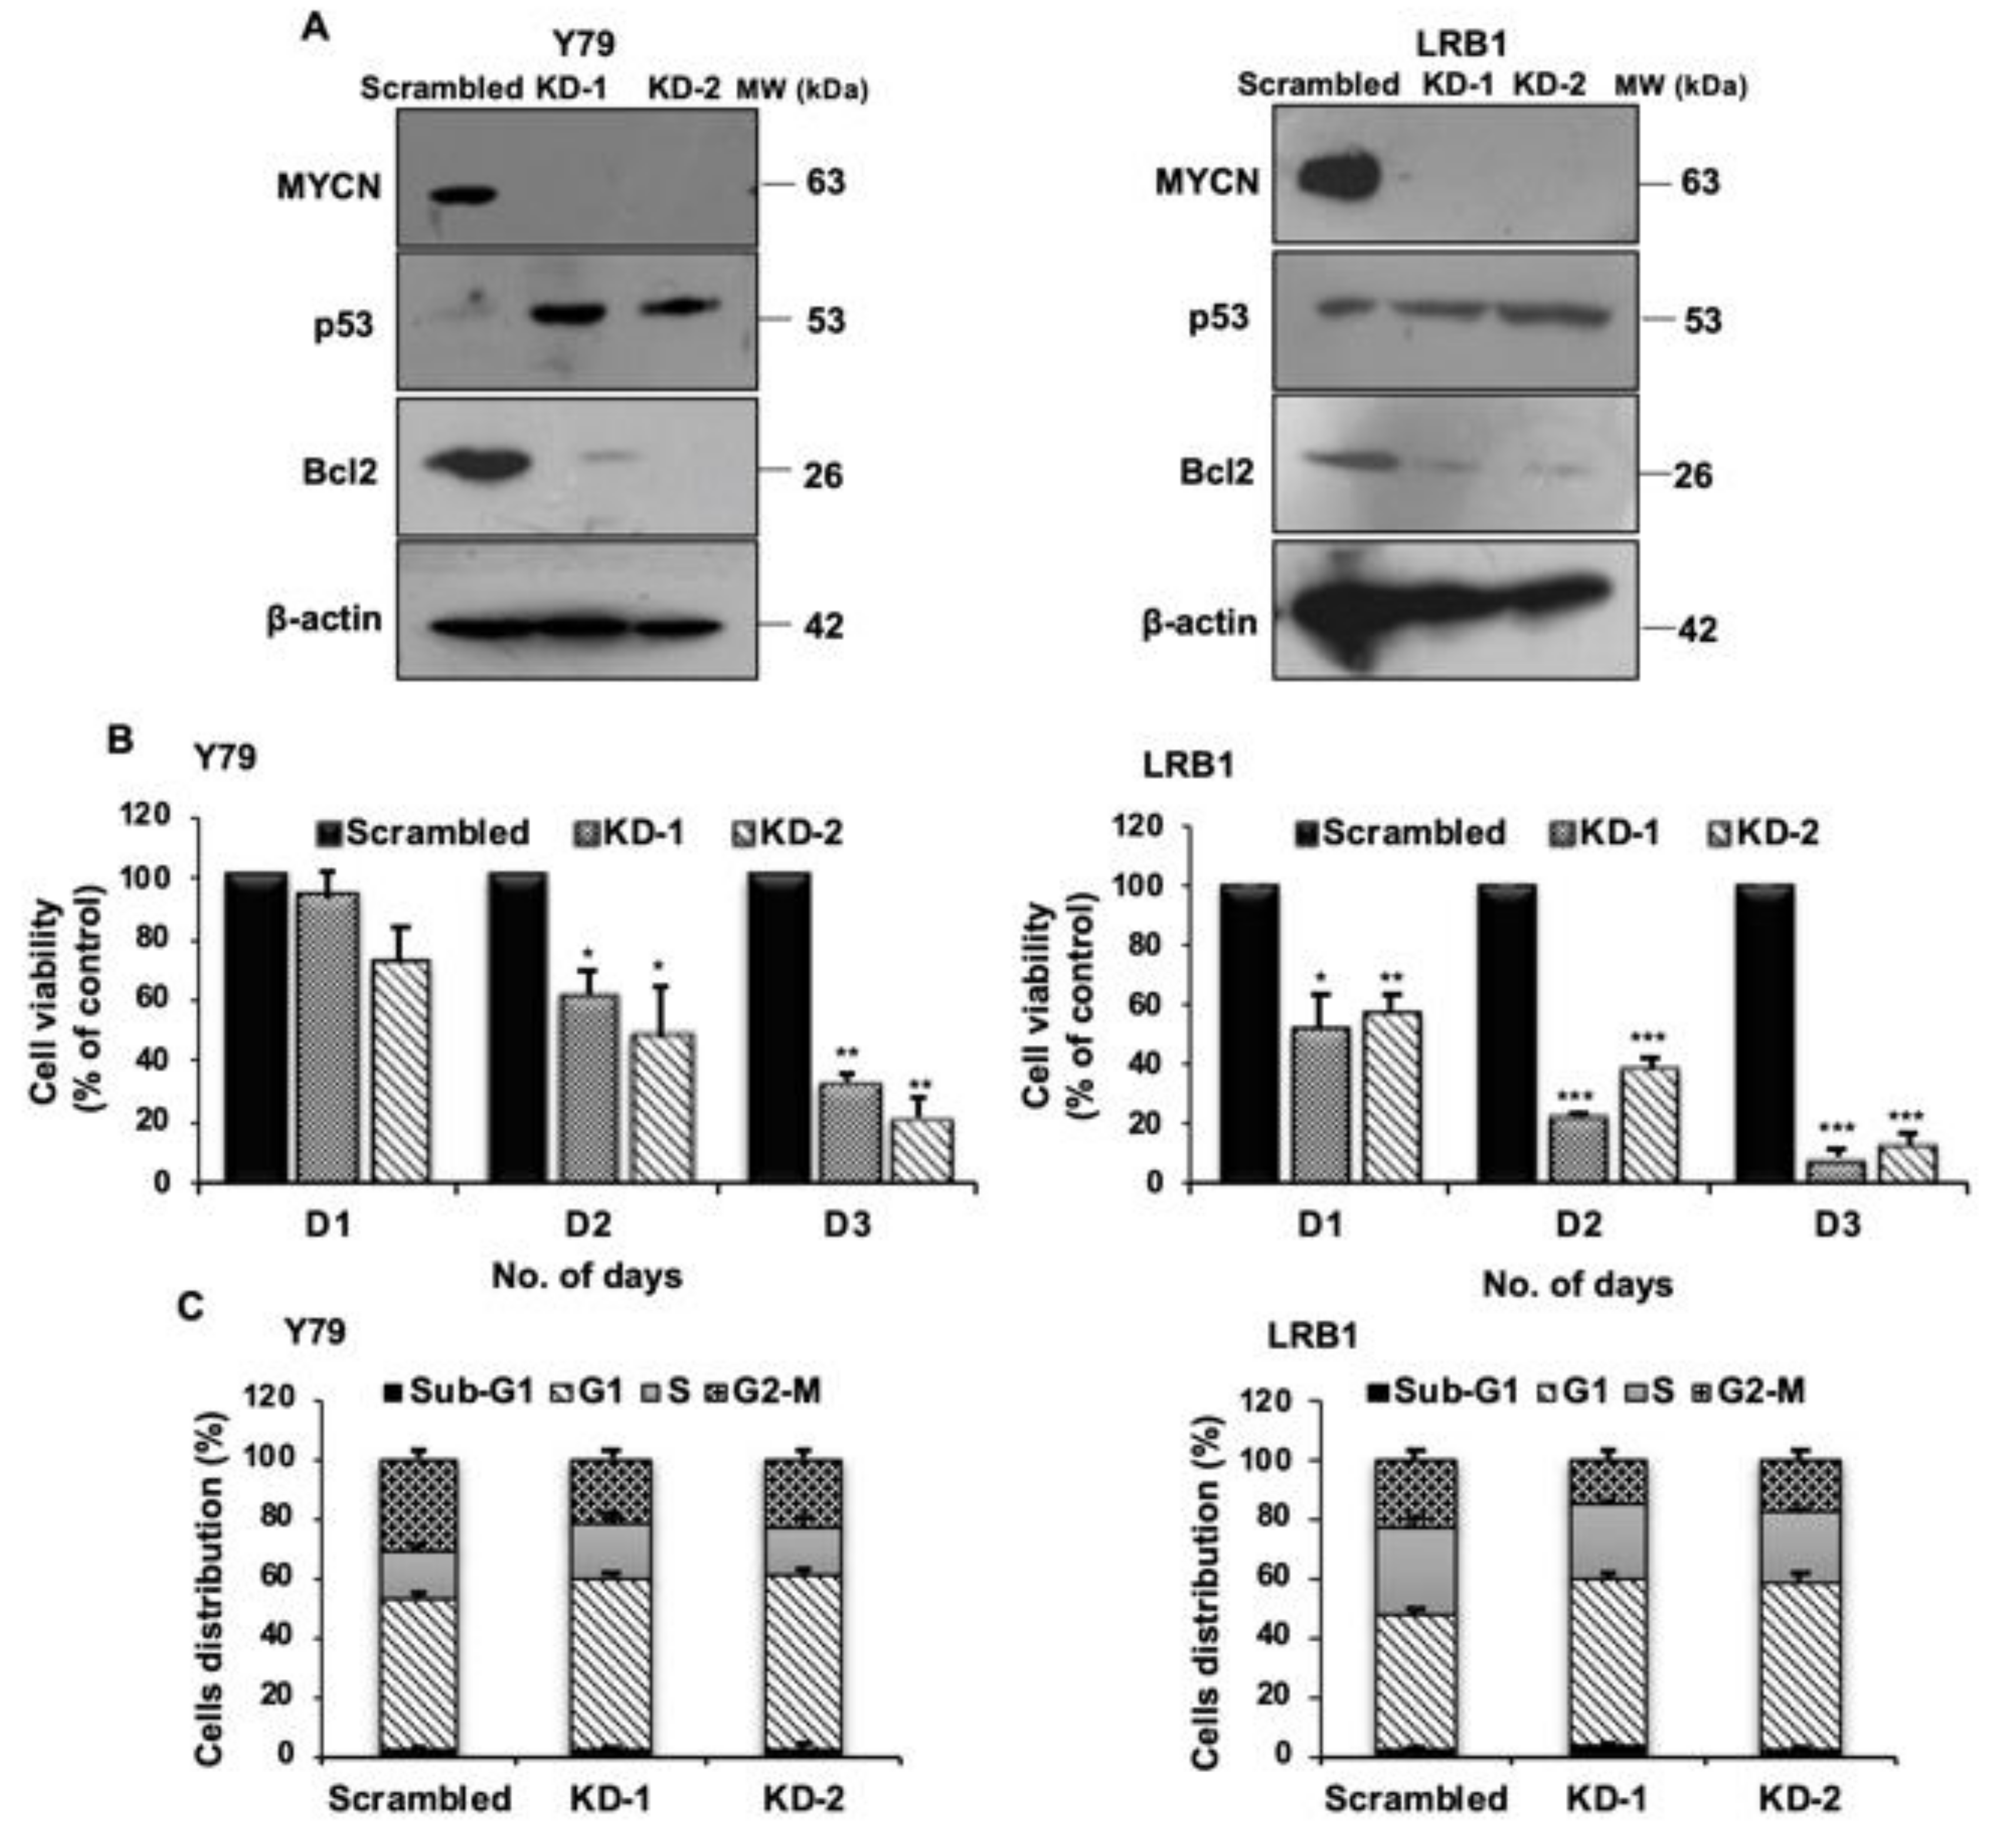
3.4. shRNA Mediated Knockdown of MYCN Inhibits Cell Proliferation in RB

Next, to confirm the role of MYCN in RB, MYCN was targeted using shRNA mediated lentiviral knockdown in Y79 and LRB1 cells. Two shRNA constructs (KD-1 and KD-2) targeting MYCN were used in the study. Cells transduced with scrambled shRNA served as control. MYCN knockdown was confirmed by immunoblotting (Figure 4A, full blots in Figure S6). The effects of MYCN knockdown on cell viability of Y79 and LRB1 cells were determined up to 3 days. A significant decrease in cell viability was observed in Y79 cells on day 2 and day 3. LRB1 cells were more sensitive to shRNA knockdown compared to Y79 cells (Figure 4B). Further, cell cycle analysis was performed, and the results showed accumulation of cells in G0/G1 phase (Figure 4C) suggesting the role of MYCN in RB cell growth and proliferation. Additionally, the levels of pro-apoptotic p53 and anti-apoptotic Bcl2 proteins were assessed upon MYCN knockdown in RB cells. An elevated expression of p53 and reduced expression of Bcl2 was observed (Figure 4A, full blots in Figure S6).

3.5. Microarray Analysis upon MYCN Knockdown

To understand the molecular functions and pathways regulated by MYCN in RB, we performed microarray analysis of Y79 cells with MYCN knockdown and scrambled controls. The expression of various genes was profiled using Agilent’s microarray platform Human GXP 8X60k. The dataset was submitted in the repository of “Gene Expression Omnibus” with the accession number GSE168903, https://www.ncbi.nlm.nih.gov/geo/query/acc.cgi?acc=GSE168903, accessed on 14 October 2021.

3.5.1. Identification of Differentially Expressed Genes (DEGs), Gene Ontology (GO), Enriched Functions and Pathway Analysis

Significant genes upregulated with fold change ≥ 1 (logbase2) and downregulated with fold change ≤ −1 (logbase2) in the MYCN knockdown samples with respect to scrambled controls were identified. There were 12,642 mRNAs considered to be differentially expressed between scrambled and KD-1 group. Among the differential mRNAs, 7388 were downregulated and 5254 were upregulated (Figure 5A). Similarly, 11,731 mRNAs were found to be differentially expressed between scrambled and KD-2 group, of which, 6601 mRNAs were downregulated and 5130 mRNAs were upregulated (Figure S3A).
To investigate the functions of the identified DEGs, gene enrichment analysis was performed by online software tool DAVID. Next, KEGG pathway analysis was performed to identify potential pathways regulated by the DEGs in RB. A total of 14 significantly enriched pathways for downregulated DEGs were identified and represented graphically (Figure 5B and Figure S3B). The downregulated DEGs were further classified into sub-functional groups including molecular function (MF), cellular component (CC) and biological process (BP). The top 10 significantly enriched GO terms in each of the functional groups were identified (Figure 5C and Figure S3C).

3.5.2. Screening of the Identified DEGs Related to Glucose Metabolism and Migration

Among the significantly enriched pathways of the DEGs identified by microarray analysis, our study was focused mainly on two important pathways: glucose metabolic pathway and migration.

Validation of Identified Metabolic Genes

As altered metabolism is one of the hallmarks of cancers, we specifically screened for significantly downregulated genes involved in glucose metabolism upon MYCN knockdown. Enolase 2 (ENO2), Hexokinase 2 (HK2), Trios phosphate isomerase 1 (TPI1), Pyruvate dehydrogenase kinase 1 (PDK1), Aldolase C (ALDOC), 6-phosphofructo-2-kinase/fructose-2,6-biphosphatase 3 (PFKFB3), 6-phosphofructo-2-kinase/fructose-2,6-biphosphatase 4 (PFKFB4), Lactate Dehydrogenase A (LDHA), Phosphoglycerate kinase 1 (PGK1), Pyruvate kinase M (PKM), Phosphoglycerate mutase 1 (PGAM1) and Phosphoglycerate mutase 4 (PGAM4) were among the top 12 candidate genes that were found to be downregulated upon MYCN knockdown. To confirm the data obtained from microarray analysis, we validated the mRNA expression of the above-mentioned candidate genes by qRT-PCR using gene specific primers (Table S2). The expression of the validated genes in cells with MYCN knockdown compared to scrambled controls was shown to be in agreement with the microarray analysis in Y79 (Figure 6A) and LRB1 cells (Figure S4A). Further, we also verified the expression of DEGs in inhibitor treated Y79 and LRB1 cells (Figure S4B).

Effect of MYCN Inhibition on Metabolic Parameters

To verify the regulation of MYCN on metabolic functions, we evaluated the effects of MYCN inhibition on metabolic parameters such as glucose uptake, lactate production and intracellular ROS. Cells were treated with JQ1 and 10058-F4 for 48 h, stained with 2-NBDG and analyzed by flow cytometry. RB cells showed a significant decrease in glucose uptake levels upon treatment with inhibitors. (Figure 6B). In addition, MYCN inhibition led to decreased ROS levels in RB cells compared to the untreated control cells (Figure 6C). Further, a significant decrease in L-lactate levels was observed in Y79 and LRB1 cells treated with JQ1 and 10058-F4 as well as in MYCN knockdown cells relative to the untreated/scrambled controls (Figure 6D).

MYCN Regulates Genes Involved in Cellular Migration and Metastasis

It is evident from the existing literature that extracellular matrix (ECM) undergoes substantial remodeling during cancer progression and performs a key role in cancer metastasis. Decreased mRNA levels of fibrillin (FBN1), fibronectin (FN1), matrix-metalloproteinase 9 (MMP9) and vascular endothelial growth factor A (VEGFA) were identified in our microarray data analysis, and we have further validated their mRNA expression in RB cells in response to MYCN knockdown. qRT-PCR revealed a decreased expression of FBN1, FN1, MMP9 and VEGFA mRNA compared to the scrambled cells (Figure 7A). Next, to ascertain the effects of MYCN inhibition on RB cell migration, wound healing assay was performed in Y79 with MYCN knockdown. A decreased cellular migration was observed in MYCN knockdown cells compared to scrambled controls (Figure 7B). Additionally, the activity of MMP9 was determined by gelatin zymography and a decrease in gelatinolytic activity of active-MMP9 was observed in Y79 and LRB1 cells treated with JQ1 and I-BET762 compared to the untreated cells (Figure 7C). Overall, our data suggests that targeting MYCN may limit tumor cell migration in RB possibly via downregulating the expression of ECM proteins and VEGFA.

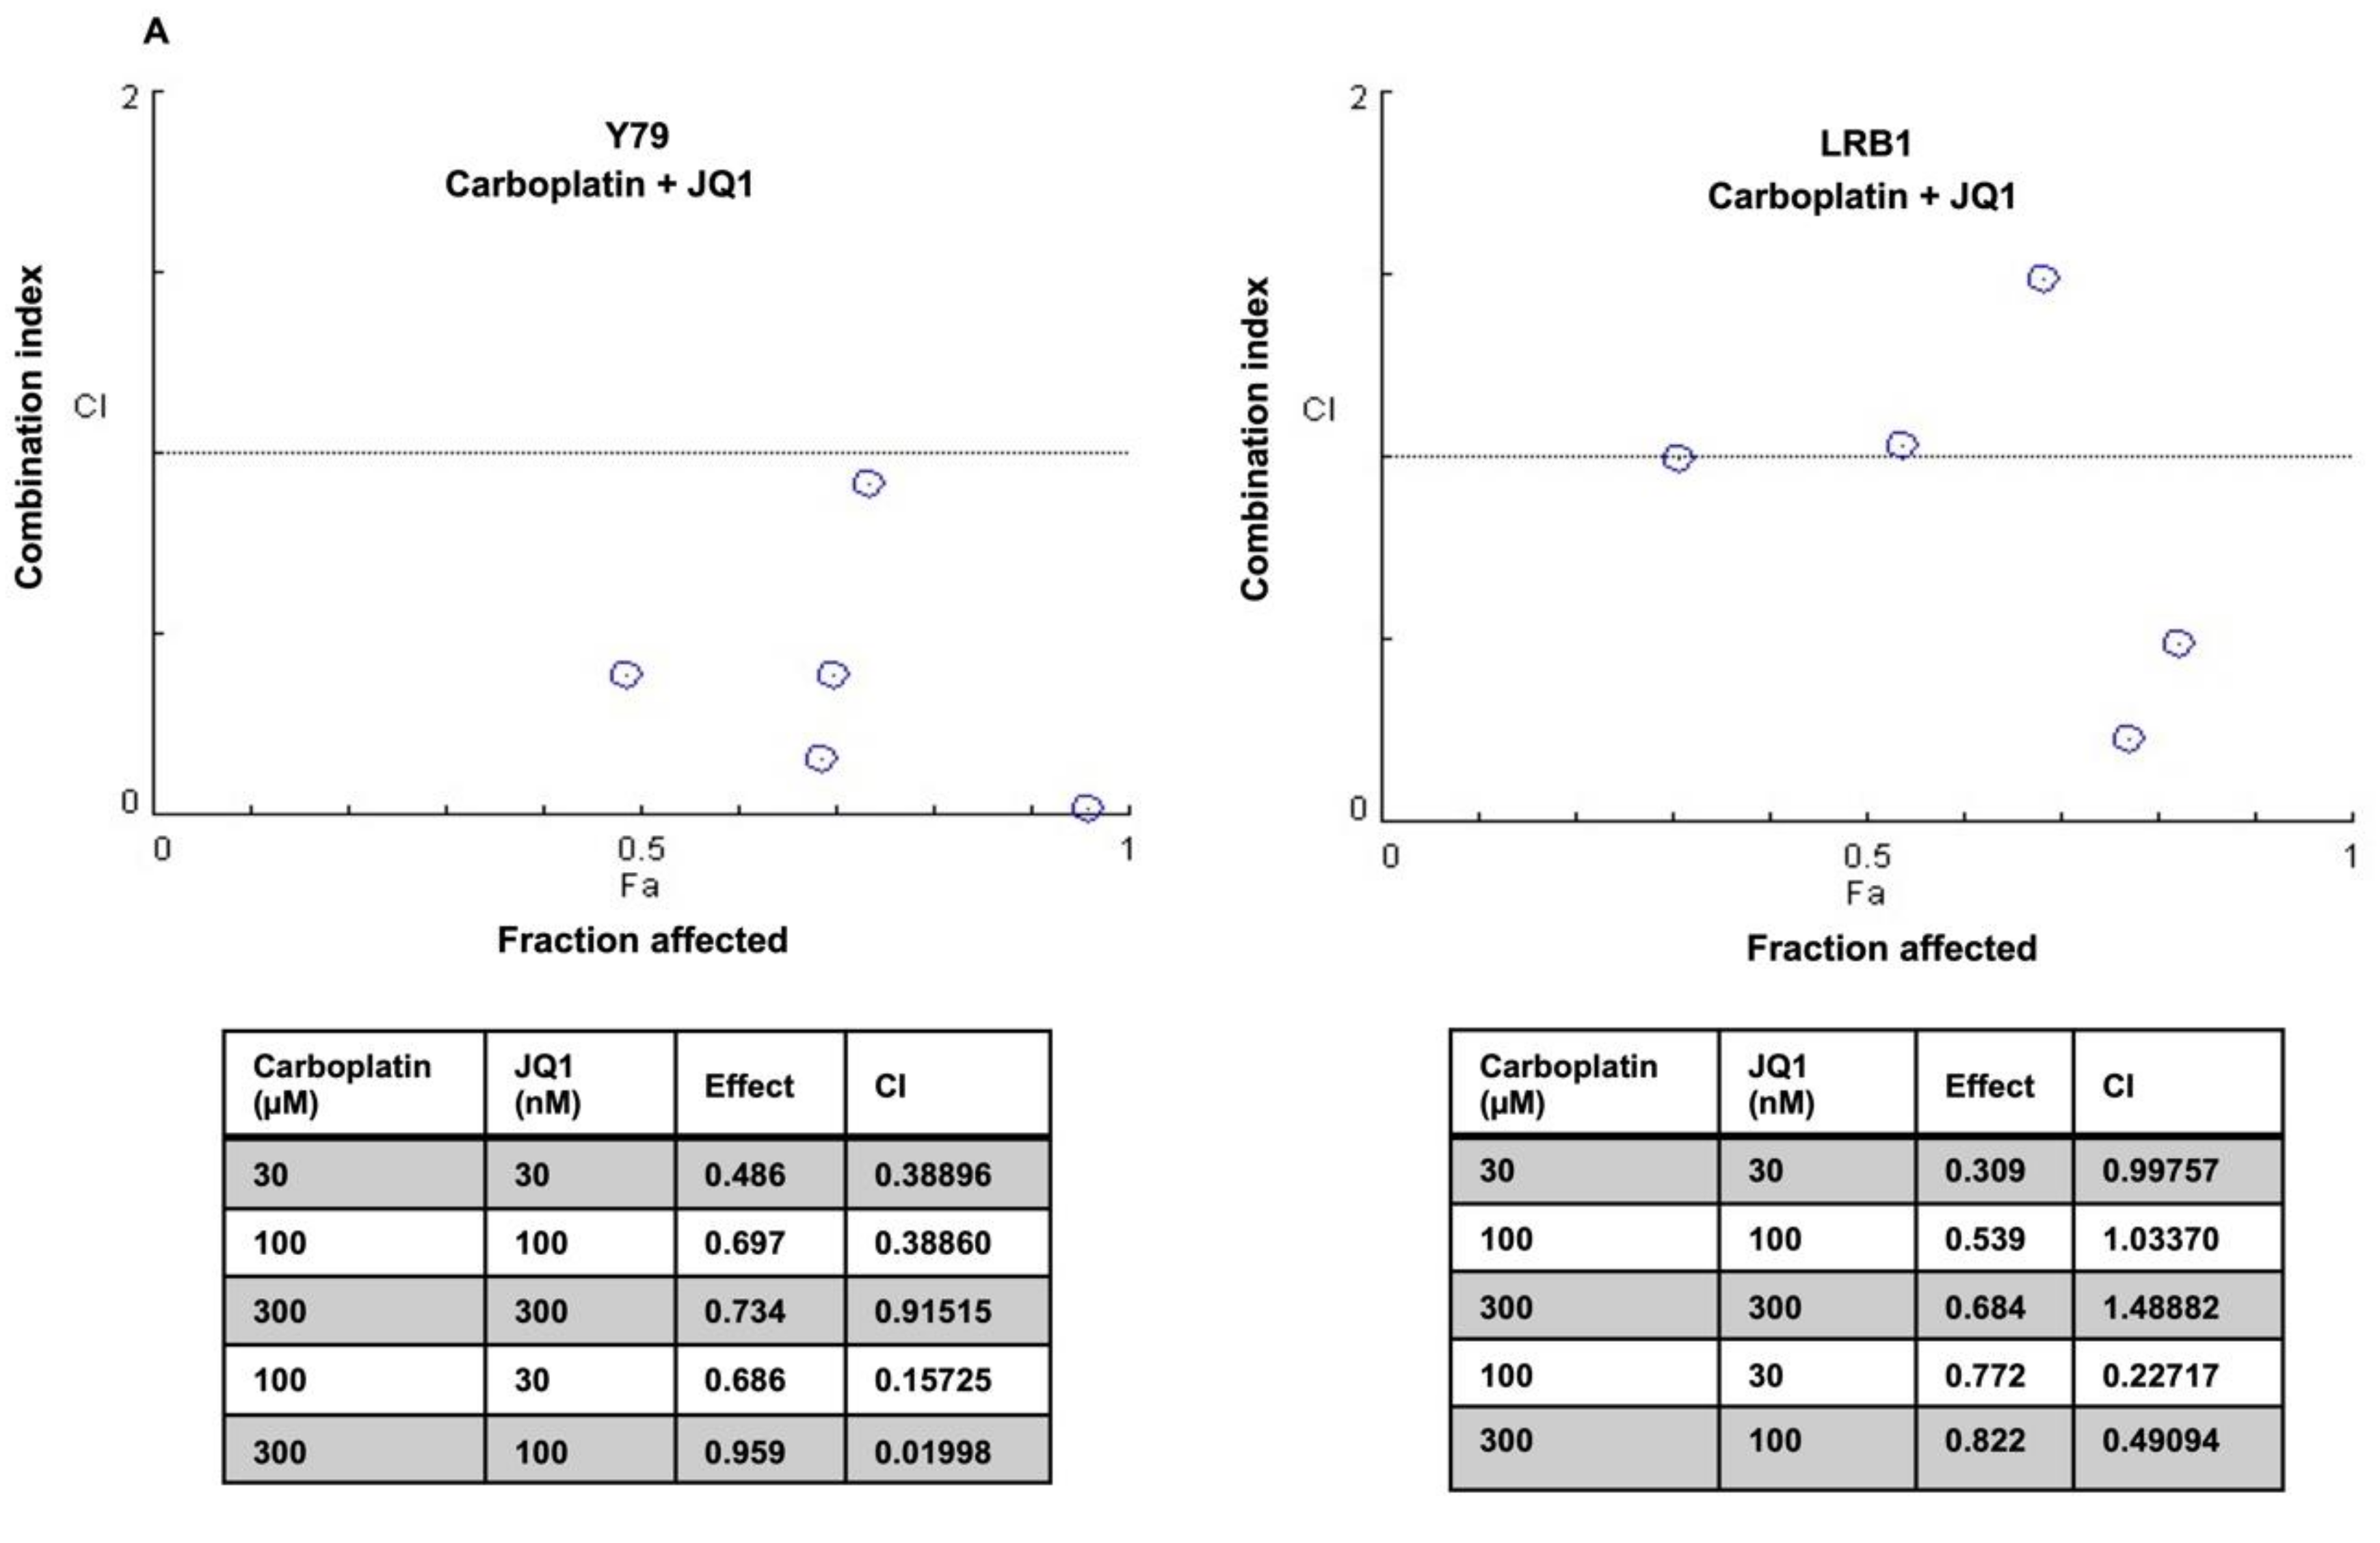
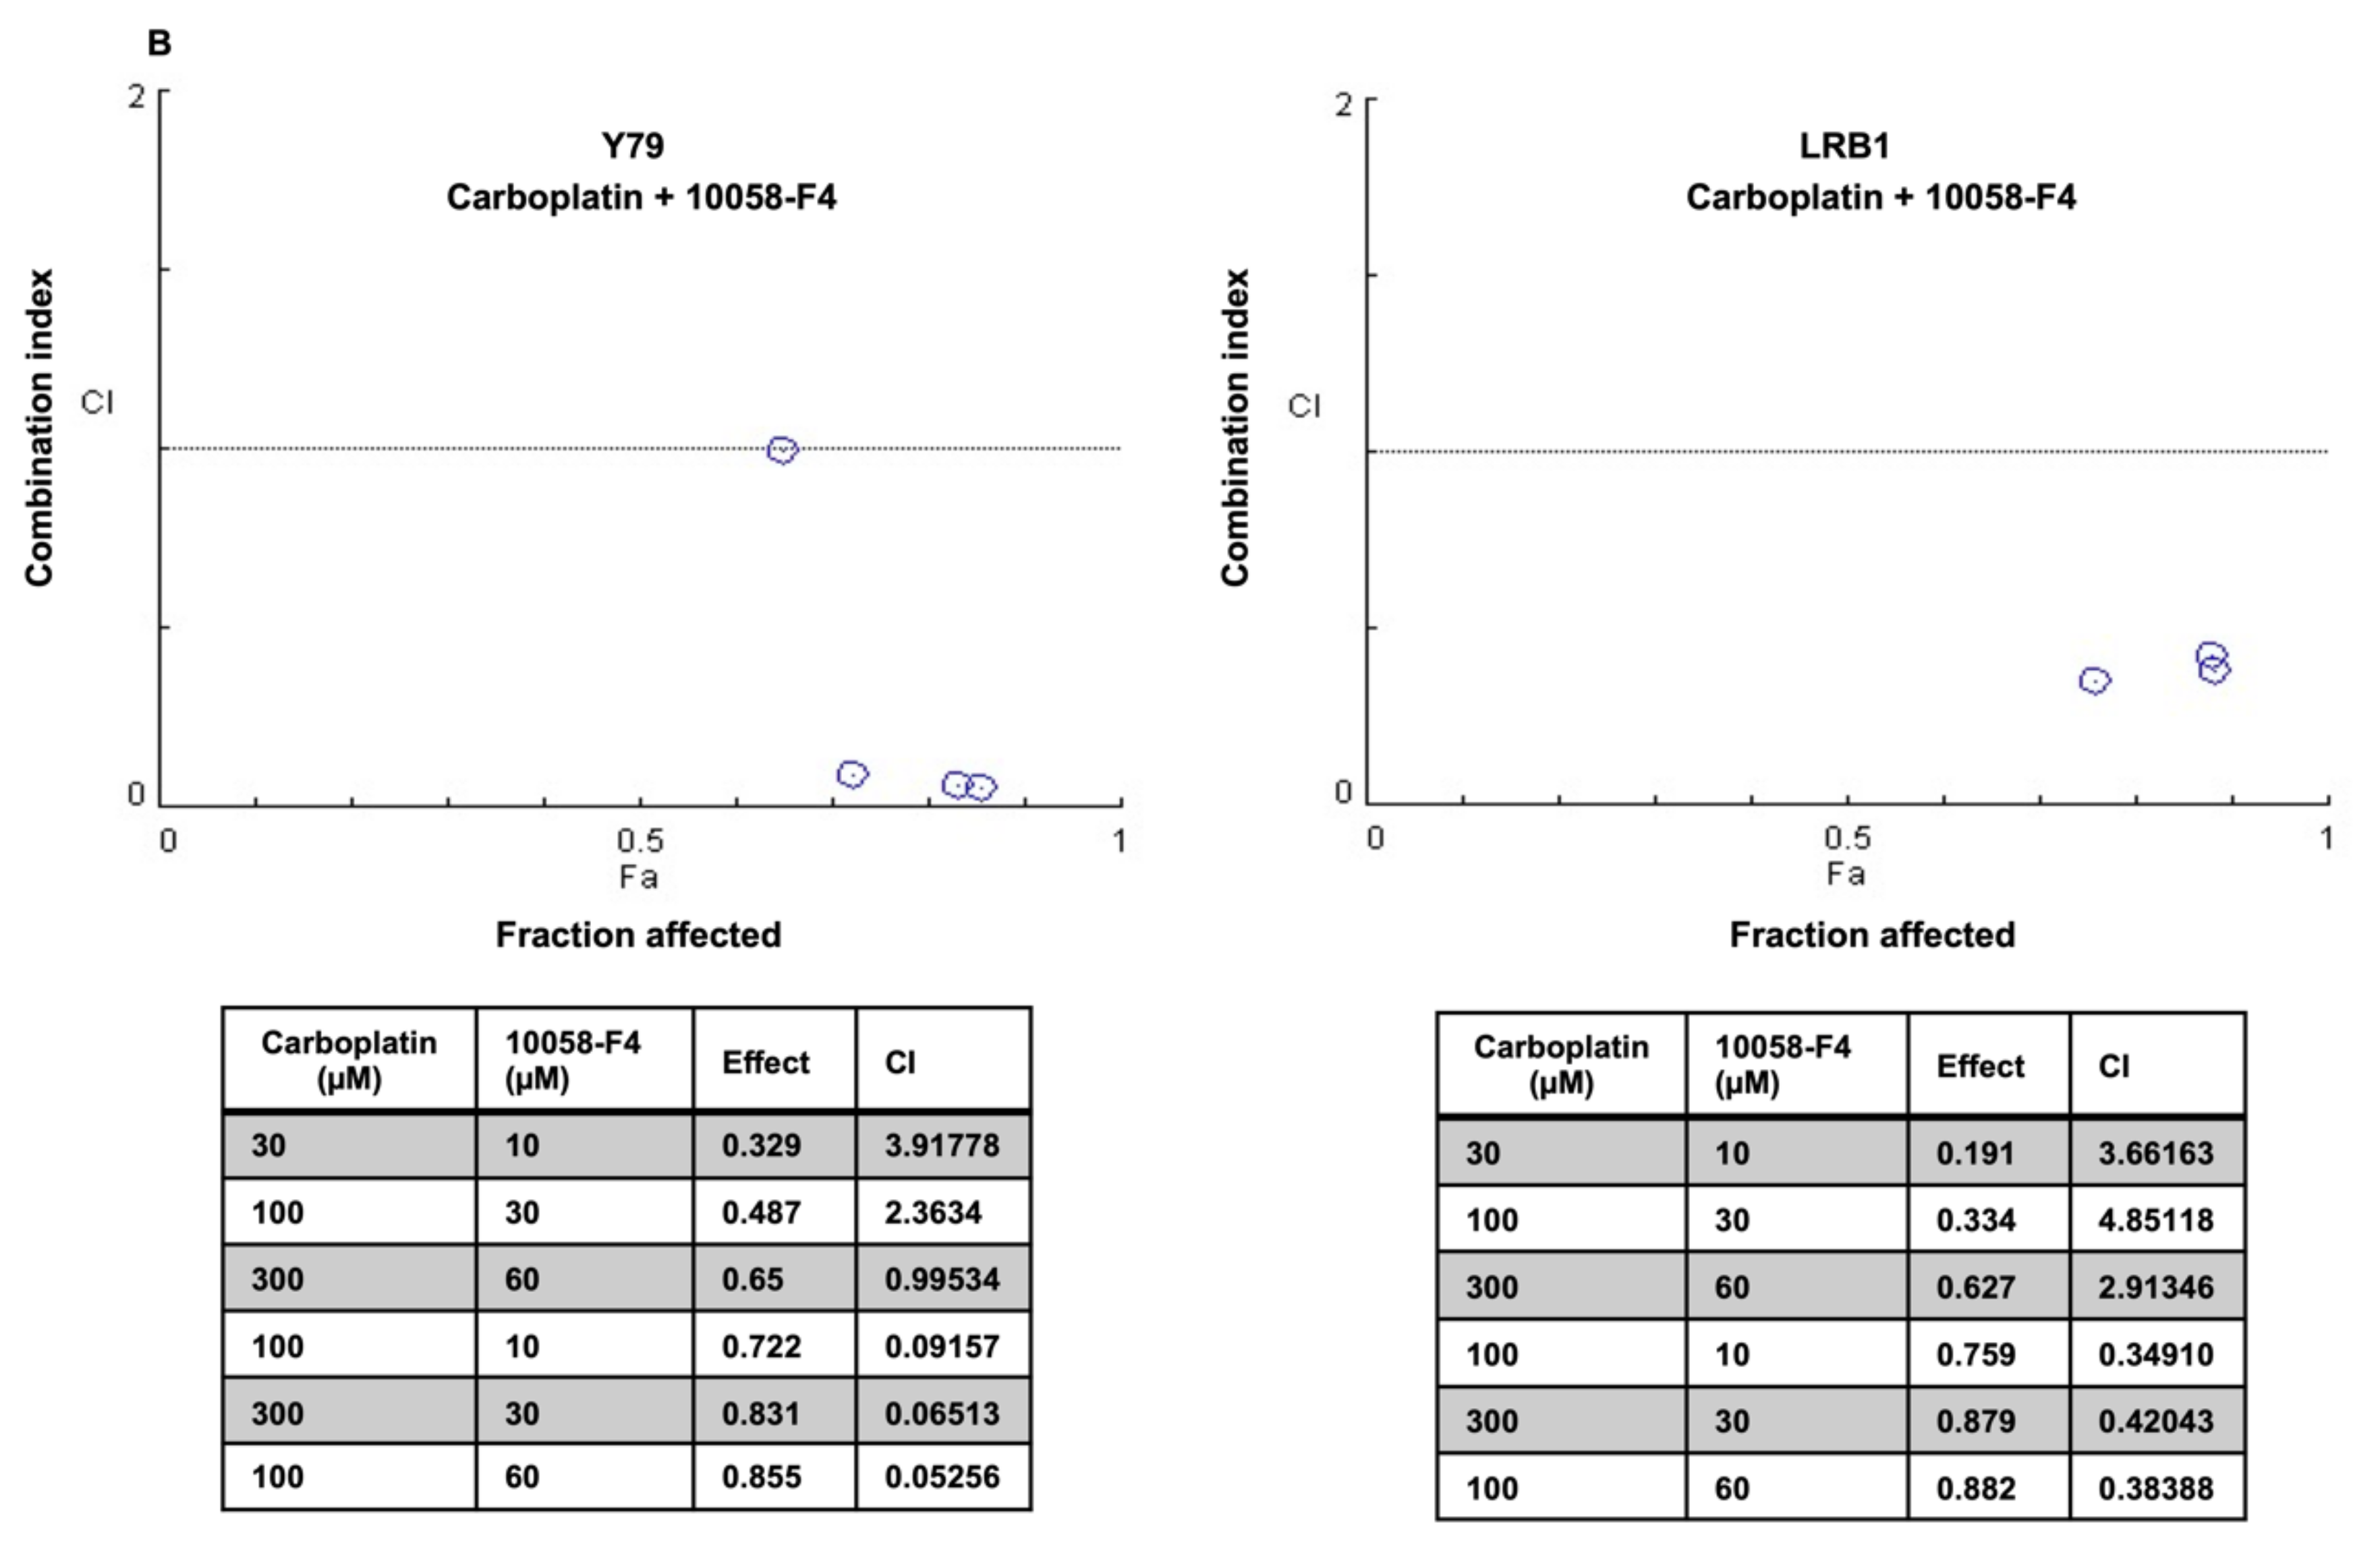
3.6. Drug Combination Effects of MYCN Inhibitors and Carboplatin on Retinoblastoma Cell Viability

Recurrent retinoblastoma is a therapeutic challenge in a subset of RB patients and some children also show poor response to chemotherapy. The efficacy of chemotherapy drugs can be enhanced by combining them with other therapeutic molecules. In this study, we have tested the drug combination effects of carboplatin and small molecule inhibitors of MYCN on RB cell viability in vitro. RB cell lines (Y79 and LRB1) were treated with JQ1, 10058-F4 and carboplatin either alone or in combination. The data were analyzed by median effect combination index (CI) method and CI values were plotted against the values of fraction affected (Fa). The CI values < 1 was considered synergistic, CI = 1, additive and CI > 1, antagonistic. The data indicated that Y79 and LRB1 cells responded differently to the combination therapy. A profound growth inhibitory effect of carboplatin and JQ1 combination was observed in Y79 cells, and they were sensitive to all the concentrations of drug combinations tested, exhibiting synergism (Figure 8A). However, combination of carboplatin and JQ1 yielded variable effects in LRB1 cells showing synergism in two of the drug combinations, (100 µM carboplatin and 30 nM JQ1) and (300 µM carboplatin and 100 nM JQ1) and presented additive effects in two combinations and antagonistic effect in one combination (Figure 8A). Likewise, combination treatment of Y79 and LRB1 cells with carboplatin and 10058-F4 resulted in both enhanced inhibitory effects (synergism) as well as adverse effects (antagonism) on cell growth compared to the single drug treatment (Figure 8B). Dose response curves were also plotted for individual drugs as well as combination of carboplatin and JQ1 or 10058-F4 (Figure S5). Even though drug synergism was observed in RB cells, the mechanistic insights into the synergistic activities of carboplatin and MYCN inhibitors are yet to be deciphered and should be considered for future studies. Our work provides a rationale to develop targeted combination therapy for subgroups of RB patients with MYCN overexpression and chemoresistance.

4. Discussion

The inactivation of both the alleles of RB1 initiates benign lesion, retinoma in the retina of the susceptible eye [7]. Loss of RB1 accompanied by gradual increase in genomic instability in the susceptible retinal cells drives disease progression from non-proliferative retinoma to malignant retinoblastoma. Changes in gene copy number and expression of oncogenic transcription factor, MYCN along with other oncogenes such as MDM4, KIF14, E2F3, SYK and DEK have been reported in RB [8], reviewed in [33]. MYCN expression was shown to be inherently high in differentiating cone precursor cells that are thought to be the cell of origin for RB and further, RB cells are dependent on MYCN expression for their survival and proliferation [34]. Even though, MYCN has been shown to be amplified in RB, its amplification did not correlate with any of the histological high-risk factors such as optic nerve or choroidal invasion [35]. However, in contrast with RB, neuroblastoma, another childhood malignancy, with MYCN amplification was shown to correlate with poor prognosis [22,36]. Consequently, we evaluated the expression level of MYCN in RB patient specimens to corroborate if MYCN expression correlated with histological high-risk factors. MYCN overexpression was seen in 62% of the RB patient specimens compared to the adjoining healthy looking uninvolved retina and the expression did not significantly correlate with advanced disease features. The lack of MYCN positive staining in the remaining samples could be due to the short half-life of MYCN protein or a subset of samples do not have MYCN expression. Nonetheless, in the present study, the MYCN expression data might also reflect the mouse model data wherein the authors have demonstrated that MYCN expression along with RB1 deficiency is required for initial tumor formation, however, progression and maintenance of RB is independent of MYCN expression [37]. Based on our findings and study by Wu et al.; 2017, we speculate that MYCN plays a role in early events of RB tumorigenesis. However, histological evaluation of disease progression is not feasible as incisional biopsy incurs the risk of metastasis in RB in contrast with other tumors.
MYCN plays a central role in regulating a spectrum of cellular functions that drives the oncogenic processes, which include cell cycle, cell growth, proliferation, apoptosis and metabolism [18]. Even though targeting MYCN can be a robust strategy for the treatment of various MYCN-driven tumors, direct inhibition of MYCN has been challenging due to its undruggable structural conformation [28]. Indirect targeting of MYCN using small molecule inhibitors such as bromodomain inhibitors and inhibitors that disrupt the interaction between MYC and its binding partner, MAX has been explored in different cancers [38,39,40,41,42]. In the present study, we targeted MYCN pharmacologically in RB cells using two classes of small molecule inhibitors: selective bromodomain inhibitors and inhibitors of MYC-MAX interaction, and by shRNA mediated knockdown approach. MYCN inhibition resulted in a significant decrease in RB cell survival compared to the untreated or scrambled controls. Additionally, we tested the inhibitory effects of these small molecule inhibitors on MYCN overexpressing primary RB patient specimens, and untransformed retinal pigment epithelial cells (ARPE-19). A decreased cell viability in response to MYCN inhibition was observed in RB patient specimens in a similar manner as cell lines, whereas no significant inhibition was detected in ARPE-19 cells. Assessing the inhibitory effects of MYCN on primary cells is particularly important as no animal models that truly mimic human RB are available so far. Further, MYCN inhibition led to increased apoptosis and cell cycle arrest at G0/G1 phase. Increased expression of p53 and decreased expression of Bcl2 proteins upon MYCN inhibition was also observed in RB cells. Collectively, our data demonstrates that targeting MYCN inhibits cell growth, induces cell cycle arrest and promotes apoptosis in RB cells.
To further explore and identify the regulatory networks downstream of MYCN in RB, we performed DNA microarray analysis in scrambled and MYCN knockdown cells. The KEGG functional enrichment analysis of identified downregulated DEGs showed that they were mainly enriched in the cancer related pathways such as PI3K-Akt signaling, MAPK signaling, transcriptional misregulation in cancer, FoxO signaling, carbon metabolism, glycolysis and p53 signaling among others. To characterize the biological function of the downregulated DEGs, GO enrichment analysis was performed. The biological function of DEGs were assigned to biological process (BP), molecular function (MF) and cellular component (CC). The top enriched GO terms in BP group include metabolic processes, cell proliferation, cell cycle, cell cycle checkpoint, programmed cell death, cell differentiation, response to hypoxia, biosynthetic processes, nucleic acid metabolic pathways and cellular response to stress. Similarly, the GO analysis of MF showed that the DEGs were significantly enriched in carbohydrate derivative binding, nucleic acid binding, enzyme binding, kinase activity, transcription factor binding, glycoprotein binding, chromatin binding, cytoskeletal protein binding, purine ribonucleotide binding and cyclin-dependent protein serine/threonine kinase activity. The cellular component of GO analysis showed that majority of DEGs were enriched in cell, cytoplasm, nucleus, cytoplasmic part, microtubule cytoskeleton, chromosome, adherens junction, organelle part and extracellular region. Overall, the KEGG pathway and GO enrichment analysis of downregulated DEGs indicated that major pathways and cellular processes associated with tumorigenesis and metastasis are regulated by MYCN.
During the tumorigenic process, neoplastic cells rewire their metabolism and energy production to support rapid proliferation, accelerated biosynthesis, continuous growth, tolerance to adverse conditions, invasion and metastasis. Cancer cells preferentially depend on aerobic glycolysis even under normoxic condition, a phenomenon, known as Warburg effect [43]. Despite increasing evidence on the importance of tumor cell metabolism for cancer progression, only a few studies showed the role of MYCN in the regulation of metabolic processes in RB. Based on our microarray data, we specifically considered two hallmarks of cancer; altered metabolism and cell migration in RB in response to MYCN downregulation. The microarray data revealed that the key metabolic genes encoding enzymes, ENO2, HK2, TPI1, PDK1, ALDOC, PFKFB3, PFKFB4, LDHA, PGK1, PKM, PGAM1 and PGAM4 are among some of the top downregulated DEGs following MYCN knockdown. Further, the mRNA expression of the above-mentioned genes was validated using qRT-PCR and similar results were obtained. Previously, it was demonstrated that c-MYC is the key regulator of genes involved in glycolysis suggesting its role in metabolic switch to glycolysis during cell proliferation and tumorigenesis [44,45]. In a recent study, we have reported that PDK1, a key gate-keeping enzyme of glycolysis is overexpressed in RB and its promoter consists of MYCN binding motifs suggesting its possible regulation by MYCN [29,46]. Additionally, the dependency of MYCN-driven glioblastoma cells on glycolysis has been reported by Tateishi et al., 2016 [47]. However, numerous studies have provided additional insights into the metabolic reprograming in cancer cells. Vyas et al., 2016 and Viale et al., 2015 have described that cancer cells are highly dependent on oxidative phosphorylation preferably than glycolysis [48,49]. As our data hint at MYCN mediated regulation of glucose metabolism in RB, we studied the functional role of MYCN on additional metabolic parameters such as glucose uptake, lactate and ROS levels. Consistent with the microarray data, decreased glucose uptake, lactate and ROS levels were observed after MYCN inhibition in RB cells compared to the control cells. Taken together, our data suggest that MYCN regulates the key enzymes involved in glucose metabolism in rapidly proliferating RB cells. This finding is particularly interesting as retina is known to utilize glycolysis for its energy needs. However, further increase in expression of genes involved in glycolysis in RB as well as increased glucose uptake suggests that RB cells may utilize elevated glycolysis for their increased demand for energy production and synthesis of biosynthetic precursors required for rapid proliferation.
To decipher the role of MYCN in invasion and metastasis, we determined the mRNA expression of the genes that encode ECM proteins such as FN1, FBN1 and MMP9, and VEGFA. Decreased mRNA expression was observed in response to MYCN inhibition and that correlated with the microarray data. In addition, gelatin zymography showed a decreased gelatinolytic activity of active-MMP9 upon MYCN inhibition in RB cells. Further, wound healing assay revealed that the migratory ability of RB cells was diminished in MYCN depleted RB cells compared to the control cells. FN1 has been recognized to support cell proliferation and migration in multiple tumor types such as gastric cancer, colorectal cancer, thyroid cancer and esophageal squamous cell carcinoma [50,51,52,53]. Similarly, FBN1 has been reported to promote ovarian cancer metastasis [54,55]. MMP9 has been recognized as a possible biomarker for metastasis in various cancers such as ovarian cancer [56], non-small cell lung cancer [57], colorectal cancer [58] and breast cancer [59]. Recently, Webb et al., 2017 have shown that MMP2 and MMP9 drive metastatic pathways by promoting cell migration and viability and by releasing angiogenic factors in RB cells [60]. In agreement with the existing literature, our data suggest that MYCN promotes RB cell growth and metastasis possibly via regulating the genes involved in the ECM modification. MYCN in addition to the regulation of genes involved in glucose metabolism and migration, has been shown to positively modulate the expression of mitotic protein kinase, aurora kinase B in RB [30] and other tumors [61]. Overall, our data along with the published literature show that MYCN may regulate a plethora of cellular functions in RB and other tumors [62].
Based on the inhibitor and shRNA experiments, we further studied if the efficacy of chemotherapeutic agent, carboplatin could be enhanced in combination with MYC inhibitors. We treated RB cells with various combinations of carboplatin and small molecule inhibitors of MYCN and the results showed an increased inhibitory effect of combination treatment compared to the single treatment suggesting synergistic interaction. These results indicate the possibility of inhibiting MYCN in RB in combination with chemotherapy drug currently used in the clinic. Similarly, a recent study by Aubry et al., 2020 revealed that combination inhibition of RAD51 and topotecan synergistically inhibited RB cell growth and the cells resistant to this combination could be inhibited by further combining Navitoclax, a BCL2 inhibitor with RAD51 inhibition and topotecan [63]. Another interesting study showed that the combination treatment of cells that were RB1 wildtype with MYCN amplification and chemoresistant with Panobinostat and bortezomib or carboplatin inhibited tumor cell growth [5]. It would be interesting to see if MYCN inhibition could be combined with any of the other combination strategies proposed earlier for RB. Altogether, our study demonstrates that MYCN promotes cell survival and migration of RB cells possibly via regulating the key metabolic genes to provide the enhanced demand for biosynthetic substrates and energy production of the rapidly proliferating RB cells. In addition, MYCN also regulates the expression of the genes involved in the ECM modification to further drive RB progression and metastasis. However, additional studies are required to understand the role of individual genes in these MYCN mediated processes.

5. Conclusions

In the current study, we have verified the expression of MYCN, evaluated its inhibition as a potential therapeutic strategy and identified critical pathways downstream of MYCN in RB. Our study suggests that MYCN regulates RB cell growth and migration possibly via modulating the key genes involved in glucose metabolism and extracellular matrix modification and targeting it could be a potential therapeutic strategy. We also demonstrated the possibility of targeting MYCN using primary cells derived from enucleated eyes. This is of significance due to lack of suitable animal models for RB. The microarray analysis identified pathways that could be potential drug targets for RB. Our drug combination experiments provide rationale for developing additional therapeutic strategies for RB. Further studies are necessary to clarify the role of other critical pathways regulated by MYCN. Likewise, combination studies comprising of existing chemotherapy agents and additional MYCN inhibition strategies need to be evaluated.

Supplementary Materials

The following are available online at https://www.mdpi.com/article/10.3390/cancers13205248/s1, Table S1: IC50 concentrations for small molecule inhibitors of MYCN in RB cells, Figure S1: Inhibition of MYCN has no adverse effect on the cell viability of untransformed human retinal pigment epithelial (ARPE-19) cells, Figure S2: Inhibition of MYCN induces accumulation of cells in G0/G1 phase of the cell cycle and increases apoptosis in RB cells, Figure S3: Identification and enrichment analysis of differentially expressed genes in MYCN knockdown Y79 cells, Table S2: Primers used for qRT-PCR validation of identified target genes, Figure S4: qRT-PCR validation of identified downregulated metabolic genes, Figure S5: Dose response curves for MYCN inhibitors (JQ1 and 10058-F4), carboplatin and combination of carboplatin with JQ1 or 10058-F4, and Figure S6: Full immunoblots for Figure 1A, Figure 3C and Figure 4A.

Author Contributions

S.S. and M.M.R. conceptualized and designed the study. S.S. and P.R. developed methodologies and S.S. acquired data. S.S., R.M. (Ruchi Mittal), R.M. (Rahul Modak), T.K.C. and M.M.R. analyzed and interpreted the data. D.T., S.K. and S.R. analyzed clinical data. All the authors contributed to manuscript preparation. All authors have read and agreed to the contents of the manuscript.

Funding

This work was supported in part by the Department of Biotechnology (grants BT/Bio-CARe/07/9859/2013-14, BT/09/IYBA/2015/10 and BT/PR32404/MED/30/2136/2019 (M.M.R.)), and the Hyderabad Eye Research Foundation, LV Prasad Eye Institute. S.S. is a recipient of Senior Research Fellowship from Indian Council of Medical Research (45/23/2019-BIO/BMS (S.S.)).

Institutional Review Board Statement

The study was conducted according to the guidelines of the Declaration of Helsinki and approved by the Institutional Ethics Committee of LV Prasad Eye Institute, Bhubaneswar (protocol number 2019-144-IM-28 and date of approval: 13 July 2019).

Informed Consent Statement

Patient consent was waived as we have utilized archived samples.

Data Availability Statement

The microarray data for MYCN scrambled and knockdown cells was submitted in the repository of “Gene Expression Omnibus” with the accession number GSE168903, https://www.ncbi.nlm.nih.gov/geo/query/acc.cgi?acc=GSE168903, accessed on 14 October 2021.

Acknowledgments

The authors would like to thank Kalandi Charan Muduli for his technical support in immunohistochemistry.

Conflicts of Interest

The authors declare no conflict of interest.

References

  1. Shields, C.L.; Shields, J.A. Diagnosis and Management of Retinoblastoma. Cancer Control 2004, 11, 317–327. [Google Scholar] [CrossRef]
  2. Dryja, T.P.; Friend, S.; Weinberg, R.A. Genetic Sequences That Predispose to Retinoblastoma and Osteosarcoma. Symp. Fundam. Cancer Res. 1986, 39, 115–119. [Google Scholar]
  3. Friend, S.H.; Bernards, R.; Rogelj, S.; Weinberg, R.A.; Rapaport, J.M.; Albert, D.M.; Dryja, T.P. A Human DNA Segment with Properties of the Gene That Predisposes to Retinoblastoma and Osteosarcoma. Nature 1986, 323, 643–646. [Google Scholar] [CrossRef]
  4. Rushlow, D.E.; Mol, B.M.; Kennett, J.Y.; Yee, S.; Pajovic, S.; Thériault, B.L.; Prigoda-Lee, N.L.; Spencer, C.; Dimaras, H.; Corson, T.W.; et al. Characterisation of Retinoblastomas without RB1 Mutations: Genomic, Gene Expression, and Clinical Studies. Lancet Oncol. 2013, 14, 327–334. [Google Scholar] [CrossRef] [Green Version]
  5. Zugbi, S.; Ganiewich, D.; Bhattacharyya, A.; Aschero, R.; Ottaviani, D.; Sampor, C.; Cafferata, E.G.; Mena, M.; Sgroi, M.; Winter, U.; et al. Clinical, Genomic, and Pharmacological Study of MYCN-Amplified RB1 Wild-Type Metastatic Retinoblastoma. Cancers 2020, 12, 2714. [Google Scholar] [CrossRef] [PubMed]
  6. Goodrich, D.W. The Retinoblastoma Tumor-Suppressor Gene, the Exception That Proves the Rule. Oncogene 2006, 25, 5233–5243. [Google Scholar] [CrossRef] [PubMed] [Green Version]
  7. Dimaras, H.; Khetan, V.; Halliday, W.; Orlic, M.; Prigoda, N.L.; Piovesan, B.; Marrano, P.; Corson, T.W.; Eagle, R.C.; Squire, J.A.; et al. Loss of RB1 Induces Non-Proliferative Retinoma: Increasing Genomic Instability Correlates with Progression to Retinoblastoma. Hum. Mol. Genet. 2008, 17, 1363–1372. [Google Scholar] [CrossRef] [PubMed] [Green Version]
  8. Thériault, B.L.; Dimaras, H.; Gallie, B.L.; Corson, T.W. The Genomic Landscape of Retinoblastoma: A Review. Clin. Exp. Ophthalmol. 2014, 42, 33–52. [Google Scholar] [CrossRef] [PubMed] [Green Version]
  9. Stenfelt, S.; Blixt, M.K.E.; All-Ericsson, C.; Hallböök, F.; Boije, H. Heterogeneity in Retinoblastoma: A Tale of Molecules and Models. Clin. Transl. Med. 2017, 6, 42. [Google Scholar] [CrossRef] [Green Version]
  10. Afshar, A.R.; Pekmezci, M.; Bloomer, M.M.; Cadenas, N.J.; Stevers, M.; Banerjee, A.; Roy, R.; Olshen, A.B.; van Ziffle, J.; Onodera, C.; et al. Next-Generation Sequencing of Retinoblastoma Identifies Pathogenic Alterations beyond RB1 Inactivation That Correlate with Aggressive Histopathologic Features. Ophthalmology 2020, 127, 804–813. [Google Scholar] [CrossRef]
  11. Dang, C.V. MYC, Metabolism, Cell Growth, and Tumorigenesis. Cold Spring Harb. Perspect. Med. 2013, 3, a014217. [Google Scholar] [CrossRef] [PubMed]
  12. Blackwell, T.K.; Huang, J.; Ma, A.; Kretzner, L.; Alt, F.W.; Eisenman, R.N.; Weintraub, H. Binding of Myc Proteins to Canonical and Noncanonical DNA Sequences. Mol. Cell. Biol. 1993, 13, 5216–5224. [Google Scholar] [CrossRef] [PubMed] [Green Version]
  13. Wenzel, A.; Schwab, M. The MYCN/Max Protein Complex in Neuroblastoma. Short Review. Eur. J. Cancer 1995, 31, 516–519. [Google Scholar] [CrossRef]
  14. Huang, M.; Weiss, W.A. Neuroblastoma and MYCN. Cold Spring Harb. Perspect. Med. 2013, 3, a014415. [Google Scholar] [CrossRef] [PubMed]
  15. Beltran, H. The N-Myc Oncogene: Maximizing Its Targets, Regulation, and Therapeutic Potential. Mol. Cancer Res. 2014, 12, 815–822. [Google Scholar] [CrossRef] [Green Version]
  16. Giroux, S.; Charron, J. Defective Development of the Embryonic Liver in N-Myc-Deficient Mice. Dev. Biol. 1998, 195, 16–28. [Google Scholar] [CrossRef] [Green Version]
  17. Kalkat, M.; de Melo, J.; Hickman, K.A.; Lourenco, C.; Redel, C.; Resetca, D.; Tamachi, A.; Tu, W.B.; Penn, L.Z. MYC Deregulation in Primary Human Cancers. Genes 2017, 8, 151. [Google Scholar] [CrossRef] [Green Version]
  18. Dang, C.V. MYC on the Path to Cancer. Cell 2012, 149, 22–35. [Google Scholar] [CrossRef] [Green Version]
  19. Lee, W.H.; Murphree, A.L.; Benedict, W.F. Expression and Amplification of the N-Myc Gene in Primary Retinoblastoma. Nature 1984, 309, 458–460. [Google Scholar] [CrossRef]
  20. McEvoy, J.; Nagahawatte, P.; Finkelstein, D.; Richards-Yutz, J.; Valentine, M.; Ma, J.; Mullighan, C.; Song, G.; Chen, X.; Wilson, M.; et al. RB1 Gene Inactivation by Chromothripsis in Human Retinoblastoma. Oncotarget 2014, 5, 438–450. [Google Scholar] [CrossRef] [Green Version]
  21. Bowles, E.; Corson, T.W.; Bayani, J.; Squire, J.A.; Wong, N.; Lai, P.B.S.; Gallie, B.L. Profiling Genomic Copy Number Changes in Retinoblastoma beyond Loss of RB1. Genes Chromosomes Cancer 2007, 46, 118–129. [Google Scholar] [CrossRef] [PubMed]
  22. Brodeur, G.M.; Seeger, R.C.; Schwab, M.; Varmus, H.E.; Michael Bishop, J. Amplification of N-Myc in Untreated Human Neuroblastomas Correlates with Advanced Disease Stage. Science 1984, 224, 1121–1124. [Google Scholar] [CrossRef] [PubMed]
  23. Massimino, M.; Biassoni, V.; Gandola, L.; Garrè, M.L.; Gatta, G.; Giangaspero, F.; Poggi, G.; Rutkowski, S. Childhood Medulloblastoma. Crit. Rev. Oncol. /Hematol. 2016, 105, 35–51. [Google Scholar] [CrossRef] [PubMed] [Green Version]
  24. Bjerke, L.; Mackay, A.; Nandhabalan, M.; Burford, A.; Jury, A.; Popov, S.; Bax, D.A.; Carvalho, D.; Taylor, K.R.; Vinci, M.; et al. Histone H3.3 Mutations Drive Pediatric Glioblastoma through Upregulation of MYCN. Cancer Discov. 2013, 3, 512–519. [Google Scholar] [CrossRef] [PubMed] [Green Version]
  25. Hodgson, J.G.; Yeh, R.F.; Ray, A.; Wang, N.J.; Smirnov, I.; Yu, M.; Hariono, S.; Silber, J.; Feiler, H.S.; Gray, J.W.; et al. Comparative Analyses of Gene Copy Number and MRNA Expression in Glioblastoma Multiforme Tumors and Xenografts. Neuro-oncology 2009, 11, 477–487. [Google Scholar] [CrossRef] [Green Version]
  26. Williamson, D.; Lu, Y.J.; Gordon, T.; Sciot, R.; Kelsey, A.; Fisher, C.; Poremba, C.; Anderson, J.; Pritchard-Jones, K.; Shipley, J. Relationship between MYCN Copy Number and Expression in Rhabdomyosarcomas and Correlation with Adverse Prognosis in the Alveolar Subtype. J. Clin. Oncol. 2005, 23, 880–888. [Google Scholar] [CrossRef]
  27. Fielitz, K.; Althoff, K.; de Preter, K.; Nonnekens, J.; Ohli, J.; Elges, S.; Hartmann, W.; Klöppel, G.; Knösel, T.; Schulte, M.; et al. Characterization of Pancreatic Glucagon-Producing Tumors and Pituitary Gland Tumors in Transgenic Mice Overexpressing MYCN in HGFAP-Positive Cells. Oncotarget 2016, 7, 74415–74426. [Google Scholar] [CrossRef] [Green Version]
  28. Chen, H.; Liu, H.; Qing, G. Targeting Oncogenic Myc as a Strategy for Cancer Treatment. Signal Transduct. Target. Ther. 2018, 3, 5. [Google Scholar] [CrossRef] [Green Version]
  29. Sradhanjali, S.; Tripathy, D.; Rath, S.; Mittal, R.; Reddy, M.M. Overexpression of Pyruvate Dehydrogenase Kinase 1 in Retinoblastoma: A Potential Therapeutic Opportunity for Targeting Vitreous Seeds and Hypoxic Regions. PLoS ONE 2017, 12, e0177744. [Google Scholar] [CrossRef]
  30. Borah, N.A.; Sradhanjali, S.; Barik, M.R.; Jha, A.; Tripathy, D.; Kaliki, S.; Rath, S.; Raghav, S.K.; Patnaik, S.; Mittal, R.; et al. Aurora Kinase B Expression, Its Regulation and Therapeutic Targeting in Human Retinoblastoma. Investig. Ophthalmol. Vis. Sci. 2021, 62, 16. [Google Scholar] [CrossRef]
  31. Chou, T.C. Theoretical Basis, Experimental Design, and Computerized Simulation of Synergism and Antagonism in Drug Combination Studies. Pharmacol. Rev. 2006, 58, 621–681. [Google Scholar] [CrossRef]
  32. Schwermer, M.; Hiber, M.; Dreesmann, S.; Rieb, A.; Theißen, J.; Herold, T.; Schramm, A.; Temming, P.; Steenpass, L. Comprehensive Characterization of RB1 Mutant and MYCN Amplified Retinoblastoma Cell Lines. Exp. Cell Res. 2019, 375, 92–99. [Google Scholar] [CrossRef] [PubMed]
  33. Kaewkhaw, R.; Rojanaporn, D. Retinoblastoma: Etiology, Modeling, and Treatment. Cancers 2020, 12, 2304. [Google Scholar] [CrossRef]
  34. Xu, X.L.; Fang, Y.; Lee, T.C.; Forrest, D.; Gregory-Evans, C.; Almeida, D.; Liu, A.; Jhanwar, S.C.; Abramson, D.H.; Cobrinik, D. Retinoblastoma Has Properties of a Cone Precursor Tumor and Depends Upon Cone-Specific MDM2 Signaling. Cell 2009, 137, 1018–1031. [Google Scholar] [CrossRef] [Green Version]
  35. Lillington, D.M.; Goff, L.K.; Kingston, J.E.; Onadim, Z.; Price, E.; Domizio, P.; Young, B.D. High Level Amplification of N-MYC Is Not Associated with Adverse Histology or Outcome in Primary Retinoblastoma Tumours. Br. J. Cancer 2002, 87, 779–782. [Google Scholar] [CrossRef] [PubMed] [Green Version]
  36. Seeger, R.C.; Brodeur, G.M.; Sather, H.; Dalton, A.; Siegel, S.E.; Wong, K.Y.; Hammond, D. Association of Multiple Copies of the N- Myc Oncogene with Rapid Progression of Neuroblastomas. N. Engl. J. Med. 1985, 313, 1111–1116. [Google Scholar] [CrossRef]
  37. Wu, N.; Jia, D.; Bates, B.; Basom, R.; Eberhart, C.G.; MacPherson, D. A Mouse Model of MYCN-Driven Retinoblastoma Reveals MYCN-Independent Tumor Reemergence. J. Clin. Investig. 2017, 127, 888–898. [Google Scholar] [CrossRef]
  38. Puissant, A.; Frumm, S.M.; Alexe, G.; Bassil, C.F.; Qi, J.; Chanthery, Y.H.; Nekritz, E.A.; Zeid, R.; Gustafson, W.C.; Greninger, P.; et al. Targeting MYCN in Neuroblastoma by BET Bromodomain Inhibition. Cancer Discov. 2013, 3, 309–323. [Google Scholar] [CrossRef] [PubMed] [Green Version]
  39. Delmore, J.E.; Issa, G.C.; Lemieux, M.E.; Rahl, P.B.; Shi, J.; Jacobs, H.M.; Kastritis, E.; Gilpatrick, T.; Paranal, R.M.; Qi, J.; et al. BET Bromodomain Inhibition as a Therapeutic Strategy to Target C-Myc. Cell 2011, 146, 904–917. [Google Scholar] [CrossRef] [PubMed] [Green Version]
  40. Müller, I.; Larsson, K.; Frenzel, A.; Oliynyk, G.; Zirath, H.; Prochownik, E.V.; Westwood, N.J.; Henriksson, M.A. Targeting of the MYCN Protein with Small Molecule C-MYC Inhibitors. PLoS ONE 2014, 9, e97285. [Google Scholar] [CrossRef] [PubMed] [Green Version]
  41. Zirath, H.; Frenzel, A.; Oliynyk, G.; Segerström, L.; Westermark, U.K.; Larsson, K.; Persson, M.M.; Hultenby, K.; Lehtiö, J.; Einvik, C.; et al. MYC Inhibition Induces Metabolic Changes Leading to Accumulation of Lipid Droplets in Tumor Cells. Proc. Natl. Acad. Sci. USA 2013, 110, 10258–10263. [Google Scholar] [CrossRef] [PubMed] [Green Version]
  42. Leal, A.S.; Williams, C.R.; Royce, D.B.; Pioli, P.A.; Sporn, M.B.; Liby, K.T. Bromodomain Inhibitors, JQ1 and I-BET 762, as Potential Therapies for Pancreatic Cancer. Cancer Lett. 2017, 394, 76–87. [Google Scholar] [CrossRef]
  43. Warburg, O. On the Origin of Cancer Cells. Science 1956, 123, 309–314. [Google Scholar] [CrossRef] [PubMed]
  44. Osthus, R.C.; Shim, H.; Kim, S.; Li, Q.; Reddy, R.; Mukherjee, M.; Xu, Y.; Wonsey, D.; Lee, L.A.; Dang, C.V. Deregulation of Glucose Transporter 1 and Glycolytic Gene Expression by C-Myc. J. Biol. Chem. 2000, 275, 21797–21800. [Google Scholar] [CrossRef] [PubMed] [Green Version]
  45. Kim, J.; Zeller, K.I.; Wang, Y.; Jegga, A.G.; Aronow, B.J.; O’Donnell, K.A.; Dang, C.V. Evaluation of Myc E-Box Phylogenetic Footprints in Glycolytic Genes by Chromatin Immunoprecipitation Assays. Mol. Cell. Biol. 2004, 24, 5923–5936. [Google Scholar] [CrossRef] [PubMed] [Green Version]
  46. Sradhanjali, S.; Reddy, M.M. Inhibition of Pyruvate Dehydrogenase Kinase as a Therapeutic Strategy against Cancer. Curr. Top. Med. Chem. 2018, 18, 444–453. [Google Scholar] [CrossRef] [PubMed]
  47. Tateishi, K.; Iafrate, A.J.; Ho, Q.; Curry, W.T.; Batchelor, T.T.; Flaherty, K.T.; Onozato, M.L.; Lelic, N.; Sundaram, S.; Cahill, D.P.; et al. Myc-Driven Glycolysis Is a Therapeutic Target in Glioblastoma. Clin. Cancer Res. 2016, 22, 4452–4465. [Google Scholar] [CrossRef] [Green Version]
  48. Vyas, S.; Zaganjor, E.; Haigis, M.C. Mitochondria and Cancer. Cell 2016, 166, 555–566. [Google Scholar] [CrossRef]
  49. Viale, A.; Corti, D.; Draetta, G.F. Tumors and Mitochondrial Respiration: A Neglected Connection. Cancer Res. 2015, 75, 3685–3686. [Google Scholar] [CrossRef] [Green Version]
  50. Xiao, J.; Yang, W.; Xu, B.; Zhu, H.; Zou, J.; Su, C.; Rong, J.; Wang, T.; Chen, Z. Expression of Fibronectin in Esophageal Squamous Cell Carcinoma and Its Role in Migration 11 Medical and Health Sciences 1112 Oncology and Carcinogenesis. BMC Cancer 2018, 18, 976. [Google Scholar] [CrossRef] [Green Version]
  51. Cai, X.; Liu, C.; Zhang, T.N.; Zhu, Y.W.; Dong, X.; Xue, P. Down-Regulation of FN1 Inhibits Colorectal Carcinogenesis by Suppressing Proliferation, Migration, and Invasion. J. Cell. Biochem. 2018, 119, 4717–4728. [Google Scholar] [CrossRef]
  52. Nakagawa, Y.; Nakayama, H.; Nagata, M.; Yoshida, R.; Kawahara, K.; Hirosue, A.; Tanaka, T.; Yuno, A.; Matsuoka, Y.; Kojima, T.; et al. Overexpression of Fibronectin Confers Cell Adhesion-Mediated Drug Resistance (CAM-DR) against 5-FU in Oral Squamous Cell Carcinoma Cells. Int. J. Oncol. 2014, 44, 1376–1384. [Google Scholar] [CrossRef] [PubMed] [Green Version]
  53. Sponziello, M.; Rosignolo, F.; Celano, M.; Maggisano, V.; Pecce, V.; de Rose, R.F.; Lombardo, G.E.; Durante, C.; Filetti, S.; Damante, G.; et al. Fibronectin-1 Expression Is Increased in Aggressive Thyroid Cancer and Favors the Migration and Invasion of Cancer Cells. Mol. Cell. Endocrinol. 2016, 431, 123–132. [Google Scholar] [CrossRef] [PubMed] [Green Version]
  54. Wang, Z.; Liu, Y.; Lu, L.; Yang, L.; Yin, S.; Wang, Y.; Qi, Z.; Meng, J.; Zang, R.; Yang, G. Fibrillin-1, Induced by Aurora-A but Inhibited by BRCA2, Promotes Ovarian Cancer Metastasis. Oncotarget 2015, 6, 6670–6683. [Google Scholar] [CrossRef] [PubMed] [Green Version]
  55. Cierna, Z.; Mego, M.; Jurisica, I.; Machalekova, K.; Chovanec, M.; Miskovska, V.; Svetlovska, D.; Kalavska, K.; Rejlekova, K.; Kajo, K.; et al. Fibrillin-1 (FBN-1) a New Marker of Germ Cell Neoplasia in Situ. BMC Cancer 2016, 16, 597. [Google Scholar] [CrossRef] [Green Version]
  56. Li, L.N.; Zhou, X.; Gu, Y.; Yan, J. Prognostic Value of MMP-9 in Ovarian Cancer: A Meta-Analysis. Asian Pac. J. Cancer Prev. 2013, 14, 4107–4113. [Google Scholar] [CrossRef] [Green Version]
  57. Shao, W.; Wang, W.; Xiong, X.G.; Cao, C.; Yan, T.D.; Chen, G.; Chen, H.; Yin, W.; Liu, J.; Gu, Y.; et al. Prognostic Impact of MMP-2 and MMP-9 Expression in Pathologic Stage IA Non-Small Cell Lung Cancer. J. Surg. Oncol. 2011, 104, 841–846. [Google Scholar] [CrossRef]
  58. Liang, S.; Chang, L. Serum Matrix Metalloproteinase-9 Level as a Biomarker for Colorectal Cancer: A Diagnostic Meta-Analysis. Biomark. Med. 2018, 12, 393–402. [Google Scholar] [CrossRef]
  59. Joseph, C.; Alsaleem, M.; Orah, N.; Narasimha, P.L.; Miligy, I.M.; Kurozumi, S.; Ellis, I.O.; Mongan, N.P.; Green, A.R.; Rakha, E.A. Elevated MMP9 Expression in Breast Cancer Is a Predictor of Shorter Patient Survival. Breast Cancer Res. Treat. 2020, 182, 267–282. [Google Scholar] [CrossRef]
  60. Webb, A.H.; Gao, B.T.; Goldsmith, Z.K.; Irvine, A.S.; Saleh, N.; Lee, R.P.; Lendermon, J.B.; Bheemreddy, R.; Zhang, Q.; Brennan, R.C.; et al. Inhibition of MMP-2 and MMP-9 Decreases Cellular Migration, and Angiogenesis in in Vitro Models of Retinoblastoma. BMC Cancer 2017, 17, 434. [Google Scholar] [CrossRef]
  61. Borah, N.A.; Reddy, M.M. Aurora Kinase B Inhibition: A Potential Therapeutic Strategy for Cancer. Molecules 2021, 26, 1981. [Google Scholar] [CrossRef] [PubMed]
  62. Ruiz-Pérez, M.V.; Henley, A.B.; Arsenian-Henriksson, M. The MYCN Protein in Health and Disease. Genes 2017, 8, 113. [Google Scholar] [CrossRef] [PubMed]
  63. Aubry, A.; Pearson, J.D.; Huang, K.; Livne-bar, I.; Ahmad, M.; Jagadeesan, M.; Khetan, V.; Ketela, T.; Brown, K.R.; Yu, T.; et al. Functional Genomics Identifies New Synergistic Therapies for Retinoblastoma. Oncogene 2020, 39, 5338–5357. [Google Scholar] [CrossRef] [PubMed]
Figure 1. MYCN is highly expressed in RB. (A) Immunoblot showing overexpression of MYCN in RB cells compared to control retina (CR). (B) Illustrative Immunohistochemical images of MYCN expression in un-involved retina and RB patient specimens showing weak, moderate and strong expression. (C) Box plots depicting the distribution of cells based on intensity scoring of MYCN expression.
Cancers 13 05248 g001
Figure 2. Pharmacological inhibition of MYCN using small molecule inhibitors. (A) Cell viability of RB cell lines; Y79 and Weri-Rb1 and patient derived cells; LRB1 and LRB2 upon treatment with small molecule inhibitors. The error bars represent standard error of mean (SEM). (B) Cell viability of primary tumor cells (P1-P5) after treatment with MYCN inhibitors.
Cancers 13 05248 g002
Figure 3. MYCN inhibition promotes cell cycle arrest at G0/G1 phase and induces apoptosis in RB cells. (A) Fraction of cells accumulated in each phase of the cell cycle after treatment with JQ1 and I-BET762 in Y79 and LRB1 cells. (B) Total apoptosis in Y79 and LRB1 cells treated with JQ1 and I-BET762. (C) Protein expression levels of MYCN, Bcl-2 and p53 upon inhibition with JQ1 and I-BET762 in Y79 and LRB1 cells. The error bars represent the standard error of mean (* p < 0.05 vs. untreated, *** p < 0.001 vs. untreated).
Cancers 13 05248 g003
Figure 4. MYCN knockdown in RB cells results in decreased cell viability and cell cycle arrest at G0/G1 phase. (A) Confirmation of MYCN knockdown and the levels of p53 and Bcl-2 proteins upon MYCN knockdown in Y79 and LRB1 cells. (B) Effect of MYCN knockdown on RB cell viability in comparison with the scrambled control cells. (C) Cell cycle analysis in response to MYCN knockdown. The error bars represent standard error of mean (* p < 0.05, ** p < 0.01, *** p < 0.001 determined by Student’s t-test).
Cancers 13 05248 g004
Figure 5. Microarray analysis of differentially expressed genes (DEGs). (A) Volcano plot constructed using fold change and p-values to compare the gene expression changes between scrambled and MYCN knockdown (KD-1) Y79 cells. The green spots indicate significantly downregulated genes with log2 (fold change) < −1 and p-value < 0.05, and red spots represent the significantly upregulated genes with log2 (fold change) > 1 and p-value < 0.05. the yellow and blue spots indicate the non-significant changes in gene expression. (B) KEGG pathway enrichment analysis of downregulated DEGs upon MYCN knockdown. (C) GO functional enrichment analysis of downregulated DEGs in response to MYCN knockdown. GO terms are enriched into three subgroups: Molecular function, Cellular component and Biological process. KEGG: Kyoto Encyclopedia of Genes and Genomes, GO: Gene Ontology.
Cancers 13 05248 g005
Figure 6. The impact of MYCN inhibition on metabolic parameters in RB cells. (A) Top 12 downregulated differentially expressed metabolic genes identified by microarray data analysis (upper panel) and qRT-PCR validation of the identified DEGs (lower panel). (B,C) Decreased levels of glucose uptake and reactive oxygen species (ROS) were observed upon MYCN inhibition compared to the untreated control cells. (D) MYCN inhibition with small molecule inhibitors and shRNA knockdown led to decreased lactate levels in Y79 and LRB1 cells. The error bars represent standard error of mean.
Cancers 13 05248 g006
Figure 7. The effects of MYCN inhibition on cell migration in RB cells. (A) The bar graphs represent the top 4 downregulated genes involved in cellular migration and metastasis, upon MYCN knockdown in Y79 cells identified by microarray analysis (upper panel) and qRT-PCR validation of the identified genes (lower panel). (B) Reduced migration of cells was observed upon MYCN knockdown compared to the scrambled control cells. (C) Decreased gelatinolytic activity of active-MMP9 was observed in RB cells following MYCN inhibition. The error bars represent the standard error of mean.
Cancers 13 05248 g007
Figure 8. Combination effects of carboplatin and small molecule inhibitors of MYCN on RB cell viability. Y79 and LRB1 cells were treated with carboplatin, JQ1 and 10058-F4 either alone or in combination. Combination Indices (CI) were determined. CI < 1 was considered synergistic, CI = 1 as additive and CI > 1 as antagonistic. (A) A profound growth inhibitory effect of carboplatin and JQ1 combination was observed in Y79 cells for all the combinations tested, exhibiting synergism whereas variable effects were observed in LRB1 cells. (B) Combination treatment of carboplatin and 10058-F4 resulted in synergism as well as antagonism compared to the single drug treatment.
Cancers 13 05248 g008aCancers 13 05248 g008b
Table 1. Correlation analysis of MYCN expression with demographic and histological characteristics of RB patients.
CharacteristicTotalPositiveNegativeStatistical Testp-ValueRemarks
Age at diagnosis
(Months)
Median 3624Student’s t test0.42NS
Mean 33.61 ± 24.3028.90 ± 16.41
Range 1–9612–84
GenderMale372413Chi-square test0.56NS
Female21129
LateralityUnilateral523121Chi-square test0.25NS
Bilateral651
ChemotherapyYes1688Chi-square test0.24NS
No422814
Choroid invasionPresent281810Chi-square test0.73NS
Absent301812
Optic nerve
invasion
Present341816Chi-square test0.08NS
Absent24186
Anterior chamber invasionPresent945Chi-square test0.23NS
Absent493217
Scleral invasionPresent954Chi-square test0.66NS
Absent493118
DifferentiationWell743Chi-square test0.95NS
Moderate1174
Poor342113
Undifferentiated642
NS: Not significant.
Publisher’s Note: MDPI stays neutral with regard to jurisdictional claims in published maps and institutional affiliations.

