Simple Summary
The objective of the study was to assess the radiomics features obtained by computed tomography (CT) examination as biomarkers in order to select patients with lung adenocarcinoma who would benefit from immunotherapy. We demonstrated that specific radiomic features could be used to select patients with lung adenocarcinoma who would benefit from immunotherapy by predicting OS or PFS time.
Abstract
Purpose: To assess the efficacy of radiomics features obtained by computed tomography (CT) examination as biomarkers in order to select patients with lung adenocarcinoma who would benefit from immunotherapy. Methods: Seventy-four patients (median age 63 years, range 42–86 years) with histologically confirmed lung cancer who underwent immunotherapy as first- or second-line therapy and who had baseline CT studies were enrolled in this approved retrospective study. As a control group, we selected 50 patients (median age 66 years, range 36–86 years) from 2005 to 2013 with histologically confirmed lung adenocarcinoma who underwent chemotherapy alone or in combination with targeted therapy. A total of 573 radiomic metrics were extracted: 14 features based on Hounsfield unit values specific for lung CT images; 66 first-order profile features based on intensity values; 43 second-order profile features based on lesion shape; 393 third-order profile features; and 57 features with higher-order profiles. Univariate and multivariate statistical analysis with pattern recognition approaches and the least absolute shrinkage and selection operator (LASSO) method were used to assess the capability of extracted radiomics features to predict overall survival (OS) and progression free survival (PFS) time. Results: A total of 38 patients (median age 61; range 41–78 years) with confirmed lung adenocarcinoma and subjected to immunotherapy satisfied inclusion criteria, and 50 patients in a control group were included in the analysis The shift in the center of mass of the lesion due to image intensity was significant both to predict OS in patients subjected to immunotherapy and to predict PFS in patients subjected to immunotherapy and in patients in the control group. With univariate analysis, low diagnostic accuracy was reached to stratify patients based on OS and PFS time. Regarding multivariate analysis, considering the robust (two morphological features, three textural features and three higher-order statistical metrics) application of the LASSO approach and all patients, a support vector machine reached the best results for stratifying patients based on OS (area under curve (AUC) of 0.89 and accuracy of 81.6%). Alternatively, considering the robust predictors (six textural features and one higher-order statistical metric) and application of the LASSO approach including all patients, a decision tree reached the best results for stratifying patients based on PFS time (AUC of 0.96 and accuracy of 94.7%). Conclusions: Specific radiomic features could be used to select patients with lung adenocarcinoma who would benefit from immunotherapy because a subset of imaging radiomic features useful to predict OS or PFS time were different between the control group and the immunotherapy group.
1. Introduction
For men, lung cancer is the leading cause of morbidity and mortality among oncological diseases; for women, on the other hand, it is third in incidence and second in mortality [1,2]. As first-line therapy in advanced non-small cell lung cancer (NSCLC), immunotherapy is used both as a single treatment and as a treatment in combination with chemotherapy.
The efficacy of immunotherapy in NSCLC and its pathophysiology has made evident over time the new cellular mechanisms associated with the response to treatment and to intrinsic resistance [3]. Moreover, bioinformatics analyses are becoming increasingly sophisticated, allowing the analysis and integration of complex clinical and biological data to further understand the biology of cancer, notably of lung carcinoma [3,4,5,6].
It is necessary to consider that even in the context of recent clinical scientific progress, the belief in clinical evidence of new robust biomarkers that predict response, resistance and/or toxicity to treatment in clinical care practice remains idealistic. Consequently, there is an urgent need to develop efficient biomarkers that can select patients who would benefit from immunotherapy, thereby providing the appropriate treatment and avoiding toxicity [3,6].
Radiomics is an emerging field, especially in the oncology field [7,8,9,10,11]. The radiomic approach has been used, in fact, in various research studies on pancreatic cancer [7], lung cancer [8,9], rectal cancer [10] and lymphoma [11].
The use of radiomics, as amply demonstrated by some studies, has been fundamental for predicting TNM and histological grade, response to therapy and survival in numerous oncological diseases [12,13,14].
It is inevitable to consider that by associating radiomic parameters with useful clinical and laboratory data, accurate and robust evidence-based clinical decision support systems (CDSS) could be established [15,16,17].
The radiogenomic approach (constituted by the combination of genomic data and radiomic metrics) [18,19] would allow the achievement of the most considerable level of precision medicine [20,21].
The primary endpoint of this study was to assess the efficacy of radiomics features obtained by computed tomography (CT) examination as biomarkers that could select patients with lung adenocarcinoma who would benefit from immunotherapy.
2. Materials and Methods
2.1. Patient Selection
The Local Ethics Committee of the National Cancer Institute of Naples, involving the National Cancer Institute of Naples Pascale Foundation and the Careggi University Hospital of Florence, with internal resolution no. 15 of 4 March 2019, approved a spontaneous multicenter retrospective study.
For the study, 74 patients (mean age 63 years, range 42–86 years) with histologically confirmed lung cancer who underwent immunotherapy (programmed cell death protein 1 (PD-1) and programmed death-ligand 1 (PD-L1) inhibitors) as first- or second-line therapy and a baseline CT study.
Because the study was performed in accordance with relevant guidelines and regulations, informed consent was not required by the Local Ethics Committee of the National Cancer Institute of Naples due to the retrospective nature of the study.
Inclusion and exclusion criteria are provided in Table 1.

Table 1.
Inclusion and exclusion criteria.
As a control group, we selected 50 patients (median age 66 years, range 36–86 years) from 2005 to 2013 with histologically confirmed lung adenocarcinoma who underwent chemotherapy alone or combined with targeted therapy other than immunotherapy and who were subjected to a baseline CT study, including a CT venous phase protocol.
2.2. CT Protocol
Thanks to the use of 4 different scanners: General Electric Healthcare CT tomographs with 64 detectors (1 Optima 660 and 1 Discovery 750 HD, General Electric Healthcare, Milwaukee, Wisconsin, USA), 1 Philips CT scanner with 128 detectors (ICT SP 128 slice, Philips, Amsterdam, The Netherlands) and 1 Siemens CT scanner with 64 sections (Siemens Somatom Flash, Erlangen, Germany) it was possible to acquire computed tomography. Parameters of the CT scan data were already reported [22].
2.3. Radiological Assessment
Several radiologists with different levels of experience in reading and interpreting chest CT (low experience 5 years, average experience 5–15 years, and high experience ≥15 years) performed the radiological evaluations.
By selecting a single target lesion for each patient, the most visible lesion with the largest diameter was then analyzed.
Radiologists performed CT assessment using dedicated CT post-processing workstations and the HealthMyne® software platform (www.healthmyne.com, accessed on 16 January 2020, HealthMyne, Madison, WI, USA). To reduce recall bias, all 3 readers maintained a gap of more than 2 weeks between the 2 sessions.
2.4. CT Post-Processing with Radiomic Precision Metrics (RPM™) Tool
In this study we used the HealthMyne® platform for lesion segmentation and for radiomic features extraction from the delineated volumes of interest (VOIs). By means of the RPM™ algorithms, it was possible to semi-automatically recognize and segment the volume of the target lesions identified by the radiologist and automatically extract a wide range of quantitative data. The user initialized the lesion segmentation by drawing a long axis on a plane of the multiplanar reconstruction (MPR) (Figure 1A). A 2D segmentation updated in real-time with interactive feedback of the lesion boundary [23,24] and 2D segmentations on the other MPR planes were immediately proposed. When the contour on a MPR plane was unsatisfactory, the user could update the segmentation by either drawing long axes on the other MPR views or using a 2D brush tool (Figure 1B). When the segmentation was satisfactory, the user could confirm to initiate the 3D segmentation computation. Based on these initial user interactions, the RPM™ algorithms combined statistical sampling methods together with deep learning strategies in order to delineate the target volume and provide an automatic 3D segmentation (Figure 1C). The 3D segmentation occurred quickly (approximate time = 1–2 s), and could be reviewed by scrolling through slices on the MPR views. Interactive editing tools including 2D and 3D brushes could be used to reduce/enlarge or add details to the proposed volume segmentation. As the 3D segmentation was confirmed by the user, the measure of the long and short lesion axes was automatically determined by leveraging the volume delineation (Figure 2).
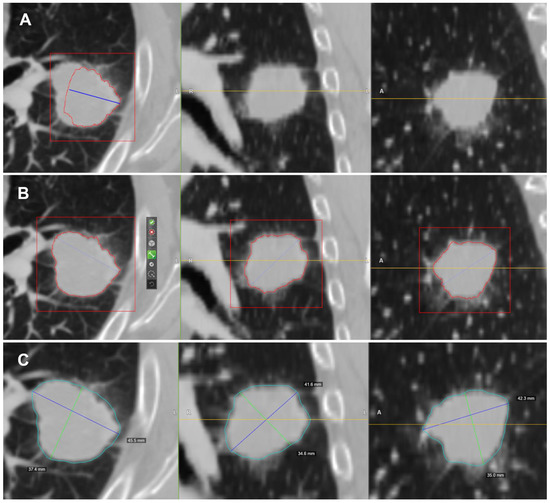
Figure 1.
Semi-automatic lesion identification: (A) Manual ROI indication. In blue, it is possible to observe the axes that cross the lesion manually delineated by the radiologist on a plane of the MPR. The intensity of the lesion boundary (estimated) is represented with a red outline. (B) Additional axes can be dragged onto other orthogonal MPR views. From left to right, it is possible to observe the initial long axis outlined by the radiologist and the 2D contours on the axial, coronal and sagittal views of the lesion used as a starting point for the RPM ™ algorithms. (C) Resulting 3D contour of the lesion (in blue).
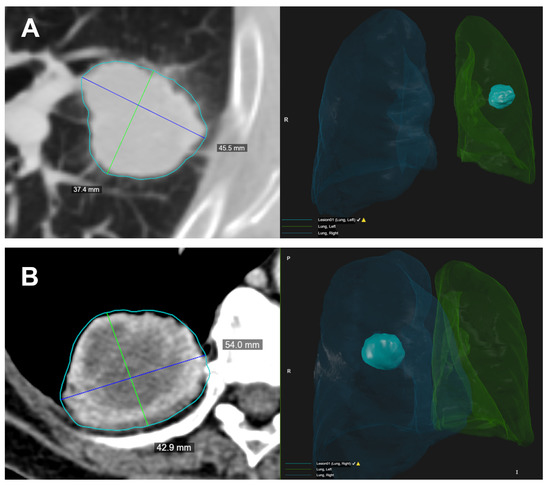
Figure 2.
Two examples (A,B) of the semi-automated identification of the target lesion. On the left, the CT image with the lesion segmentation (light blue contour) and the longest diameters measured on the lesion volume. The blue lines represent the longest long axes and the green lines represent the longest short axes on the axial direction. On the right, it is possible to observe the 3D rendering of the lesion volume and its location inside the automatic lung segmentation.
A total of 573 radiomic metrics were extracted from the delineated VOIs as previously reported in [24]: 14 features based on Hounsfield unit (HU) values specific for lung CT images; 66 first-order profile features based on intensity values (statistical distribution of image value); 43 second-order profile features based on lesion shape (geometric analysis of shape, volume, curvature and volumetric length); 393 third-order profile features, i.e., texture features, with IBSI-consistent implementation [25] of the grey-level co-occurrence matrix (GLCM), the grey-level distance zone matrix (GLDZM), the grey-level run length matrix (GLRLM), the grey-level size zone matrix (GLSZM), the neighboring grey-level dependence matrix (NGLDM), the neighboring grey-tone difference matrix (NGTDM) and the different features’ aggregation methods, as well as 57 features with higher-order profiles (statistical metrics after transformations and wavelet analysis).
2.5. Statistical Analysis
2.5.1. Univariate Analysis
Overall survival (OS) was defined as the time between the date of first dose of therapy and the date of death or date of last clinical follow-up. Similarly, progression-free survival (PFS) was measured from the date of first dose of therapy to the time of tumor progression, recurrence, death or the time the patient was last known to be alive. The estimate of overall survival and progression-free survival was calculated with Kaplan—Meier analysis.
For each metric, median and range values were calculated.
The calculation of inter-observer variability between readers by intraclass correlation coefficient (ICC) and the evaluation of unstable features were performed.
Cox proportional hazard models were used for exploring univariate associations between OS and each stable imaging feature (identified as ICC value ≥0.8) and between PFS and each stable imaging feature (identified as ICC value ≥0.8). The evaluation between the survival rate and the variables was done using a technique called Cox regression analysis.
The risk measure provided for each variable was the risk ratio (RR): a RR of 1 means that the risk is the same for each participant; a RR >1 indicates higher risk; a RR <1 indicates lower risk.
A Wilcoxon–Mann–Whitney U test was performed to identify differences among imaging radiomic metrics of two groups (immunotherapy group and control group). A non-parametric Kruskal—Wallis test was performed to identify the significant features for stratifying the patients into two groups based on median cutoff of survival time (i.e., OS = 32 months and PFS = 10 months) corresponding to short (i.e., <median survival time) or long survival time (i.e., ≥median survival time).
Receiver operating characteristic (ROC) analysis was performed. The Youden index was used to individuate the optimal cutoff value for each feature and area under the ROC curve (AUC), sensitivity (SENS), specificity (SPEC), positive predictive value (PPV), negative predictive value (NPV) and accuracy (ACC) were obtained, considering the optimal cutoff value.
The statistical analyses were performed using the Statistics Toolbox of MATLAB R2007a (MathWorks, Natick, MA, USA).
2.5.2. Multivariate Analysis
For multivariate analysis, we considered all stable significant features of univariate analyses as inputs for a classifier model. Pattern recognition methods (linear discrimination analysis (LDA), support vector machine (SVM), k-nearest neighbor (KNN), artificial neural network (ANN) and decision tree (DT)) were considered to assess the survival prediction ability [26]. The best model was chosen considering the highest area under the ROC curve and highest accuracy. Moreover, the analysis was made before and after a feature selection method: the robust features were selected by the least absolute shrinkage and selection operator (LASSO) method [27,28]. In the LASSO method, 10-fold cross-validation was used to select the optimal regularization parameter alpha, considering that the average of each patient’s mean square error was the smallest. With the optimal alpha, features with a nonzero coefficient in LASSO were reserved. Feature selection was carried out considering the λ value with the minimum mean square error (minMSE) [29,30].
A 10-k-fold cross validation approach was used to individuate the best classifier on the training set; therefore, median and 95% confidence interval values of AUC, accuracy, sensitivity, and specificity were calculated.
Multivariate analysis was performed using the statistics and Machine Learning Toolbox of MATLAB R2007a (MathWorks, Natick, MA, USA).
3. Results
Thirty-eight patients (median age 61; range 41–78 years) with confirmed lung adenocarcinoma and subjected to immunotherapy satisfied the inclusion criteria. We excluded: (a) 19 patients since the histological diagnosis was other than adenocarcinoma, (b) 17 patients since the baseline CT studies were not performed with contrast media.
3.1. Univariate Analysis Results
The Kruskal—Wallis test did not detect statistically significant differences in OS (Figure 3a) and PFS values (Figure 4a) among the two groups (immunotherapy group and control group), demonstrating the homogeneity among the two patient groups. Kaplan—Meier curves of OS and PFS are shown, respectively, in Figure 3b,c for the immunotherapy and control group and in Figure 4b,c for the immunotherapy and control group. The median value of OS for the immunotherapy group was equal to 32 months (range 2–72 months), while the median value of OS in the control group was 28 months (range 6–162 months). The median value of PFS for the immunotherapy group was equal to 12 months (range 1–60 months), while median value of PFS in the control group was 10 months (range 3–162 months).
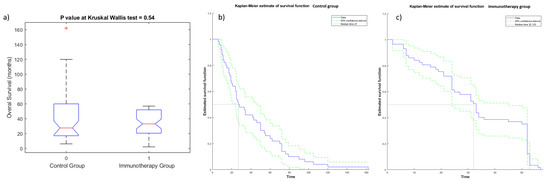
Figure 3.
Boxplot (a) and Kaplan—Meier curve of OS for patients of control group (b) and of immunotherapy group (c).
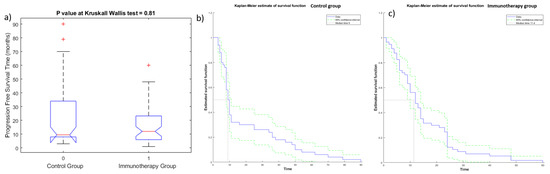
Figure 4.
Boxplot (a) and Kaplan—Meier curve of PFS for patients of control group (b) and of immunotherapy group (c).
Stable features (intraclass correlation coefficient value ≥ 0.8) were 121 among 573 calculated (see Appendix A for the description of each stable feature): 5 lung CT features, 26 morphological features, 1 feature based on intensity values, 76 texture features and 13 higher-order statistical features. The median value of intraclass correlation coefficients for stable features was 0.9 (range 0.85–0.96). Median size of lesions was 3 cm, with range of 1.0–12 cm. The size of the lesion did not affect the stable metrics (p value > 0.05 at the Wilcoxon–Mann–Whitney U test performed between the groups obtained by dividing patients with lesions < 3 cm and patients with lesions ≥ 3 cm).
Using Cox proportional hazard models, we found significant radiomic features to predict OS and PFS time in both groups (see Table 2 and Table 3): exclusively textual features including higher-order statistical metrics were significant in the Cox proportional hazard model. No metrics in the control group had a risk ratio > 1 to predict OS, while only one textural metric in immunotherapy group had a risk ratio > 1 to predict OS (Table 2): the grey-level nonuniformity as volume, with full merging by grey-level size zone matrix (GLSZM_IBSI_GL_NONUNIF_3D_HU GLSZM).
Table 2.
Significant radiomic features in Cox regression analysis with risk ratio value based on OS time stratification (short and long OS time).
Table 3.
Significant radiomic features in Cox regression analysis with risk ratio value based on PFS time stratification (short and log PFS time).
Several radiomic textural metrics in the immunotherapy group had a risk ratio >1 to predict PFS, while only one textural metric in the control group had a risk ratio >1 to predict PFS (Table 3): the NGLDM GL nonuniformity by slice, with merging by slice by neighboring grey-level dependence matrix (NGLDM_IBSI_GLNONUNIF_2DV_HU).
With regard to ROC analysis, we considered only the most important features. Table 4 reports the subset of significant features from Kruskal—Wallis tests for stratifying the patients into two groups based on median cutoff of OS time (short and long OS time). A total of 19 features were significant (3 morphological features, 1 feature based on intensity value, 12 textural metrics and 3 higher-order statistical metrics) to predict overall survival time. Among these 19, the best feature for stratifying the patients with short or long OS time was a higher-order statistical metric: the mean value of 2D Laplacian of Gaussian transformed voxels at 2.5 mm of smoothing (LOG_2D_MEAN_2_5MM_HU) with an AUC of 66.0%, a sensitivity of 69.0% and a specificity of 65.0%.
Table 4.
Median and range values for textural features significant for stratifying the patients into two groups based on median cutoff of OS time (short and long time). Diagnostic performance is also reported for each significant feature, considering the optimal cutoff value obtained by ROC analysis.
Table 5 reports the subset of significant features from Kruskal—Wallis tests for stratifying the patients into two groups based on median cutoff of PFS time (short and long PFS time). A total of 104 features (5 lung CT features, 23 morphological features, 1 feature based on intensity value, 64 textural features and 11 higher-order statistical metrics) were significant in predicting PFS time. Among these 104, the best feature for stratifying the patients based on PFS time was a textural feature: the average energy of gray-level co-occurrence matrix (GLCM_ENERGY) with an AUC of 70.0%, a sensitivity of 73.0% and a specificity of 64.0%.
Table 5.
Median value and range for textural features significant for stratifying the patients into two groups based on median cutoff of PFS time (short and long time).
The shift in the center of mass of the lesion due to image intensity (SHIFT_CENTER_OF_MASS_MM) was significant for predicting OS in patients subjected to immunotherapy and also for predicting PFS in both groups (patients subjected to immunotherapy and patients in the control group).
3.2. Multivariate Analysis Results
Regarding multivariate analyses, only the most useful results considering the purposes of this study are reported. Using all stable significant features, no tested classifier reached higher accuracy than a single radiomics feature for stratifying patients based on OS and PFS time (short or long survival time).
Considering the robust predictors by the LASSO approach and all patients, an SVM (Figure 5) reached the best results for stratifying patients based on OS time, with an AUC of 0.93 (0.85–0.96 95% confidence interval (CI)), an accuracy of 84.1% (80–86% 95% CI), a sensitivity of 74.4% (69–78% 95% CI) and a specificity of 93.3% (88–95% 95% CI). The robust predictors as input to the SVM totaled seven, including two morphological features, two textural features and three higher-order statistical metrics: greatest planar axis; volume fraction of the approximate enclosing ellipsoid occupied by the ROI (VOLUME_DENSITY_AEE); two features by GLCM cluster prominence for grey-leveled image from IBSI by slice (GLCM_IBSI_CLUSTERPROMINENCE_2DS_HU and complexity from averaging metrics by neighborhood gray-tone difference matrix (NGTDM_COMPLEXITY_2DF_HU)); median value of voxels under wavelet transforms with filters HHL (WAVELET_HHL_MEDIAN_HU); minimum value of voxels under wavelet transforms with filters (HHL WAVELET_HHL_MIN_HU); and the mean value of 2D Laplacian of Gaussian transformed voxels at 2.5 mm of smoothing (LOG_2D_MEAN_2_5MM_HU). The SVM classifier in the subset of patients treated with immunotherapy reached an AUC of 0.89, an accuracy of 81.6%, a sensitivity of 82.4% and a specificity of 81.0%.
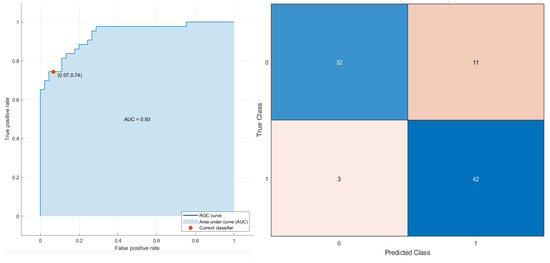
Figure 5.
ROC curve and confusion matrix of SVM as the best classifier for stratifying the patients based on OS time (short and long time).
Conversely, considering the robust predictors by the LASSO approach and all patients, a decision tree (Figure 6) reached the best results for stratifying patients based on PFS time with an AUC of 0.96 (0.895–1.0 95% confidence interval (CI)), an accuracy of 93.2% (88–96% 95% CI), a sensitivity of 91.1% (87–94% 95% CI) and a specificity of 5.3% (90–99% 95% CI). The robust predictors as inputs of SVM totaled seven (six textural features and one higher-order statistical metric):
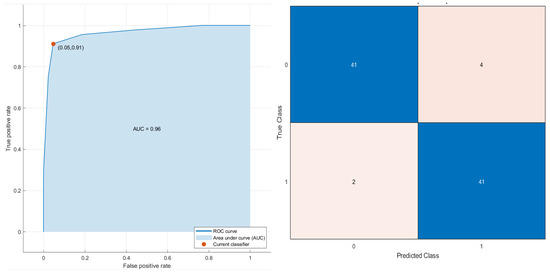
Figure 6.
ROC curve and confusion matrix of decision tree as the best classifier for stratifying the patients based on PFS time (short and time).
Grey-level variance by neighborhood grey-level difference matrix (NGLDM_IBSI_DEP_VARIANCE_2DF_HU); average correlations of GLCM (GLCM_IBSI_CORRELLATION_2DS_HU); grey-level non-uniformity in three dimensions (GLDZM_IBSI_ZONE_DISTANCE_NONUNIFORMITY_3D_HU); entropy value in three dimensions by neighborhood grey-level difference matrix (NGLDM_IBSI_DEP_ENTROPY_3D_HU); high grey-level run emphasis in three dimensions by neighborhood grey-level difference matrix (NGLDM_IBSI_HIGH_DEP_LOW_GL_EMPH_3D_HU); strength value by slice with full merging by neighborhood grey-level difference matrix (NGTDM_STRENGTH_2DV_HU); the mean value of 2D Laplacian of Gaussian transformed voxels at 2.5 mm of smoothing (LOG_2D_MEAN_2_5MM_HU). The decision tree classifier in the subset of patients treated with immunotherapy reached an AUC of 0.96, an accuracy of 94.7%, a sensitivity of 87.5% and a specificity of 100.0%.
4. Discussion
Immunotherapy, capable of stimulating the cellular immune response against cancer, uses immune checkpoint blockade (ICI), a treatment paradigm in advanced cancer treatment.
The two main groups of agents used almost exclusively in tumors [31,32] are programmed cell death protein 1 (PD-1) and programmed death-ligand 1 (PD-L1) inhibitors; some authors analyzed the results of these ligands in small cell lung cancer [33,34,35]. Despite this, resistance to primary therapy does not allow all patients to benefit from the treatment regimen.
Considering this, it is therefore necessary to identify biomarkers that allow the appropriate selection of patients and the right stratification. Radiomics can therefore effectively support precision medicine decisions by identifying imaging biomarkers. Indeed, radiomics consists in the extraction of many quantitative characteristics through medical images [36]. This quantitative analysis, considering the heterogeneity of the macroscopic features based on the image [37], can identify the overall tumor.
The division into segments is not an immediate step in the whole of the radiomic process because the subsequent extraction of the characteristics is obtained from the segmented VOI. Lately, plot analysis has broadened its application to medical applications [37]. The quantification of grayscale patterns and pixel interrelationships that provide a measure of heterogeneity is what is called texture analysis.
In this study we evaluated 573 radiomic features; among them 121 were stable: 5 lung CT features, 26 morphological features, 1 feature based on intensity values, 76 texture features and 13 higher-order statistical features. Considering Cox proportional hazard models, textual features including higher-order statistic metrics were exclusively significant.
Considering Kruskal—Wallis tests, 19 radiomic features (3 morphological features, 1 feature based on intensity value, 12 textural metrics and 3 higher-order statistical metrics) were significant for predicting overall survival time. The best feature for stratifying the patients with short or long OS time was a higher-order statistical metric: the mean value of 2D Laplacian of Gaussian transformed voxels at 2.5 mm of smoothing (LOG_2D_MEAN_2_5MM_HU), with an AUC of 66.0%, a sensitivity of 69.0% and a specificity of 65.0%.
Considering Kruskal—Wallis tests, 108 radiomic features (5 lung CT features, 23 morphological features, 1 feature based on intensity value, 64 textural features and 11 higher-order statistical metrics) were significant for predicting PFS time. The best feature for stratifying the patients based on PFS time was a textural feature: GLCM ENERGY, with an AUC of 70.0%, a sensitivity of 73.0% and a specificity of 64.0%.
However, the subset of imaging radiomic features for predicting OS or PFS time was different in the control group and immunotherapy group; this demonstrated that specific radiomic features could be used to select patients with lung adenocarcinoma who would benefit from immunotherapy.
Exclusively, the shift in the center of mass of the lesion due to image intensity (SHIFT_CENTER_OF_MASS_MM) was significant both for predicting OS in patients subjected to immunotherapy and for predicting PFS in patients subjected to immunotherapy and in patients in the control group.
However, in univariate analysis, low diagnostic accuracy was reached for stratifying patients based on OS and PFS time.
A multivariate analysis using all stable significant features found that no tested classifier reached higher accuracy than a single radiomic feature for stratifying patients based on OS and PFS time (short or long survival time). Conversely, considering the robust predictors by the LASSO approach and all patients, an SVM reached the best results for stratifying patients based on OS. The SVM classifier in the subset of patients treated with immunotherapy reached an AUC of 0.89, an accuracy of 81.6%, a sensitivity of 82.4% and a specificity of 81.0%. However, considering the robust predictors of the LASSO approach and all patients, a decision tree reached the best results for stratifying patients based on PFS time. The decision tree classifier in the subset of patients treated with immunotherapy reached an AUC of 0.96, an accuracy of 94.7%, a sensitivity of 87.5% and a specificity of 100.0%.
The relationship between radiomics and immunotherapeutic response was demonstrated by numerous experts.
Radiomic signatures could be considered critically important inputs as a biomarkers for immune profiles and immune checkpoint inhibition response, according to a multi-center retrospective study on advanced cancers that considered all advanced cancers, including lung cancer [38].
Consequently, in a sample of 200 advanced NSCLC patients who received single anti-PD-1/PD-L1, Yang et al. assessed 1633 CT scans and 3414 blood samples, including serial radiomics, laboratory data and baseline clinical data, to build deep learning models useful for the selection and identification of responders and non-responders to immunotherapy. They found that a deep learning-based prediction model showed a good performance in distinguishing responders from non-responders to anti-PD-1/PD-L1 therapy [39].
In patients treated with the anti-PD-1 antibody, by combining PD-L1ES with a clinical model that was constructed using age, sex, smoking history and family history of malignant tumors, the reaction to immunotherapy could be anticipated in a manner more accurate than using PD-L1ES or the clinical model alone as predictors [40].
Accordingly, Tian et al. conducted analyses on PD-L1 expression in 939 consecutive stage IIIB–IV NSCLC patients with baseline CT images and found that deep learning on computed tomography images could predict a high expression of PD-L1 (PD-L1 ≥50%), with an AUC of 0.78.
The present study has several limitations: the small population size considered, the retrospective nature of the study and the awareness that CT images were collected by different centers and thus were usually obtained using different protocols. The radiomic model can be affected by these differences; radiomics data were not correlated and combined with clinical information.
5. Conclusions
With the contribution of medical images usually acquired in clinical practice, radiomics can be a useful support for precision medicine.
We demonstrated that specific radiomic features extracted by CT could be used to select patients with lung adenocarcinoma who would benefit from immunotherapy; in fact, the subset of radiomic features able to predict OS or PFS time was different in the control group and immunotherapy group.
Author Contributions
Conceptualization, V.G. and R.G. (Roberto Grassi); methodology, V.G., R.F., M.C., C.P., D.C., C.M., G.V.L.C., A.M., R.M., F.M., R.G. (Roberta Grassi), V.G.M., S.C., R.G. (Roberto Grassi), V.M. and A.P., formal analysis, M.C. and R.F.; investigation, V.G., R.F., M.C., C.P., D.C., C.M., G.V.L.C., A.M., R.M., F.M., R.G. (Roberta Grassi), V.G.M., S.C., R.G. (Roberto Grassi), V.M. and A.P.; data curation, V.G. and R.F.; writing—original draft preparation, V.G. and R.F.; writing—review and editing, V.G. and R.F. All authors have read and agreed to the published version of the manuscript.
Funding
This research received no external funding.
Institutional Review Board Statement
Ethics approval and consent to participate: National Cancer Institute of Naples Local Ethical Committee as a multicenter observational retrospective spontaneous study (Deliberation n. 15 of 4 March 2019). National Cancer Institute of Naples Local Ethical Committee approved this multicenter observational retrospective spontaneous study with internal deliberation n. 15 of 4 March 2019. The study was conducted according to relevant guidelines and regulations.
Informed Consent Statement
Informed consent was waived by the National Cancer Institute of Naples Local Ethical Committee because of the retrospective nature of the study.
Data Availability Statement
Data are contained within the article.
Acknowledgments
The authors are grateful to Alessandra Trocino, librarian at the National Cancer Institute of Naples, Italy.
Conflicts of Interest
The authors have no conflict of interest to be disclosed. The authors confirm that the article is not under consideration for publication elsewhere. Each author has participated sufficiently to take public responsibility for the manuscript content.
Consent for Publication: Not Applicable.
Abbreviations
| ACC | accuracy |
| ANN | artificial neural network |
| AUC | area under ROC curve |
| CT | computed tomography |
| CDSS | clinical decision support systems |
| DT | decision tree |
| KNN | k-nearest neighbor |
| GLCM | grey-level co-occurrence matrix |
| GLDZM | grey-level distance zone matrix |
| GLRLM | grey-level run length matrix |
| GLSZM | grey-level size zone matrix |
| LASSO | least absolute shrinkage and selection operator |
| LDA | linear discrimination analysis |
| LOG | Laplacian of Gaussian |
| NSCLC | non-small cell lung cancer |
| NGLDM | neighboring grey-level dependence matrix |
| NGTDM | neighboring grey-tone difference matrix |
| NPV | negative predictive value |
| OS | overall survival |
| PFS | progression-free survival |
| PPV | positive predictive value |
| QIDS | quantitative imaging decision support |
| SENS | sensitivity |
| SPEC | specificity |
| SVM | support vector machine |
| ROC | receiver operating characteristic |
| RPM | rapid precise metrics |
| WHO | World Health Organization |
Appendix A
| Metric Code | Name | Feature Type | Units | IBSI Compliance | Description |
| SOLID_VOLUME_ML | Solid Density Volume | lung CT features | mL | Volume of the solid density of the specified ROI in milliliters. | |
| SOLID_VOLUME_MM3 | Solid Density Volume | mm^3 | Volume of the solid density of the specified ROI in cubic millimeters. | ||
| SOLID_VOLUME_VOXELS | Solid Density Volume | voxels | Volume of the solid density of the specified ROI in voxels. | ||
| PART_SOLID_DIAMETER_MM | Part-Solid Diameter | mm | The average diameter of the solid portions of a part-solid lesion. | ||
| PERCENT_AIR | Percent Air | The estimated percent of volume that is air in this ROI. | |||
| ANTPOST_LENGTH_MM | Anterior-Posterior Length | morphological features | mm | A measure of the anterior-posterior distance. | |
| APPROXIMATE_VOLUME_ML | Approximate Volume | mL | Approximate volume of the specified ROI of the image in milliliters. For studies with gantry tilt, PARALLELEPIPED_VOLUME_MM3 is recommended. | ||
| APPROXIMATE_VOLUME_MM3 | Approximate Volume | mm^3 | Approximate volume of the specified ROI of the image in cubic millimeters assuming water equivalent. For studies with gantry tilt, PARALLELEPIPED_VOLUME_MM3 is recommended. | ||
| AVG_AXIAL_DIAMETER_MM | Average Axial Diameter | mm | The average of largest axial planar and orthogonal diameters, in millimeters | ||
| AVG_CORONAL_DIAMETER_MM | Average Coronal Diameter | mm | The average of largest coronal planar and orthogonal diameters, in millimeters | ||
| AVG_SAGITTAL_DIAMETER_MM | Average Sagittal Diameter | mm | The average of largest sagittal planar and orthogonal diameters, in millimeters | ||
| COMPACTNESS1_MM | Mesh Compactness 1 | mm^5/3 | 1 | IBSI-consistent dimensionful measure of compactness of ROI, independent of scale and orientation (first of three implementations), using standard unit shape-derived information. | |
| CORONAL_LONG_AXIS_MM | Coronal Long Axis | mm | A measure of the longest straight line that can fit entirely inside an XZ-planar slice of the 3D structure (from edge to edge, without ever leaving structure), in millimeters. | ||
| CRANIALCAUDAL_LENGTH_MM | Cranial-Caudal Length | mm | A measure of the cranial-caudal distance. | ||
| VOLUME_DENSITY_AEE | Volume Density-Approximate Enclosing Ellipsoid | 1 | IBSI-consistent volume fraction of the approximate enclosing ellipsoid occupied by the ROI | ||
| VOLUME_ML | Volume | mL | IBSI-consistent volume of the specified ROI of the image in milliliters. | ||
| VOLUME_MM3 | Volume | mm^3 | IBSI-consistent volume of the specified ROI of the image in cubic millimeters. | ||
| VOLUME_VOXELS | Volume | voxels | IBSI-consistent approximate volume derived from voxel count inside ROI | ||
| VOLUMETRIC_LENGTH_MM | Volumetric Length | mm | A measure of the longest straight line that can fit entirely inside the 3D structure (from edge to edge, without ever leaving structure). | ||
| GREATEST_PLANAR_AXIS | Greatest Planar Axis Length | mm | |||
| GREATEST_PLANAR_LENGTH | Greatest Planar Long Axis Length | mm | Greatest length among the sagittal longest axis, axial longest axis, and coronal longest axis lengths. | ||
| L1_DISTANCE_MM | Long (L1) Full Axis Length | mm | IBSI-consistent length of the long (L1) full principal axis, in millimeters, from edge to edge of the ROI. | ||
| L2_DISTANCE_MM | Short (L2) Full Axis Length | mm | IBSI-consistent length of the short (L2) full principal axis, in millimeters, from edge to edge of the ROI. | ||
| L3_DISTANCE_MM | Normal (L3) Full Axis Length | mm | IBSI-consistent length of the normal (L3) full principal axis, in millimeters, from edge to edge of the ROI. | ||
| LARGEST_PLANAR_DIAMETER_MM | Axial Long Axis | mm | A measure of the longest straight line that can fit entirely inside an XY-planar slice of the 3D structure (from edge to edge, without ever leaving structure), in millimeters. | ||
| LARGEST_PLANAR_ORTHO_DIAMETER_MM | Axial Short Axis | mm | A measure of the longest orthogonal line to the longest planar line, that can fit entirely inside an XY-planar slice of the 3D structure (from edge to edge, without ever leaving structure), in millimeters | ||
| SAGITTAL_LONG_AXIS_MM | Sagittal Long Axis | mm | A measure of the longest straight line that can fit entirely inside an YZ-planar slice of the 3D structure (from edge to edge, without ever leaving structure), in millimeters. | ||
| SAGITTAL_SHORT_AXIS_MM | Sagittal Short Axis | mm | A measure of the longest orthogonal line to the longest planar line, that can fit entirely inside an YZ-planar slice of the 3D structure (from edge to edge, without ever leaving structure), in millimeters | ||
| SHIFT_CENTER_OF_MASS_MM | Center of Mass Shift | mm | 1 | IBSI-consistent shift in the center of mass due to image intensity. | |
| SURFACE_AREA_MM2 | Surface Area | mm^2 | 1 | IBSI-consistent surface area of the specified ROI of the image in square millimeters. | |
| TRANSVERSE_LENGTH_MM | Transverse Length | mm | A measure of the transverse distance. | ||
| INTENSITY_HISTOGRAM_ENERGY_HU | Intensity Histogram Energy | Intensity-based feature | 1 | IBSI-consistent intensity histogram energy of all voxels in ROI binned for PET. | |
| GLCM_ASM | GLCM Avg Angular Second Moment | textural features | Average angular second moments of GLCM in all 26 directions. Raw HU used, unbinned and with background padding 1 voxel around the ROI. | ||
| GLCM_CORRELATION | GLCM Avg Correlation | Average correlations of GLCM in all 26 directions. Raw HU used, unbinned and with background padding 1 voxel around the ROI. | |||
| GLCM_CORRELATION_GL | GLCM Avg Correlation for Grey Leveled Image | Average correlations of GLCM in all 26 directions for grey leveled CT or PET image with background padding 1 voxel around the ROI. | |||
| GLCM_ENERGY | GLCM Avg Energy | Average energies of GLCM in all 26 directions. Raw HU used, unbinned and with background padding 1 voxel around the ROI. | |||
| GLCM_ENTROPY | GLCM Avg Entropy | Average entropies of GLCM in all 26 directions. Raw HU used, unbinned and with background padding 1 voxel around the ROI. | |||
| GLCM_IBSI_CLUSTERPROMINENCE_2DF_HU | GLCM Cluster Prominence for Grey Leveled Image from IBSI by Slice without Merging | 1 | IBSI-consistent cluster prominence of GLCM of unpadded ROI binned for CT with aggregation by slice without merging. | ||
| GLCM_IBSI_CLUSTERPROMINENCE_2DS_HU | GLCM Cluster Prominence for Grey Leveled Image from IBSI by Slice with Merging by Slice | 1 | IBSI-consistent cluster prominence of GLCM of unpadded ROI binned for CT with aggregation by slice with merging by slice. | ||
| GLCM_IBSI_CLUSTERPROMINENCE_2DV_HU | GLCM Cluster Prominence for Grey Leveled Image from IBSI by Slice with Merging | 1 | IBSI-consistent cluster prominence of GLCM of unpadded ROI binned for CT with aggregation by slice with merging. | ||
| GLCM_IBSI_CLUSTERPROMINENCE_3DF_HU | GLCM Cluster Prominence for Grey Leveled Image from IBSI by Volume without Merging | 1 | IBSI-consistent cluster prominence of GLCM of unpadded ROI binned for CT with aggregation by volume without merging. binning | ||
| GLCM_IBSI_CLUSTERPROMINENCE_3DV_HU | GLCM Cluster Prominence for Grey Leveled Image from IBSI by Volume with Full Merging | 1 | IBSI-consistent cluster prominence of GLCM of unpadded ROI binned for CT with aggregation by volume with full merging. binning | ||
| GLCM_IBSI_CORRELLATION_2DF_HU | GLCM Correlation for the Grey Leveled Image from the IBSI by Slice without Merging | 1 | IBSI-consistent correlation of GLCM ROI binned for CT with aggregation by slice without merging. | ||
| GLCM_IBSI_CORRELLATION_2DS_HU | GLCM Correlation for the Grey Leveled Image from the IBSI by Slice with Merging by Slice | 1 | IBSI-consistent correlation of GLCM ROI binned for CT with aggregation by slice with merging by slice. | ||
| GLCM_IBSI_CORRELLATION_2DV_HU | GLCM Correlation for the Grey Leveled Image from the IBSI by Slice with Merging | 1 | IBSI-consistent correlation of GLCM ROI binned for CT with aggregation by slice with merging. | ||
| GLCM_IBSI_CORRELLATION_3DF_HU | GLCM Correlation for the Grey Leveled Image from the IBSI by Volume without Merging | 1 | IBSI-consistent correlation of GLCM ROI binned for CT with aggregation by volume without merging. | ||
| GLCM_IBSI_CORRELLATION_3DV_HU | GLCM Correlation for the Grey Leveled Image from the IBSI by Volume with Full Merging | 1 | IBSI-consistent correlation of GLCM ROI binned for CT with aggregation by volume with full merging. | ||
| GLCM_IBSI_FMIC_3DV_HU | GLCM First Measure of InformationCorrelation for Grey Leveled Image from IBSI by Volume with Full Merging | 1 | IBSI-consistent first measure of information correlation of GLCM of unpadded ROI binned for CT with aggregation by volume with full merging. | ||
| GLCM_IBSI_SMIC_3DV_HU | GLCM Second Measure of Information Correlation for Grey Leveled Image from IBSI by Slice with Full Merging | 1 | IBSI-consistent second measure of inform of unpadded ROI binned for CT with aggregation by slice with full merging. | ||
| GLDZM_IBSI_GL_NONUNIFORMITY_2DV_HU | GLDZM Grey Level Nonuniformity with Merging by Slice from CT | 1 | IBSI-consistent grey level nonuniformity of GLDZM of unpadded ROI binned for CT from 8 directions in 2 dimensions with merging. | ||
| GLDZM_IBSI_GL_NONUNIFORMITY_3D_HU | GLDZM Grey Level Nonuniformity from CT | 1 | IBSI-consistent grey level nonuniformity of GLDZM of unpadded ROI binned for CT from 26 directions in 3 dimensions. | ||
| GLDZM_IBSI_GL_VARIANCE_2DS_HU | GLDZM Grey Level Variance from CT without Merging | 1 | IBSI-consistent grey level variance of GLDZM of unpadded ROI binned for CT from 8 directions in 2 dimensions. | ||
| GLDZM_IBSI_GL_VARIANCE_2DV_HU | GLDZM Grey Level Variance with Merging by Slice from CT | 1 | IBSI-consistent grey level variance of GLDZM of unpadded ROI binned for CT from 8 directions in 2 dimensions with merging. | ||
| GLDZM_IBSI_GL_VARIANCE_3D_HU | GLDZM Grey Level Variance from CT | 1 | IBSI-consistent grey level variance of GLDZM of unpadded ROI binned for CT from 26 directions in 3 dimensions. | ||
| GLDZM_IBSI_LARGE_DIST_EMPH_3D_HU | GLDZM Large Distance Emphasis with Full Merging from CT | 1 | IBSI-consistent large distance emphasis of GLDZM of unpadded ROI binned for CT from 26 directions in 3 dimensions. | ||
| GLDZM_IBSI_SMALL_DIST_EMPH_2DS_HU | GLDZM Small Distance Emphasis without Merging from CT | 1 | IBSI-consistent small distance emphasis of GLDZM of unpadded ROI binned for CT from 8 directions in 2 dimensions. | ||
| GLDZM_IBSI_SMALL_DIST_EMPH_2DV_HU | GLDZM Small Distance Emphasis with Merging by Slice from CT | 1 | IBSI-consistent small distance emphasis of GLDZM of unpadded ROI binned for CT from 8 directions in 2 dimensions with merging. | ||
| GLDZM_IBSI_SMALL_DIST_EMPH_3D_HU | GLDZM Small Distance Emphasis with Full Merging from CT | 1 | IBSI-consistent small distance emphasis of GLDZM of unpadded ROI binned for CT from 26 directions in 3 dimensions. | ||
| GLDZM_IBSI_SMALL_DIST_LOW_GL_EMPH_3D_HU | GLDZM Small Distance Low Grey Level Emphasis with Full Merging from CT | 1 | IBSI-consistent small distance low grey level emphasis of GLDZM of unpadded ROI binned for CT from 26 directions in 3 dimensions. | ||
| GLDZM_IBSI_ZONE_DISTANCE_ENTROPY_2DS_HU | GLDZM Zone Distance Entropy without Merging from CT | 1 | IBSI-consistent grey level nonuniformity of GLDZM of unpadded ROI binned for CT from 8 directions in 2 dimensions. | ||
| GLDZM_IBSI_ZONE_DISTANCE_ENTROPY_2DV_HU | GLDZM Zone Distance Entropy with Mergning by Slice from CT | 1 | IBSI-consistent grey level nonuniformity of GLDZM of unpadded ROI binned for CT from 8 directions in 2 dimensions with merging. | ||
| GLDZM_IBSI_ZONE_DISTANCE_ENTROPY_3D_HU | GLDZM Zone Distance Entropy from CT | 1 | IBSI-consistent grey level nonuniformity of GLDZM of unpadded ROI binned for CT from 26 directions in 3 dimensions. | ||
| GLDZM_IBSI_ZONE_DISTANCE_NONUNIFORMITY_2DS_HU | GLDZM Zone Distance Nonuniformity without Merging from CT | 1 | IBSI-consistent grey level nonuniformity of GLDZM of unpadded ROI binned for CT from 8 directions in 2 dimensions. | ||
| GLDZM_IBSI_ZONE_DISTANCE_NONUNIFORMITY_2DV_HU | GLDZM Zone Distance Nonuniformity with Merging by Slice from CT | 1 | IBSI-consistent grey level nonuniformity of GLDZM of unpadded ROI binned for CT from 8 directions in 2 dimensions with merging. | ||
| GLDZM_IBSI_ZONE_DISTANCE_NONUNIFORMITY_3D_HU | GLDZM Zone Distance Nonuniformity from CT | 1 | IBSI-consistent grey level nonuniformity of GLDZM of unpadded ROI binned for CT from 26 directions in 3 dimensions. | ||
| GLDZM_IBSI_ZONE_DISTANCE_NONUNIFORMITY_NORMALIZED_2DS_HU | GLDZM Zone Distance Nonuniformity Normalised without Merging from CT | 1 | IBSI-consistent grey level normalized nonuniformity of GLDZM of unpadded ROI binned for CT from 8 directions in 2 dimensions. | ||
| GLDZM_IBSI_ZONE_DISTANCE_NONUNIFORMITY_NORMALIZED_2DV_HU | GLDZM Zone Distance Nonuniformity Normalised with Mergning by Slice from CT | 1 | IBSI-consistent grey level normalized nonuniformity of GLDZM of unpadded ROI binned for CT from 8 directions in 2 with merging dimensions. | ||
| GLDZM_IBSI_ZONE_DISTANCE_NONUNIFORMITY_NORMALIZED_3D_HU | GLDZM Zone Distance Nonuniformity Normalised from CT | 1 | IBSI-consistent grey level normalized nonuniformity of GLDZM of unpadded ROI binned for CT from 26 directions in 3 dimensions. | ||
| GLDZM_IBSI_ZONE_DISTANCE_VARIANCE_2DS_HU | GLDZM Zone Distance Variance without Merging from CT | 1 | IBSI-consistent grey level variance of GLDZM of unpadded ROI binned for CT from 8 directions in 2 dimensions. | ||
| GLDZM_IBSI_ZONE_DISTANCE_VARIANCE_3D_HU | GLDZM Zone Distance Variance from CT | 1 | IBSI-consistent grey level variance of GLDZM of unpadded ROI binned for CT from 26 directions in 3 dimensions. | ||
| GLRLM_IBSI_GLNONUNIFORMITY_2DV_HU | GLRLM Grey Level Nonuniformity by Slice with Full Merging from CT | 1 | IBSI-consistent grey levelnonuniformity from GLRLM of unpadded ROI binned for CT from merging in 8 directions for each slice. | ||
| GLRLM_IBSI_GLNONUNIFORMITY_3DF_HU | GLRLM Grey Level Nonuniformityas Volume, without Merging from CT | 1 | IBSI-consistent grey levelnonuniformity from GLRLM of unpadded ROI binned for CT from averaging 26 directions in 3 dimensions. | ||
| GLRLM_IBSI_GLNONUNIFORMITY_3DV_HU | GLRLM Grey Level Nonuniformity as Volume, with Full Merging from CT | 1 | IBSI-consistent grey levelnonuniformity from GLRLM of unpadded ROI binned for CT from merging 26 directions in 3 dimensions. | ||
| GLRLM_IBSI_RUNLENGTHNONUNIFORMITY_2DF_HU | GLRLM Run Length Nonuniformity by Slice without Merging from CT | 1 | IBSI-consistent run length nonuniformity from GLRLM of unpadded ROI binned for CT from averaging in 8 directions for each slice. | ||
| GLRLM_IBSI_RUNLENGTHNONUNIFORMITY_2DS_HU | GLRLM Run Length Nonuniformity by Slice with Merging by Slice from CT | 1 | IBSI-consistent run length nonuniformity from GLRLM of unpadded ROI binned for CT from merging matrices from each slice and averaging the result. | ||
| GLRLM_IBSI_RUNLENGTHNONUNIFORMITY_2DV_HU | GLRLM Run Length Nonuniformity by Slice with Full Merging from CT | 1 | IBSI-consistent run length nonuniformity from GLRLM of unpadded ROI binned for CT from merging in 8 directions for each slice. | ||
| GLRLM_IBSI_RUNLENGTHNONUNIFORMITY_3DF_HU | GLRLM Run Length Nonuniformity as Volume, without Merging from CT | 1 | IBSI-consistent run length nonuniformity from GLRLM of unpadded ROI binned for CT from averaging 26 directions in 3 dimensions. | ||
| GLRLM_IBSI_RUNLENGTHNONUNIFORMITY_3DV_HU | GLRLM Run Length Nonuniformity as Volume, with Full Merging from CT | 1 | IBSI-consistent run length nonuniformity from GLRLM of unpadded ROI binned for CT from merging 26 directions in 3 dimensions. | ||
| GLSZM_IBSI_GL_NONUNIF_2DV_HU | GLSZM Grey Level Nonuniformity by Slice, with Full Merging | 1 | IBSI-consistent grey level nonuniformity of GLSZM of unpadded ROI binned for CT with aggregation by 2D volume. | ||
| GLSZM_IBSI_GL_NONUNIF_3D_HU | GLSZM Grey Level Nonuniformity as Volume, with Full Merging | 1 | IBSI-consistent grey level nonuniformity of GLSZM of unpadded ROI binned for CT with aggregation by 3D volume. | ||
| GLSZM_IBSI_GL_VARIANCE_2DS_HU | GLSZM Grey Level Variance by Slice, with Merging by Slice | 1 | IBSI-consistent grey level variance of GLSZM of unpadded ROI binned for CT with aggregation by slice. | ||
| GLSZM_IBSI_GL_VARIANCE_2DV_HU | GLSZM Grey Level Variance by Slice, with Full Merging | 1 | IBSI-consistent grey level variance of GLSZM of unpadded ROI binned for CT with aggregation by 2D volume. | ||
| GLSZM_IBSI_GL_VARIANCE_3D_HU | GLSZM Grey Level Variance as Volume, with Full Merging | 1 | IBSI-consistent grey level variance of GLSZM of unpadded ROI binned for CT with aggregation by 3D volume. | ||
| GLSZM_IBSI_SMALL_ZONE_EMPH_3D_HU | GLSZM Small Zone Emphasis as Volume, with Full Merging | 1 | IBSI-consistent small zone emphasis of GLSZM of unpadded ROI binned for CT with aggregation by 3D volume. | ||
| GLSZM_IBSI_SMALL_ZONE_LOW_GL_EMPH_3D_HU | GLSZM Small Zone Low Grey Level Emphasis as Volume, with Full Merging | 1 | IBSI-consistent small zone low grey level emphasis of GLSZM of unpadded ROI binned for CT with aggregation by 3D volume. | ||
| GLSZM_IBSI_ZS_ENTROPY_2DS_HU | GLSZM Zone Size Entropy by Slice, with Merging by Slice | 1 | IBSI-consistent zone size entropy from GLSZM of unpadded ROI binned for CT with aggregation by slice. | ||
| GLSZM_IBSI_ZS_ENTROPY_2DV_HU | GLSZM Zone Size Entropy by Slice, with Full Merging | 1 | IBSI-consistent zone size entropy from GLSZM of unpadded ROI binned for CT with aggregation by 2D volume. | ||
| GLSZM_IBSI_ZS_ENTROPY_3D_HU | GLSZM Zone Size Entropy as Volume, with Full Merging | 1 | IBSI-consistent zone size entropy from GLSZM of unpadded ROI binned for CT with aggregation by 3D volume. | ||
| GLSZM_IBSI_ZS_NONUNIF_2DS_HU | GLSZM Zone Size Nonuniformity by Slice, with Merging by Slice | 1 | IBSI-consistent zone size uniformity from GLSZM of unpadded ROI binned for CT with aggregation by slice. | ||
| GLSZM_IBSI_ZS_NONUNIF_2DV_HU | GLSZM Zone Size Nonuniformity by Slice, with Full Merging | 1 | IBSI-consistent zone size uniformity from GLSZM of unpadded ROI binned for CT with aggregation by 2D volume. | ||
| GLSZM_IBSI_ZS_NONUNIF_3D_HU | GLSZM Zone Size Nonuniformity as Volume, with Full Merging | 1 | IBSI-consistent zone size uniformity from GLSZM of unpadded ROI binned for CT with aggregation by 3D volume. | ||
| GLSZM_IBSI_ZS_NONUNIF_NORMALISED_3D_HU | GLSZM Normalised Zone Size Nonuniformity as Volume, with Full Merging | 1 | IBSI-consistent normalizedzone size nonuniformity of GLSZM of unpadded ROI binned for CT with aggregation by 3D volume. | ||
| NGLDM_IBSI_DEP_ENTROPY_2DF_HU | NGLDM Dependence Entropy by Slice, without Merging | 1 | IBSI-consistent dependence entropy of NGLDM of unpadded ROI binned for CT with aggregation by slice without merging. | ||
| NGLDM_IBSI_DEP_ENTROPY_3D_HU | NGLDM Dependence Entropy as Volume, with Full Merging | 1 | IBSI-consistent dependence entropy of NGLDM of unpadded ROI binned for CT with aggregation by volume with full merging. | ||
| NGLDM_IBSI_DEP_NONUNIF_2DF_HU | NGLDM Dependence Nonuniformity by Slice, without Merging | 1 | IBSI-consistent dependence nonuniformity of NGLDM of unpadded ROI binned for CT with aggregation by slice without merging. | ||
| NGLDM_IBSI_DEP_NONUNIF_2DV_HU | NGLDM Dependence Nonuniformity by Slice, with Merging by Slice | 1 | IBSI-consistent dependence nonuniformity of NGLDM of unpadded ROI binned for CT with aggregation by slice with merging. | ||
| NGLDM_IBSI_DEP_NONUNIF_3D_HU | NGLDM Dependence Nonuniformity as Volume, with Full Merging | 1 | IBSI-consistent dependence nonuniformity of NGLDM of unpadded ROI binned for CT with aggregation by volume with full merging. | ||
| NGLDM_IBSI_DEP_VARIANCE_2DF_HU | NGLDM Dependence Variance by Slice, without Merging | 1 | IBSI-consistent dependence entropy of NGLDM of unpadded ROI binned for CT with aggregation by slice without merging. | ||
| NGLDM_IBSI_GLNONUNIF_2DV_HU | NGLDM GL Nonuniformity by Slice, with Merging by Slice | 1 | IBSI-consistent grey level nonuniformity of NGLDM of unpadded ROI binned for CT with aggregation by slice with merging. | ||
| NGLDM_IBSI_GLNONUNIF_3D_HU | NGLDM GL Nonuniformity as Volume, with Full Merging | 1 | IBSI-consistent grey level nonuniformity of NGLDM of unpadded ROI binned for CT with aggregation by volume with full merging. | ||
| NGLDM_IBSI_HIGH_DEP_LOW_GL_EMPH_3D_HU | NGLDM High Dependence Low GL Emphasis as Volume, with Full Merging | 1 | IBSI-consistent high dependence low grey level of NGLDM of unpadded ROI binned for CT with aggregation by volume with full merging. | ||
| NGTDM_BUSYNESS_2DV_HU | NGTDM Busyness by Slice with Full Merging | 1 | IBSI-consistent busyness of NGTDM of unpadded ROI with aggregation by merging 8 matrices for each slice | ||
| NGTDM_BUSYNESS_3D_HU | NGTDM Busyness as Volume, with Full Merging | 1 | IBSI-consistent busyness of NGTDM of unpadded ROI with aggregation by merging matrices from all 26 directions | ||
| NGTDM_COARSENESS_2DV_HU | NGTDM Coarseness, by Slice with Full Merging | 1 | IBSI-consistent coarseness of NGTDM of unpadded ROI with aggregation by merging 8 matrices for each slice | ||
| NGTDM_COARSENESS_3D_HU | NGTDM Coarseness, as Volume, with Full Merging | 1 | IBSI-consistent coarseness of NGTDM of unpadded ROI with aggregation by merging matrices from all 26 directions | ||
| NGTDM_COMPLEXITY_2DF_HU | NGTDM Complexity by Slice without Merging | 1 | IBSI-consistent complexity of NGTDM of unpadded ROI with aggregation by averaging metrics from all matrices | ||
| NGTDM_STRENGTH_2DV_HU | NGTDM Strength by Slice with Full Merging | 1 | IBSI-consistent strength of NGTDM of unpadded ROI with aggregation by merging 8 matrices for each slice | ||
| NGTDM_STRENGTH_3D_HU | NGTDM Strength as Volume, with Full Merging | 1 | IBSI-consistent strength of NGTDM of unpadded ROI with aggregation by merging matrices from all 26 directions | ||
| LOG_2D_COV_2_5MM_HU | Coefficient of Variation of LoG (2.5 mm) Filtered Slice by Slice | higher order statistics features | Coefficient of variation of 2D LoG transformed voxels at 2.5 mm smoothing | ||
| LOG_2D_ENERGY_0_0MM_HU | Energy of LoG (0.0 mm) Filtered Slice by Slice | HU^2 | Energy of 2D LoG transformed voxels at 0 mm smoothing | ||
| LOG_2D_ENERGY_2_5MM_HU | Energy of LoG (2.5 mm) Filtered Slice by Slice | HU^2 | Energy of 2D LoG transformed voxels at 2.5 mm smoothing | ||
| LOG_2D_ENTROPY_2_5MM_HU | Entropy of LoG (2.5 mm) Filtered Slice by Slice | Entropy of 2D LoG transformed voxels at 2.5 mm smoothing | |||
| LOG_2D_MEAN_2_5MM_HU | Mean of LoG (2.5 mm) Filtered Slice by Slice | HU | Mean of 2D LoG transformed voxels at 2.5 mm smoothing | ||
| WAVELET_HHL_ENERGY_HU | Wavelet HHL Energy | HU^2 | Energy of voxels under wavelet transforms with filters HHL. | ||
| WAVELET_HHL_ENTROPY_HU | Wavelet HHL Entropy | Entropy of voxels under wavelet transforms with filters HHL. | |||
| WAVELET_HHL_KURTOSIS_HU | Wavelet HHL Excess Kurtosis | Excess kurtosis voxels under wavelet transforms with filters HHL. | |||
| WAVELET_HHL_MEDIAN_HU | Wavelet HHL Median | HU | Median of voxels under wavelet transforms with filters HHL. | ||
| WAVELET_HHL_MIN_HU | Wavelet HHL MInimum | HU | Minimum of voxels under wavelet transforms with filters HHL. | ||
| WAVELET_HHL_PERCENTILE10_HU | Wavelet HHL 10th Percentile | HU | The 10th percentile of voxels under wavelet transforms with filters HHL. | ||
| WAVELET_HHL_PERCENTILE90_HU | Wavelet HHL 90th Percentile | HU | The 90th percentile voxels under wavelet transforms with filters HHL. | ||
| WAVELET_HHL_ROBUST_MEAN_DEVIATION_HU | Wavelet HHL Robust Mean Deviation | HU | Robust absolute deviation from the mean of voxels under wavelet transforms with filters HHL. |
References
- Sung, H.; Ferlay, J.; Siegel, R.L.; Laversanne, M.; Soerjomataram, I.; Jemal, A.; Bray, F. Global cancer statistics 2020: GLOBOCAN estimates of incidence and mortality worldwide for 36 cancers in 185 countries. CA Cancer J. Clin. 2021, 71, 209–249. [Google Scholar] [CrossRef] [PubMed]
- World Health Organization (WHO). Global Health Estimates 2020: Deaths by Cause, Age, Sex, by Country and by Region, 2000–2019; WHO: Geneva, Switzerland, 2020. [Google Scholar]
- Chang, C.; Sun, X.; Zhao, W.; Wang, R.; Qian, X.; Lei, B.; Wang, L.; Liu, L.; Ruan, M.; Xie, W.; et al. Minor components of micropapillary and solid subtypes in lung invasive adenocarcinoma (≤3 cm): PET/CT findings and correlations with lymph node metastasis. Radiol. Med. 2019, 125, 257–264. [Google Scholar] [CrossRef] [PubMed]
- Bodor, J.N.; Boumber, Y.; Borghaei, H. Biomarkers for immune checkpoint inhibition in non-small cell lung cancer (NSCLC). Cancer 2019, 126, 260–270. [Google Scholar] [CrossRef]
- Russo, A.; McCusker, M.; Scilla, K.A.; Arensmeyer, K.E.; Mehra, R.; Adamo, V.; Rolfo, C. Immunotherapy in Lung Cancer: From a Minor God to the Olympus. Adv. Exp. Med. Biol. 2020, 1244, 69–92. [Google Scholar] [CrossRef]
- Sanmamed, M.F.; Eguren-Santamaria, I.; Schalper, K.A. Overview of Lung Cancer Immunotherapy. Cancer J. 2020, 26, 473–484. [Google Scholar] [CrossRef] [PubMed]
- Benedetti, G.; Mori, M.; Panzeri, M.M.; Barbera, M.; Palumbo, D.; Sini, C.; Muffatti, F.; Andreasi, V.; Steidler, S.; Doglioni, C.; et al. CT-derived radiomic features to discriminate histologic characteristics of pancreatic neuroendocrine tumors. Radiol. Med. 2021, 126, 745–760. [Google Scholar] [CrossRef]
- Agazzi, G.M.; Ravanelli, M.; Roca, E.; Medicina, D.; Balzarini, P.; Pessina, C.; Vermi, W.; Berruti, A.; Maroldi, R.; Farina, D. CT texture analysis for prediction of EGFR mutational status and ALK rearrangement in patients with non-small cell lung cancer. Radiol. Med. 2021, 126, 786–794. [Google Scholar] [CrossRef]
- Zhang, G.; Yang, Z.; Gong, L.; Jiang, S.; Wang, L.; Zhang, H. Classification of lung nodules based on CT images using squeeze-and-excitation network and aggregated residual transformations. Radiol. Med. 2020, 125, 374–383. [Google Scholar] [CrossRef] [PubMed]
- Cusumano, D.; Meijer, G.; Lenkowicz, J.; Chiloiro, G.; Boldrini, L.; Masciocchi, C.; Dinapoli, N.; Gatta, R.; Casà, C.; Damiani, A.; et al. A field strength independent MR radiomics model to predict pathological complete response in locally advanced rectal cancer. Radiol. Med. 2021, 126, 421–429. [Google Scholar] [CrossRef]
- Kirienko, M.; Ninatti, G.; Cozzi, L.; Voulaz, E.; Gennaro, N.; Barajon, I.; Ricci, F.; Carlo-Stella, C.; Zucali, P.; Sollini, M.; et al. Computed tomography (CT)-derived radiomic features differentiate prevascular mediastinum masses as thymic neoplasms versus lymphomas. Radiol. Med. 2020, 125, 951–960. [Google Scholar] [CrossRef]
- Abdollahi, H.; Mofid, B.; Shiri, I.; Razzaghdoust, A.; Saadipoor, A.; Mahdavi, A.; Galandooz, H.M.; Mahdavi, S.R. Machine learning-based radiomic models to predict intensity-modulated radiation therapy response, Gleason score and stage in prostate cancer. Radiol. Med. 2019, 124, 555–567. [Google Scholar] [CrossRef] [PubMed]
- Zhang, Y.; Zhu, Y.; Zhang, K.; Liu, Y.; Cui, J.; Tao, J.; Wang, Y.; Wang, S. Invasive ductal breast cancer: Preoperative predict Ki-67 index based on radiomics of ADC maps. Radiol. Med. 2020, 125, 109–116. [Google Scholar] [CrossRef] [PubMed]
- Zhang, L.; Kang, L.; Li, G.; Zhang, X.; Ren, J.; Shi, Z.; Li, J.; Yu, S. Computed tomography-based radiomics model for discriminating the risk stratification of gastrointestinal stromal tumors. Radiol. Med. 2020, 125, 465–473. [Google Scholar] [CrossRef]
- Granata, V.; Fusco, R.; Avallone, A.; De Stefano, A.; Ottaiano, A.; Sbordone, C.; Brunese, L.; Izzo, F.; Petrillo, A. Radiomics-Derived Data by Contrast Enhanced Magnetic Resonance in RAS Mutations Detection in Colorectal Liver Metastases. Cancers 2021, 13, 453. [Google Scholar] [CrossRef]
- Fusco, R.; Granata, V.; Petrillo, A. Introduction to Special Issue of Radiology and Imaging of Cancer. Cancers 2020, 12, 2665. [Google Scholar] [CrossRef]
- Granata, V.; Fusco, R.; Risi, C.; Ottaiano, A.; Avallone, A.; De Stefano, A.; Grimm, R.; Grassi, R.; Brunese, L.; Izzo, F.; et al. Diffusion-Weighted MRI and Diffusion Kurtosis Imaging to Detect RAS Mutation in Colorectal Liver Metastasis. Cancers 2020, 12, 2420. [Google Scholar] [CrossRef]
- Jia, T.-Y.; Xiong, J.-F.; Li, X.-Y.; Yu, W.; Xu, Z.-Y.; Cai, X.-W.; Ma, J.-C.; Ren, Y.-C.; Larsson, R.; Zhang, J.; et al. Identifying EGFR mutations in lung adenocarcinoma by noninvasive imaging using radiomics features and random forest modeling. Eur. Radiol. 2019, 29, 4742–4750. [Google Scholar] [CrossRef]
- Hu, H.-T.; Shan, Q.-Y.; Chen, S.-L.; Li, B.; Feng, S.-T.; Xu, E.-J.; Li, X.; Long, J.-Y.; Xie, X.-Y.; Lu, M.-D.; et al. CT-based radiomics for preoperative prediction of early recurrent hepatocellular carcinoma: Technical reproducibility of acquisition and scanners. Radiol. Med. 2020, 125, 697–705. [Google Scholar] [CrossRef]
- Farchione, A.; Larici, A.R.; Masciocchi, C.; Cicchetti, G.; Congedo, M.T.; Franchi, P.; Gatta, R.; Cicero, S.L.; Valentini, V.; Bonomo, L.; et al. Exploring technical issues in personalized medicine: NSCLC survival prediction by quantitative image analysis—Usefulness of density correction of volumetric CT data. Radiol. Med. 2020, 125, 625–635. [Google Scholar] [CrossRef]
- Nazari, M.; Shiri, I.; Hajianfar, G.; Oveisi, N.; Abdollahi, H.; Deevband, M.R.; Oveisi, M.; Zaidi, H. Noninvasive Fuhrman grading of clear cell renal cell carcinoma using computed tomography radiomic features and machine learning. Radiol. Med. 2020, 125, 754–762. [Google Scholar] [CrossRef] [PubMed] [Green Version]
- Fusco, R.; Granata, V.; Mazzei, M.A.; Meglio, N.D.; Roscio, D.D.; Moroni, C.; Monti, R.; Cappabianca, C.; Picone, C.; Neri, E.; et al. Quantitative imaging decision support (QIDS™) tool consistency evaluation and radiomic analysis by means of 594 metrics in lung carcinoma on chest CT scan. Cancer Control 2021, 28, 1073274820985786. [Google Scholar] [CrossRef] [PubMed]
- Gering, D.; Sun, K.; Avery, A.; Chylla, R.; Vivekanandan, A.; Kohli, L.; Knapp, H.; Paschke, B.; Young-Moxon, B.; King, N.; et al. Semi-automatic brain tumor segmentation by drawing long axes on multi-plane reformat. In Proceedings of the International MICCAI Brainlesion Workshop, Granada, Spain, 16 September 2018; pp. 441–455. [Google Scholar]
- Gering, D.; Kotrotsou, A.; Young-Moxon, B.; Miller, N.; Avery, A.; Kohli, L.; Knapp, H.; Hoffman, J.; Chylla, R.; Peitzman, L.; et al. Measuring Efficiency of Semi-automated Brain Tumor Segmentation by Simulating User Interaction. Front. Comput. Neurosci. 2020, 14, 32. [Google Scholar] [CrossRef] [Green Version]
- Zwanenburg, A.; Leger, S.; Vallières, M.; Löck, S. Image biomarker standardisation initiative. arXiv 2019, arXiv:1612.07003. [Google Scholar]
- Fusco, R.; Sansone, M.; Filice, S.; Carone, G.; Amato, D.M.; Sansone, C.; Petrillo, A. Pattern Recognition Approaches for Breast Cancer DCE-MRI Classification: A Systematic Review. J. Med. Biol. Eng. 2016, 36, 449–459. [Google Scholar] [CrossRef] [Green Version]
- Tibshirani, R. The lasso Method for Variable Selection in the Cox Model. Stat. Med. 1997, 28, 385–395. [Google Scholar] [CrossRef] [Green Version]
- Tibshirani, R. Regression Shrinkage and Selection Via the Lasso. J. R. Stat. Soc. Ser. B 1996, 58, 267–288. [Google Scholar] [CrossRef]
- James, G.; Witten, D.; Hastie, T.; Tibshirani, R. An Introduction to Statistical Learning with Applications in R; Springer Publishing Company, Inc.: Berlin/Heidenberg, Germany, 2014. [Google Scholar]
- Bruce, P.; Bruce, A. Practical Statistics for Data Scientists; O’Reilly Media, Inc.: Sebastopol, CA, USA, 2017. [Google Scholar]
- Nishino, M.; Ramaiya, N.H.; Hatabu, H.; Hodi, F.S. Monitoring immune-checkpoint blockade: Response evaluation and biomarker development. Nat. Rev. Clin. Oncol. 2017, 14, 655–668. [Google Scholar] [CrossRef] [PubMed]
- Nishino, M.; Hatabu, H.; Hodi, F.S. Imaging of Cancer Immunotherapy: Current Approaches and Future Directions. Radiology 2019, 290, 9–22. [Google Scholar] [CrossRef]
- Breathnach, O.S.; Freidlin, B.; Conley, B.; Green, M.R.; Johnson, D.H.; Gandara, D.R.; O’Connell, M.; Shepherd, F.A.; Johnson, B.E. Twenty-Two Years of Phase III Trials for Patients with Advanced Non–Small-Cell Lung Cancer: Sobering Results. J. Clin. Oncol. 2001, 19, 1734–1742. [Google Scholar] [CrossRef]
- Rizvi, A.N.A.; Mazières, J.; Planchard, D.; Stinchcombe, E.T.E.; Dy, G.K.; Antonia, S.J.; Horn, L.; Lena, H.; Minenza, E.; Mennecier, B.; et al. Activity and safety of nivolumab, an anti-PD-1 immune checkpoint inhibitor, for patients with advanced, refractory squamous non-small-cell lung cancer (CheckMate 063): A phase 2, single-arm trial. Lancet Oncol. 2015, 16, 257–265. [Google Scholar] [CrossRef] [Green Version]
- Garon, E.B.; Rizvi, N.A.; Hui, R.; Leighl, N.; Balmanoukian, A.S.; Eder, J.P.; Patnaik, A.; Aggarwal, C.; Gubens, M.; Horn, L.; et al. Pembrolizumab for the treatment of non-small-cell lung cancer. N. Engl. J. Med. 2015, 372, 2018–2028. [Google Scholar] [CrossRef] [PubMed]
- Reginelli, A.; Capasso, R.; Petrillo, M.; Rossi, C.; Faella, P.; Grassi, R.; Belfiore, M.P.; Rossi, G.; Muto, M.; Muto, P.; et al. Looking for Lepidic Component inside Invasive Adenocarcinomas Appearing as CT Solid Solitary Pulmonary Nodules (SPNs): CT Morpho-Densitometric Features and 18-FDG PET Findings. BioMed Res. Int. 2019, 2019, 1–9. [Google Scholar] [CrossRef] [PubMed] [Green Version]
- Fusco, R.; Granata, V.; Maio, F.; Sansone, M.; Petrillo, A. Textural radiomic features and time-intensity curve data analysis by dynamic contrast-enhanced MRI for early prediction of breast cancer therapy response: Preliminary data. Eur. Radiol. Exp. 2020, 4, 1–7. [Google Scholar] [CrossRef] [PubMed]
- Sun, R.; Limkin, E.J.; Vakalopoulou, M.; Dercle, L.; Champiat, S.; Han, S.R.; Verlingue, L.; Brandao, D.; Lancia, A.; Ammari, S.; et al. A radiomics approach to assess tumour-infiltrating CD8 cells and response to an-ti-PD-1 or anti-PD-L1 immunotherapy: An imaging biomarker, retrospective multicohort study. Lancet Oncol. 2018, 19, 1180–1191. [Google Scholar] [CrossRef]
- Yang, Y.; Yang, J.; Shen, L.; Chen, J.; Xia, L.; Ni, B.; Ge, L.; Wang, Y.; Lu, S. A multi-omics-based serial deep learning approach to predict clinical outcomes of single-agent anti-PD-1/PD-L1 immunotherapy in advanced stage non-small-cell lung cancer. Am. J. Transl. Res. 2021, 13, 743–756. [Google Scholar]
- Tian, P.; He, B.; Mu, W.; Liu, K.; Liu, L.; Zeng, H.; Liu, Y.; Jiang, L.; Zhou, P.; Huang, Z.; et al. Assessing PD-L1 expression in non-small cell lung cancer and predicting responses to immune checkpoint inhibitors using deep learning on computed tomography images. Theranostics 2021, 11, 2098–2107. [Google Scholar] [CrossRef]
Publisher’s Note: MDPI stays neutral with regard to jurisdictional claims in published maps and institutional affiliations. |
© 2021 by the authors. Licensee MDPI, Basel, Switzerland. This article is an open access article distributed under the terms and conditions of the Creative Commons Attribution (CC BY) license (https://creativecommons.org/licenses/by/4.0/).