
Aldo-Keto Reductase 1C3 Mediates Chemotherapy Resistance in Esophageal Adenocarcinoma via ROS Detoxification

 , , , , , ,
Abstract
Simple Summary
Abstract
1. Introduction
2. Materials and Methods
2.1. Public Databases
2.2. Antibodies and Reagents
2.3. Cell Lines and Clinical Tissues
2.4. Cell Proliferation Assay
2.5. Colony-Forming Assay
2.6. Wound Healing and Migration Assay
2.7. Western Blot
2.8. Cell Viability Assay
2.9. Flow Cytometry Analysis
2.10. Quantification of GSH
2.11. Plasmid Constructs
2.12. Generating AKR1C3 Overexpressing and Knockdown Cell Lines
2.13. Chromatin Immunoprecipitation
2.14. Quantitative RT-PCR
2.15. Statistical Analysis
3. Results
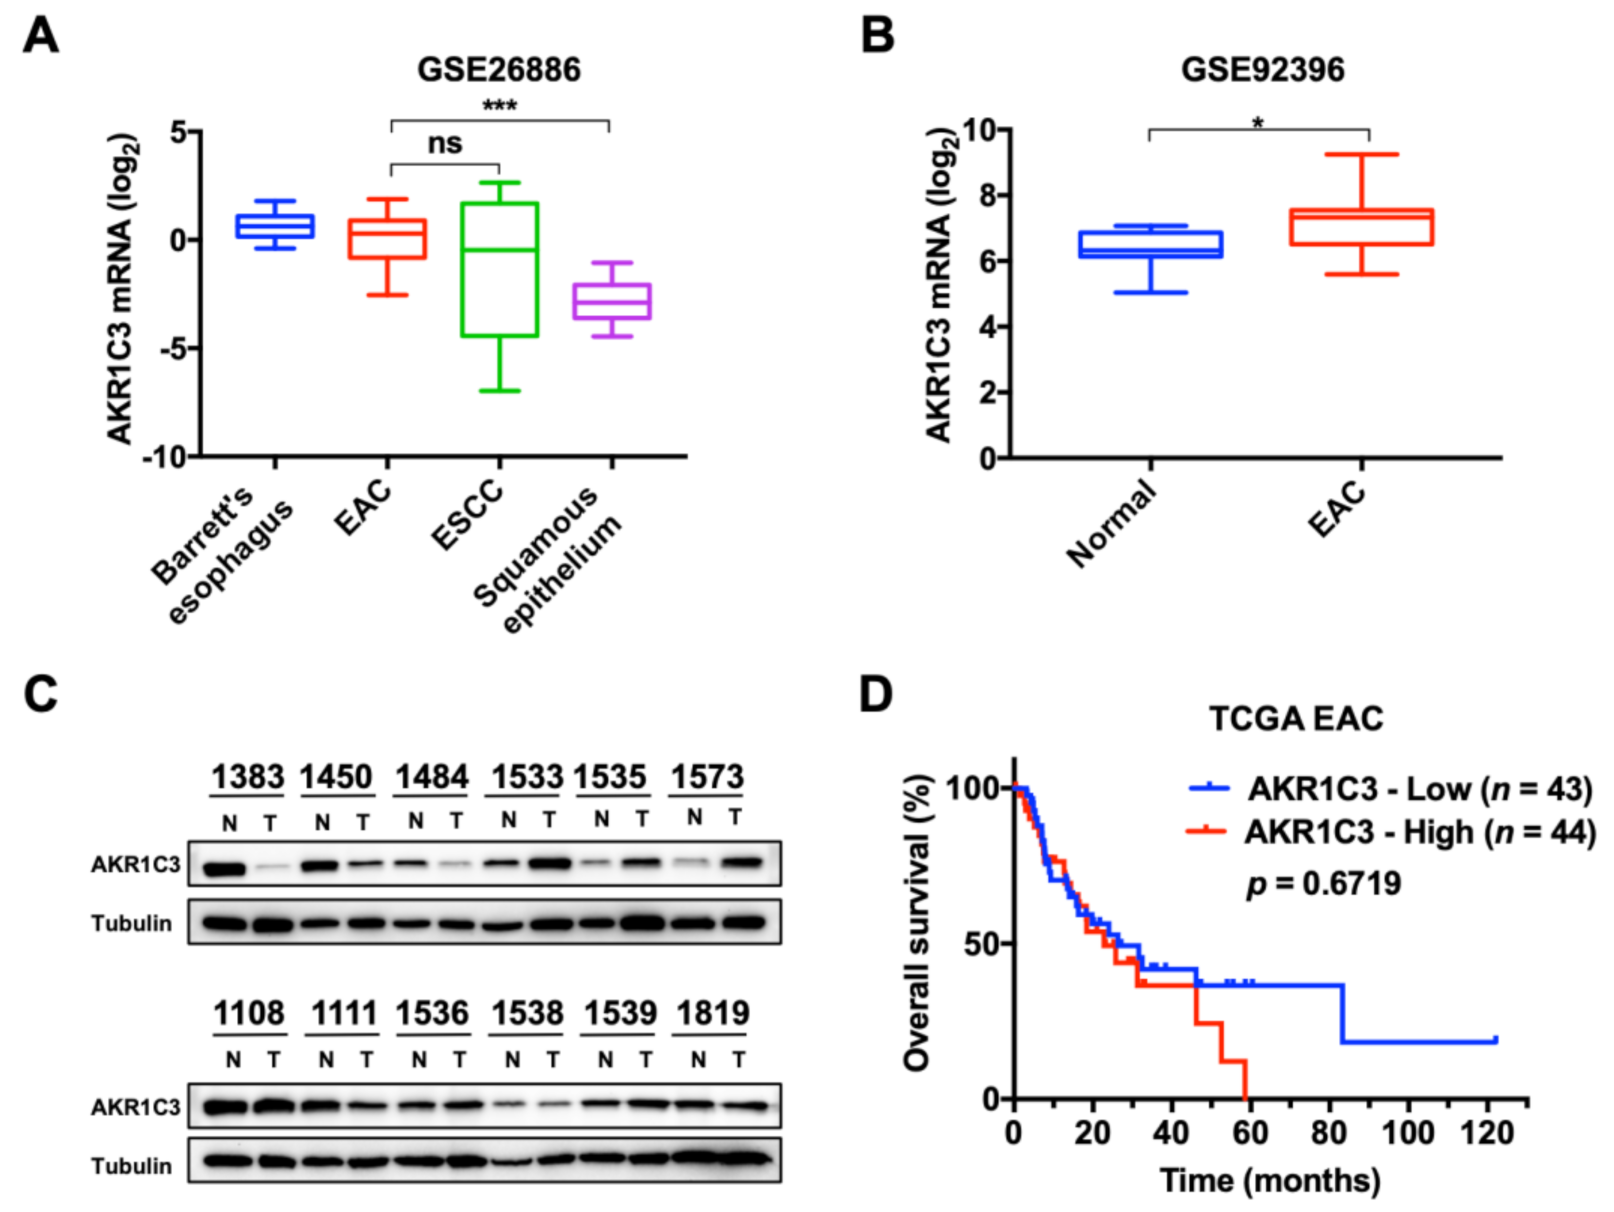
3.1. Expression and Characterization of AKR1C3 in EAC
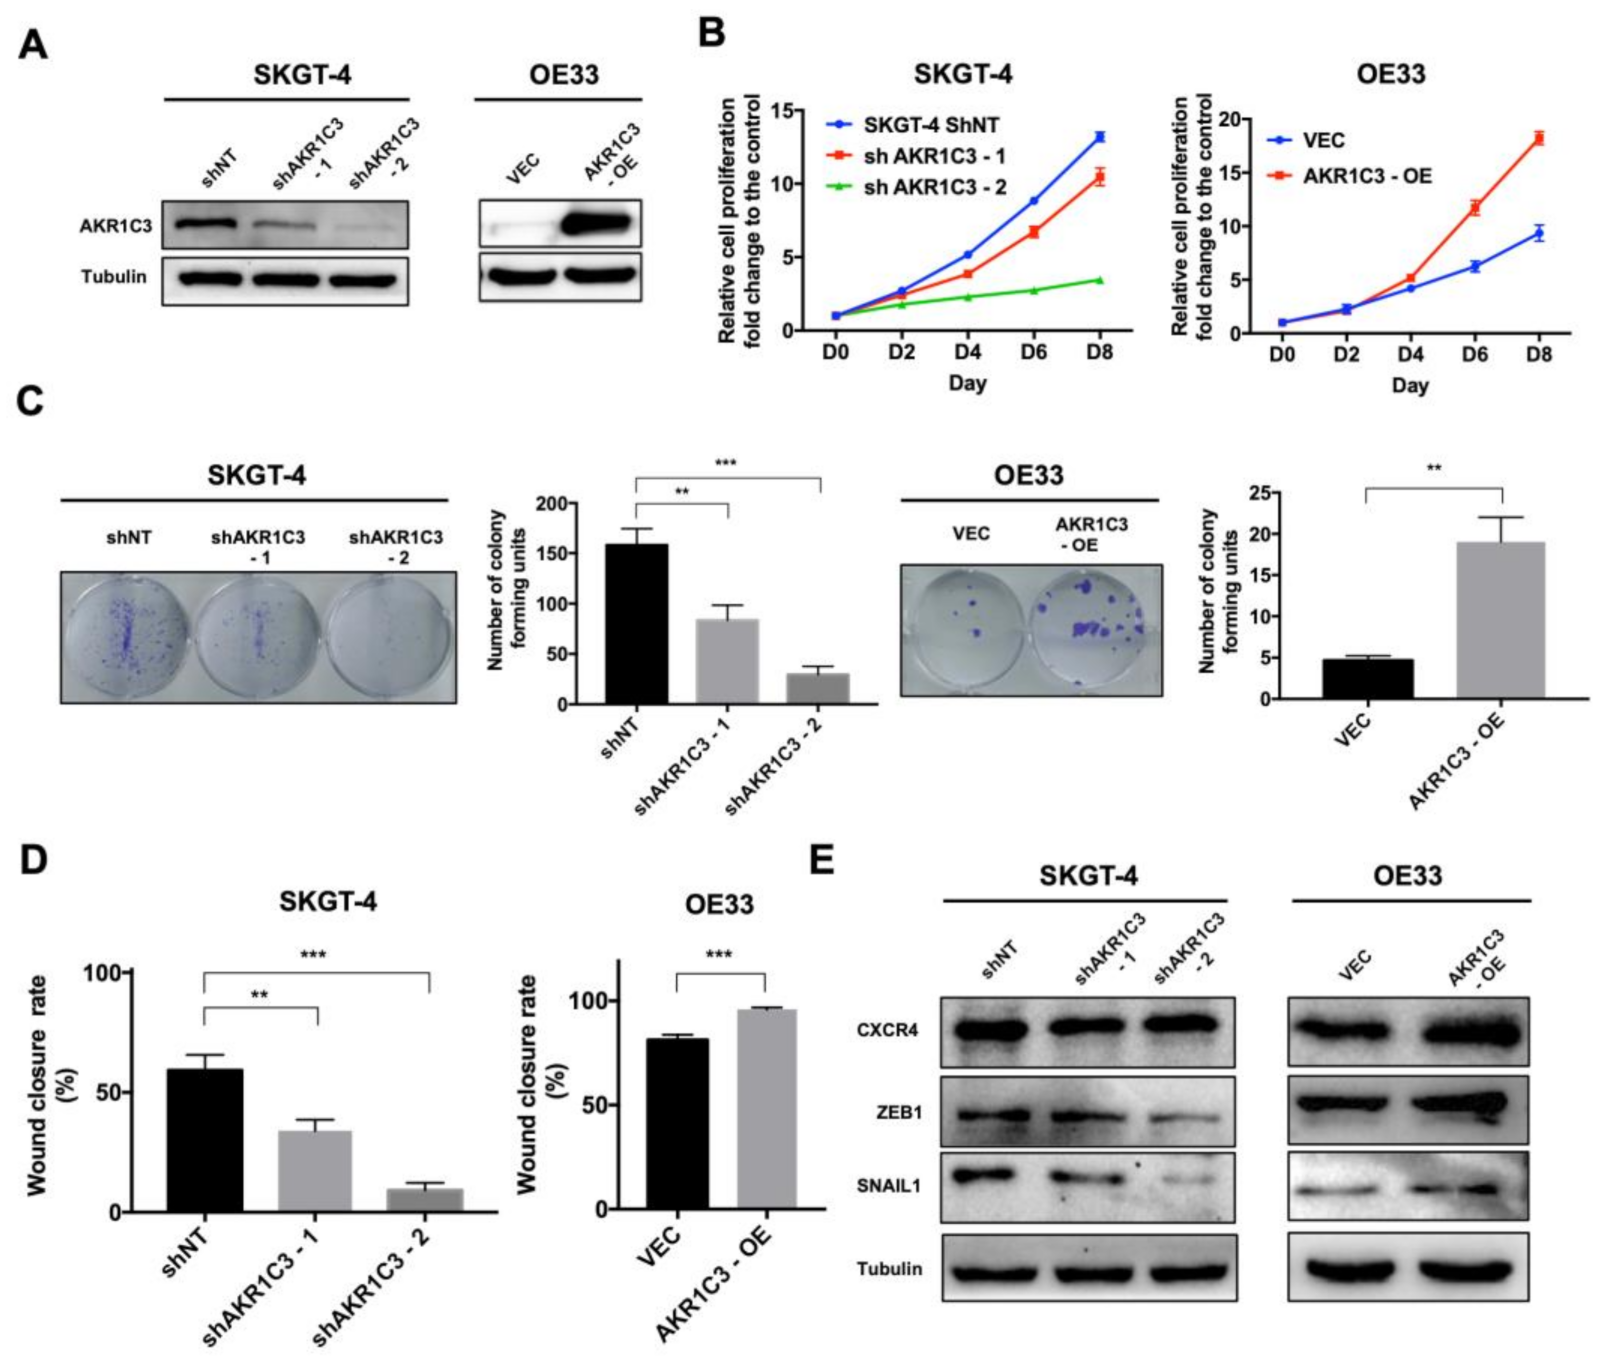
3.2. AKR1C3 Promotes Proliferation, Colony Formation and Migration of EAC Cells
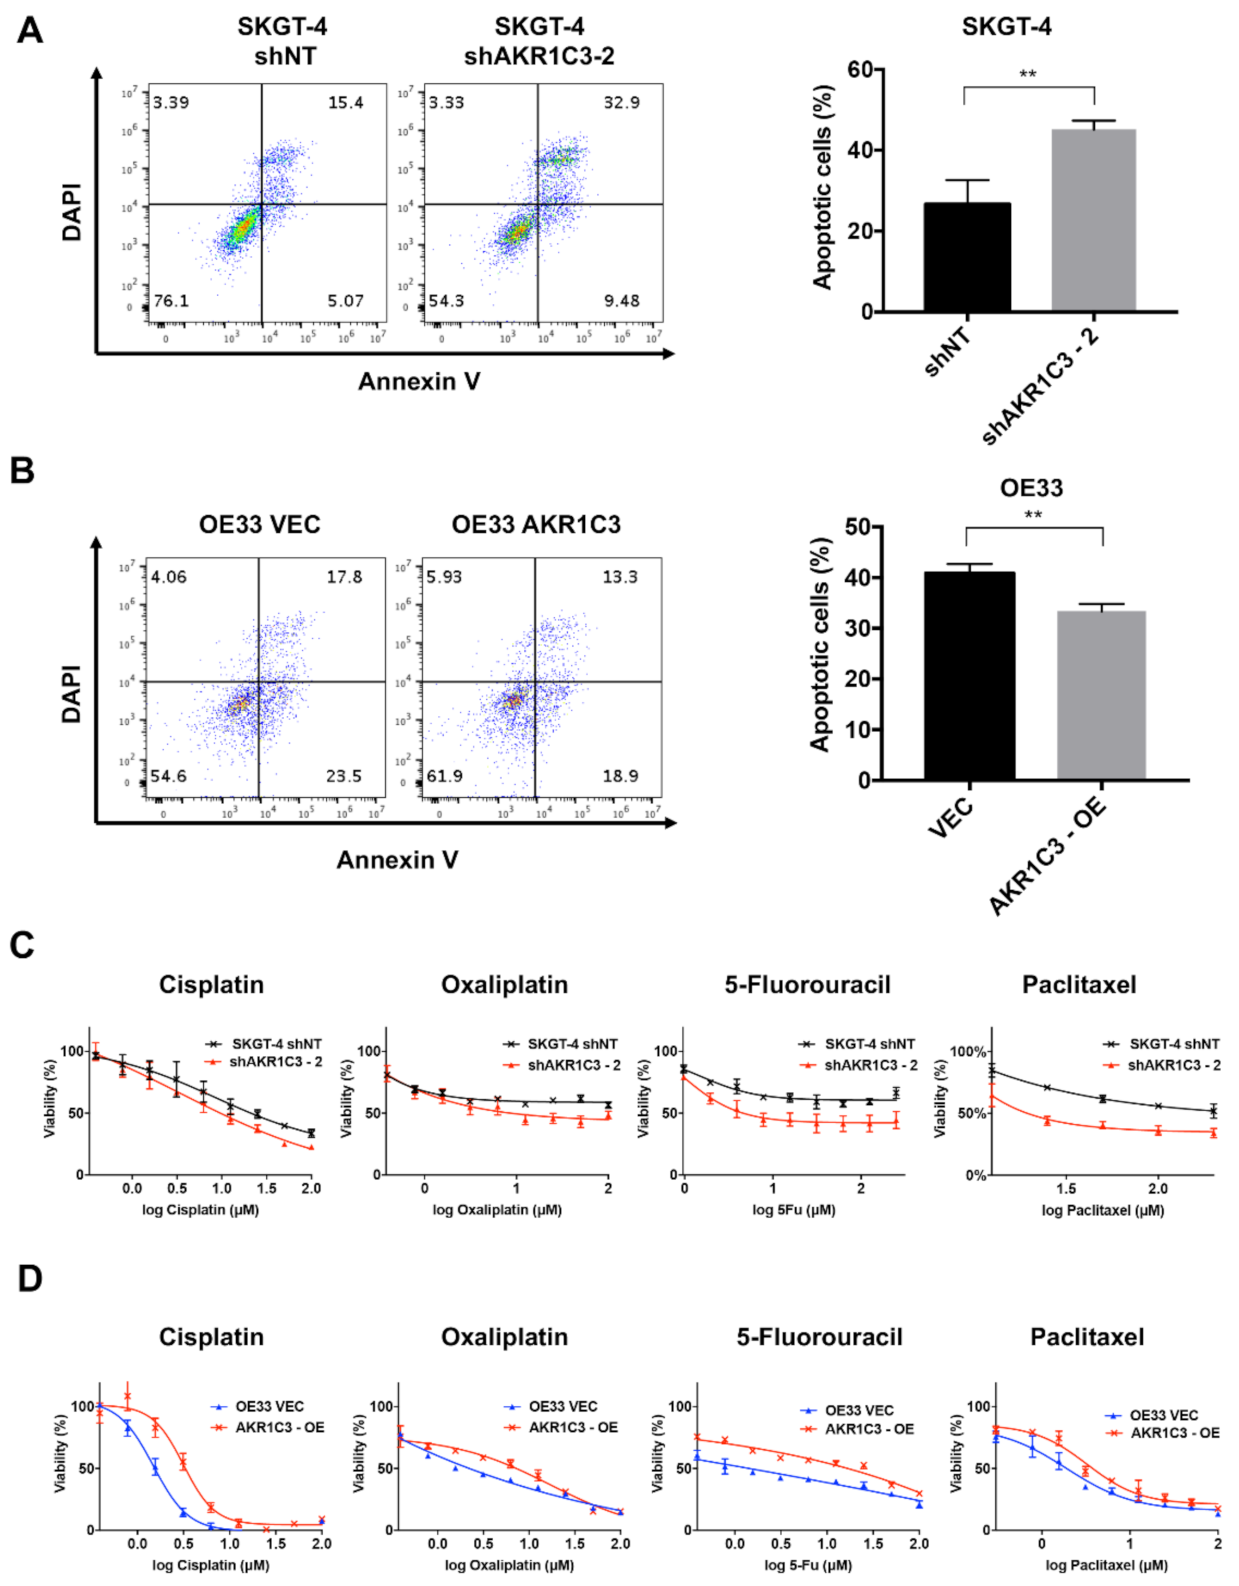
3.3. AKR1C3 Renders Chemotherapy Resistance to EAC Cells
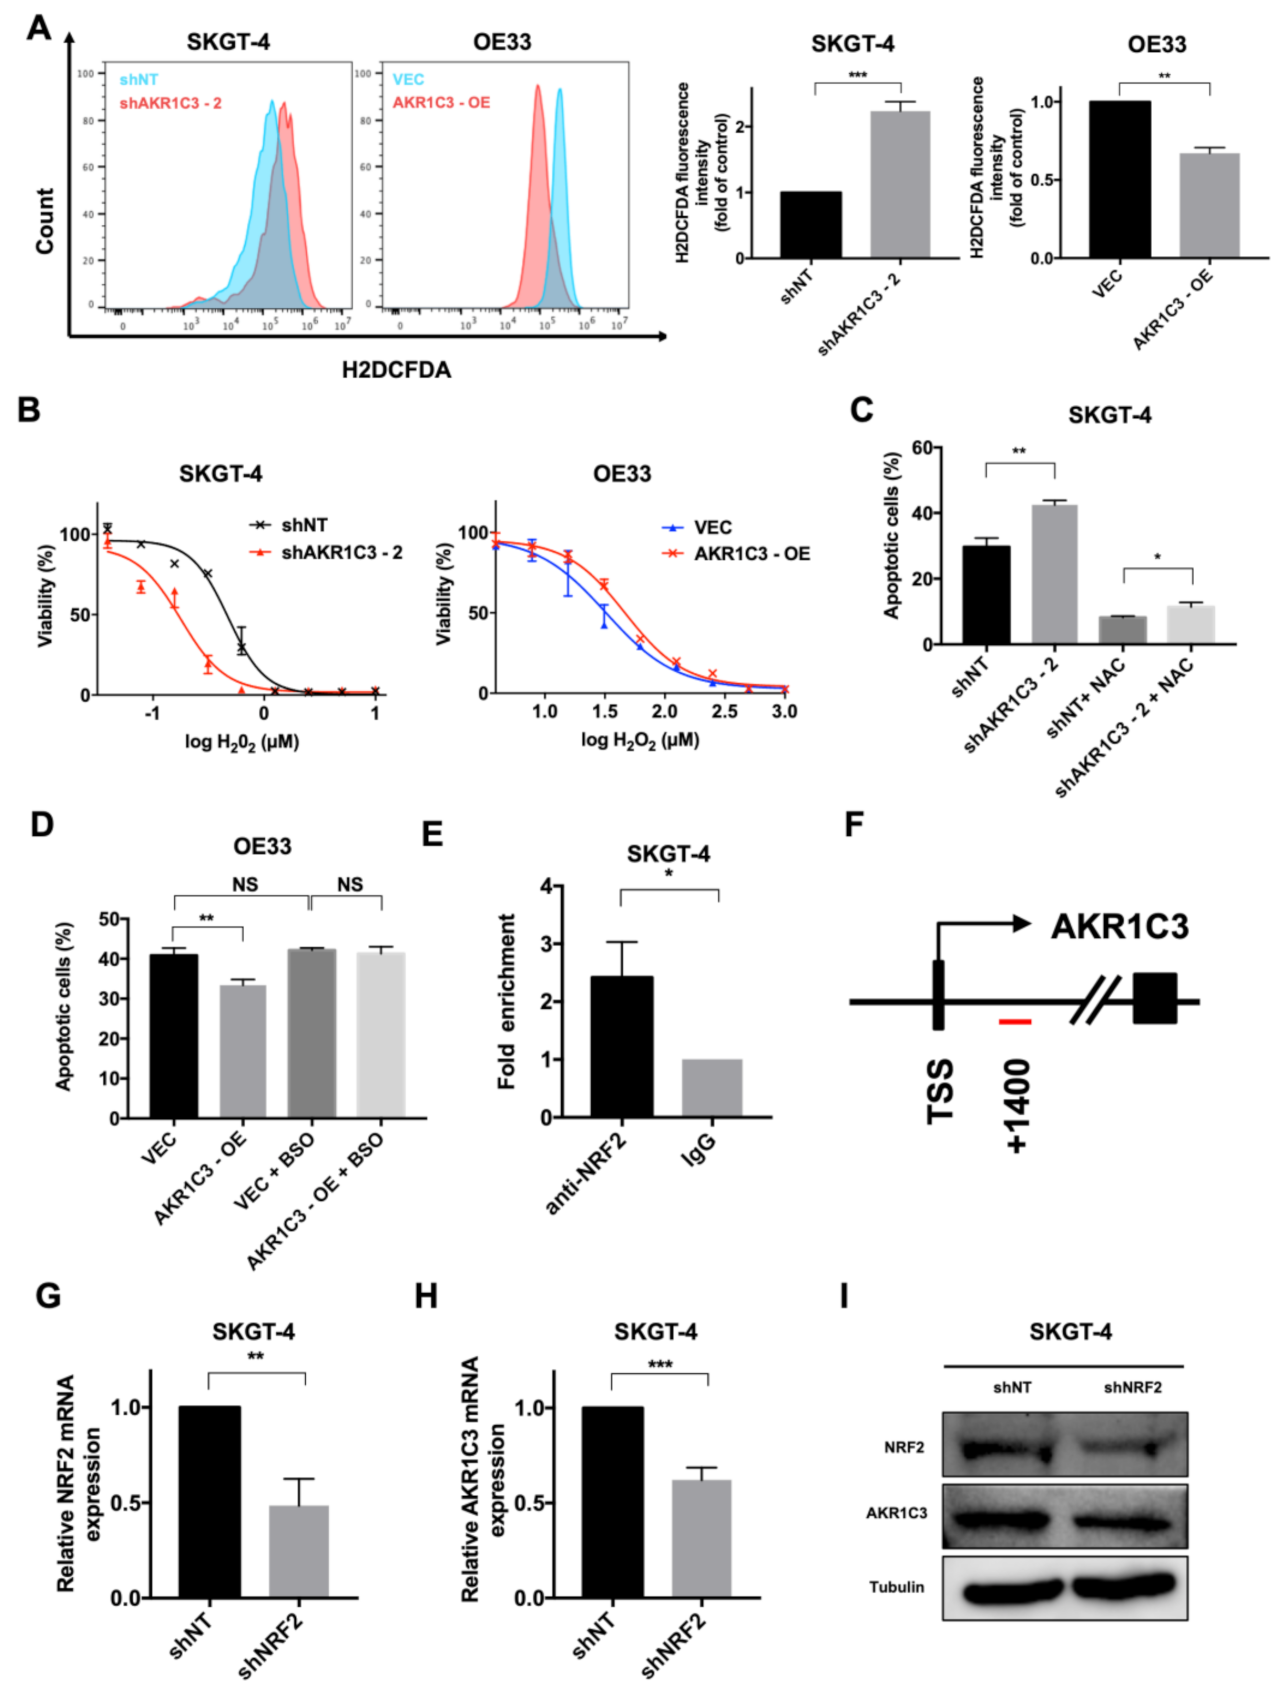
3.4. AKR1C3 Mediates Chemo-Resistance through Regulating Redox Homeostasis
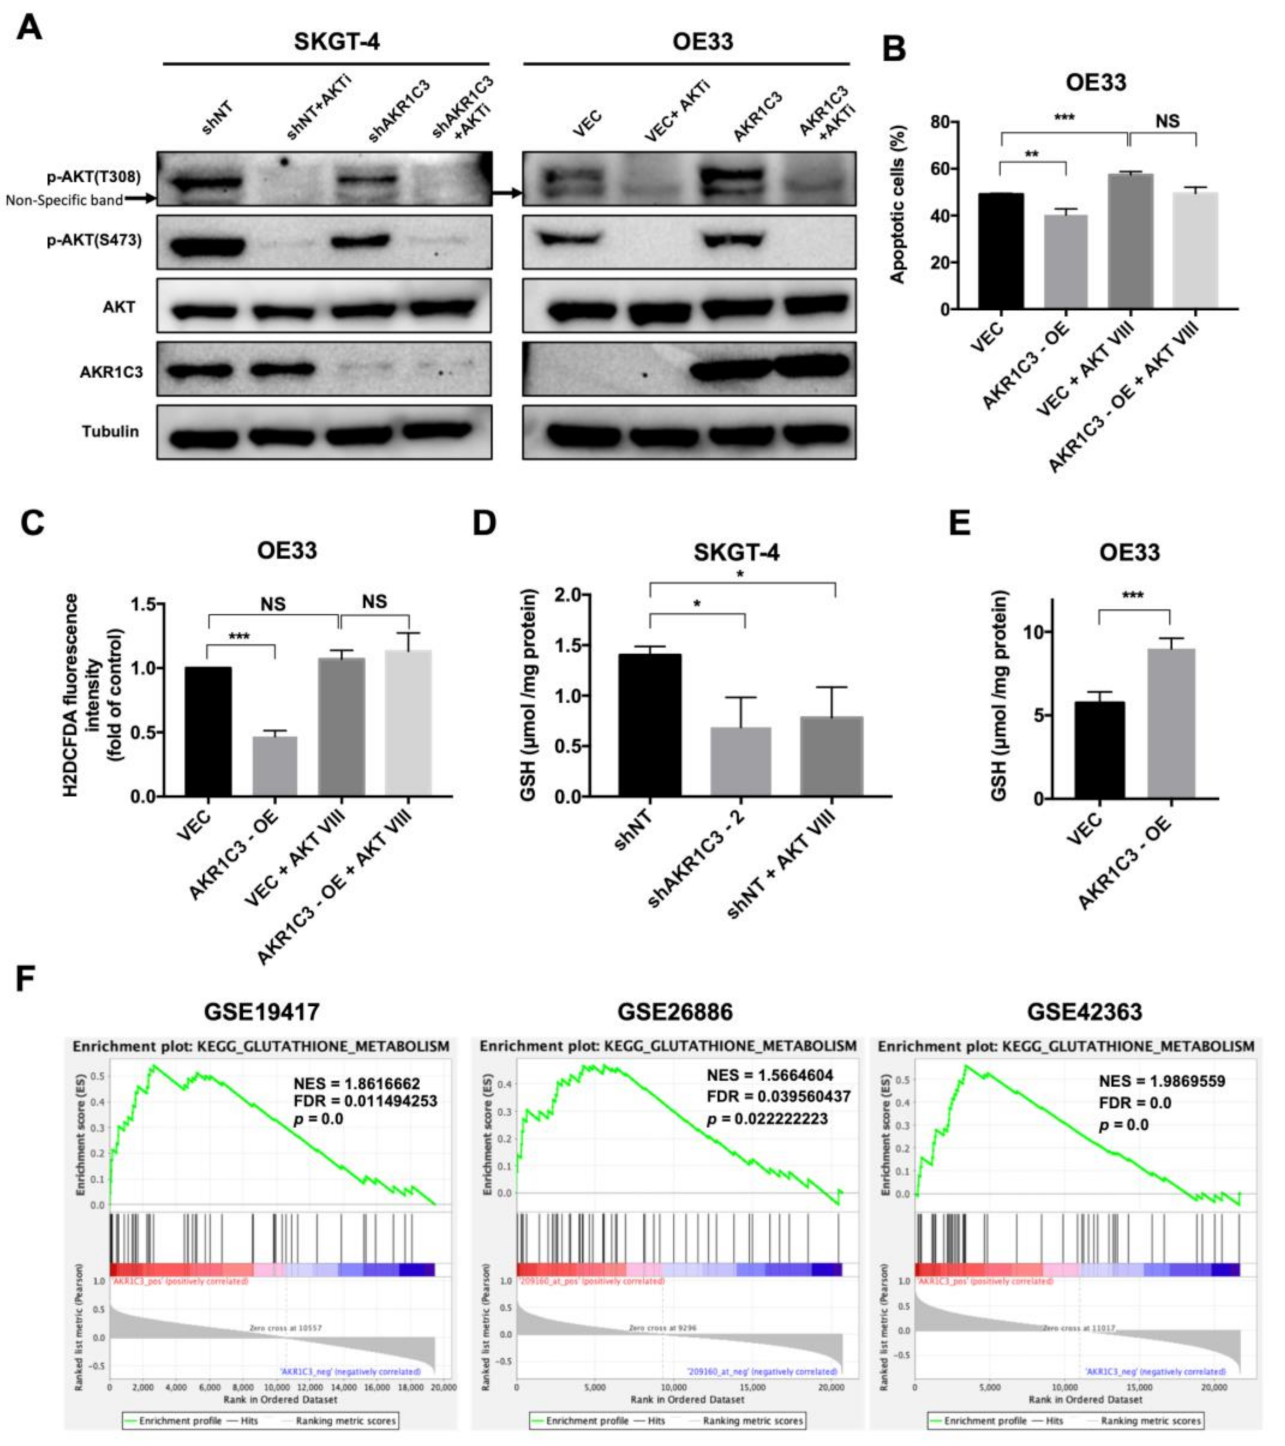
3.5. AKT Phosphorylation Is Regulated by AKR1C3 and Is Responsible for ROS Alleviation in EAC Cells
4. Discussion
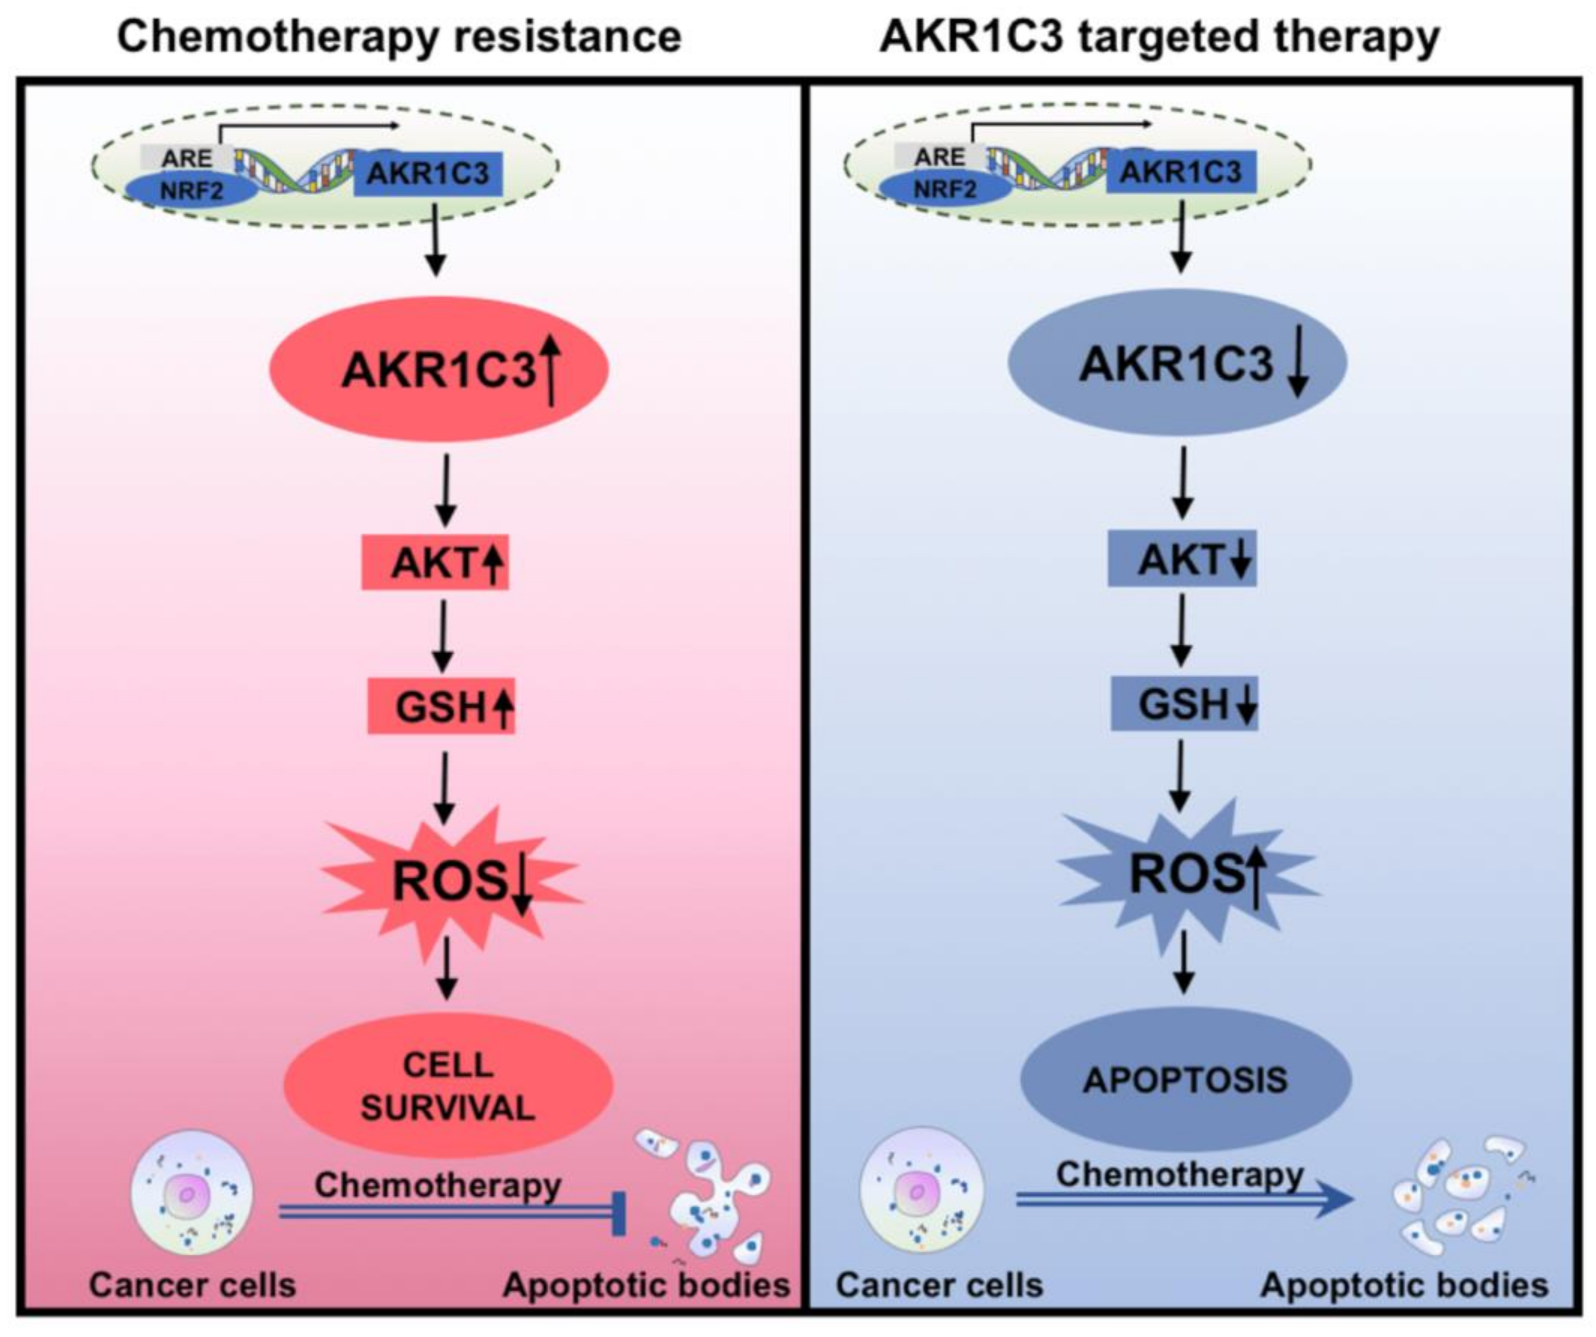
5. Conclusions
Supplementary Materials
Author Contributions
Funding
Institutional Review Board Statement
Informed Consent Statement
Data Availability Statement
Acknowledgments
Conflicts of Interest
Abbreviations
| ADH4 | Alcohol dehydrogenase 4 |
| ADH6 | Alcohol dehydrogenase 6 |
| AKRs | Aldo-keto reductases |
| AKR1C3 | Human aldo-keto reductase family 1 member C3 |
| BE | Barrett’s esophagus |
| BSO | L-Buthionine-S,R-sulfoximine |
| ChIP | Chromatin immunoprecipitation |
| CXCR4 | C-X-C motif chemokine receptor 4 |
| EAC | Esophageal adenocarcinoma |
| EC | Esophageal cancer |
| EMT | Epithelial–mesenchymal transition |
| ESCC | Esophageal squamous cancer cell |
| FBS | Fetal bovine serum |
| 5-FU | 5-Fluorouracil |
| GEO | Gene Expression Omnibus |
| GSEA | Gene set enrichment analysis |
| GSH | Glutathione |
| H2O2 | Hydrogen peroxide |
| IRS-1 | Insulin receptor substrate protein 1 |
| PFA | Paraformaldehyde |
| PKB | Protein kinase B |
| PTEN | Phosphatase and tensin homolog |
| PTPs | Protein tyrosine phosphatases |
| NAC | N-acetyl cysteine |
| NADPH | Nicotinamide adenine dinucleotide phosphate |
| NOXs | NADPH oxidases |
| MTT | 3-(4,5-Dimethyl-2-thiazolyl)-2,5-diphenyl-2-H-tetrazolium bromide |
| ROS | Reactive oxygen species |
| shRNA | Short hairpin RNA |
| SNAIL1 | Snail family transcriptional repressor 1 |
| TCGA | The Cancer Genome Atlas |
| TSS | Transcription start site |
| UGT1A6 | UDP glucuronosyltransferase family 1 member A6 |
| ZEB-1 | Zinc finger E-box-binding homeobox 1 |
References
- Bray, F.; Ferlay, J.; Soerjomataram, I.; Siegel, R.L.; Torre, L.A.; Jemal, A. Global cancer statistics 2018: GLOBOCAN estimates of incidence and mortality worldwide for 36 cancers in 185 countries. CA Cancer J. Clin. 2018, 68, 394–424. [Google Scholar] [CrossRef] [PubMed]
- Integrated genomic characterization of oesophageal carcinoma. Nature 2017, 541, 169–175. [CrossRef] [PubMed]
- Zhou, C.; Fan, N.; Liu, F.; Fang, N.; Plum, P.S.; Thieme, R.; Gockel, I.; Gromnitza, S.; Hillmer, A.M.; Chon, S.H.; et al. Linking Cancer Stem Cell Plasticity to Therapeutic Resistance-Mechanism and Novel Therapeutic Strategies in Esophageal Cancer. Cells 2020, 9, 1481. [Google Scholar] [CrossRef] [PubMed]
- Siegel, R.L.; Miller, K.D.; Jemal, A. Cancer statistics, 2016. CA Cancer J. Clin. 2016, 66, 7–30. [Google Scholar] [CrossRef] [PubMed]
- Thrift, A.P.; Whiteman, D.C. The incidence of esophageal adenocarcinoma continues to rise: Analysis of period and birth cohort effects on recent trends. Ann. Oncol. 2012, 23, 3155–3162. [Google Scholar] [CrossRef] [PubMed]
- van Hagen, P.; Hulshof, M.C.; van Lanschot, J.J.; Steyerberg, E.W.; van Berge Henegouwen, M.I.; Wijnhoven, B.P.; Richel, D.J.; Nieuwenhuijzen, G.A.; Hospers, G.A.; Bonenkamp, J.J.; et al. Preoperative chemoradiotherapy for esophageal or junctional cancer. N. Engl. J. Med. 2012, 366, 2074–2084. [Google Scholar] [CrossRef] [PubMed]
- Al-Batran, S.E.; Hartmann, J.T.; Hofheinz, R.; Homann, N.; Rethwisch, V.; Probst, S.; Stoehlmacher, J.; Clemens, M.R.; Mahlberg, R.; Fritz, M.; et al. Biweekly fluorouracil, leucovorin, oxaliplatin, and docetaxel (FLOT) for patients with metastatic adenocarcinoma of the stomach or esophagogastric junction: A phase II trial of the Arbeitsgemeinschaft Internistische Onkologie. Ann. Oncol. 2008, 19, 1882–1887. [Google Scholar] [CrossRef]
- Dong, J.; Buas, M.F.; Gharahkhani, P.; Kendall, B.J.; Onstad, L.; Zhao, S.; Anderson, L.A.; Wu, A.H.; Ye, W.; Bird, N.C.; et al. Determining Risk of Barrett’s Esophagus and Esophageal Adenocarcinoma Based on Epidemiologic Factors and Genetic Variants. Gastroenterology 2018, 154, 1273–1281.e3. [Google Scholar] [CrossRef]
- Jin, Y.; Penning, T.M. Aldo-keto reductases and bioactivation/detoxication. Annu. Rev. Pharmacol. Toxicol. 2007, 47, 263–292. [Google Scholar] [CrossRef]
- Penning, T.M. AKR1C3 (type 5 17β-hydroxysteroid dehydrogenase/prostaglandin F synthase): Roles in malignancy and endocrine disorders. Mol. Cell. Endocrinol. 2019, 489, 82–91. [Google Scholar] [CrossRef]
- Le Calvé, B.; Rynkowski, M.; Le Mercier, M.; Bruyère, C.; Lonez, C.; Gras, T.; Haibe-Kains, B.; Bontempi, G.; Decaestecker, C.; Ruysschaert, J.M.; et al. Long-term in vitro treatment of human glioblastoma cells with temozolomide increases resistance in vivo through up-regulation of GLUT transporter and aldo-keto reductase enzyme AKR1C expression. Neoplasia 2010, 12, 727–739. [Google Scholar] [CrossRef]
- Penning, T.M. Aldo-Keto Reductase Regulation by the Nrf2 System: Implications for Stress Response, Chemotherapy Drug Resistance, and Carcinogenesis. Chem. Res. Toxicol. 2017, 30, 162–176. [Google Scholar] [CrossRef]
- Huebbers, C.U.; Verhees, F.; Poluschkin, L.; Olthof, N.C.; Kolligs, J.; Siefer, O.G.; Henfling, M.; Ramaekers, F.C.S.; Preuss, S.F.; Beutner, D.; et al. Upregulation of AKR1C1 and AKR1C3 expression in OPSCC with integrated HPV16 and HPV-negative tumors is an indicator of poor prognosis. Int. J. Cancer 2019, 144, 2465–2477. [Google Scholar] [CrossRef]
- Liu, C.; Yang, J.C.; Armstrong, C.M.; Lou, W.; Liu, L.; Qiu, X.; Zou, B.; Lombard, A.P.; D’Abronzo, L.S.; Evans, C.P.; et al. AKR1C3 Promotes AR-V7 Protein Stabilization and Confers Resistance to AR-Targeted Therapies in Advanced Prostate Cancer. Mol. Cancer Ther. 2019, 18, 1875–1886. [Google Scholar] [CrossRef]
- Zhong, T.; Xu, F.; Xu, J.; Liu, L.; Chen, Y. Aldo-keto reductase 1C3 (AKR1C3) is associated with the doxorubicin resistance in human breast cancer via PTEN loss. Biomed. Pharmacother. 2015, 69, 317–325. [Google Scholar] [CrossRef]
- Fraser, M.; Bai, T.; Tsang, B.K. Akt promotes cisplatin resistance in human ovarian cancer cells through inhibition of p53 phosphorylation and nuclear function. Int. J. Cancer 2008, 122, 534–546. [Google Scholar] [CrossRef]
- Meng, C.Y.; Zhao, Z.Q.; Bai, R.; Zhao, W.; Wang, Y.X.; Xue, H.Q.; Sun, L.; Sun, C.; Feng, W.; Guo, S.B. MicroRNA-22 mediates the cisplatin resistance of osteosarcoma cells by inhibiting autophagy via the PI3K/Akt/mTOR pathway. Oncol. Rep. 2020, 43, 1169–1186. [Google Scholar] [CrossRef]
- Wu, Y.H.; Huang, Y.F.; Chen, C.C.; Chou, C.Y. Akt inhibitor SC66 promotes cell sensitivity to cisplatin in chemoresistant ovarian cancer cells through inhibition of COL11A1 expression. Cell Death Dis. 2019, 10, 322. [Google Scholar] [CrossRef]
- Nitulescu, G.M.; Van De Venter, M.; Nitulescu, G.; Ungurianu, A.; Juzenas, P.; Peng, Q.; Olaru, O.T.; Grădinaru, D.; Tsatsakis, A.; Tsoukalas, D.; et al. The Akt pathway in oncology therapy and beyond (Review). Int. J. Oncol. 2018, 53, 2319–2331. [Google Scholar] [CrossRef]
- Li, J.; Cheng, D.; Zhu, M.; Yu, H.; Pan, Z.; Liu, L.; Geng, Q.; Pan, H.; Yan, M.; Yao, M. OTUB2 stabilizes U2AF2 to promote the Warburg effect and tumorigenesis via the AKT/mTOR signaling pathway in non-small cell lung cancer. Theranostics 2019, 9, 179–195. [Google Scholar] [CrossRef]
- Song, M.; Bode, A.M.; Dong, Z.; Lee, M.H. AKT as a Therapeutic Target for Cancer. Cancer Res. 2019, 79, 1019–1031. [Google Scholar] [CrossRef]
- Hannun, Y.A. Apoptosis and the dilemma of cancer chemotherapy. Blood 1997, 89, 1845–1853. [Google Scholar] [CrossRef]
- Makin, G.; Hickman, J.A. Apoptosis and cancer chemotherapy. Cell Tissue Res. 2000, 301, 143–152. [Google Scholar] [CrossRef]
- Hanahan, D.; Weinberg, R.A. The hallmarks of cancer. Cell 2000, 100, 57–70. [Google Scholar] [CrossRef]
- Gupta, S.C.; Hevia, D.; Patchva, S.; Park, B.; Koh, W.; Aggarwal, B.B. Upsides and downsides of reactive oxygen species for cancer: The roles of reactive oxygen species in tumorigenesis, prevention, and therapy. Antioxid. Redox. Signal. 2012, 16, 1295–1322. [Google Scholar] [CrossRef]
- Trachootham, D.; Alexandre, J.; Huang, P. Targeting cancer cells by ROS-mediated mechanisms: A radical therapeutic approach? Nat. Rev. Drug Discov. 2009, 8, 579–591. [Google Scholar] [CrossRef]
- Yang, B.; Chen, Y.; Shi, J. Reactive Oxygen Species (ROS)-Based Nanomedicine. Chem. Rev. 2019, 119, 4881–4985. [Google Scholar] [CrossRef]
- Cui, Q.; Wang, J.Q.; Assaraf, Y.G.; Ren, L.; Gupta, P.; Wei, L.; Ashby, C.R., Jr.; Yang, D.H.; Chen, Z.S. Modulating ROS to overcome multidrug resistance in cancer. Drug Resist. Updat. 2018, 41, 1–25. [Google Scholar] [CrossRef]
- Birben, E.; Sahiner, U.M.; Sackesen, C.; Erzurum, S.; Kalayci, O. Oxidative stress and antioxidant defense. World Allergy Organ. J. 2012, 5, 9–19. [Google Scholar] [CrossRef]
- Matsunaga, T.; Yamaguchi, A.; Morikawa, Y.; Kezuka, C.; Takazawa, H.; Endo, S.; El-Kabbani, O.; Tajima, K.; Ikari, A.; Hara, A. Induction of aldo-keto reductases (AKR1C1 and AKR1C3) abolishes the efficacy of daunorubicin chemotherapy for leukemic U937 cells. Anticancer Drugs 2014, 25, 868–877. [Google Scholar] [CrossRef]
- Sun, S.Q.; Gu, X.; Gao, X.S.; Li, Y.; Yu, H.; Xiong, W.; Yu, H.; Wang, W.; Li, Y.; Teng, Y.; et al. Correction: Overexpression of AKR1C3 significantly enhances human prostate cancer cells resistance to radiation. Oncotarget 2020, 11, 1575. [Google Scholar] [CrossRef] [PubMed]
- Li, X.; Hong, X.; Gao, X.; Gu, X.; Xiong, W.; Zhao, J.; Yu, H.; Cui, M.; Xie, M.; Bai, Y.; et al. Methyl jasmonate enhances the radiation sensitivity of esophageal carcinoma cells by inhibiting the 11-ketoprostaglandin reductase activity of AKR1C3. Cancer Manag. Res. 2018, 10, 3149–3158. [Google Scholar] [CrossRef] [PubMed]
- Zhao, J.; Xiang, Y.; Xiao, C.; Guo, P.; Wang, D.; Liu, Y.; Shen, Y. AKR1C3 overexpression mediates methotrexate resistance in choriocarcinoma cells. Int. J. Med. Sci. 2014, 11, 1089–1097. [Google Scholar] [CrossRef] [PubMed]
- Wang, Z.; Qin, J.; Zhao, J.; Li, J.; Li, D.; Popp, M.; Popp, F.; Alakus, H.; Kong, B.; Dong, Q.; et al. Inflammatory IFIT3 renders chemotherapy resistance by regulating post-translational modification of VDAC2 in pancreatic cancer. Theranostics 2020, 10, 7178–7192. [Google Scholar] [CrossRef]
- Perillo, B.; Di Donato, M.; Pezone, A.; Di Zazzo, E.; Giovannelli, P.; Galasso, G.; Castoria, G.; Migliaccio, A. ROS in cancer therapy: The bright side of the moon. Exp. Mol. Med. 2020, 52, 192–203. [Google Scholar] [CrossRef]
- Manning, B.D.; Toker, A. AKT/PKB Signaling: Navigating the Network. Cell 2017, 169, 381–405. [Google Scholar] [CrossRef]
- Rubenstein, J.H.; Shaheen, N.J. Epidemiology, Diagnosis, and Management of Esophageal Adenocarcinoma. Gastroenterology 2015, 149, 302–317.e1. [Google Scholar] [CrossRef]
- Wang, Y.; Zhao, Y.; Herbst, A.; Kalinski, T.; Qin, J.; Wang, X.; Jiang, Z.; Benedix, F.; Franke, S.; Wartman, T.; et al. miR-221 Mediates Chemoresistance of Esophageal Adenocarcinoma by Direct Targeting of DKK2 Expression. Ann. Surg. 2016, 264, 804–814. [Google Scholar] [CrossRef]
- Yoda, T.; Kikuchi, K.; Miki, Y.; Onodera, Y.; Hata, S.; Takagi, K.; Nakamura, Y.; Hirakawa, H.; Ishida, T.; Suzuki, T.; et al. 11β-Prostaglandin F2α, a bioactive metabolite catalyzed by AKR1C3, stimulates prostaglandin F receptor and induces slug expression in breast cancer. Mol. Cell Endocrinol. 2015, 413, 236–247. [Google Scholar] [CrossRef]
- Wang, B.; Wu, S.; Fang, Y.; Sun, G.; He, D.; Hsieh, J.T.; Wang, X.; Zeng, H.; Wu, K. The AKR1C3/AR-V7 complex maintains CRPC tumour growth by repressing B4GALT1 expression. J. Cell. Mol. Med. 2020, 24, 12032–12043. [Google Scholar] [CrossRef]
- Matsunaga, T.; Okumura, N.; Saito, H.; Morikawa, Y.; Suenami, K.; Hisamatsu, A.; Endo, S.; Ikari, A. Significance of aldo-keto reductase 1C3 and ATP-binding cassette transporter B1 in gain of irinotecan resistance in colon cancer cells. Chem. Biol. Interact. 2020, 332, 109295. [Google Scholar] [CrossRef]
- Franke, T.F.; Hornik, C.P.; Segev, L.; Shostak, G.A.; Sugimoto, C. PI3K/Akt and apoptosis: Size matters. Oncogene 2003, 22, 8983–8998. [Google Scholar] [CrossRef]
- Ali, A.Y.; Kim, J.Y.; Pelletier, J.F.; Vanderhyden, B.C.; Bachvarov, D.R.; Tsang, B.K. Akt confers cisplatin chemoresistance in human gynecological carcinoma cells by modulating PPM1D stability. Mol. Carcinog. 2015, 54, 1301–1314. [Google Scholar] [CrossRef]
- Shu, X.R.; Wu, J.; Sun, H.; Chi, L.Q.; Wang, J.H. PAK4 confers the malignance of cervical cancers and contributes to the cisplatin-resistance in cervical cancer cells via PI3K/AKT pathway. Diagn. Pathol. 2015, 10, 177. [Google Scholar] [CrossRef]
- Sies, H.; Jones, D.P. Reactive oxygen species (ROS) as pleiotropic physiological signalling agents. Nat. Rev. Mol. Cell Biol. 2020, 21, 363–383. [Google Scholar] [CrossRef]
- Sharma, A.; Arambula, J.F.; Koo, S.; Kumar, R.; Singh, H.; Sessler, J.L.; Kim, J.S. Hypoxia-targeted drug delivery. Chem. Soc. Rev. 2019, 48, 771–813. [Google Scholar] [CrossRef]
- Marullo, R.; Werner, E.; Degtyareva, N.; Moore, B.; Altavilla, G.; Ramalingam, S.S.; Doetsch, P.W. Cisplatin induces a mitochondrial-ROS response that contributes to cytotoxicity depending on mitochondrial redox status and bioenergetic functions. PLoS ONE 2013, 8, e81162. [Google Scholar] [CrossRef]
- Kleih, M.; Böpple, K.; Dong, M.; Gaißler, A.; Heine, S.; Olayioye, M.A.; Aulitzky, W.E.; Essmann, F. Direct impact of cisplatin on mitochondria induces ROS production that dictates cell fate of ovarian cancer cells. Cell Death Dis. 2019, 10, 851. [Google Scholar] [CrossRef]
- Chueca, E.; Apostolova, N.; Esplugues, J.V.; García-González, M.A.; Lanas, Á.; Piazuelo, E. Proton Pump Inhibitors Display Antitumor Effects in Barrett’s Adenocarcinoma Cells. Front. Pharmacol. 2016, 7, 452. [Google Scholar] [CrossRef]
- Yang, H.; Villani, R.M.; Wang, H.; Simpson, M.J.; Roberts, M.S.; Tang, M.; Liang, X. The role of cellular reactive oxygen species in cancer chemotherapy. J. Exp. Clin. Cancer Res. 2018, 37, 266. [Google Scholar] [CrossRef]
- Panieri, E.; Santoro, M.M. ROS homeostasis and metabolism: A dangerous liason in cancer cells. Cell Death Dis. 2016, 7, e2253. [Google Scholar] [CrossRef]
- Oestreicher, J.; Morgan, B. Glutathione: Subcellular distribution and membrane transport (1). Biochem. Cell Biol. 2019, 97, 270–289. [Google Scholar] [CrossRef]
- Tan, B.L.; Norhaizan, M.E.; Liew, W.P.; Sulaiman Rahman, H. Antioxidant and Oxidative Stress: A Mutual Interplay in Age-Related Diseases. Front. Pharmacol. 2018, 9, 1162. [Google Scholar] [CrossRef]
- Koundouros, N.; Poulogiannis, G. Phosphoinositide 3-Kinase/Akt Signaling and Redox Metabolism in Cancer. Front. Oncol. 2018, 8, 160. [Google Scholar] [CrossRef]
- Xu, W.; Yang, Z.; Zhou, S.F.; Lu, N. Posttranslational regulation of phosphatase and tensin homolog (PTEN) and its functional impact on cancer behaviors. Drug Des. Devel. Ther. 2014, 8, 1745–1751. [Google Scholar] [CrossRef]
- Goldstein, B.J.; Mahadev, K.; Wu, X.; Zhu, L.; Motoshima, H. Role of insulin-induced reactive oxygen species in the insulin signaling pathway. Antioxid. Redox. Signal. 2005, 7, 1021–1031. [Google Scholar] [CrossRef]
- Jasek-Gajda, E.; Jurkowska, H.; Jasińska, M.; Lis, G.J. Targeting the MAPK/ERK and PI3K/AKT Signaling Pathways Affects NRF2, Trx and GSH Antioxidant Systems in Leukemia Cells. Antioxidants 2020, 9, 633. [Google Scholar] [CrossRef]
- Lu, S.C. Regulation of glutathione synthesis. Mol. Aspects Med. 2009, 30, 42–59. [Google Scholar] [CrossRef]
- Wang, J.; Zhang, H.; Du, A.; Li, Y. DJ-1 alleviates anoxia and hypoglycemia injury in cardiac microvascular via AKT and GSH. Mol. Cell Probes. 2020, 53, 101600. [Google Scholar] [CrossRef]
- Kim, S.K.; Woodcroft, K.J.; Khodadadeh, S.S.; Novak, R.F. Insulin signaling regulates gamma-glutamylcysteine ligase catalytic subunit expression in primary cultured rat hepatocytes. J. Pharmacol. Exp. Ther. 2004, 311, 99–108. [Google Scholar] [CrossRef]
- Wu, J.; Xu, H.; Wong, P.F.; Xia, S.; Xu, J.; Dong, J. Icaritin attenuates cigarette smoke-mediated oxidative stress in human lung epithelial cells via activation of PI3K-AKT and Nrf2 signaling. Food Chem. Toxicol. 2014, 64, 307–313. [Google Scholar] [CrossRef] [PubMed]
- Matsunaga, T.; Kawabata, S.; Yanagihara, Y.; Kezuka, C.; Kato, M.; Morikawa, Y.; Endo, S.; Chen, H.; Iguchi, K.; Ikari, A. Pathophysiological roles of autophagy and aldo-keto reductases in development of doxorubicin resistance in gastrointestinal cancer cells. Chem. Biol. Interact. 2019, 314, 108839. [Google Scholar] [CrossRef] [PubMed]


Publisher’s Note: MDPI stays neutral with regard to jurisdictional claims in published maps and institutional affiliations. |
© 2021 by the authors. Licensee MDPI, Basel, Switzerland. This article is an open access article distributed under the terms and conditions of the Creative Commons Attribution (CC BY) license (https://creativecommons.org/licenses/by/4.0/).
Share and Cite
Zhou, C.; Wang, Z.; Li, J.; Wu, X.; Fan, N.; Li, D.; Liu, F.; Plum, P.S.; Hoppe, S.; Hillmer, A.M.; et al. Aldo-Keto Reductase 1C3 Mediates Chemotherapy Resistance in Esophageal Adenocarcinoma via ROS Detoxification. Cancers 2021, 13, 2403. https://doi.org/10.3390/cancers13102403
Zhou C, Wang Z, Li J, Wu X, Fan N, Li D, Liu F, Plum PS, Hoppe S, Hillmer AM, et al. Aldo-Keto Reductase 1C3 Mediates Chemotherapy Resistance in Esophageal Adenocarcinoma via ROS Detoxification. Cancers. 2021; 13(10):2403. https://doi.org/10.3390/cancers13102403
Chicago/Turabian StyleZhou, Chenghui, Zhefang Wang, Jiahui Li, Xiaolin Wu, Ningbo Fan, Dai Li, Fanyu Liu, Patrick S. Plum, Sascha Hoppe, Axel M. Hillmer, and et al. 2021. "Aldo-Keto Reductase 1C3 Mediates Chemotherapy Resistance in Esophageal Adenocarcinoma via ROS Detoxification" Cancers 13, no. 10: 2403. https://doi.org/10.3390/cancers13102403
APA StyleZhou, C., Wang, Z., Li, J., Wu, X., Fan, N., Li, D., Liu, F., Plum, P. S., Hoppe, S., Hillmer, A. M., Quaas, A., Gebauer, F., Chon, S.-H., Bruns, C. J., & Zhao, Y. (2021). Aldo-Keto Reductase 1C3 Mediates Chemotherapy Resistance in Esophageal Adenocarcinoma via ROS Detoxification. Cancers, 13(10), 2403. https://doi.org/10.3390/cancers13102403