Effect of Octreotide Long-Acting Release on Tregs and MDSC Cells in Neuroendocrine Tumour Patients: A Pivotal Prospective Study

 , , ,
, , ,  , , ,
, , , 
 on behalf of the ENETs Center of Excellence of Naples, Italy
Abstract
1. Introduction
2. Materials and Methods
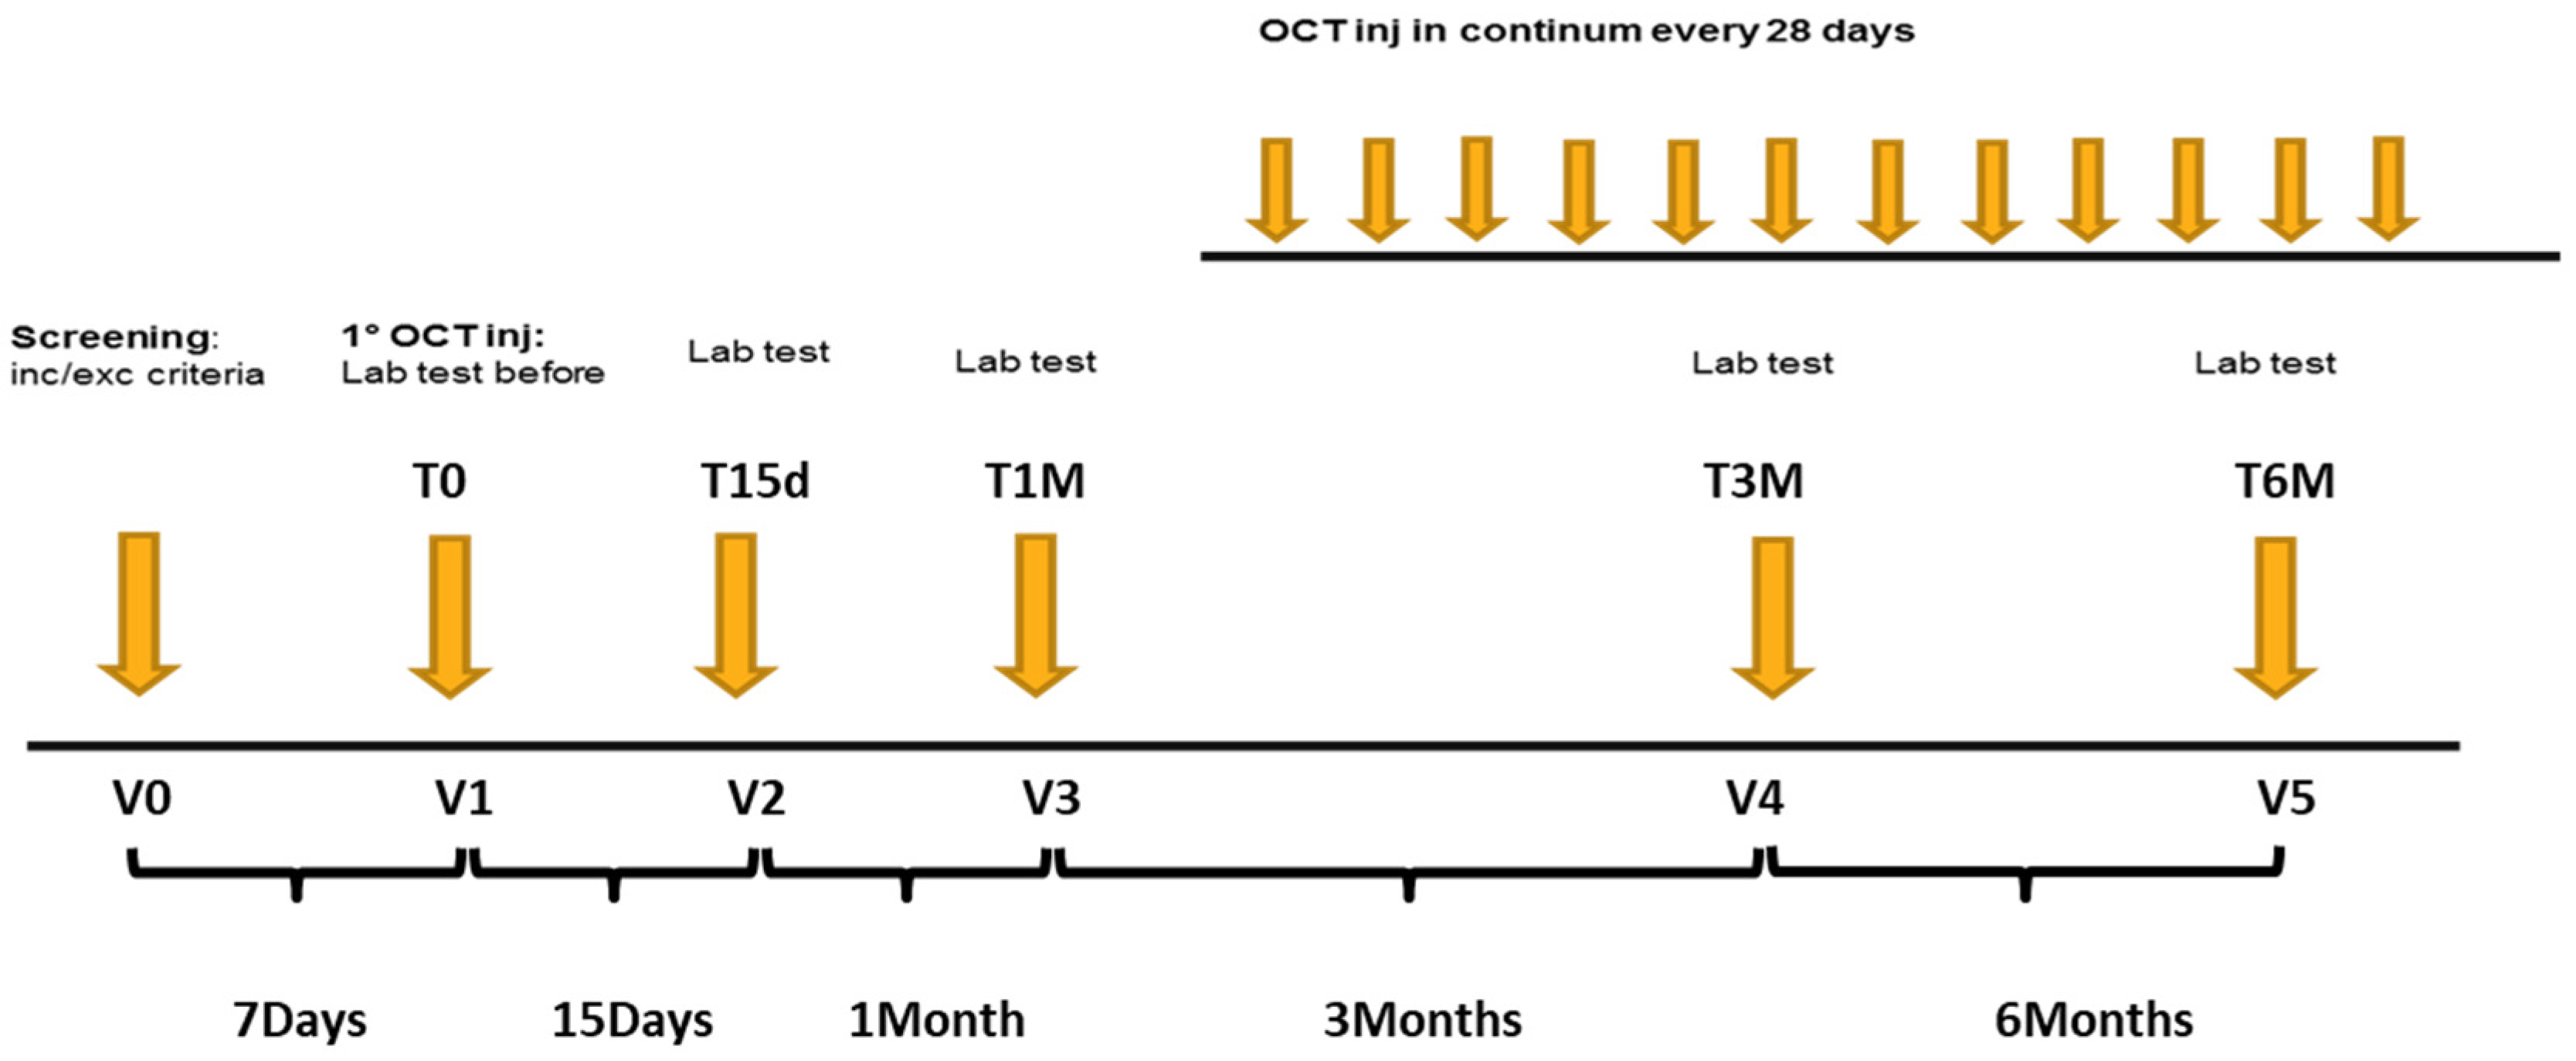
2.1. Study Design
2.2. Patients Population
2.3. Healthy Donors
2.4. End Points
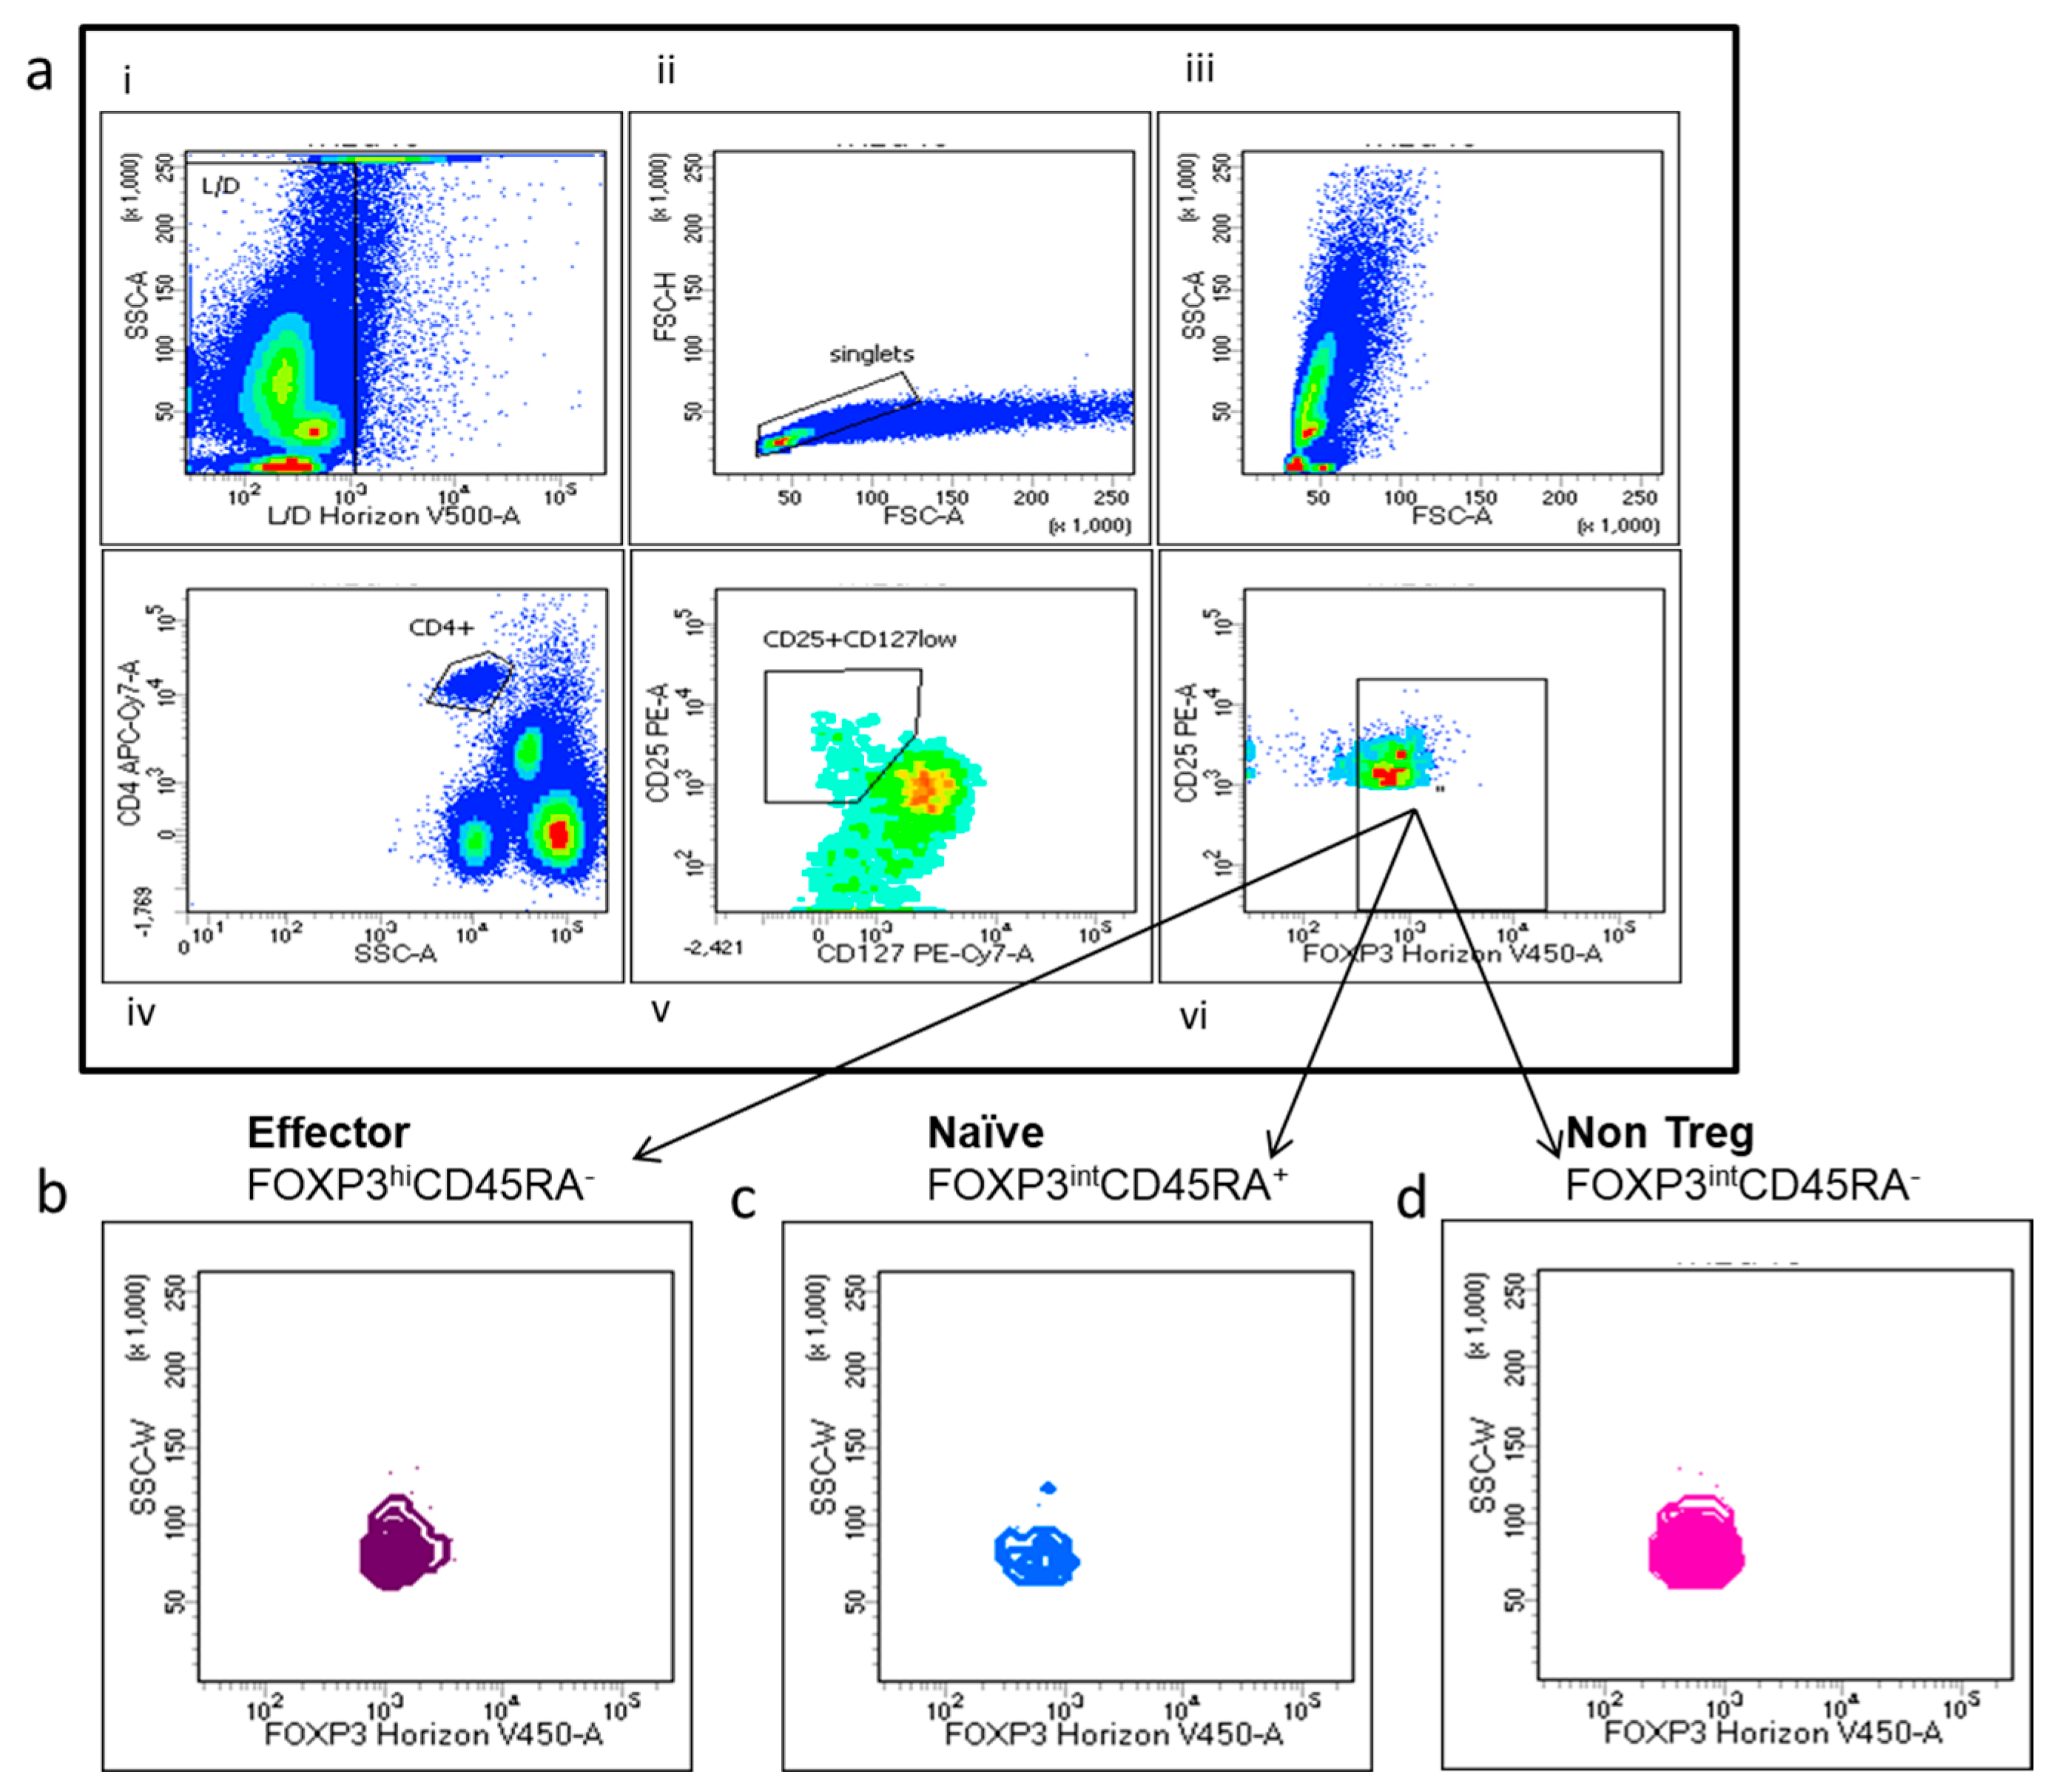
2.5. Flow Cytometry
2.6. Statistical Analysis
3. Results
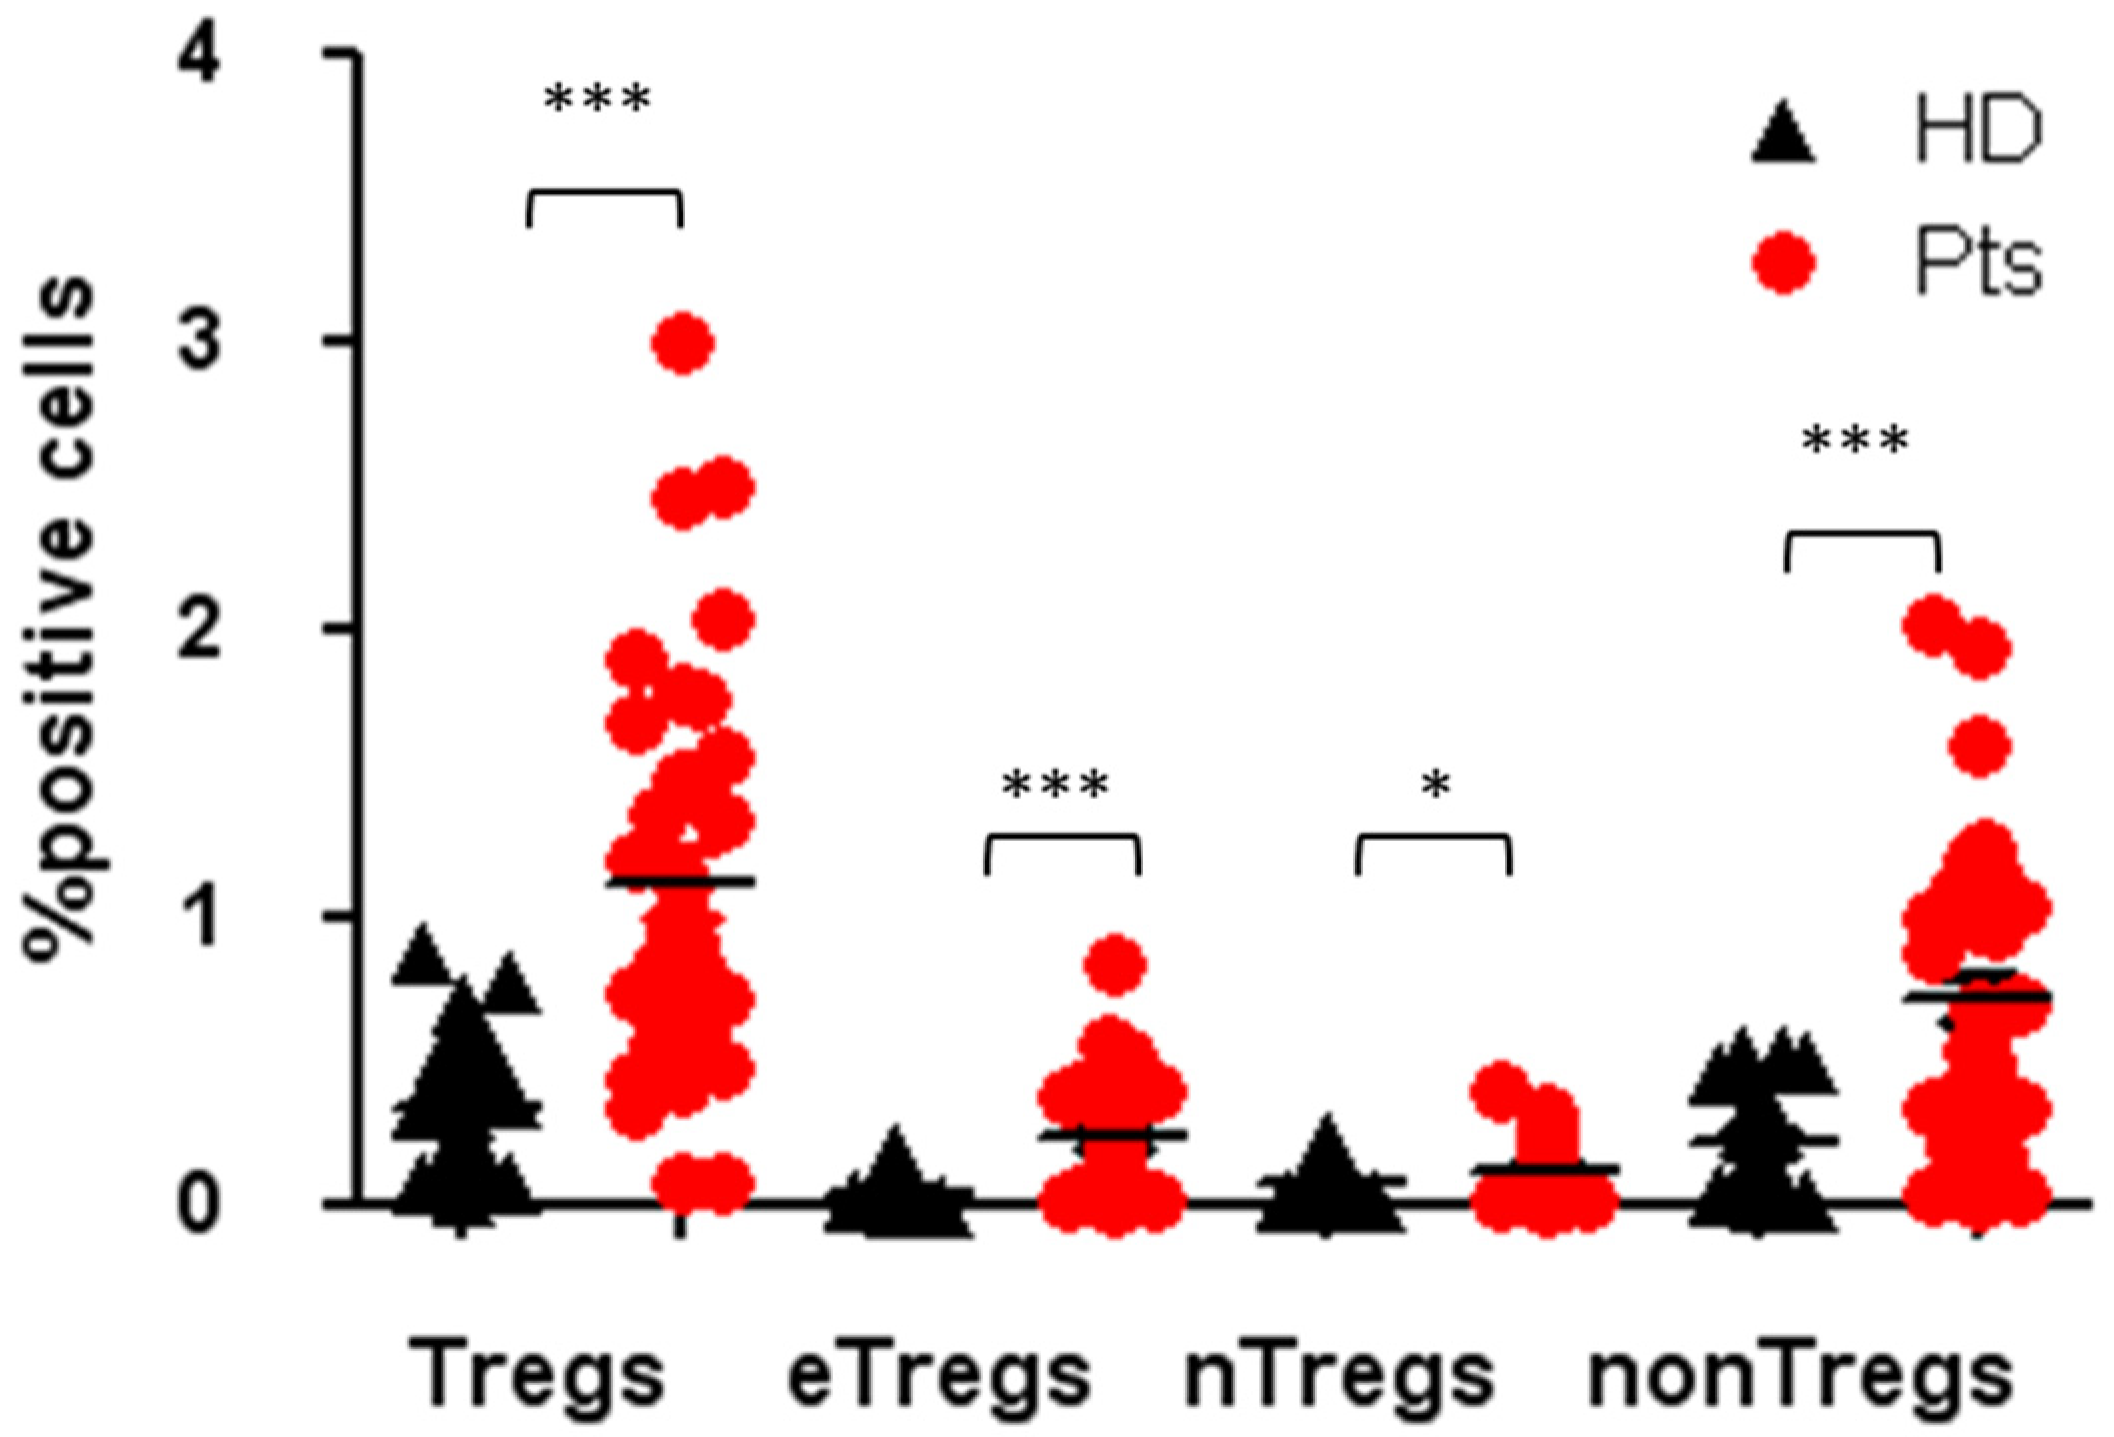
3.1. High Tregs Number in PB of NENs Patients
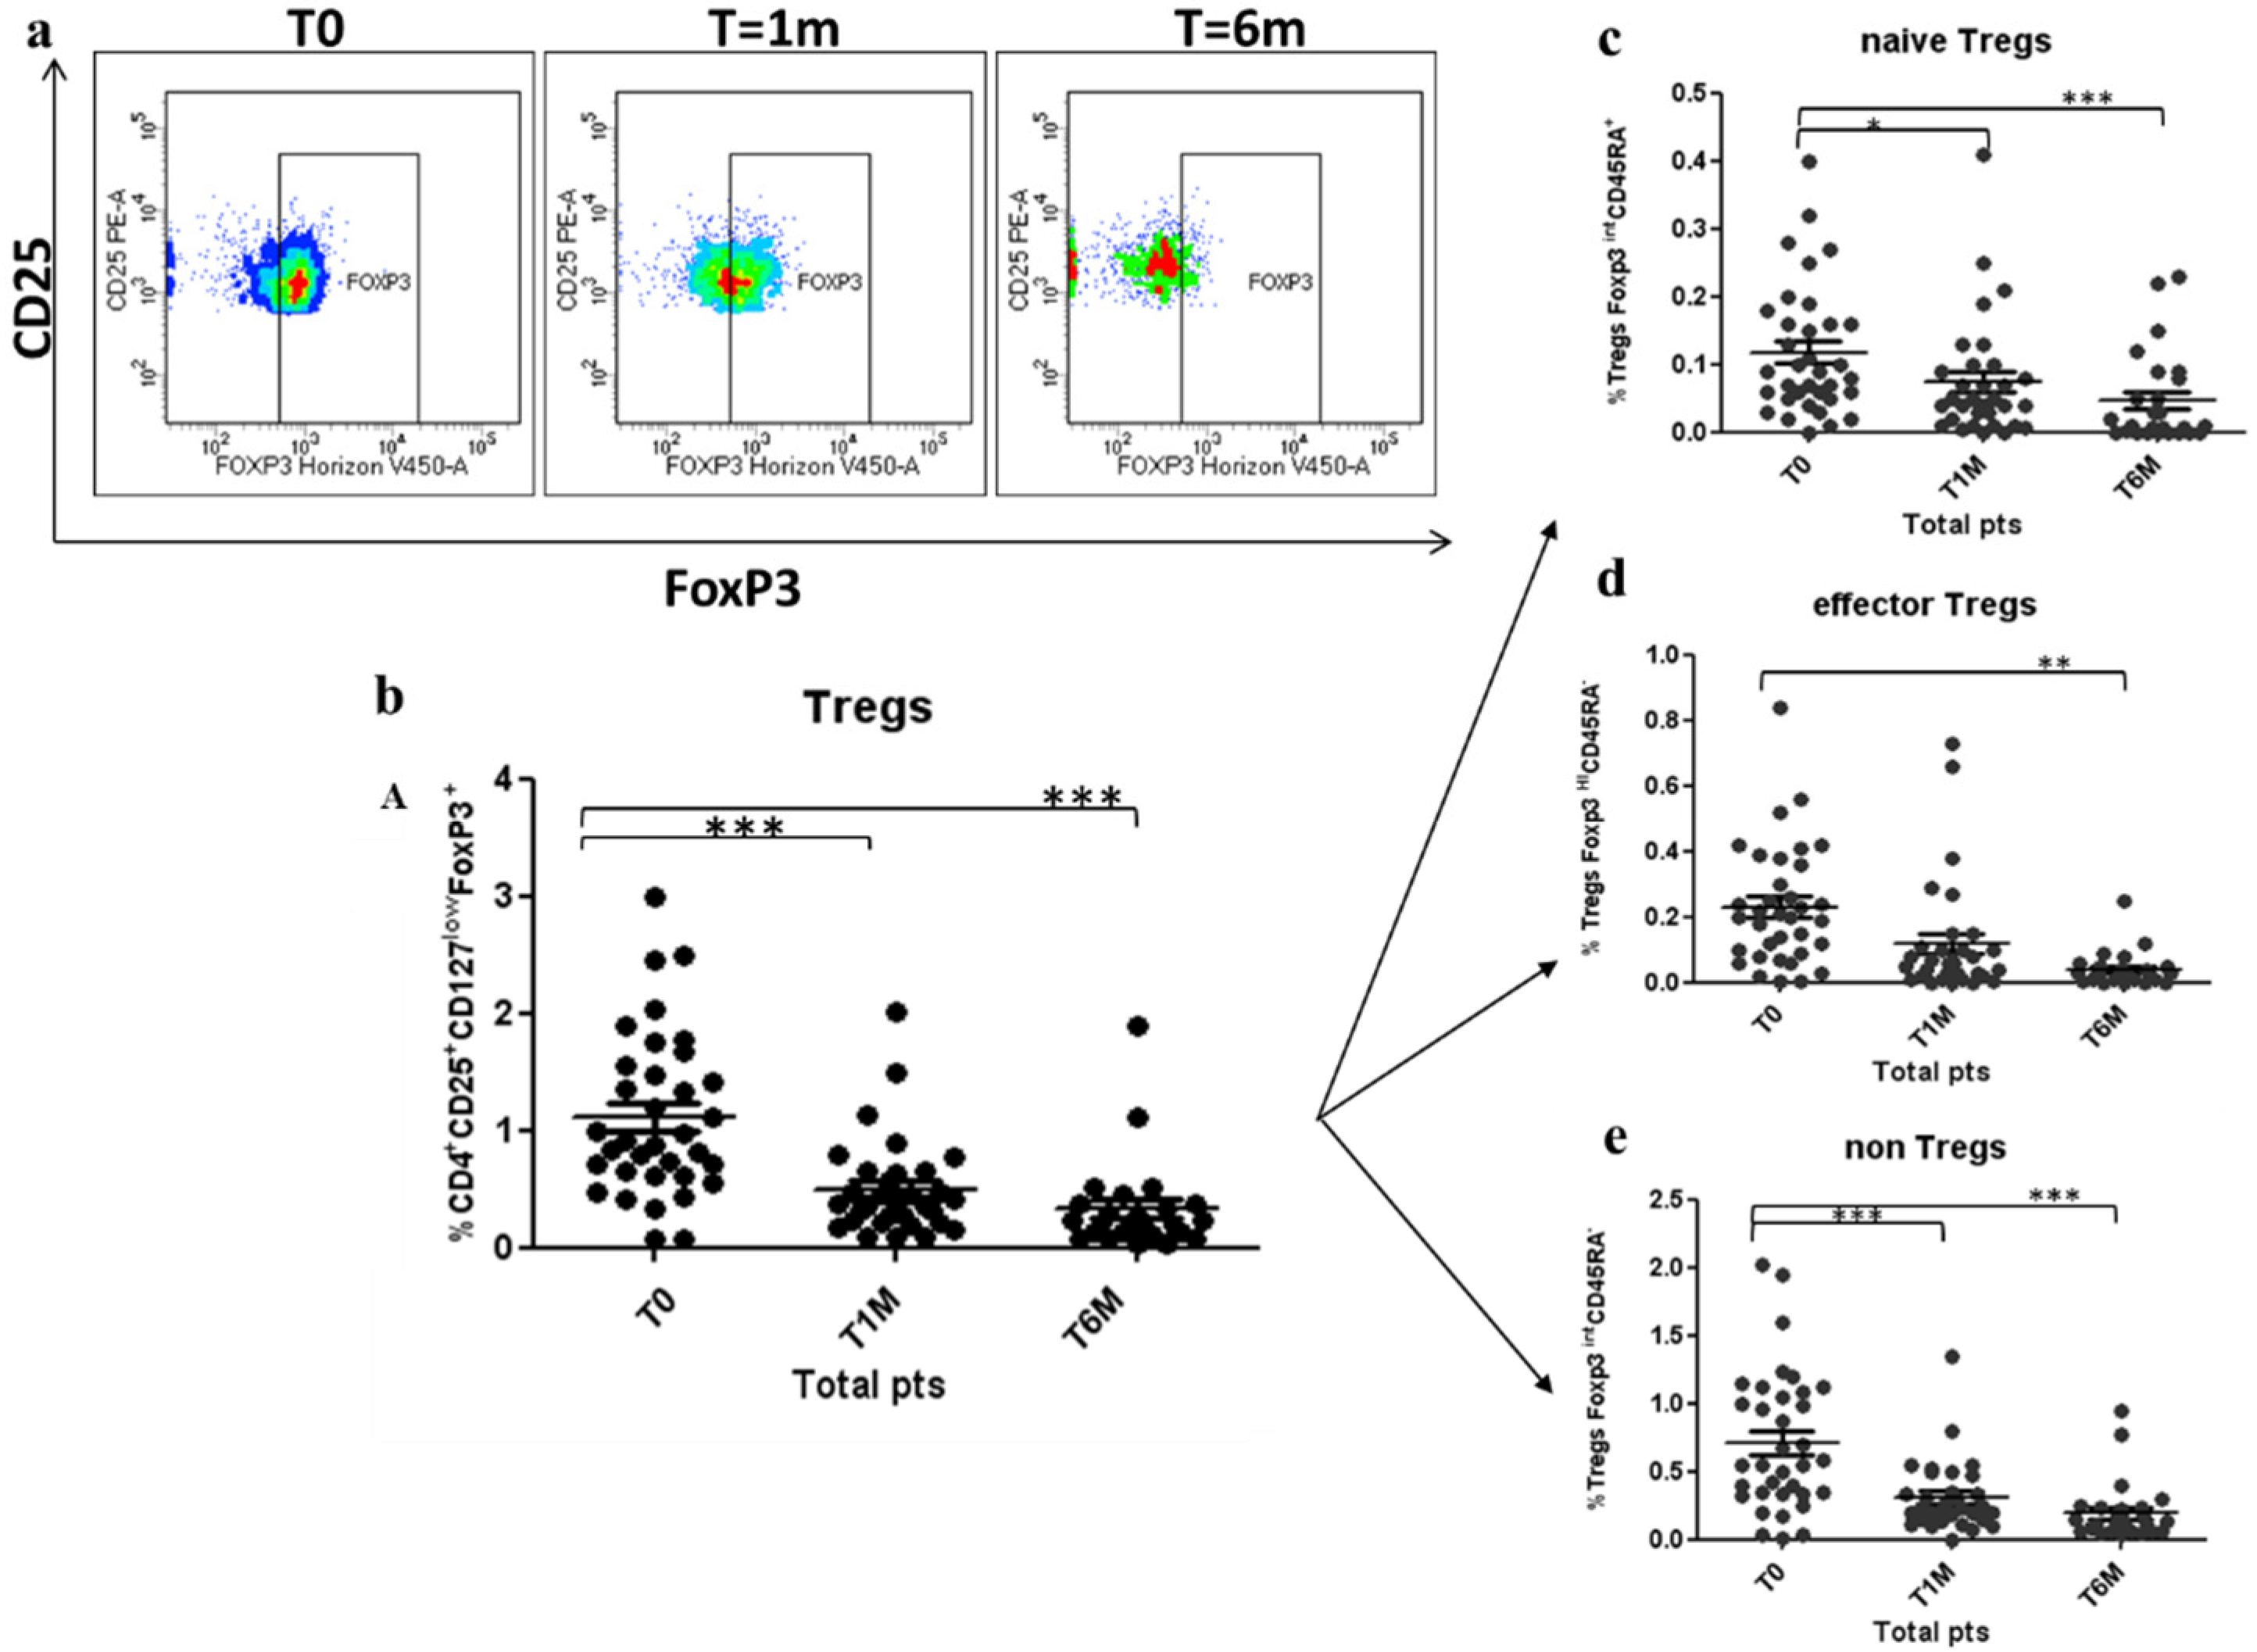
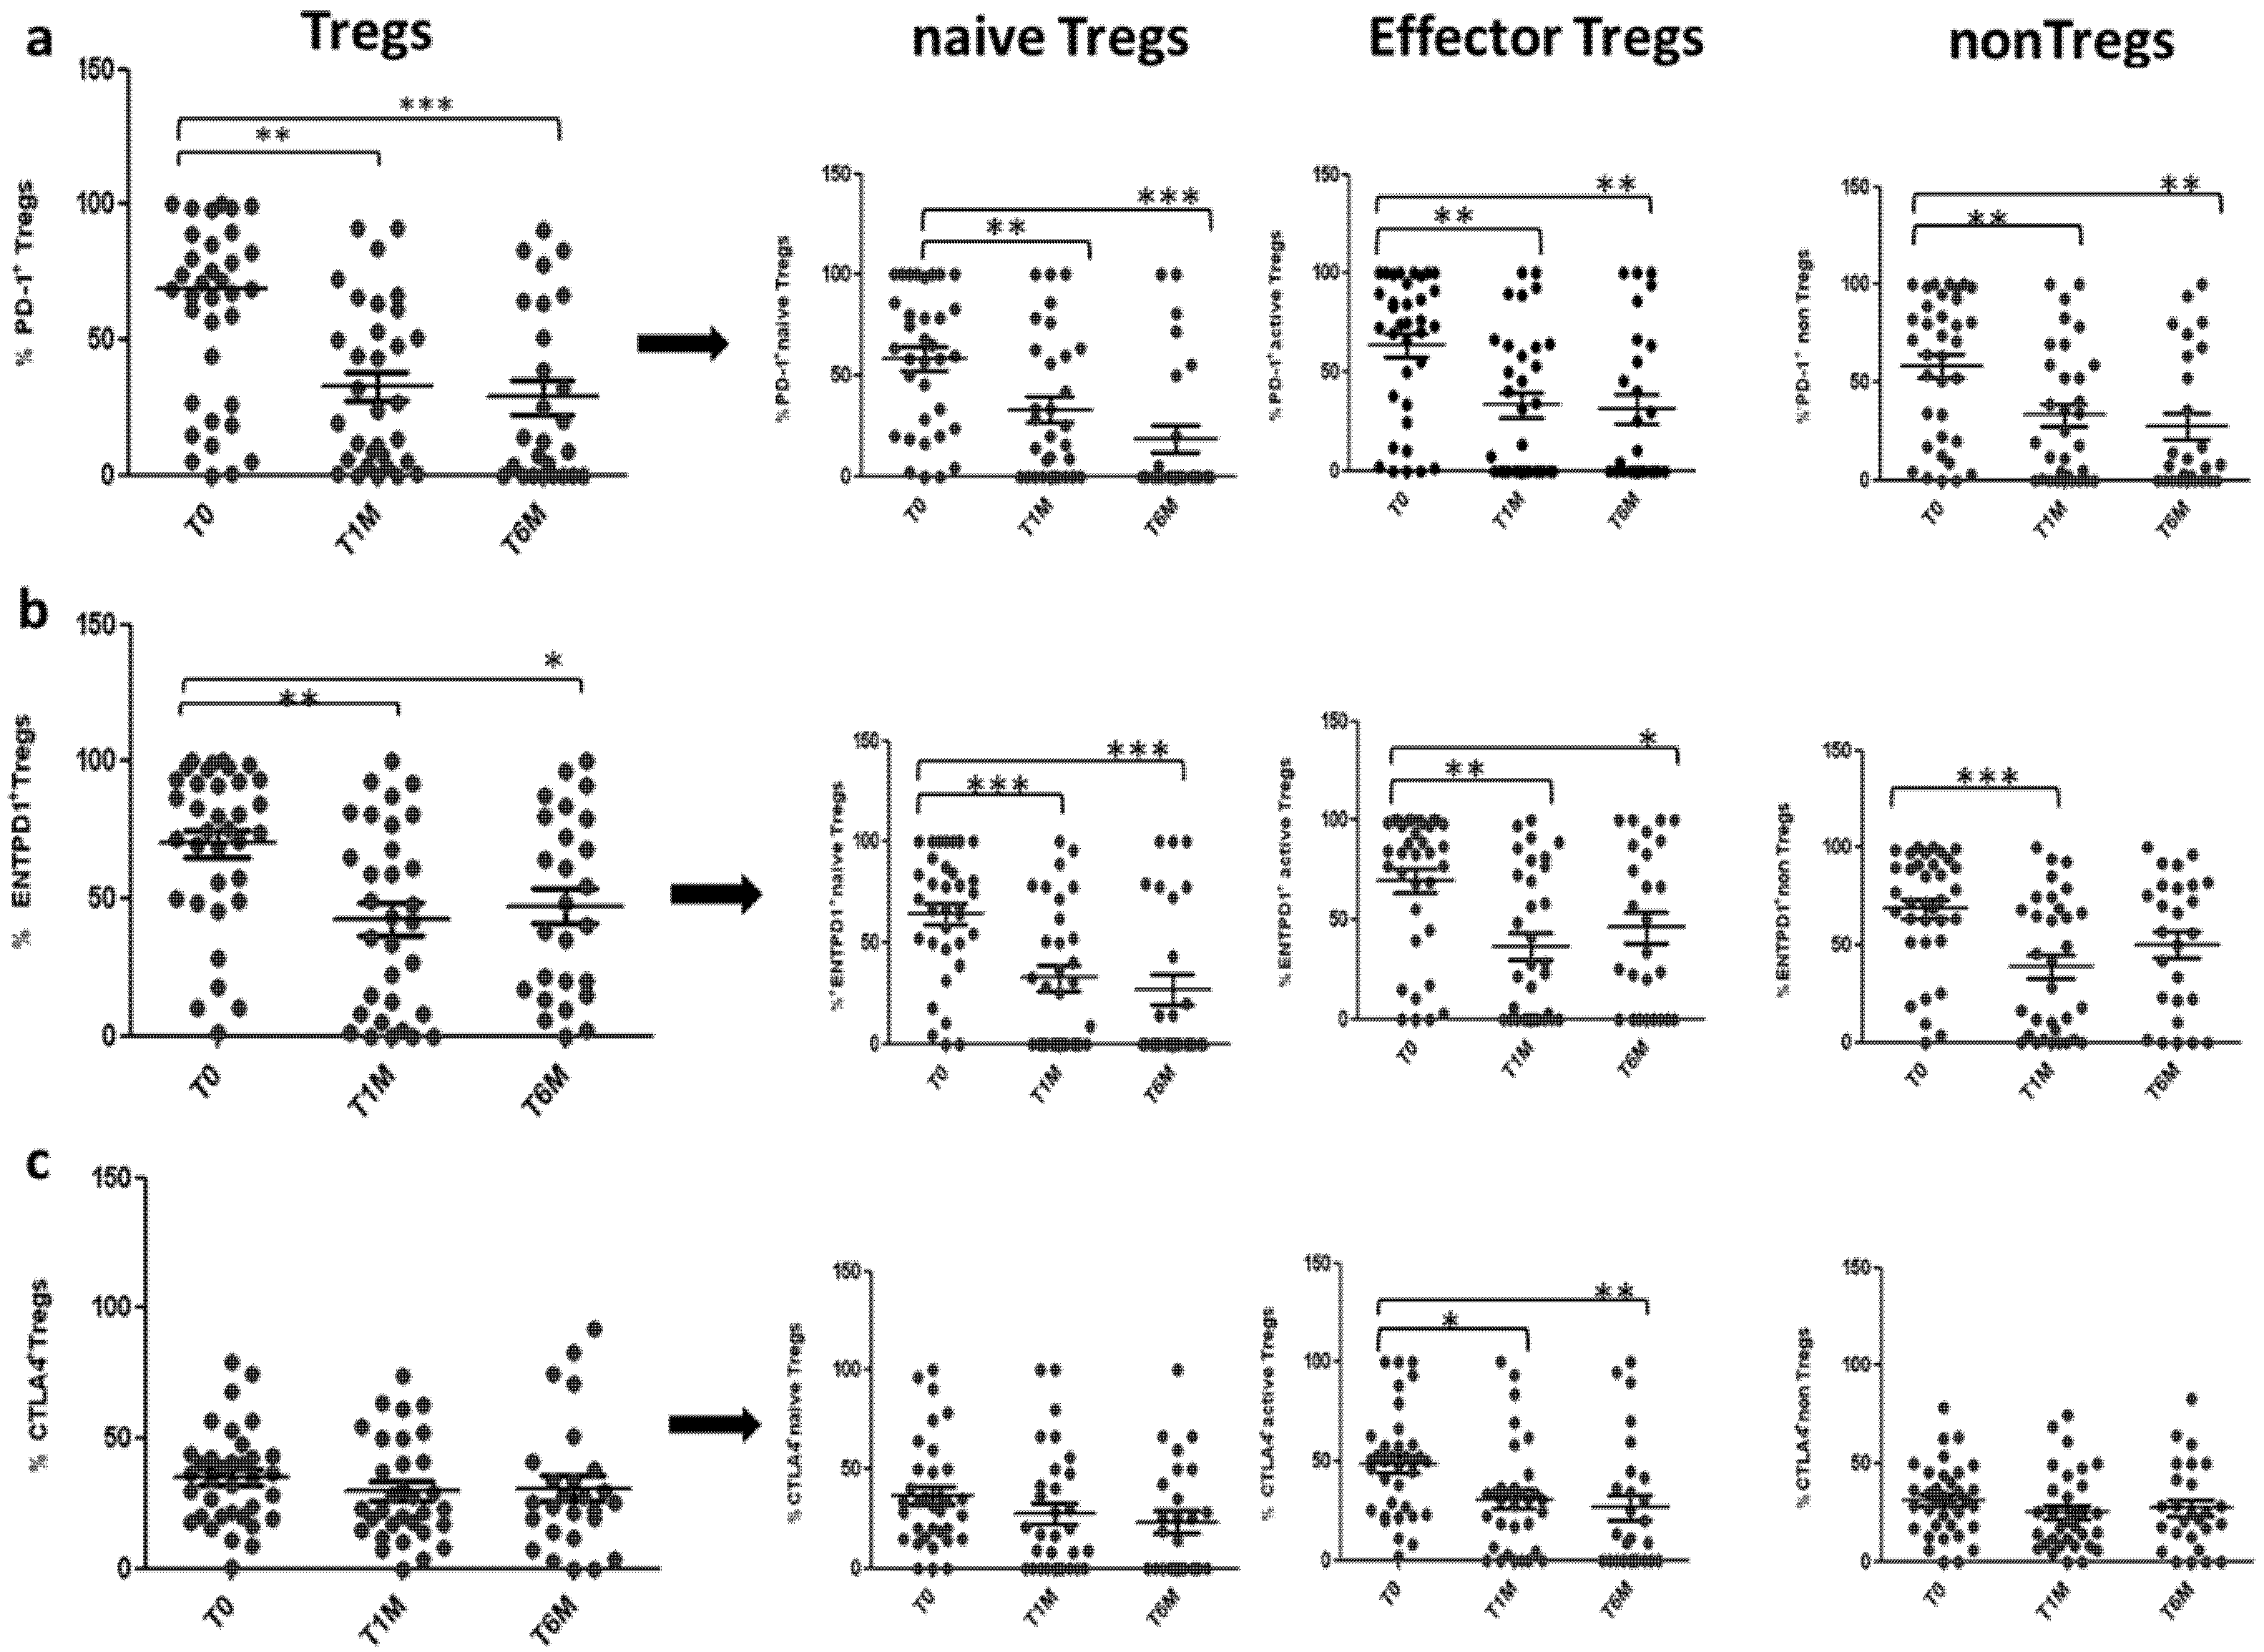
3.2. Tregs Decreased during Octreotide LAR Treatment
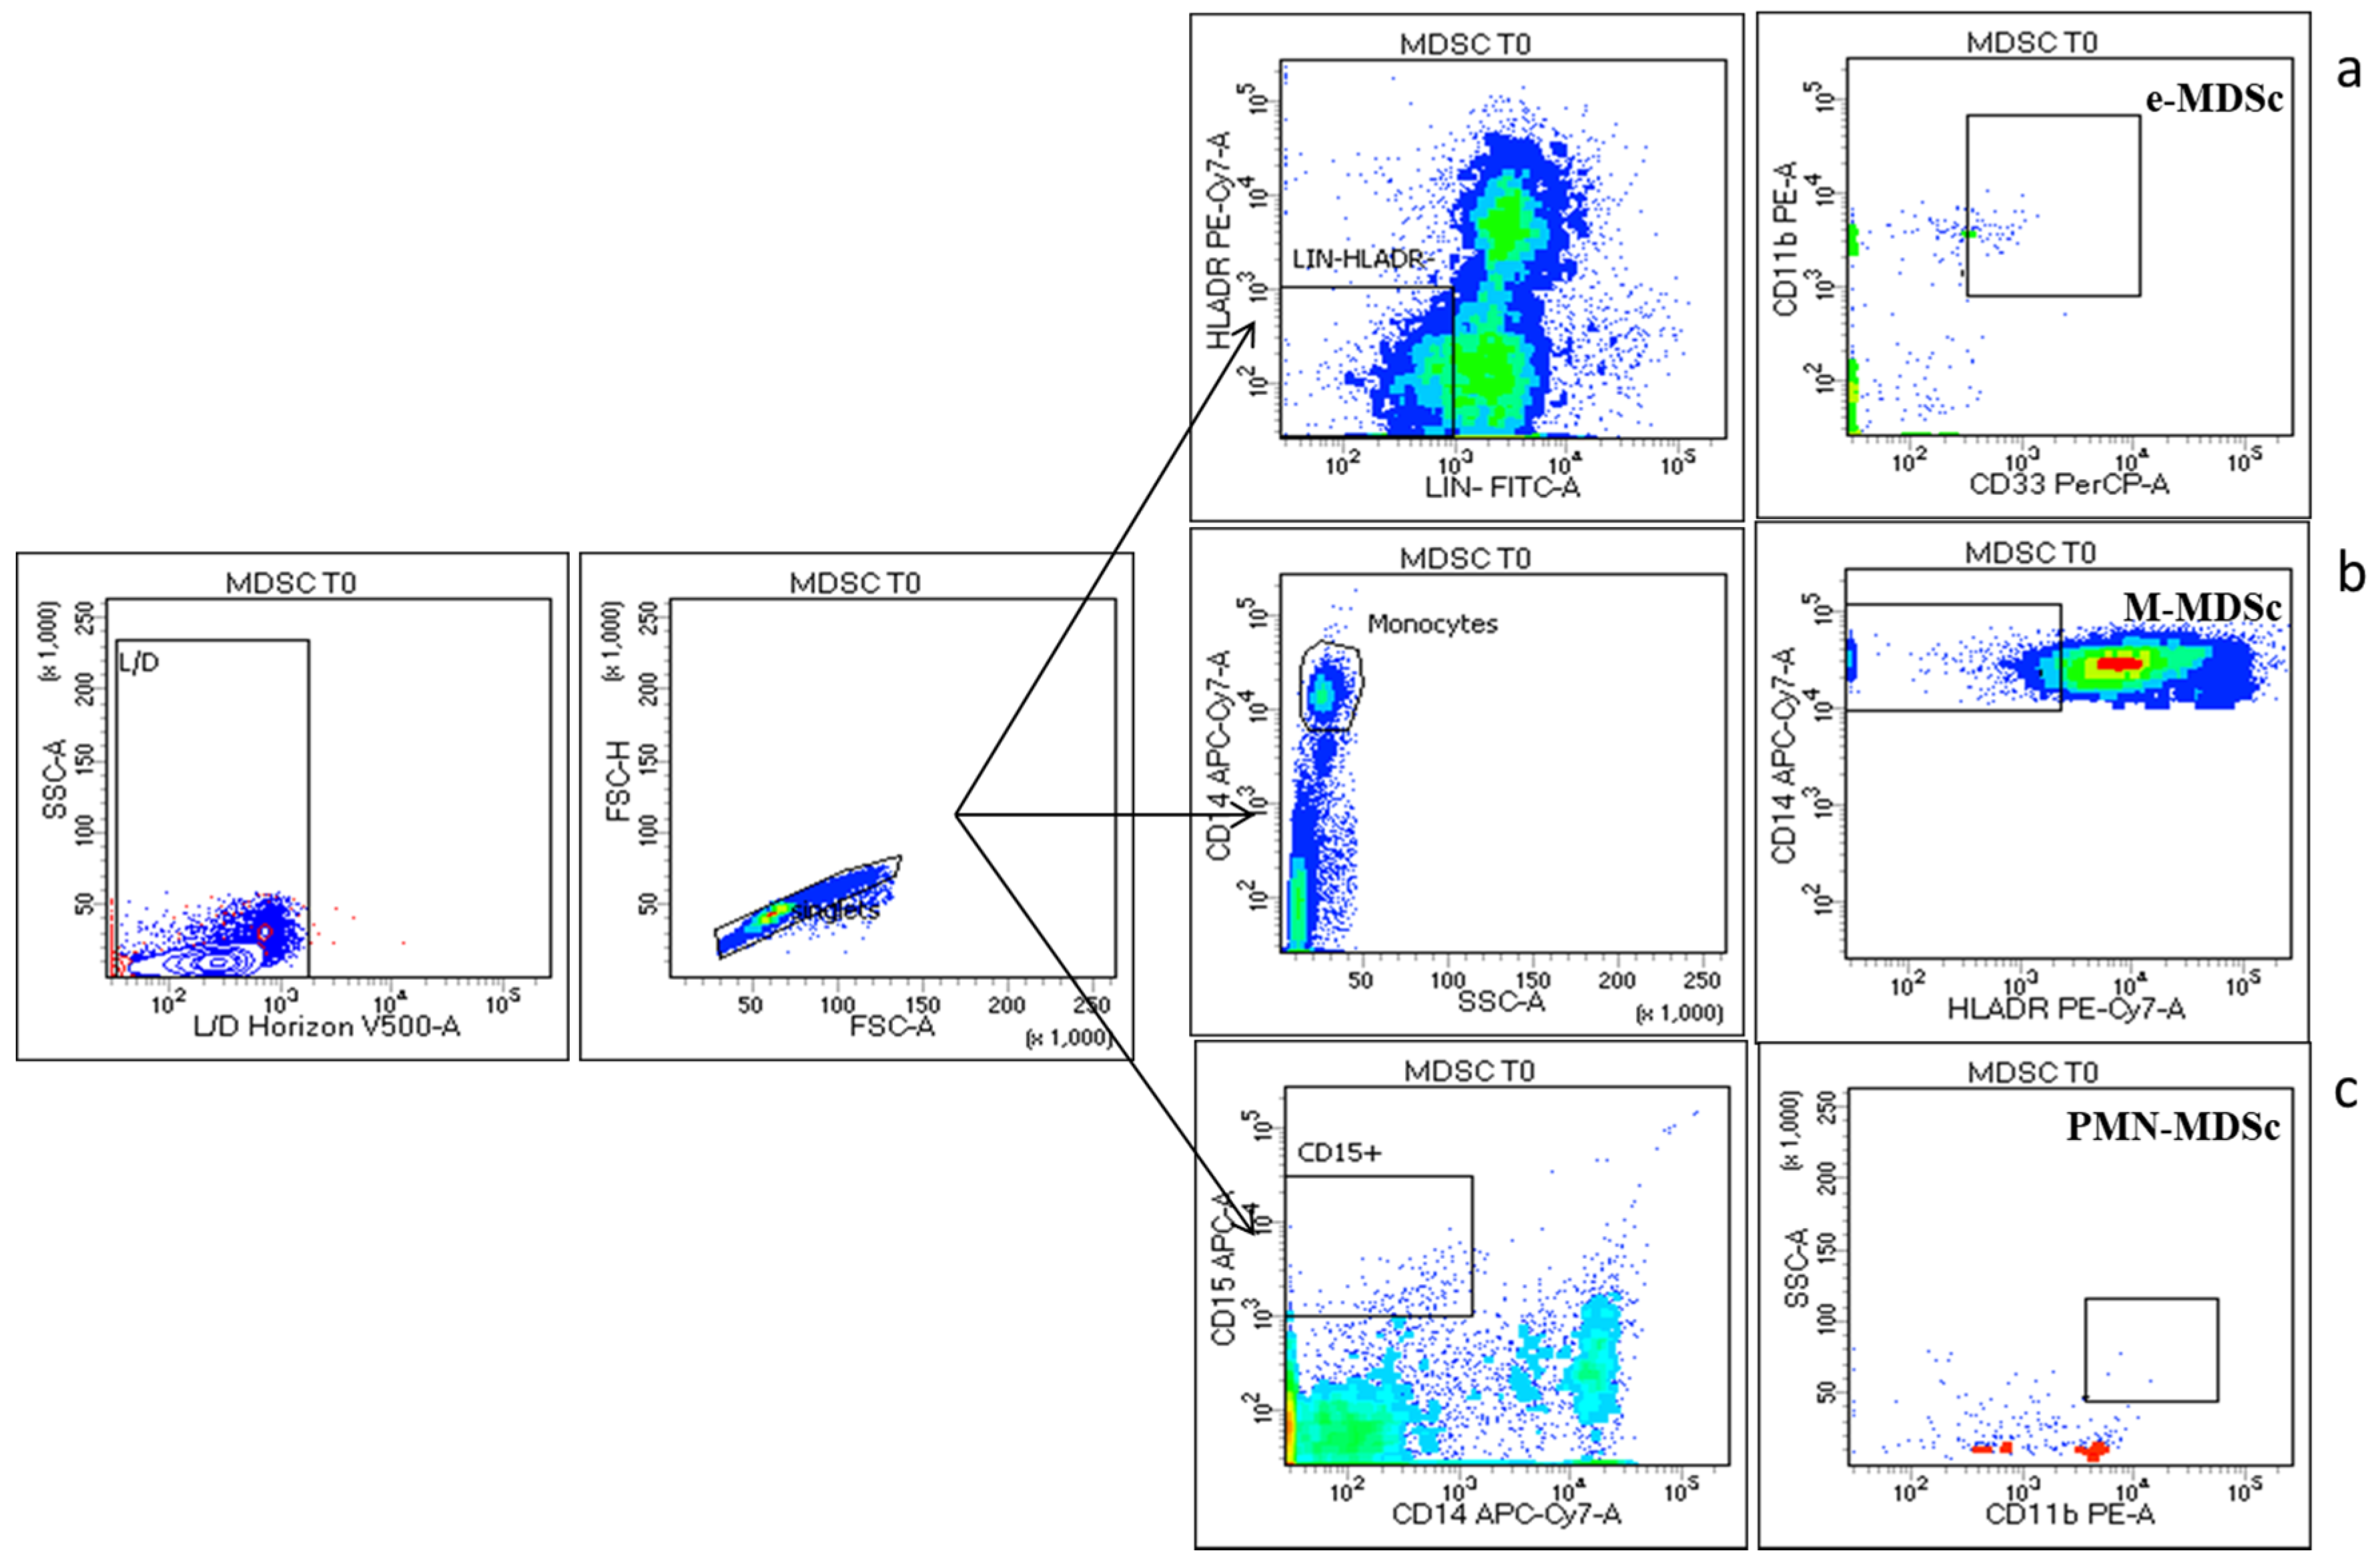
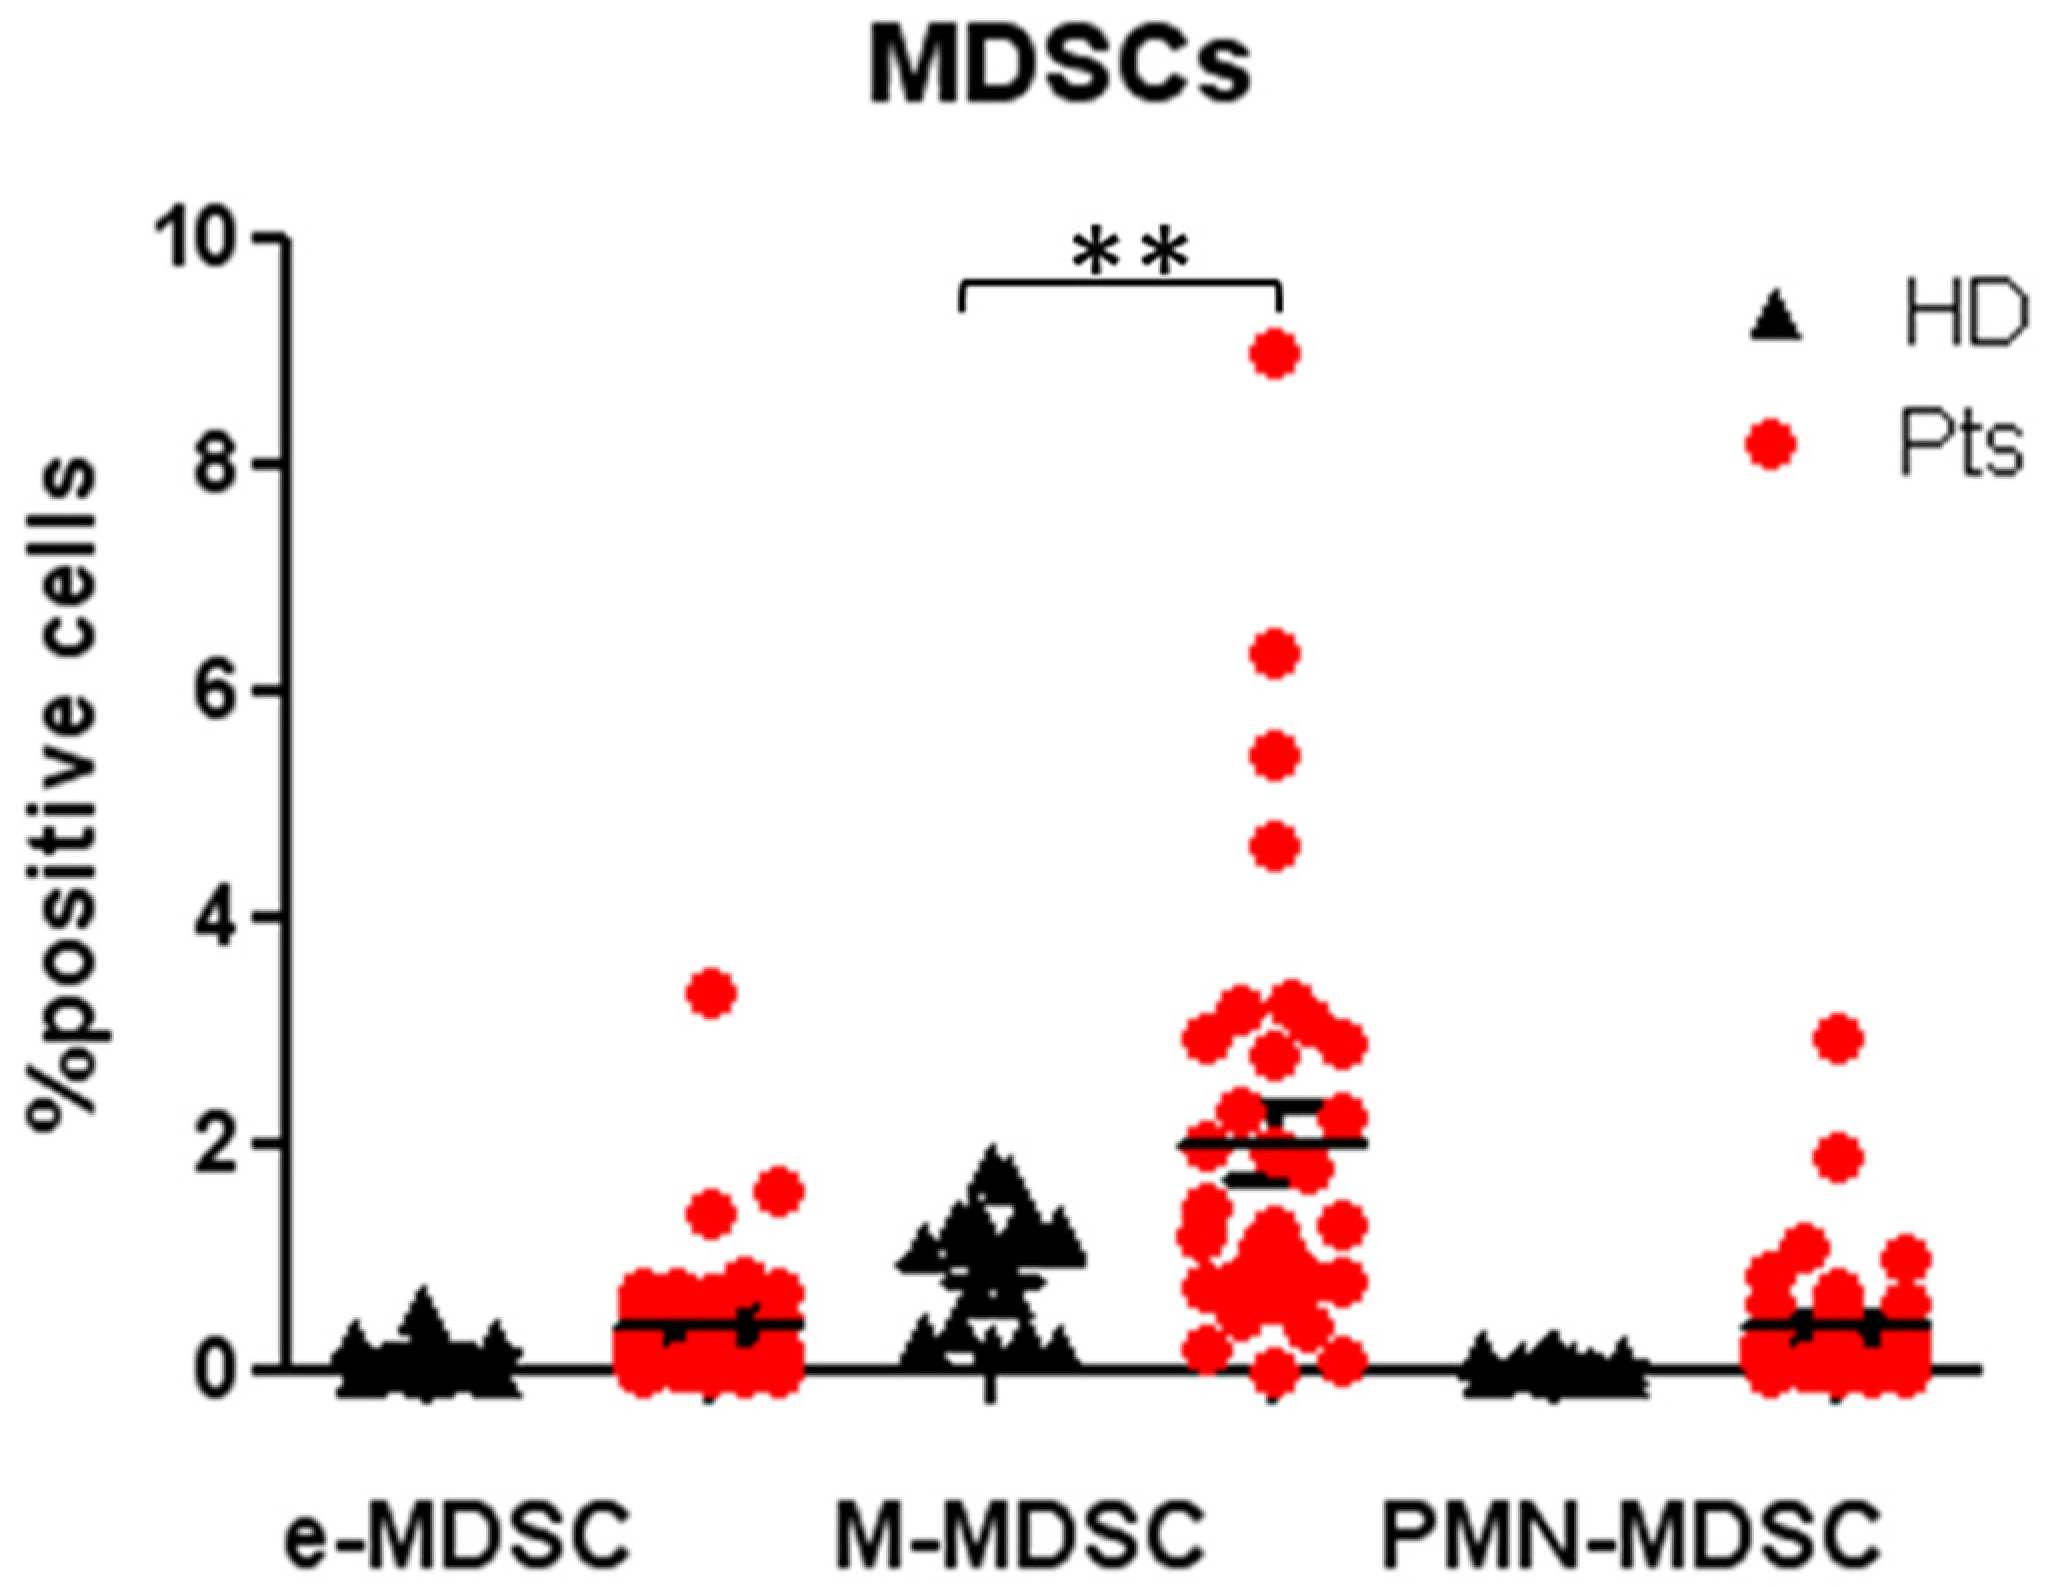
3.3. Peripheral MDSCs Subsets Evaluation
3.4. Clinico-Pathological Associations with Tregs and MDSCs Dynamics
4. Discussion
5. Conclusions
Author Contributions
Funding
Acknowledgments
Conflicts of Interest
References
- Oronsky, B.; Ma, P.C.; Morgensztern, D.; Carter, C.A. Nothing but NET: A Review of Neuroendocrine Tumors and Carcinomas. Neoplasia 2017, 19, 991–1002. [Google Scholar] [CrossRef]
- Dasari, A.; Shen, C.; Halperin, D.; Zhao, B.; Zhou, S.; Xu, Y.; Shih, T.; Yao, J.C. Trends in the Incidence, Prevalence, and Survival Outcomes in Patients with Neuroendocrine Tumors in the United States. JAMA Oncol. 2017, 3, 1335–1342. [Google Scholar] [CrossRef]
- Grozinsky-Glasberg, S.; Shimon, I.; Korbonits, M.; Grossman, A.B. Somatostatin analogues in the control of neuroendocrine tumours: Efficacy and mechanisms. Endocr. Relat. Cancer 2008, 15, 701–720. [Google Scholar] [CrossRef]
- Rinke, A.; Müller, H.H.; Schade-Brittinger, C.; Klose, K.J.; Barth, P.; Wied, M.; Mayer, C.; Aminossadati, B.; Pape, U.-F.; Bläker, M.; et al. Placebo-controlled, double-blind, prospective, randomized study on the effect of octreotide LAR in the control of tumor growth in patients with metastatic neuroendocrine midgut tumors: A report from the PROMID Study Group. J. Clin. Oncol. 2009, 27, 4656–4663. [Google Scholar] [CrossRef]
- Rinke, A.; Wittenberg, M.; Schade-Brittinger, C.; Aminossadati, B.; Ronicke, E.; Gress, T.M.; Müller, H.-H.; Arnold, R.; PROMID Study Group. Placebo-Controlled, Double-Blind, Prospective, Randomized Study on the Effect of Octreotide LAR in the Control of Tumor Growth in Patients with Metastatic Neuroendocrine Midgut Tumors (PROMID): Results of Long-Term Survival. Neuroendocrinology 2017, 104, 26–32. [Google Scholar] [CrossRef]
- Strosberg, J.; El-Haddad, G.; Wolin, E.; Hendifar, A.; Yao, J.; Chasen, B.; Mittra, E.; Kunz, P.L.; Kulke, M.H.; Jacene, H.; et al. Phase 3 trial of 177lu-dotatate for midgut neuroendocrine tumors. N. Engl. J. Med. 2017, 376, 125–135. [Google Scholar] [CrossRef]
- Ferone, D.; Boschetti, M.; Resmini, E.; Giusti, M.; Albanese, V.; Goglia, U.; Albertelli, M.; Vera, L.; Bianchi, F.; Minuto, F. Neuroendocrine-immune interactions: The role of cortistatin/somatostatin system. Ann. N. Y. Acad. Sci. 2006, 1069, 129–144. [Google Scholar] [CrossRef] [PubMed]
- Ferone, D.; Van Hagen, P.M.; Semino, C.; A Dalm, V.; Barreca, A.; Colao, A.; Lamberts, S.W.J.; Minuto, F.; Hofland, L.J. Somatostatin receptor distribution and function in immune system. Dig. Liver Dis. 2004, 36 (Suppl. 1), S68–S77. [Google Scholar] [CrossRef] [PubMed]
- Taniyama, Y.; Suzuki, T.; Mikami, Y.; Moriya, T.; Satomi, S.; Sasano, H. Systemic distribution of somatostatin receptor subtypes in human: An immunohistochemical study. Endocr. J. 2005, 52, 605–611. [Google Scholar] [CrossRef] [PubMed]
- Wang, X.P.; Norman, M.A.; Brunicardi, F.C. Somatostatin receptors and autoimmune-mediated diabetes. Diabetes Metab. Res. Rev. 2005, 21, 15–30. [Google Scholar] [CrossRef] [PubMed]
- Pasquali, D.; Notaro, A.; Bonavolontà, G.; Vassallo, P.; Bellastella, A.; Sinisi, A.A. Somatostatin receptor genes are expressed in lymphocytes from retroorbital tissues in Graves’ disease. J. Clin. Endocrinol. Metab. 2002, 87, 5125–5129. [Google Scholar] [CrossRef] [PubMed][Green Version]
- Talme, T.; Ivanoff, J.; Hägglund, M.; Van Neerven, R.J.; Ivanoff, A.; Sundqvist, K.G. Somatostatin receptor (SSTR) expression and function in normal and leukaemic T-cells. Evidence for selective effects on adhesion to extracellular matrix components via SSTR2 and/or 3. Clin. Exp. Immunol. 2001, 125, 71–79. [Google Scholar] [CrossRef] [PubMed]
- Dyck, L.; Mills, K.H.G. Immune checkpoints and their inhibition in cancer and infectious diseases. Eur. J. Immunol. 2017, 47, 765–779. [Google Scholar] [CrossRef]
- Piccirillo, C.A.; Shevach, E.M. Naturally occurring CD4+CD25+ immunoregulatory T cells: Central players in the arena of peripheral tolerance. Semin. Immunol. 2004, 16, 81–88. [Google Scholar] [CrossRef] [PubMed]
- Gabrilovich, D.I. Myeloid-Derived Suppressor Cells. Cancer Immunol. Res. 2017, 5, 3–8. [Google Scholar] [CrossRef]
- Huang, B.; Pan, P.-Y.; Li, Q.; Sato, A.I.; Levy, D.E.; Bromberg, J.; Divino, C.M.; Chen, S.-H. Gr-11CD1151 immature myeloid suppressor cells mediate the development of tumor induced T regulatory cells and T-cell energy in tumor-bearing host. Cancer Res. 2006, 66, 1123–1131. [Google Scholar] [CrossRef]
- Marvel, D.; Gabrilovich, D.I. Myeloid-derived suppressor cells in the tumor microenvironment: Expect the unexpected. J. Clin. Investig. 2015, 125, 3356–3364. [Google Scholar] [CrossRef]
- Gabrilovich, D.I.; Ostrand-Rosenberg, S.; Bronte, V. Coordinated regulation of myeloid cells by tumours. Nat. Rev. Immunol. 2012, 12, 253–268. [Google Scholar] [CrossRef]
- Lindau, D.; Gielen, P.; Kroesen, M.; Wesseling, P.; Adema, G.J. The immunosuppressive tumour network: Myeloid-derived suppressor cells, regulatory T cells and natural killer T cells. Immunology 2013, 138, 105–115. [Google Scholar] [CrossRef]
- Sakaguchi, S.; Sakaguchi, N.; Asano, M.; Itoh, M.; Toda, M. Immunologic self-tolerance maintained by activated T cells expressing IL-2 receptor alpha-chains (CD25). Breakdown of a single mechanism of self-tolerance causes various autoimmune diseases. J. Immunol. 1995, 155, 1151–1164. [Google Scholar]
- Sakaguchi, S.; Miyara, M.; Costantino, C.M.; Hafler, D.A. FOXP3+ regulatory T cells in the human immune system. Nat. Rev. Immunol. 2010, 10, 490–500. [Google Scholar] [CrossRef] [PubMed]
- Sakaguchi, S.; Yamaguchi, T.; Nomura, T.; Ono, M. Regulatory T cells and immune tolerance. Cell 2008, 133, 775–787. [Google Scholar] [CrossRef] [PubMed]
- Miyara, M.; Sakaguchi, S. Natural regulatory T cells: Mechanisms of suppression. Trends Mol. Med. 2007, 13, 108–116. [Google Scholar] [CrossRef] [PubMed]
- Hori, S.; Nomura, T.; Sakaguchi, S. Control of regulatory T cell development by the transcription factor Foxp3. Science 2003, 299, 1057–1061. [Google Scholar] [CrossRef]
- Santegoets, S.J.A.M.; Dijkgraaf, E.M.; Battaglia, A.; Beckhove, P.; Britten, C.M.; Gallimore, A.; Godkin, A.J.; Gouttefangeas, C.; De Gruijl, T.D.; Koenen, H.J.P.M.; et al. Monitoring regulatory T cells in clinical samples: Consensus on an essential marker set and gating strategy for regulatory T cell analysis by flow cytometry. Cancer Immunol. Immunother. 2015, 64, 1271–1286. [Google Scholar] [CrossRef]
- Raimondi, G.; Shufesky, W.J.; Tokita, D.; Morelli, A.E.; Thomson, A.W. Regulated compartmentalization of programmed cell death-1 discriminates CD4+CD25+ resting regulatory T cells from activated T cells. J. Immunol. 2006, 176, 2808–2816. [Google Scholar] [CrossRef]
- Togashi, Y.; Shitara, K.; Nishikawa, H. Regulatory T cells in cancer immunosuppression-implications for anticancer therapy. Nature 2019, 16, 356–371. [Google Scholar] [CrossRef]
- Ostrand-Rosenberg, S.; Sinha, P. Myeloid-derived suppressor cells: Linking inflammation and cancer. J. Immunol. 2009, 182, 4499–4506. [Google Scholar] [CrossRef]
- Bronte, V.; Brandau, S.; Chen, S.-H.; Colombo, M.P.; Frey, A.B.; Greten, T.F.; Mandruzzato, S.; Murray, P.J.; Ochoa, A.; Ostrand-Rosenberg, S.; et al. Recommendations for myeloid-derived suppressor cell nomenclature and characterization standards. Nat. Commun. 2016, 7, 12150. [Google Scholar] [CrossRef]
- Napolitano, M.; D’Alterio, C.; Cardone, E.; Trotta, A.; Pecori, B.; Rega, D.; Pace, U.; Scala, D.; Scognamiglio, G.; Tatangelo, F.; et al. Peripheral myeloid-derived suppressor and T regulatory PD-1 positive cells predict response to neoadjuvant short-course radiotherapy in rectal cancer patients. Oncotarget 2015, 6, 8261–8270. [Google Scholar] [CrossRef]
- Curiel, T.J.; Coukos, G.; Zou, L.; Alvarez, X.; Cheng, P.; Mottram, P.; Evdemon-Hogan, M.; Conejo-Garcia, J.R.; Zhang, L.; Burow, M.; et al. Specific recruitment of regulatory T cells in ovarian carcinoma fosters immune privilege and predicts reduced survival. Nat. Med. 2004, 10, 942–949. [Google Scholar] [CrossRef] [PubMed]
- Petersen, R.P.; Carpa, M.J.; Sperlazza, J.; Conlon, D.; Joshi, M.B.; Harpole, D.H., Jr.; Patz, E.F. Tumor infiltrating Foxp3+ regulatory T-cells are associated with recurrence in pathologic stage I NSCLC patients. Cancer 2006, 107, 2866–2872. [Google Scholar] [CrossRef] [PubMed]
- Bates, G.J.; Fox, S.; Han, C.; Leek, R.D.; Garcia, J.F.; Harris, A.L.; Banham, A.H. Quantification of regulatory T cells enables the identification of high-risk breast cancer patients and those at risk of late relapse. J. Clin. Oncol. 2006, 24, 5373–5380. [Google Scholar] [CrossRef] [PubMed]
- Kobayashi, N.; Hiraoka, N.; Yamagami, W.; Ojima, H.; Kanai, Y.; Kosuge, T.; Nakajima, A.; Hirohashi, S. FOXP3+ regulatory T cells affect the development and progression of hepatocarcinogenesis. Clin. Cancer Res. 2007, 13, 902–911. [Google Scholar] [CrossRef] [PubMed]
- Vikman, S.; Sommaggio, R.; De La Torre, M.; Öberg, K.; Essand, M.; Giandomenico, V.; Loskog, A.; Totterman, T.H. Midgut carcinoid patients display increased numbers of regulatory T cells in peripheral blood with infiltration into tumor tissue. Acta Oncol. 2009, 48, 391–400. [Google Scholar] [CrossRef] [PubMed]
- Gambichler, T.; Schröter, U.; Höxtermann, S.; Susok, L.; Stockfleth, E.; Becker, J.C. Decline of programmed death-1-positive circulating T regulatory cells predicts more favourable clinical outcome of patients with melanoma under immune checkpoint blockade. Br. J. Dermatol. 2020, 182, 1214–1220. [Google Scholar] [CrossRef]
- Sánchez-Margalet, V.; Barco-Sánchez, A.; Vilariño-García, T.; Jiménez-Cortegana, C.; Pérez-Pérez, A.; Henao-Carrasco, F.; Virizuela-Echaburu, J.A.; Nogales-Fernández, E.; Álamo-de la Gala, M.C.; Lobo-Acosta, M.A.; et al. Circulating regulatory T cells from breast cancer patients in response to neoadjuvant chemotherapy. Transl. Cancer Res. 2019, 8, 59–65. [Google Scholar] [CrossRef]
- Liu, C.; Cheng, H.; Luo, G.; Lu, Y.; Jin, K.; Guo, M.; Ni, Q.; Yu, X.-J. Circulating regulatory T cell subsets predict overall survival of patients with unresectable pancreatic cancer. Int. J. Oncol. 2017, 51, 686–694. [Google Scholar] [CrossRef]
- Francisco, L.M.; Salinas, V.H.; Brown, K.E.; Vanguri, V.K.; Freeman, G.J.; Kuchroo, V.K.; Sharpe, A.H. PD-L1 regulates the development, maintenance, and function of induced regulatory T cells. J. Exp. Med. 2009, 206, 3015–3029. [Google Scholar] [CrossRef]
- Deaglio, S.; Dwyer, K.M.; Gao, W.; Friedman, D.; Usheva, A.; Erat, A.; Chen, J.-F.; Enjyoji, K.; Linden, J.; Oukka, M.; et al. Adenosine generation catalyzed by CD39 and CD73 expressed on regulatory T cells mediates immune suppression. J. Exp. Med. 2007, 204, 1257–1265. [Google Scholar] [CrossRef]
- Huang, S.; Apasov, S.; Koshiba, M.; Sitkovsky, M. Role of A2a extracellular adenosine receptor-mediated signaling in adenosine-mediated inhibition of T-cell activation and expansion. Blood 1997, 90, 1600–1610. [Google Scholar] [CrossRef] [PubMed]
- Lokshin, A.; Raskovalova, T.; Huang, X.; Zacharia, L.C.; Jackson, E.K.; Gorelik, E. Adenosine-mediated inhibition of the cytotoxic activity and cytokine production by activated natural killer cells. Cancer Res. 2006, 66, 7758–7765. [Google Scholar] [CrossRef] [PubMed]
- Novitskiy, S.V.; Ryzhov, S.; Zaynagetdinov, R.; Goldstein, A.E.; Huang, Y.; Tikhomirov, O.Y.; Blackburn, M.R.; Biaggioni, I.; Carbone, D.P.; Feoktistov, I.; et al. Adenosine receptors in regulation of dendritic cell differen-tiation and function. Blood 2008, 112, 1822–1831. [Google Scholar] [CrossRef] [PubMed]
- Elliott, M.R.; Chekeni, F.B.; Trampont, P.C.; Lazarowski, E.R.; Kadl, A.; Walk, S.F.; Park, D.; Woodson, R.I.; Ostankovitch, M.; Sharma, P.; et al. Nucleotides released by apoptotic cells act as a find-me signal to promote phagocytic clearance. Nature 2009, 461, 282–286. [Google Scholar] [CrossRef] [PubMed]
- Sun, X.; Wu, Y.; Gao, W.; Enjyoji, K.; Csizmadia, E.; Muller, C.E.; Murakami, T.; Robsonet, S.C. CD39/ENTPD1 expression by CD4+Foxp3+ regulatory T cells promotes hepatic metastatic tumor growth in mice. Gastroenterology 2010, 139, 1030–1040. [Google Scholar] [CrossRef]
- Ameri, P.; Ferone, D. Diffuse endocrine system, neuroendocrine tumors and immunity: What’s new? Neuroendocrinol 2012, 95, 267–276. [Google Scholar] [CrossRef]
- Levite, M.; Cahalon, L.; Hershkoviz, R.; Steinman, L.; Lider, O. Neuropeptides, via specific receptors, regulate T cell adhesion to fibronectin. J. Immunol. 1998, 160, 993–1000. [Google Scholar]
- Beckner, S.K.; Farrar, W.L. Potentiation of lymphokine-activated killer cell differentiation and lymphocyte proliferation by stimulation of protein kinase C or inhibition of adenylate cyclase. J. Immunol. 1988, 140, 208–214. [Google Scholar]
- Levite, M. Neuropeptides, by direct interaction with T cells, induce cytokine secretion and break the commitment to a distinct T helper phenotype. Proc. Natl. Acad. Sci. USA 1998, 95, 12544–12549. [Google Scholar] [CrossRef]
- Ferrata, M.; Schad, A.; Zimmer, S.; Musholt, T.J.; Bahr, K.; Kuenzel, J.; Becker, S.; Springer, E.; Roth, W.; Weber, M.M.; et al. PD-L1 Expression and Immune Cell Infiltration in Gastroenteropancreatic (GEP) and Non-GEP Neuroendocrine Neoplasms with High Proliferative Activity. Front. Oncol. 2019, 9, 343. [Google Scholar] [CrossRef]
- Sampedro-Núñez, M.; Serrano-Somavilla, A.; Adrados, M.; Cameselle-Teijeiro, J.M.; Blanco-Carrera, C.; Cabezas-Agricola, J.M.; Martinez-Hernandez, R.; Martín-Pérez, E.; de Nova, J.L.M.; Díaz, J.Á.; et al. Analysis of expression of the PD-1/PD-L1 immune checkpoint system and its prognostic impact in gastroenteropancreatic neuroendocrine tumors. Sci. Rep. 2018, 8, 17812. [Google Scholar] [CrossRef]


| Characteristics | n (%) | Tregs Reduction from T0 to T6M, Median [IQR] | p |
|---|---|---|---|
| Age (Years) | |||
| Median | 59 | ||
| Range | 33–81 | ||
| Sex | |||
| Male | 18 (51) | 0.78 [0.48–1.23] | 0.45 |
| Female | 17 (49) | 0.59 [0.29–0.78] | |
| Primary tumour site | |||
| Lung | 7 (20) | 0.58 [0.48–1.09] | 0.84 |
| GEP | 28 (80) | 0.62 [0.41–1.22] | |
| Stomach | 11 (31) | ||
| Pancreas | 8 (23) | ||
| Ileus | 5 (14) | ||
| Rectum | 3 (9) | ||
| Mesenteric Nodes | 1 (3) | ||
| Functional Status | |||
| Functioning | 13 (37) | 0.65 [0.49–1.30] | 0.61 |
| Non-Functioning | 22 (63) | 0.58 [0.40–1.17] | |
| Metastatic Sites | |||
| Liver | 23 (66) | 0.65 [0.4–1.03] | 0.91 |
| Others | 12 (34) | 0.56 [0.31–1.38] | |
| Metastatic sites n. | |||
| 1 | 25 (71) | 1.08 [0.28–1.5] | 0.91 |
| >1 | 10 (29) | 0.6 [0.42–0.85] | |
| NET Grade | |||
| G1 | 25 (71) | 0.66 [0.42–1.23] | 0.64 |
| G2 | 10 (29) | 0.58 [0.29–0.78] |
© 2020 by the authors. Licensee MDPI, Basel, Switzerland. This article is an open access article distributed under the terms and conditions of the Creative Commons Attribution (CC BY) license (http://creativecommons.org/licenses/by/4.0/).
Share and Cite
von Arx, C.; Rea, G.; Napolitano, M.; Ottaiano, A.; Tatangelo, F.; Izzo, F.; Petrillo, A.; Clemente, O.; Di Sarno, A.; Botti, G.; et al. Effect of Octreotide Long-Acting Release on Tregs and MDSC Cells in Neuroendocrine Tumour Patients: A Pivotal Prospective Study. Cancers 2020, 12, 2422. https://doi.org/10.3390/cancers12092422
von Arx C, Rea G, Napolitano M, Ottaiano A, Tatangelo F, Izzo F, Petrillo A, Clemente O, Di Sarno A, Botti G, et al. Effect of Octreotide Long-Acting Release on Tregs and MDSC Cells in Neuroendocrine Tumour Patients: A Pivotal Prospective Study. Cancers. 2020; 12(9):2422. https://doi.org/10.3390/cancers12092422
Chicago/Turabian Stylevon Arx, Claudia, Giuseppina Rea, Maria Napolitano, Alessandro Ottaiano, Fabiana Tatangelo, Francesco Izzo, Antonella Petrillo, Ottavia Clemente, Antonella Di Sarno, Gerardo Botti, and et al. 2020. "Effect of Octreotide Long-Acting Release on Tregs and MDSC Cells in Neuroendocrine Tumour Patients: A Pivotal Prospective Study" Cancers 12, no. 9: 2422. https://doi.org/10.3390/cancers12092422
APA Stylevon Arx, C., Rea, G., Napolitano, M., Ottaiano, A., Tatangelo, F., Izzo, F., Petrillo, A., Clemente, O., Di Sarno, A., Botti, G., Scala, S., & Tafuto, S., on behalf of the ENETs Center of Excellence of Naples, Italy. (2020). Effect of Octreotide Long-Acting Release on Tregs and MDSC Cells in Neuroendocrine Tumour Patients: A Pivotal Prospective Study. Cancers, 12(9), 2422. https://doi.org/10.3390/cancers12092422