Abstract
Unselected population-based personalised ovarian cancer (OC) risk assessment combining genetic/epidemiology/hormonal data has not previously been undertaken. We aimed to perform a feasibility study of OC risk stratification of general population women using a personalised OC risk tool followed by risk management. Volunteers were recruited through London primary care networks. Inclusion criteria: women ≥18 years. Exclusion criteria: prior ovarian/tubal/peritoneal cancer, previous genetic testing for OC genes. Participants accessed an online/web-based decision aid along with optional telephone helpline use. Consenting individuals completed risk assessment and underwent genetic testing (BRCA1/BRCA2/RAD51C/RAD51D/BRIP1, OC susceptibility single-nucleotide polymorphisms). A validated OC risk prediction algorithm provided a personalised OC risk estimate using genetic/lifestyle/hormonal OC risk factors. Population genetic testing (PGT)/OC risk stratification uptake/acceptability, satisfaction, decision aid/telephone helpline use, psychological health and quality of life were assessed using validated/customised questionnaires over six months. Linear-mixed models/contrast tests analysed impact on study outcomes. Main outcomes: feasibility/acceptability, uptake, decision aid/telephone helpline use, satisfaction/regret, and impact on psychological health/quality of life. In total, 123 volunteers (mean age = 48.5 (SD = 15.4) years) used the decision aid, 105 (85%) consented. None fulfilled NHS genetic testing clinical criteria. OC risk stratification revealed 1/103 at ≥10% (high), 0/103 at ≥5%–<10% (intermediate), and 100/103 at <5% (low) lifetime OC risk. Decision aid satisfaction was 92.2%. The telephone helpline use rate was 13% and the questionnaire response rate at six months was 75%. Contrast tests indicated that overall depression (p = 0.30), anxiety (p = 0.10), quality-of-life (p = 0.99), and distress (p = 0.25) levels did not jointly change, while OC worry (p = 0.021) and general cancer risk perception (p = 0.015) decreased over six months. In total, 85.5–98.7% were satisfied with their decision. Findings suggest population-based personalised OC risk stratification is feasible and acceptable, has high satisfaction, reduces cancer worry/risk perception, and does not negatively impact psychological health/quality of life.
Keywords:
population genetic testing; ovarian cancer risk; risk stratification; BRCA1; BRCA2; RAD51C; RAD51D; BRIP1; SNP; risk modelling 1. Introduction
BRCA1/BRCA2 pathogenic variants have a 17–44% ovarian cancer (OC) risk until age 80 years [1]. Testing for OC susceptibility genes (CSGs)—RAD51C (lifetime OC risk = 11%) [2], RAD51D (lifetime OC risk = 13%) [2] and BRIP1 (lifetime OC risk = 5.8%) [3]—is now part of clinical practice. Genome-wide association studies (GWAS) have discovered ~30 validated single-nucleotide polymorphisms (SNPs) which modify OC risk [4,5]. Newer risk prediction models incorporating validated SNPs as a polygenic risk score with epidemiologic/family history(FH)/hormonal data and moderate–high-penetrance CSGs can be used to predict lifetime OC risk, improving the precision of risk estimation and allowing population division into risk strata, enabling targeted downstream risk-stratified prevention/screening for those at increased risk [4,6].
The current practice of identifying high-risk women uses clinical criteria/FH-based testing for CSGs, misses >50% CSG carriers who do not fulfil genetic testing criteria and requires people to get cancer before identifying unaffected family members who can benefit from prevention [7,8,9,10]. Given the effective cancer risk management/prevention options available, the adequacy of current practice, representing massive missed opportunities for risk-stratified prevention, is questionable. Unselected population genetic testing (PGT) overcomes these limitations and identifies many more individuals at increased OC risk. PGT can be cost effective and prevent thousands of more OC/BC cases than clinical criteria/FH-based genetic testing [11].
Most PGT evidence comes from UK/Israeli/Canadian studies in Ashkenazi Jewish (AJ) populations [9,10,12]. These show that AJ population-based BRCA testing is acceptable, feasible, can be community based, doubles the BRCA pathogenic variant individuals identified, does not harm psychological health/quality of life (QoL), reduces long-term anxiety, has high satisfaction rates (90–95%) [9,10,13], and is extremely cost effective (potentially cost saving) for the UK/US health systems [14]. However, prospective/unbiased PGT data and model-based OC risk stratification for a general (non-Jewish) low-risk population are lacking.
We describe results from a feasibility study in order to stratify a general population using predicted lifetime OC risk and offer risk management options of screening and prevention, within the Predicting Risk of Ovarian Malignancy Improved Screening and Early detection programme (PROMISE-FS, ISRCTN54246466). This article reports on (1) the acceptability, feasibility, and uptake of PGT/OC risk stratification; (2) perceived risks/limitations; (3) decision aid (DA)/telephone helpline use; (4) satisfaction; (5) cancer worry/risk perception; (6) impact on psychological health/QoL.
2. Results
Between June 2017 and August 2017, 218 women registered and 123 viewed the online DA. In total, 105/123 (85%) DA users consented to genetic testing/risk assessment, and two withdrew. In total, 103 were eligible for analysis (Figure 1). In total, 2/103 were excluded from RPA assessment (Figure 1). Women who chose not to participate declined providing information on factors affecting decision making. The follow-up questionnaire response rate was 94%, 84%, and 75% at seven days, three months and six months post results, respectively.
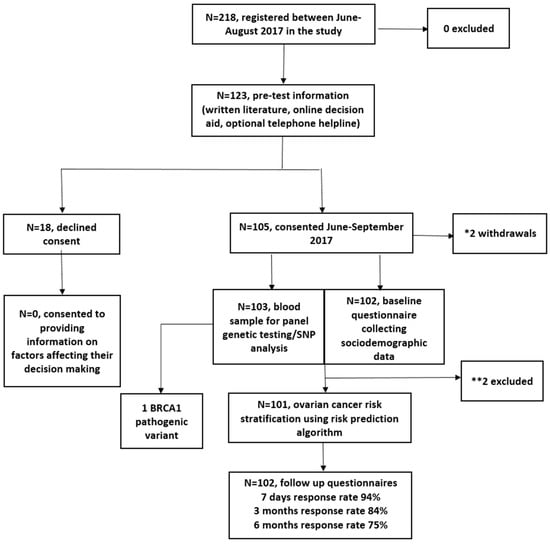
Figure 1.
Study flow chart. * Reasons for withdrawal: miscarriage (n = 1) and inability to use public transport to attend an outpatient blood test appointment for genetic testing (n = 1). ** Reasons for exclusion: one participant was excluded because she entered this study at age 84 and the model predicts risks to age 80; the second participant did not provide the baseline demographic information required to run the algorithm.
Table 1 summarises cohort baseline characteristics. The mean age of participants was 48.5 (SD = 15.4; range = 18–85) years; 44.6% (n = 45) had university level education; 55.7% (n = 54) had a household income >£40,000; 74.5% (n = 76) were Caucasian; 7% (n = 7) were smokers; 64% (n = 63) ate >5 portions of fruit/vegetables daily; 78% (n = 80) were physically active over the last month. None had a clinically significant FH of cancer (fulfilling NHS genetic testing criteria). RPA revealed 1/103 at ≥10%, 0/103 at ≥5%–<10% and 100/103 at <5% lifetime OC risk. As expected using the algorithm, the epidemiological risk factors alone provide a greater level of OC risk stratification among the participants compared to the polygenic risk score (PRS) alone (Figure S1). However, risk stratification is further improved when the full model incorporating both epidemiological risk factors and PRS is considered. One high-risk participant, aged 35 years, had a lifetime OC risk of 42%. She had a pathogenic duplication of exon-13 in BRCA1. History included one second-degree relative with OC—parity = 1, 10 years oral contraceptive pill (OCP) use, endometriosis, BMI = 30.4, and no tubal ligation/hormone-replacement therapy (HRT) use. Following results, the participant opted for Risk of Ovarian Cancer Algorithm (ROCA)-based screening (24) within a research study (ALDO, https://www.uclh.nhs.uk/OurServices/ServiceA-Z/Cancer/NCV/Pages/TheALDOproject.aspx) and for risk-reducing early salpingectomy within a clinical trial (PROTECTOR, ISRCTN25173360, http://www.protector.org.uk/). She underwent MRI screening for BC risk. Four Class-3 variants of uncertain significance (VUS) were detected (BRCA1:c.3328_3330delAAG, c.2998_3003del; BRCA2:c.1438T>G; RAD51D:c.482T>C).

Table 1.
Baseline characteristics of cohort.
Key perceived benefits/risks of PGT/OC risk assessment are shown in Table S1. Need for reassurance, reduction in uncertainty, enhancing cancer prevention, benefiting research, knowledge about enhanced screening/prevention and children’s risks were rated somewhat/very important by ~70–98% women. Important risks/limitations of PGT/OC risk assessment rated somewhat/very important included concern about effect on family (56.4%) and being unable to handle it emotionally (38.6%). A minority felt stigmatization (9%) or targeting of an ethnic group (11%) was a somewhat/very important risk. Insurance and confidentiality were highlighted as somewhat/very important by 28% and 24.7% respectively.
Participant responses to the ten DA items are shown in Table S2. The mean number of times DA was viewed was non-significantly higher in consenters versus decliners (1.61 vs. 1.05; p = 0.06). The mean DA score was not significantly different between consenters and decliners (8.1 vs. 7.4; p = 0.14). Consenters were older than decliners (48.5 vs. 40, p = 0.016). The mean age of volunteers who registered but did not view the DA was 45.5 years and not significantly different from consenters (p = 0.16) or decliners (p = 0.24). There was no statistically significant difference in 9/10 DA item responses between consenters and decliners. (Table S2). In total, 88.3% of consenters versus 75% of decliners (p = 0.036) would regret not participating if they developed OC in the future. In total, 23/123 viewed the DA on multiple occasions, and DA scores increased on repeat attempts (Tables S3 and S4). For 122/123 participants, there was concordance between participant decision making and DA outcome category. One participant (85 years, Caucasian, no OC-FH) consented to PGT/OC risk stratification despite DA advice to the contrary (DA score = −1). Table 2 summarises responses to the DA evaluation questionnaire. In total, 92.2% (94/102) were very satisfied/satisfied and 82.2% (83/101) would recommend the DA. The amount of information provided, length of time taken to view and level of detail available was deemed just right by 98% (100/102), 97.1% (99/102), and 97% (98/101), respectively. No part of the DA needed omitting.
Table 2.
Decision aid evaluation questionnaire responses.
In total, 13% (13/103) of consenters used the optional telephone helpline (Table 3), and 8/13 filled in an evaluation questionnaire. No decliner used the telephone helpline. The mean number of calls to the telephone helpline was 1.38 (SD = 1.12; range = 1–5). In total, 12.5% (1/8) used the telephone helpline to aid decision making and 75% (6/8) had study specific queries—of which, DA technical assistance queries (4/8) were the most common. All helpline users were very satisfied/satisfied with their experience and 75% (6/8) would recommend the helpline. In total, 37.5% (3/8) felt that the helpline aided decision making. There was no difference in baseline characteristics between helpline users and non-users. When comparing how much the DA improved understanding of OC/gene testing/advantages and disadvantages of discovering personalised OC risk or DA satisfaction, there was no statistically significant difference between helpline users/non-users. Helpline users had a significantly greater degree of worry (2/13 vs. 0/89; p = 0.02) and upset (1/13 vs. 0/89; p = 0.003) when viewing the DA in comparison to non-users. Helpline users had a higher DA mean score than non-users (9.123 vs. 8.019; p = 0.032)
Table 3.
Telephone helpline evaluation questionnaire responses.
Mean Hospital Anxiety and Depression Scale (HADS)/EuroQol-5D-5L (EQ-5D-5L)/Impact of Events Scale (IES)/Cancer Risk Perception questionnaire (CRP)/Cancer Worry Scale questionnaire (CWS)/Decision Regret Satisfaction questionnaire (DRS) questionnaire scores at baseline and at seven days/three months/six months follow up are shown in Table 4.
Table 4.
Mean questionnaire scores at baseline and at seven days, three months and six months follow up.
Linear random-effects mixed-model outputs showing the association of covariates with different outcomes are shown in Table 5. There was a transient increase in HADS anxiety at seven days (p = 0.048), returning to baseline by three months (p = 0.318). Compared to baseline, there was a small increase in HADS depression scores at individual time points of 3 months (p = 0.027) and 6 months (p ≤ 0.001), while QoL scores were marginally lower at three (p = 0.025) and six months (p = 0.036). However, the absolute level of change from baseline in all these scores was extremely small (HADS depression = 2.92 to 3.55; HADS anxiety = 6.11 to 7.02; EQ-5D-5L = 0.86 to 0.84) and not clinically meaningful. Additionally, contrast tests evaluating whether overall mean values at seven days, three months and six months were jointly different from the baseline suggested that anxiety, depression and QoL at these time points were not jointly different from the baseline value for the cohort (Table 5). Distress scores decreased with time and were significantly lower at six months versus 7 days (p = 0.042). Compared to baseline, OC worry was significantly lower at 7 days (p ≤ 0.001), 3 months (p ≤ 0.001) and 6 months (p ≤ 0.001). Contrast tests evaluating the overall time effect showed a significant decrease in OC worry scores (p = 0.02) but not distress scores (p = 0.25) over time (Table 5). General cancer risk perception showed a decrease at 7 days (p = 0.012), returning to baseline by 6 months (p = 0.45).
Table 5.
Linear random-effects mixed models and overall contrast tests for study outcomes.
In total, 85.5% strongly agreed and 13.2% agreed that their decision to undergo PGT/OC risk stratification was the right decision and that they were satisfied with it. In total, 95% would make the same choice again. Only 1.3% regretted their decision. Table 6 summarises responses to the DRS questionnaire.
Table 6.
Decision Regret Satisfaction questionnaire responses according to individual questionnaire items.
A FH of BC (p = 0.034) but not OC (p = 0.20) was negatively associated with QOL. Having a FH of OC was not associated with an increase in OC worry or general cancer risk perception. However, women with a FH of BC perceived themselves to be at higher cancer risk (p = 0.002) but did not have increased OC worry.
Results from contrast tests assessing the joint effect of between-group and within-group differences in various outcomes over six months compared to baseline are shown in Table 7. There was no statistically significant between-group difference for groups ‘with’ and ‘without’ a FH of OC for HADS total/HADS depression/HADS anxiety/QoL/distress/OC worry/general cancer risk perception over time. There was no statistically significant within-group difference for groups ‘with’ and ‘without’ a FH of OC for HADS total/HADS anxiety/QoL/general cancer risk perception over six months. However, there was a statistically significant within-group difference for individuals ‘without’ a FH of OC but not ‘with’ a FH of OC for HADS depression (p = 0.003, p = 0.866, respectively), distress (p = 0.043, p = 0.524 respectively) and OC worry (p ≤ 0.001, p = 0.582, respectively) over six months. Viewing the contrast tests together in combination with the linear random-effects mixed-model outputs would suggest a small increase in HADS depression scores not of clinical significance and a decrease in distress and OC worry over six months for the ‘without’ a FH of OC group.
Table 7.
Contrast tests for between-group and within-group analyses over time.
3. Discussion
This is the first unselected population-based, prospective cohort study recruiting participants without cancer history in self/family, evaluating the feasibility of personalised lifetime OC risk stratification followed by offering risk management options. Data suggest that OC risk stratification using genetic/non-genetic (epidemiological/hormonal) factors in general population women is feasible and acceptable.
The 85% uptake of PGT and OC risk stratification suggests high acceptability, similar to previously published data indicating putative 85% uptake of PGT (n = 734/829 in a survey study assessing attitudes of a general population of women to unselected PGT and risk-stratified OC screening [15,16]. Findings are also similar to data showing the high acceptability of unselected BRCA testing in AJ populations (up to 88% uptake) [17]. The 85%–98% overall satisfaction we found with PGT is similar to rates reported with population-based BRCA testing in AJ populations [9,12].
Data from unselected BRCA testing in the AJ population [9,10,14,18,19] show acceptability/feasibility/effectiveness/cost effectiveness/lack of detrimental impact on psychological health/QoL, and support the concept of population-based BRCA testing in Jewish populations. However, these inferences cannot be directly generalized to a non-Jewish general population. Our findings of overall time effect contrast tests showing levels of anxiety/depression/QoL/distress not being jointly different from baseline values but a significant reduction in OC-specific worry/general cancer risk perception following OC risk stratification are reassuring. Small changes in scores observed in some outcomes at individual time points were not clinically meaningful. While larger studies are warranted, these initial findings concur with short-/long-term outcome data following unselected BRCA testing in AJ populations [9,13] and are similar to findings amongst high-risk individuals undergoing clinical criteria-based genetic testing [20,21,22]. In total, 25.5% of our cohort was non-Caucasian (13.7% Asian). We found no difference in psychological health/QoL outcomes amongst non-Caucasians versus Caucasians. More research is required for understanding the role of various risk factors in non-Europeans.
Our online DA was successfully completed by women from a wide range of ages (18–85), education levels, and ethnicities, with high levels (92.2%) of satisfaction. Women who used the optional telephone helpline reported higher levels of worry/upset when viewing the DA. In total, 75% of women using the telephone helpline did so for technical DA assistance. All went on to successfully view the online DA. The telephone helpline appears to have been used as a source of emotional/technical support, emphasising the importance/need for a telephone helpline as an adjunct to online web applications to facilitate access/decision making for PGT/OC risk stratification. That one volunteer consented despite her DA score (−1) indicating she was “leaning against taking part”, highlights that whilst decision aids are adjuncts aiding decision making, individuals retain ultimate autonomy. While we showed the feasibility of using an online DA and helpline approach for PGT, this has not been compared in randomised trials to more standard/established methods (face-to-face/telephone-based/DVD-assisted counselling).
Our study strengths include population-based recruitment in a non-Jewish, ethnically diverse general population. We engaged and worked with primary care networks prior to study commencement. They helped increase awareness of this study, identify eligible women and facilitate recruitment. Engagement with primary care would be vital for the implementation of any national population-based model for PGT/OC risk stratification. Other advantages include a good questionnaire response rate, ranging from 99% (baseline) to 75% (six months follow up).
Limitations include the small sample size, lack of long-term follow up on QoL/psychological health/health behaviours. Additionally, this study was non-randomised and a control arm (without genetic testing) to compare any change in outcomes was lacking. However, the high-risk individual identified did opt for appropriate screening and preventive interventions to reduce OC/BC risk. Lack of intermediate-risk women identified probably reflects the small sample size.
In our cohort, 45% vs. 40% [23] of the UK general population had a university level education; 7% vs. 15% [23] were current smokers; 64% vs. 32% [23] ate the recommended ≥5 portions of fruit/vegetables daily; 78% vs. 64% [23] were physically active over the last month; median total household income was >£50,000 vs. £29,000 in the UK general population [23]. Higher income, education levels and healthy lifestyle behaviour in our study participants compared to the UK’s general population may indicate a London bias. The income/education levels/lifestyle choices are similar to those of the UK Jewish population [9,17]. Significant associations of some study outcome variables seen with demographic variables of income/age are consistent with observations from population-based data reported in other population cohorts.
Precision prevention is a prevention strategy incorporating individual variation in genetic, epi-genetic and non-genetic (e.g., environment, hormonal, lifestyle, behavioural) risk factors. This comprises primary prevention to prevent occurrence of disease and, secondary prevention for screening/early detection of pre-symptomatic disease. Next-generation sequencing technologies, falling costs and advances in computational bioinformatics makes personalised risk-stratified prevention feasible. Improvements in the precision of risk estimation, genetic understanding of disease and increasing awareness offers an opportunity to apply this knowledge and technology at a broad population scale to make an important shift in health care towards disease prevention. Over 50% of OCs occur in 9% of the population, which is at >5% OC risk [4]. This provides a huge opportunity for population stratification for precision prevention. Identification of unaffected women at increased risk offers opportunities for risk-stratified prevention to reduce cancer burden. Women at increased OC risk can opt for risk-reducing salpingo-oophorectomy (RRSO) to prevent tubal cancer/OC [24], now advocated at >4–5% lifetime OC risk [25,26,27].
Access to and uptake of testing for CSGs remains restricted. Only a small proportion of at-risk BRCA carriers have been identified [7,8]. Our approach offers opportunities to maximise pathogenic variant identification and population stratification for OC prevention. While recent data suggest that population-based genetic testing for OC/BC gene pathogenic variants could be cost effective in general population women [11], additional research including general population implementation studies are needed to address knowledge gaps before considering this. Additional looked for findings have recently been offered and returned following post hoc sequencing and/or analysis of some large genomic study cohorts. These studies would enable evaluation of CSG pathogenic variant carriage rates. However, this would not address in a prospective unbiased fashion key questions around the (i) logistics of population testing; (ii) information giving, a priori informed consent, and uptake of testing; (iii) uptake of preventive options. This ‘bolt-on’ paradigm of returning additional ‘secondary findings’ cannot be equated to prospective uptake of testing CSGs in an unselected unaffected population.
A prospective, Canadian cohort study offering BRCA1/BRCA2 testing to unselected men/women (The Screen Project) is ongoing. The study is evaluating the feasibility of a direct-to-consumer approach, satisfaction, OC worry, prevalence of BRCA1/BRCA2 pathogenic variants and the number of OCs/BCs prevented. Results from our feasibility study would inform the development of a larger UK-wide study that implements PGT/OC risk-stratified prevention. An important challenge is identifying optimum implementation pathways. It is likely that different context-specific models are needed for various health care systems internationally. Risk assessment pathways could be established through a community/primary care-based approach outside the traditional hospital-based genetics clinic model. A key issue that needs resolving is a system for monitoring/managing VUS. Commissioning/funding of a system where laboratory reports can be reviewed and re-issued in light of new evidence is needed. A framework/structure for data management and legal and regulatory protections will also need to be established.
4. Materials and Methods
4.1. Design
A multicentre, prospective cohort, feasibility study (ISRCTN:54246466). Inclusion criteria: women ≥18 years. Exclusion criteria: history of ovarian/tubal/primary peritoneal cancer or previous genetic testing for OC CSGs.
4.2. Recruitment
Recruitment was by self-referral. Study information/leaflets were made available through North-East London primary care practices. Interested volunteers received a detailed participant information sheet and access to an online DA prior to consent to genetic testing/participation. All had access to use an ‘optional’ telephone helpline for support/advice/queries. The helpline was manned by a doctor/research nurse experienced in cancer genetic risk assessment/management. Individuals deciding to undergo PGT/OC risk assessment consented. Decliners were asked to provide information on factors affecting decision making.
4.3. Decision Aid (DA)
A bespoke web-based DA was developed, enabling potential participants to make an informed decision on whether they wish to determine their OC risk and undergo PGT/OC risk assessment [16,28]. The DA (Table S2) included information on OC, genetic testing and the PROMISE programme, followed by ten questions/items on potential advantages/disadvantages of learning about OC risk. Responses were rated according to two different 3-point Likert scales. Individual questions were scored according to responses ((a) 1 = in favour of taking part, −1 = against taking part, 0 = neither in-favour or against taking part; or (b) 1 = agree, −1 = disagree, 0 = unsure). Sum of all questions/items scores taken together ranged from −10 to 10. Women with total scores between −10 and −1 were considered “leaning against taking part”, 0–5 “undecided”, and 6–10 “leaning towards taking part”.
4.4. Genetic Analysis
Genetic testing involved next-generation sequencing of BRCA1/BRCA2/RAD51C/RAD51D/BRIP1 genes and 30 GWAS-validated OC SNPs. Pathogenic variants detected were reconfirmed in an NHS laboratory.
4.5. Risk Model
Epidemiological/hormonal/reproductive data affecting OC risk collected at baseline (age/OC-FH/body mass index (BMI)/tubal ligation/hormone-replacement therapy (HRT)/oral contraceptive pill (OCP) use/endometriosis/parity) were combined with genetic information in a risk prediction algorithm (RPA) to provide a personalised predicted lifetime OC risk (till 80 years). Model validation (personal communication) [5] was undertaken in prospective datasets and cancers accrued in the UK OC screening trial cohorts [5,29,30]. Following RPA assessment, all participants were stratified into risk categories by lifetime OC risk (low risk: <5%; intermediate risk: ≥5%–<10%; high risk: ≥10%).
4.6. Test Result Management
High/intermediate-risk (and an equivalent number of randomly selected low-risk) individuals received their result at a face-to-face post test risk stratification counselling appointment. Identified pathogenic/likely pathogenic variant heterozygotes were referred to an NHS regional genetics clinic for confirmatory testing and to established NHS risk management services. Other low-risk individuals received results via post. Variants of uncertain significance (VUS) results were not returned.
4.7. Assessment of Demographics, Outcomes and Follow Up
Sociodemographic, family history, perceived risk/limitation (4-point Likert scale), telephone helpline and DA evaluation data were collected using customised questionnaires. Anxiety and depression were assessed with the Hospital Anxiety and Depression Scale (HADS) [31]. Distress was assessed using the Impact of Events Scale (IES) [32]. General cancer risk perception was measured by two items. Comparative risk: ‘Compared with other people of your age/sex, do you think your chances of getting cancer in your life are: much-lower, lower, about-the-same, higher, much-higher?’ An additional risk item: ‘On a scale from 0 to 100, where 0 is no chance at all and 100 is absolutely certain, what are the chances you will get cancer sometime during your lifetime?’. OC worry was assessed by the Cancer Worry Scale (CWS) [33]. Generic QoL was measured with the EQ-5D-5L questionnaire [34]. Satisfaction and regret were measured by the Decision Regret Satisfaction Scale (DRS) and one additional 5-point Likert scale item, ‘I am satisfied with the decision I have made’ [35]. Smoking, diet and physical activity were evaluated. Data were gathered at baseline following consent and post results delivery (seven days/three months/six months).
4.8. Statistical Analysis
Descriptive statistics were used for baseline characteristics/telephone helpline/DA/follow-up questionnaire data. The Wilcoxon rank sum test and Fisher’s exact test evaluated differences in means and proportions correspondingly.
As outcome data from the HADS/EQ-5D-5L/IES/CWS/CRP/DRS questionnaires were collected over multiple time points, linear random-effects mixed models were used to allow for individual baseline-level variability. Each scale was analysed, with the outcome as a continuous response variable. Models included a group effect and time effect. Models were adjusted for FH of OC/BC (positive/negative), age, income (in £10,000 increments), marital status (cohabiting/living with partner/married versus divorced/separated/single/widowed), ethnicity (Caucasian versus non-Caucasian) and religion (Muslim/Christian/Jewish/no religion/other (Hindu/Buddhist/Sikh)). Linear random-effects mixed models were used to model trends in DA scores for participants viewing the DA on multiple occasions.
Post modelling, three contrast tests were considered (each on three degrees of freedom). We assessed (a) overall time effects, i.e., whether the overall mean values at seven days, three months and six months from baseline were jointly different from the baseline level, (b) between-group differences over time (whether the mean group differences between those ‘with’ and ‘without’ a FH of OC at seven days, three months and six months from baseline were jointly different from the baseline level) and (c) within-group differences over time (whether mean values at seven days, three months and six months from baseline were jointly different from the baseline level within the groups ‘with’ and ‘without’ FH of OC). Statistical analysis used Stata-13.0 (Stata-Corp-LP, TX, https://www.stata.com/) and R version 3.5.1 (https://www.r-project.org/).
5. Conclusions
Our current health care systems remain primarily centred on improving disease diagnosis and treatment rather than prevention. Prevention of chronic disease, cancer being the second most common cause, is a major challenge for our health systems. PGT and personalised OC risk stratification can spur CSG detection and maximise precision prevention to reduce OC burden. We have shown that population-based personalised OC risk stratification is feasible and acceptable, has high satisfaction, reduces cancer worry/risk perception, and does not negatively impact on psychological health/quality of life. Further research and implementation studies evaluating the impact, clinical efficacy, long-term psychological, and socioethical consequences and cost effectiveness of this strategy are needed. This includes evaluation through large implementation studies of real-world health outcomes. Future implementation of such a strategy will require varying levels of workforce expansion/upskilling and reorganisation of health service infrastructure covering aspects of genetic testing and downstream care including screening and prevention pathways. PGT is an exciting and evolving field and personalised OC risk stratification offers a new paradigm for precision prevention in OC.
Supplementary Materials
The following are available online at https://www.mdpi.com/2072-6694/12/5/1241/s1, Table S1: Perceived benefits, risks, limitations or panel genetic testing/ovarian cancer risk assessment measured at baseline; Table S2: Decision aid question responses for women who consented and who did not consent to this study; Table S3: Mean scores at repeat viewings for participants who viewed the decision aid on multiple occasions; Table S4: Linear random-effects mixed models for trends in decision aid scores in participants viewing the decision aid on multiple occasions; Figure S1: Distributions of the remaining lifetime ovarian cancer risks given by different model versions.
Author Contributions
All authors have read and agree to the published version of the manuscript. Conception of study: I.J. and R.M. Design and development: R.M. and I.J. Trial management: R.M., F.G., I.J., U.M., L.S., M.A., M.K., J.K., and A.G.-M. Genetic testing: A.W., Y.W., C.L., J.D., A.D., and A.L. (Andrew Lee). Decision aid development: S.S., A.L. (Anne Lanceley), J.W., L.S., and R.M. Risk modelling: A.C.A., X.Y., U.M., R.M., and F.G. Data acquisition: F.G., R.M., X.L., S.G., N.L., D.C., and M.K. Data analysis: F.G., O.B., and R.M. Preparation of tables: F.G., O.B., and R.M. Initial draft of manuscript: F.G., R.M., O.B., and R.L.
Funding
This study was funded by Cancer Research UK and The Eve-Appeal Charity (C16420/A18066). U.M. received support from the National Institute for Health Research University College London Hospitals Biomedical Research Centre. A.A. is supported by Cancer Research UK (grant number C12292/A20861). The funding bodies had no role in the study design, data collection, analysis, interpretation or writing of the report or decision to submit for publication. The research team was independent of funders.
Acknowledgments
This study is supported by researchers at the Cancer Research UK Barts Centre, Queen Mary University of London (C16420/A18066). We are particularly grateful to the women who participated in this study. We are grateful to the entire medical, nursing, and administrative staff who work on the PROMISE Feasibility Study.
Conflicts of Interest
Ranjit Manchanda declares research funding from Barts and the London Charity and Rosetrees Trust outside this work, an honorarium for grant review from the Israel National Institute for Health Policy Research and an honorarium for advisory board membership from Astrazeneca/MSD. Ranjit Manchanda is supported by an NHS Innovation Accelerator (NIA) Fellowship for population testing. Ian Jacobs and Usha Menon have a financial interest in Abcodia, Ltd., a company formed to develop academic and commercial development of biomarkers for early detection of cancer. Ian Jacobs is a member of the board of Abcodia Ltd., a Director of Women’s Health Specialists Ltd. and received consultancy from Beckton Dickinson. The other authors declare no conflict of interest. The funders had no role in the design of the study; in the collection, analyses, or interpretation of data; in the writing of the manuscript, or in the decision to publish the results.
References
- Kuchenbaecker, K.B.; Hopper, J.L.; Barnes, D.R.; Phillips, K.A.; Mooij, T.M.; Roos-Blom, M.J.; Jervis, S.; van Leeuwen, F.E.; Milne, R.L.; Andrieu, N.; et al. Risks of Breast, Ovarian, and Contralateral Breast Cancer for BRCA1 and BRCA2 Mutation Carriers. JAMA 2017, 317, 2402–2416. [Google Scholar] [CrossRef] [PubMed]
- Yang, X.; Song, H.; Leslie, G.; Engel, C.; Hahnen, E.; Auber, B.; Horváth, J.; Kast, K.; Niederacher, D.; Turnbull, C.; et al. Ovarian and breast cancer risks associated with pathogenic variants in RAD51C and RAD51D. JNCI: J. Natl. Cancer Inst. 2020. [Google Scholar] [CrossRef] [PubMed]
- Ramus, S.J.; Song, H.; Dicks, E.; Tyrer, J.P.; Rosenthal, A.N.; Intermaggio, M.P.; Fraser, L.; Gentry-Maharaj, A.; Hayward, J.; Philpott, S.; et al. Germline Mutations in the BRIP1, BARD1, PALB2, and NBN Genes in Women With Ovarian Cancer. J. Natl. Cancer Inst. 2015, 107. [Google Scholar] [CrossRef] [PubMed]
- Jervis, S.; Song, H.; Lee, A.; Dicks, E.; Harrington, P.; Baynes, C.; Manchanda, R.; Easton, D.F.; Jacobs, I.; Pharoah, P.P.; et al. A risk prediction algorithm for ovarian cancer incorporating BRCA1, BRCA2, common alleles and other familial effects. J. Med. Genet. 2015. [Google Scholar] [CrossRef]
- Yang, X.; Leslie, G.; Gentry-Maharaj, A.; Ryan, A.; Intermaggio, M.; Lee, A.; Kalsi, J.K.; Tyrer, J.; Gaba, F.; Manchanda, R.; et al. Evaluation of polygenic risk scores for ovarian cancer risk prediction in a prospective cohort study. J. Med. Genet. 2018. [Google Scholar] [CrossRef]
- Pearce, C.L.; Stram, D.O.; Ness, R.B.; Stram, D.A.; Roman, L.D.; Templeman, C.; Lee, A.W.; Menon, U.; Fasching, P.A.; McAlpine, J.N.; et al. Population distribution of lifetime risk of ovarian cancer in the United States. Cancer Epidemiol. Biomark. Prev. 2015, 24, 671–676. [Google Scholar] [CrossRef]
- Childers, C.P.; Childers, K.K.; Maggard-Gibbons, M.; Macinko, J. National Estimates of Genetic Testing in Women With a History of Breast or Ovarian Cancer. J. Clin. Oncol. 2017, 35, 3800–3806. [Google Scholar] [CrossRef]
- Manchanda, R.; Blyuss, O.; Gaba, F.; Gordeev, V.S.; Jacobs, C.; Burnell, M.; Gan, C.; Taylor, R.; Turnbull, C.; Legood, R.; et al. Current detection rates and time-to-detection of all identifiable BRCA carriers in the Greater London population. J. Med Genet. 2018. [Google Scholar] [CrossRef]
- Manchanda, R.; Loggenberg, K.; Sanderson, S.; Burnell, M.; Wardle, J.; Gessler, S.; Side, L.; Balogun, N.; Desai, R.; Kumar, A.; et al. Population testing for cancer predisposing BRCA1/BRCA2 mutations in the Ashkenazi-Jewish community: A randomized controlled trial. J. Natl. Cancer Inst. 2015, 107, 379. [Google Scholar] [CrossRef]
- Gabai-Kapara, E.; Lahad, A.; Kaufman, B.; Friedman, E.; Segev, S.; Renbaum, P.; Beeri, R.; Gal, M.; Grinshpun-Cohen, J.; Djemal, K.; et al. Population-based screening for breast and ovarian cancer risk due to BRCA1 and BRCA2. Proc. Natl. Acad. Sci. USA 2014, 111, 14205–14210. [Google Scholar] [CrossRef]
- Manchanda, R.; Patel, S.; Gordeev, V.S.; Antoniou, A.C.; Smith, S.; Lee, A.; Hopper, J.L.; MacInnis, R.J.; Turnbull, C.; Ramus, S.J.; et al. Cost-effectiveness of Population-Based BRCA1, BRCA2, RAD51C, RAD51D, BRIP1, PALB2 Mutation Testing in Unselected General Population Women. J. Natl. Cancer Inst. 2018, 110, 714–725. [Google Scholar] [CrossRef] [PubMed]
- Manchanda, R.; Gaba, F. Population Based Testing for Primary Prevention: A Systematic Review. Cancers 2018, 10, 424. [Google Scholar] [CrossRef] [PubMed]
- Manchanda, R.; Burnell, M.; Gaba, F.; Desai, R.; Wardle, J.; Gessler, S.; Side, L.; Sanderson, S.; Loggenberg, K.; Brady, A.F.; et al. Randomised trial of population-based BRCA testing in Ashkenazi Jews: Long-term outcomes. BJOG 2019. [Google Scholar] [CrossRef] [PubMed]
- Manchanda, R.; Legood, R.; Burnell, M.; McGuire, A.; Raikou, M.; Loggenberg, K.; Wardle, J.; Sanderson, S.; Gessler, S.; Side, L.; et al. Cost-effectiveness of population screening for BRCA mutations in Ashkenazi jewish women compared with family history-based testing. J. Natl. Cancer Inst. 2015, 107, 380. [Google Scholar] [CrossRef] [PubMed]
- Meisel, S.F.; Fraser, L.S.M.; Side, L.; Gessler, S.; Hann, K.E.J.; Wardle, J.; Lanceley, A.; PROMISE Study Team. Anticipated health behaviour changes and perceived control in response to disclosure of genetic risk of breast and ovarian cancer: A quantitative survey study among women in the UK. BMJ Open 2017, 7, e017675. [Google Scholar] [CrossRef] [PubMed]
- Meisel, S.F.; Freeman, M.; Waller, J.; Fraser, L.; Gessler, S.; Jacobs, I.; Kalsi, J.; Manchanda, R.; Rahman, B.; Side, L.; et al. Impact of a decision aid about stratified ovarian cancer risk-management on women’s knowledge and intentions: A randomised online experimental survey study. BMC Public Health 2017, 17, 882. [Google Scholar] [CrossRef] [PubMed]
- Manchanda, R.; Burnell, M.; Gaba, F.; Sanderson, S.; Loggenberg, K.; Gessler, S.; Wardle, J.; Side, L.; Desai, R.; Brady, A.F.; et al. Attitude towards and factors affecting uptake of population-based BRCA testing in the Ashkenazi Jewish population: A cohort study. BJOG 2019, 126, 784–794. [Google Scholar] [CrossRef]
- Manchanda, R.; Burnell, M.; Loggenberg, K.; Desai, R.; Wardle, J.; Sanderson, S.C.; Gessler, S.; Side, L.; Balogun, N.; Kumar, A.; et al. Cluster-randomised non-inferiority trial comparing DVD-assisted and traditional genetic counselling in systematic population testing for BRCA1/2 mutations. J. Med. Genet. 2016, 53, 472–480. [Google Scholar] [CrossRef]
- Manchanda, R.; Patel, S.; Antoniou, A.C.; Levy-Lahad, E.; Turnbull, C.; Evans, D.G.; Hopper, J.L.; Macinnis, R.J.; Menon, U.; Jacobs, I.; et al. Cost-effectiveness of population based BRCA testing with varying Ashkenazi Jewish ancestry. Am. J. Obstet. Gynecol. 2017, 217. [Google Scholar] [CrossRef]
- Nelson, H.D.; Fu, R.; Goddard, K.; Mitchell, J.P.; Okinaka-Hu, L.; Pappas, M.; Zakher, B. Risk Assessment, Genetic Counseling, and Genetic Testing for BRCA-Related Cancer: Systematic Review to Update the U.S. Preventive Services Task Force Recommendation; Agency for Healthcare Research and Quality: Rockville, MD, USA, 2013.
- Metcalfe, K.A.; Poll, A.; Llacuachaqui, M.; Nanda, S.; Tulman, A.; Mian, N.; Sun, P.; Narod, S.A. Patient satisfaction and cancer-related distress among unselected Jewish women undergoing genetic testing for BRCA1 and BRCA2. Clin. Genet. 2010, 78, 411–417. [Google Scholar] [CrossRef]
- Sivell, S.; Iredale, R.; Gray, J.; Coles, B. Cancer genetic risk assessment for individuals at risk of familial breast cancer. Cochrane Database Syst. Rev. 2007, Cd003721. [Google Scholar] [CrossRef]
- Kerber, R.A.; Slattery, M.L. Comparison of self-reported and database-linked family history of cancer data in a case-control study. Am. J. Epidemiol. 1997, 146, 244–248. [Google Scholar] [CrossRef] [PubMed]
- Rebbeck, T.R.; Kauff, N.D.; Domchek, S.M. Meta-analysis of risk reduction estimates associated with risk-reducing salpingo-oophorectomy in BRCA1 or BRCA2 mutation carriers. J. Natl. Cancer Inst. 2009, 101, 80–87. [Google Scholar] [CrossRef] [PubMed]
- Manchanda, R.; Legood, R.; Antoniou, A.C.; Gordeev, V.S.; Menon, U. Specifying the ovarian cancer risk threshold of ‘premenopausal risk-reducing salpingo-oophorectomy’ for ovarian cancer prevention: A cost-effectiveness analysis. J. Med. Genet. 2016, 53, 591–599. [Google Scholar] [CrossRef]
- Manchanda, R.; Legood, R.; Antoniou, A.C.; Pearce, L.; Menon, U. Commentary on changing the risk threshold for surgical prevention of ovarian cancer. BJOG 2018. [Google Scholar] [CrossRef]
- Manchanda, R.; Legood, R.; Pearce, L.; Menon, U. Defining the risk threshold for risk reducing salpingo-oophorectomy for ovarian cancer prevention in low risk postmenopausal women. Gynecol. Oncol. 2015, 139, 487–494. [Google Scholar] [CrossRef]
- Meisel, S.F.; Side, L.; Fraser, L.; Gessler, S.; Wardle, J.; Lanceley, A. Population-based, risk-stratified genetic testing for ovarian cancer risk: A focus group study. Public Health Genom. 2013, 16, 184–191. [Google Scholar] [CrossRef]
- Jacobs, I.J.; Menon, U.; Ryan, A.; Gentry-Maharaj, A.; Burnell, M.; Kalsi, J.K.; Amso, N.N.; Apostolidou, S.; Benjamin, E.; Cruickshank, D.; et al. Ovarian cancer screening and mortality in the UK Collaborative Trial of Ovarian Cancer Screening (UKCTOCS): A randomised controlled trial. Lancet 2016. [Google Scholar] [CrossRef]
- Rosenthal, A.N.; Fraser, L.S.M.; Philpott, S.; Manchanda, R.; Burnell, M.; Badman, P.; Hadwin, R.; Rizzuto, I.; Benjamin, E.; Singh, N.; et al. Evidence of Stage Shift in Women Diagnosed With Ovarian Cancer During Phase II of the United Kingdom Familial Ovarian Cancer Screening Study. J. Clin. Oncol. 2017, 35, 1411–1420. [Google Scholar] [CrossRef]
- Zigmond, A.S.; Snaith, R.P. The hospital anxiety and depression scale. Acta Psychiatr. Scand. 1983, 67, 361–370. [Google Scholar] [CrossRef]
- Horowitz, M.; Wilner, N.; Alvarez, W. Impact of Event Scale: A measure of subjective stress. Psychosom. Med. 1979, 41, 209–218. [Google Scholar] [CrossRef] [PubMed]
- Lerman, C.; Daly, M.; Masny, A.; Balshem, A. Attitudes about genetic testing for breast-ovarian cancer susceptibility. J. Clin. Oncol. 1994, 12, 843–850. [Google Scholar] [CrossRef] [PubMed]
- Herdman, M.; Gudex, C.; Lloyd, A.; Janssen, M.; Kind, P.; Parkin, D.; Bonsel, G.; Badia, X. Development and preliminary testing of the new five-level version of EQ-5D (EQ-5D-5L). Qual. Life Res. 2011, 20, 1727–1736. [Google Scholar] [CrossRef] [PubMed]
- Madalinska, J.B.; Hollenstein, J.; Bleiker, E.; van Beurden, M.; Valdimarsdottir, H.B.; Massuger, L.F.; Gaarenstroom, K.N.; Mourits, M.J.; Verheijen, R.H.; van Dorst, E.B.; et al. Quality-of-life effects of prophylactic salpingo-oophorectomy versus gynecologic screening among women at increased risk of hereditary ovarian cancer. J. Clin. Oncol. 2005, 23, 6890–6898. [Google Scholar] [CrossRef] [PubMed]
© 2020 by the authors. Licensee MDPI, Basel, Switzerland. This article is an open access article distributed under the terms and conditions of the Creative Commons Attribution (CC BY) license (http://creativecommons.org/licenses/by/4.0/).