

Near-Infrared Spectroscopy Coupled with Chemometrics and Artificial Neural Network Modeling for Prediction of Emulsion Droplet Diameters

 ,
, 
 ,
, 

Abstract
1. Introduction
2. Materials and Methods
2.1. Materials
2.2. Methods
2.2.1. Mint Extract Preparation
2.2.2. Emulsification in a Microfluidic System
2.2.3. Average Feret Diameter
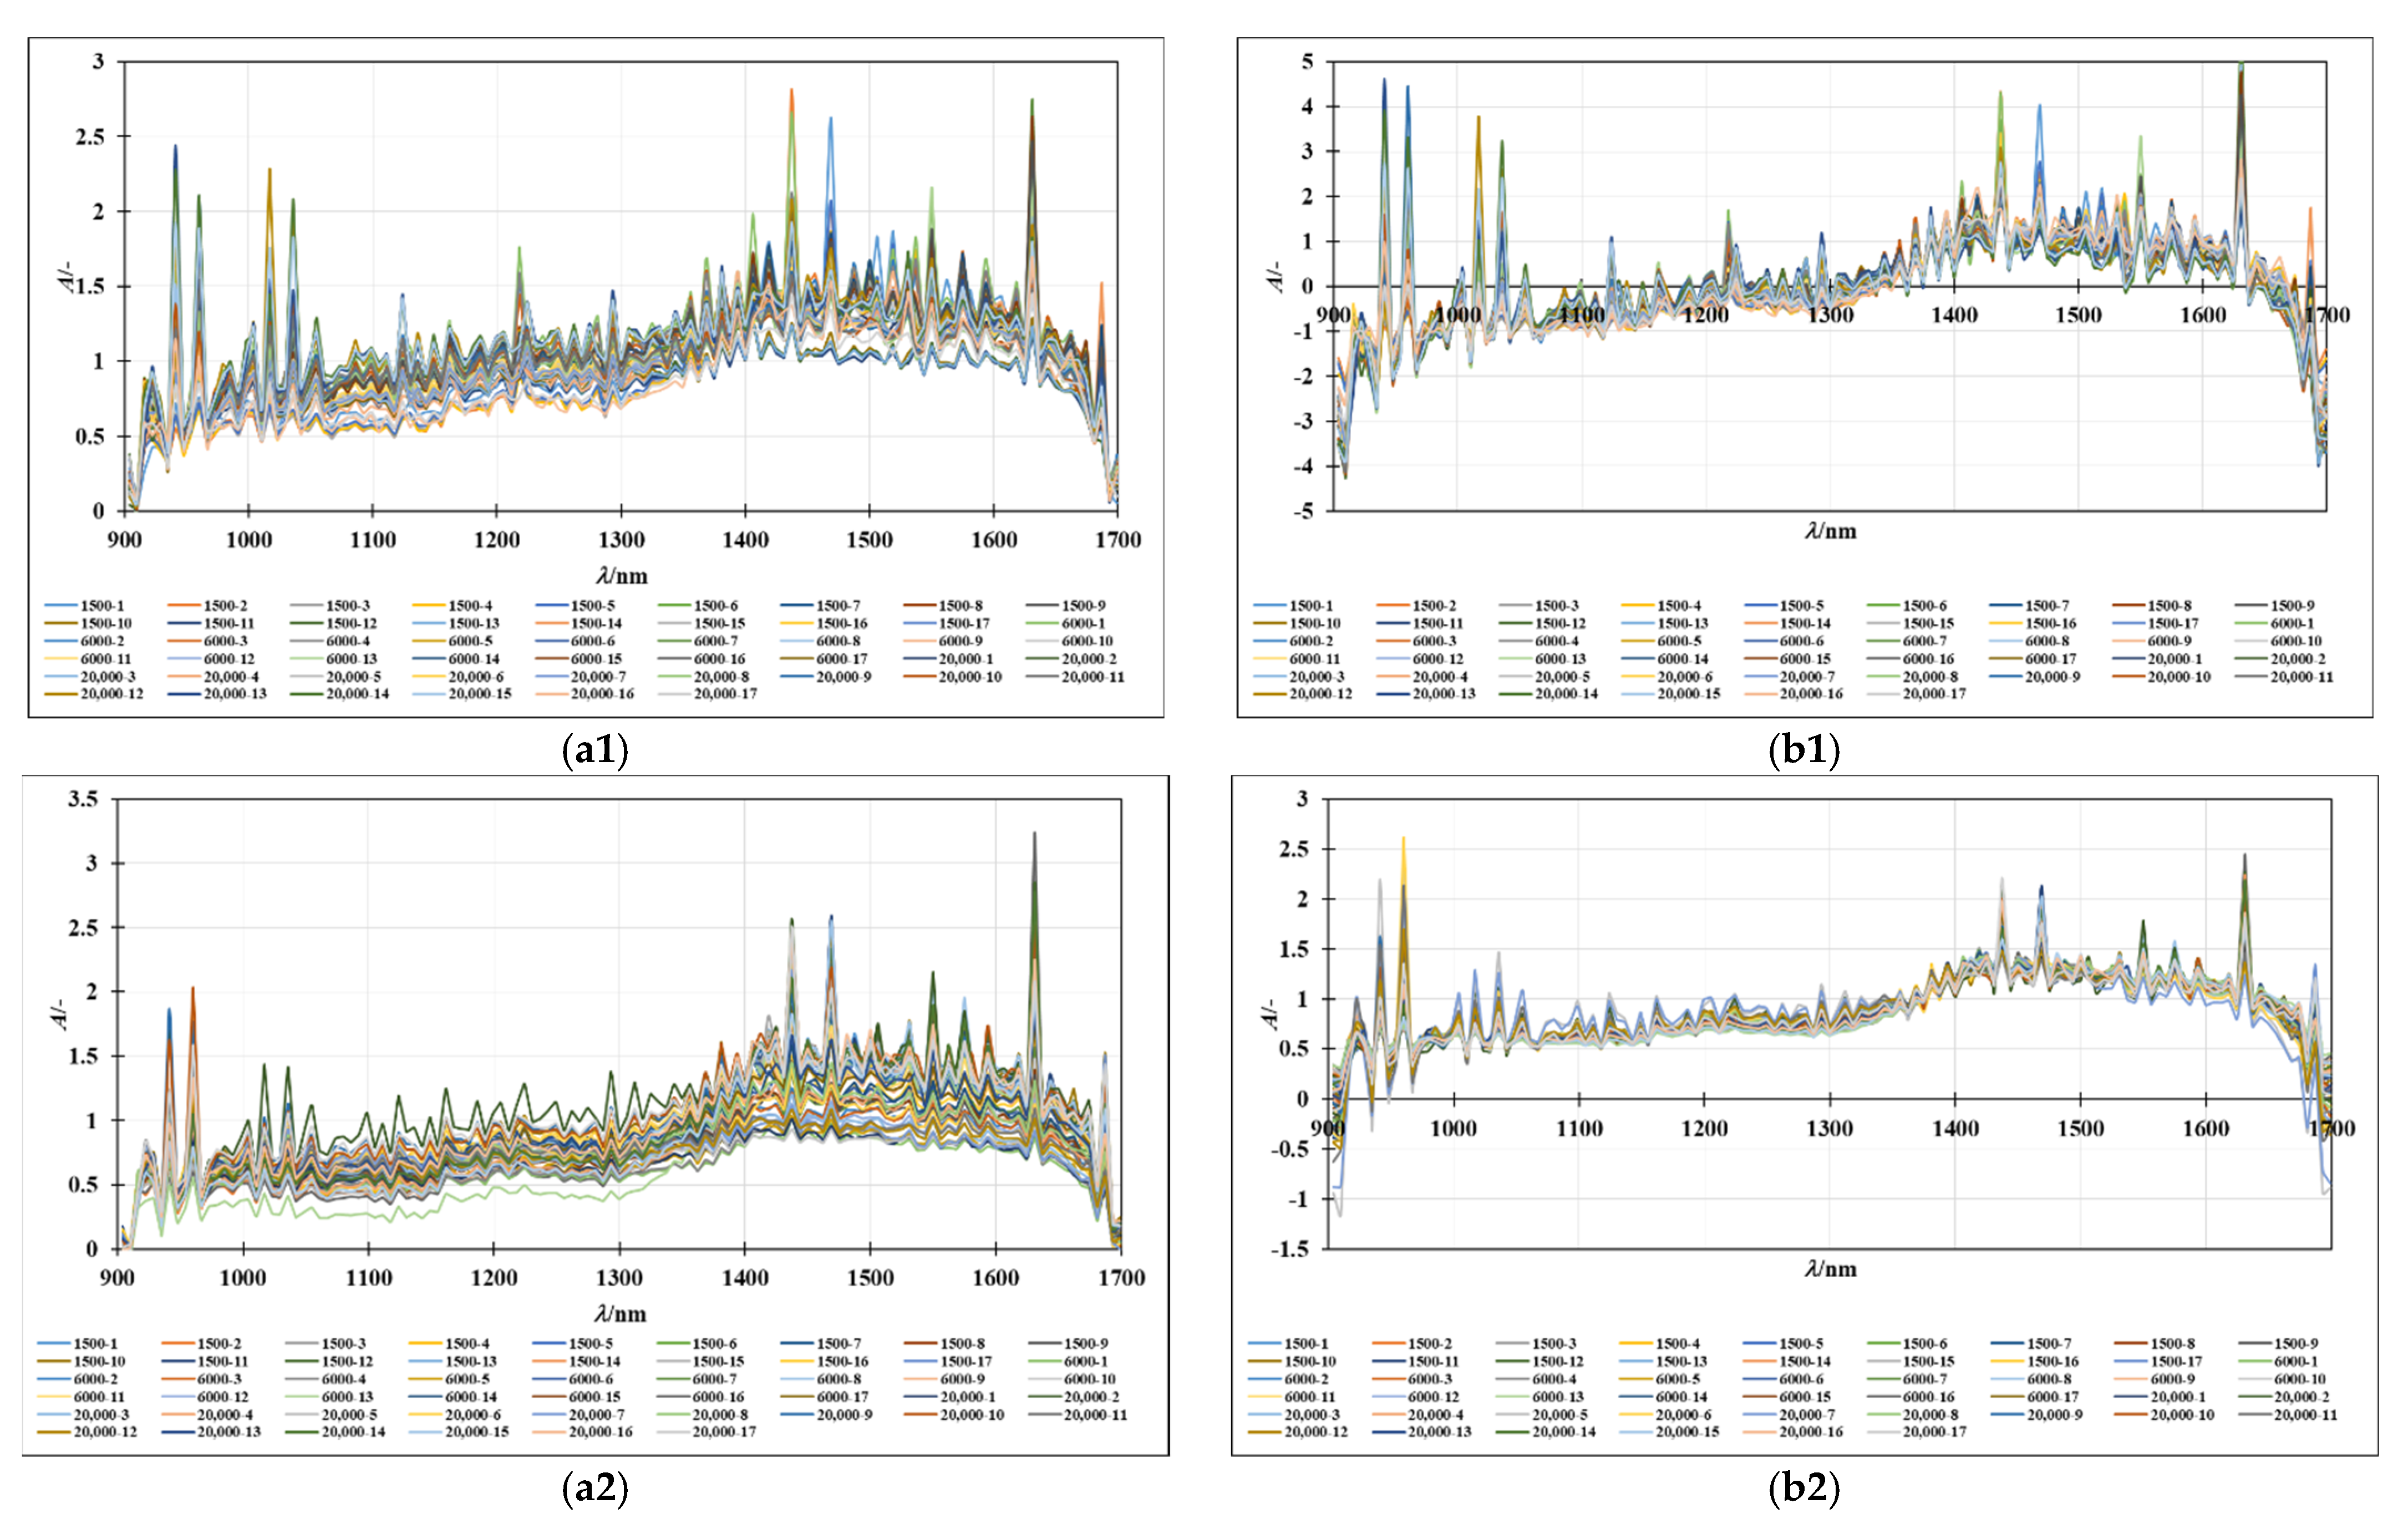
2.2.4. Near-Infrared Spectra of Emulsions
2.2.5. NIR Spectra Processing and Modeling
3. Results and Discussion
3.1. The Average Feret Diameters of Oil-in-Aqueous Mint Emulsions: Comparison with the Average Feret Diameters of Oil-in-Water Emulsions
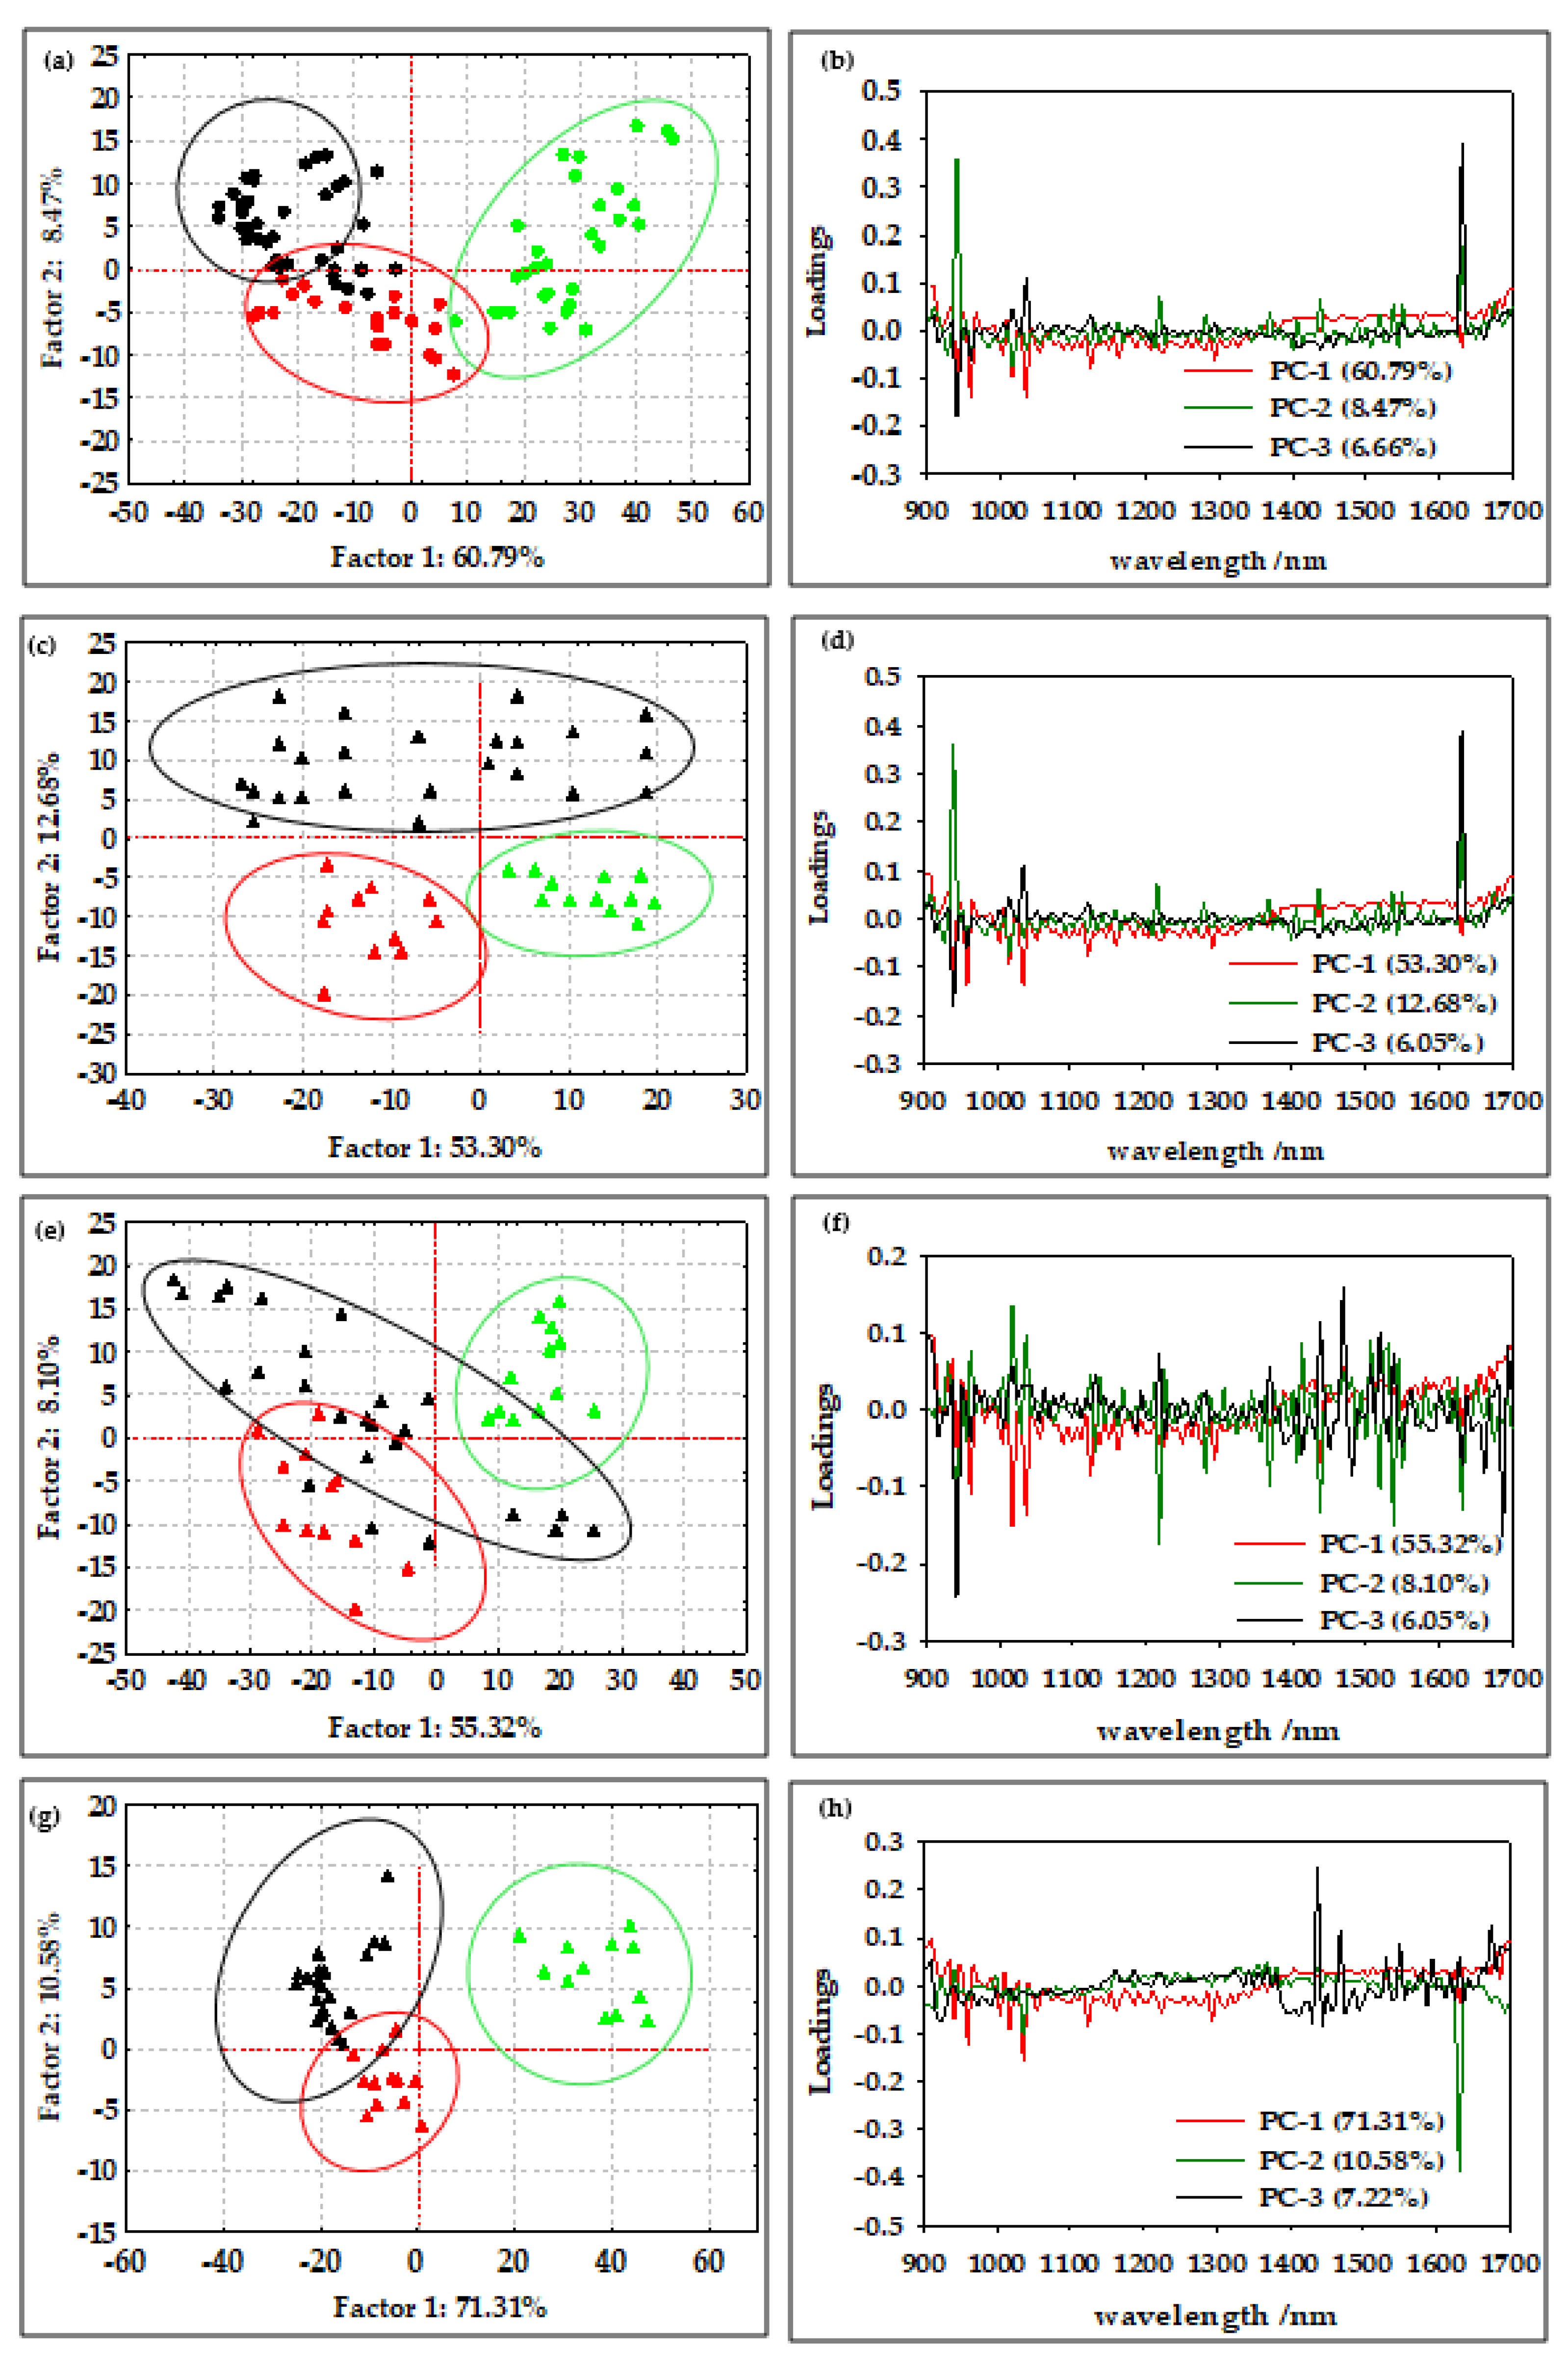
3.2. NIR Spectra of Oil-in-Water and Oil-in-Aqueous Mint Extract Emulsions: Preprocessing and PCA Analysis
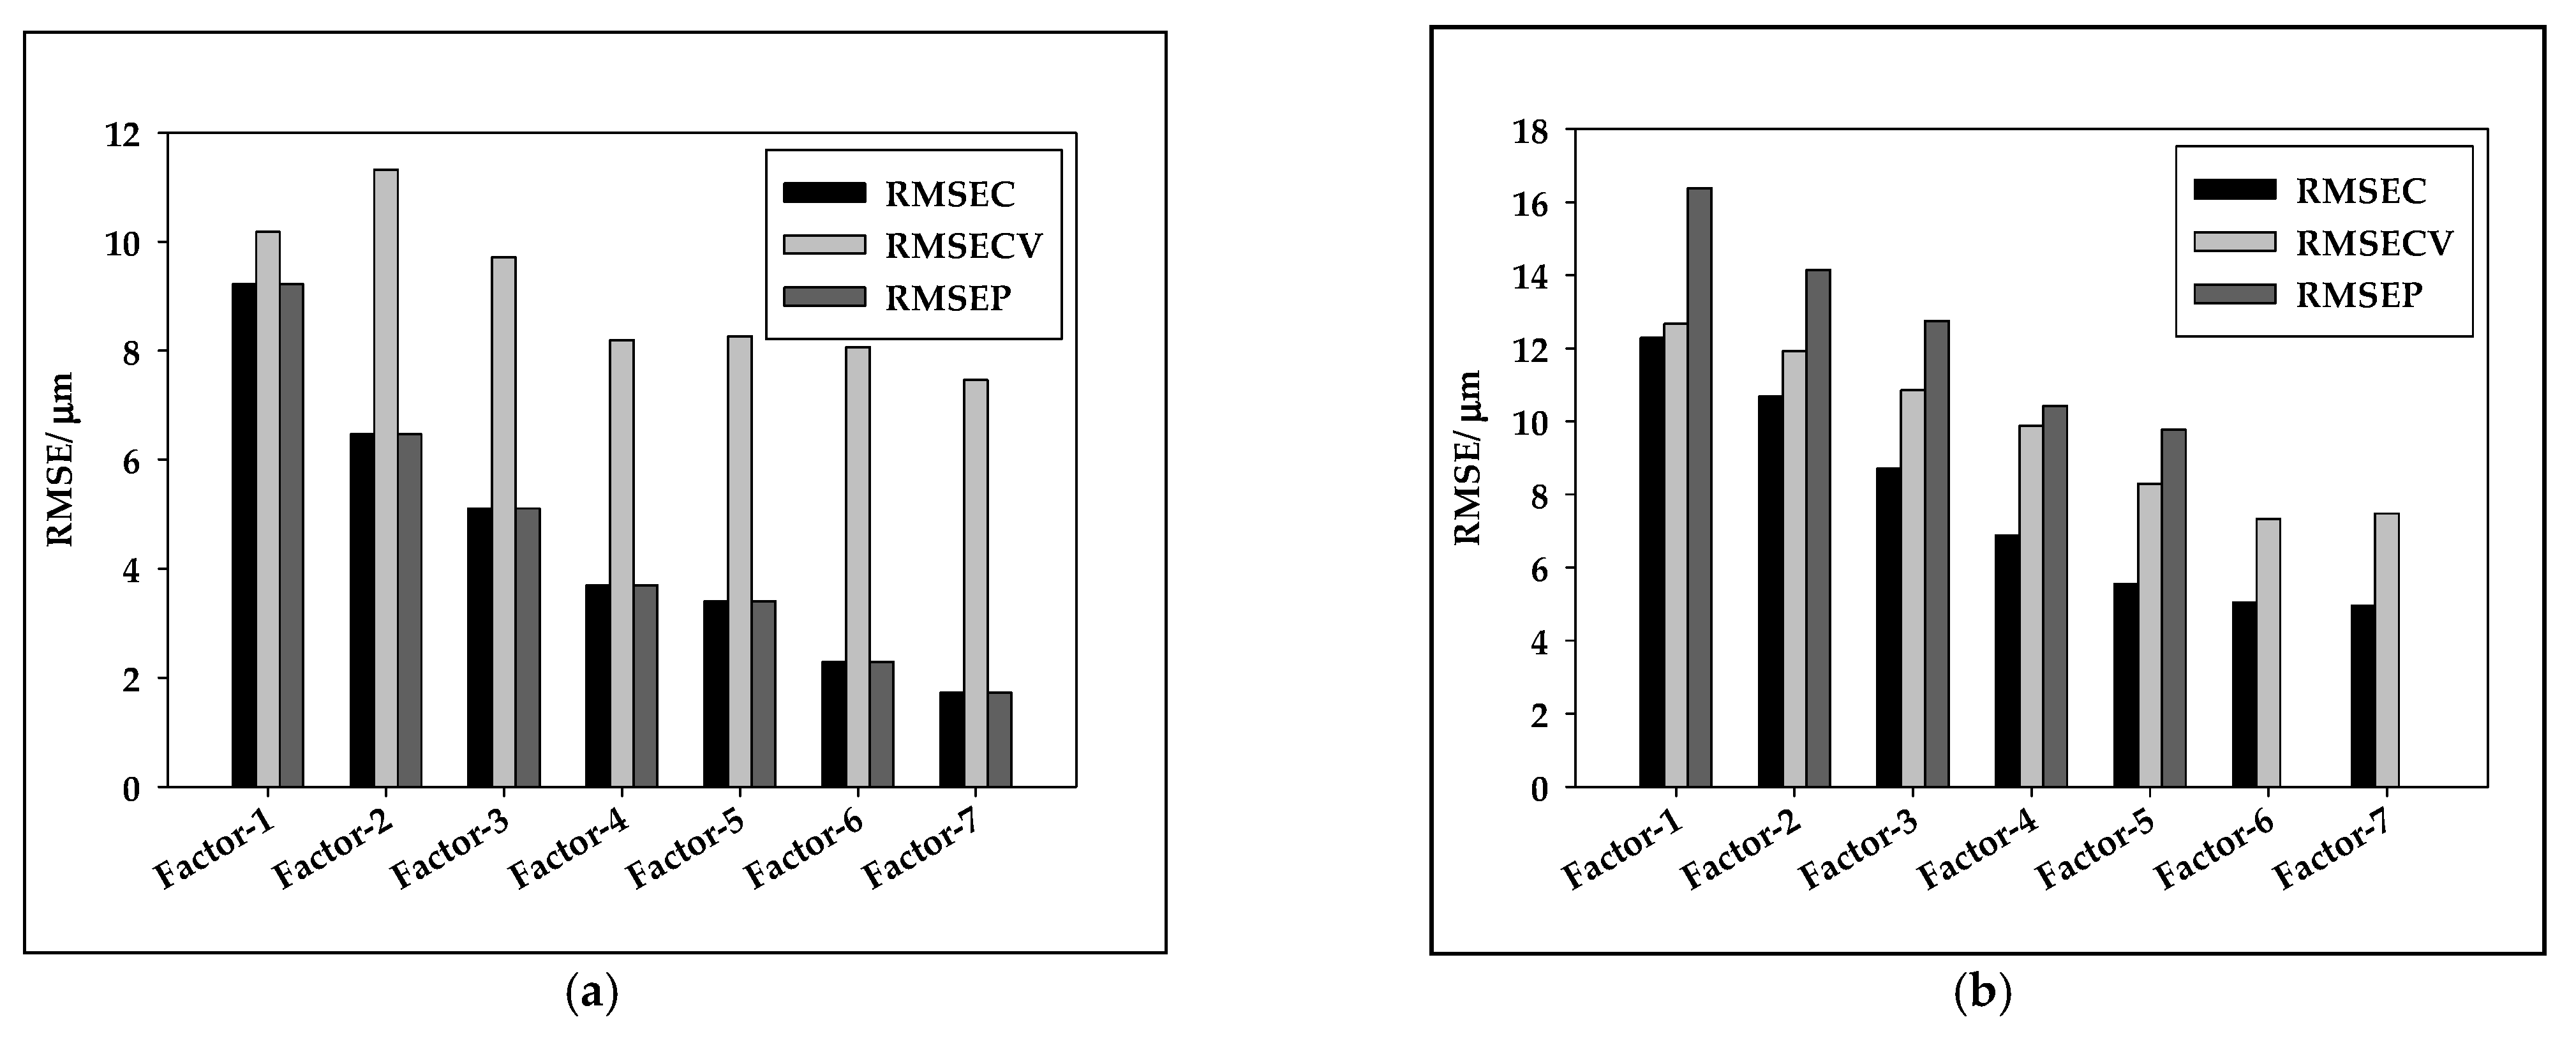
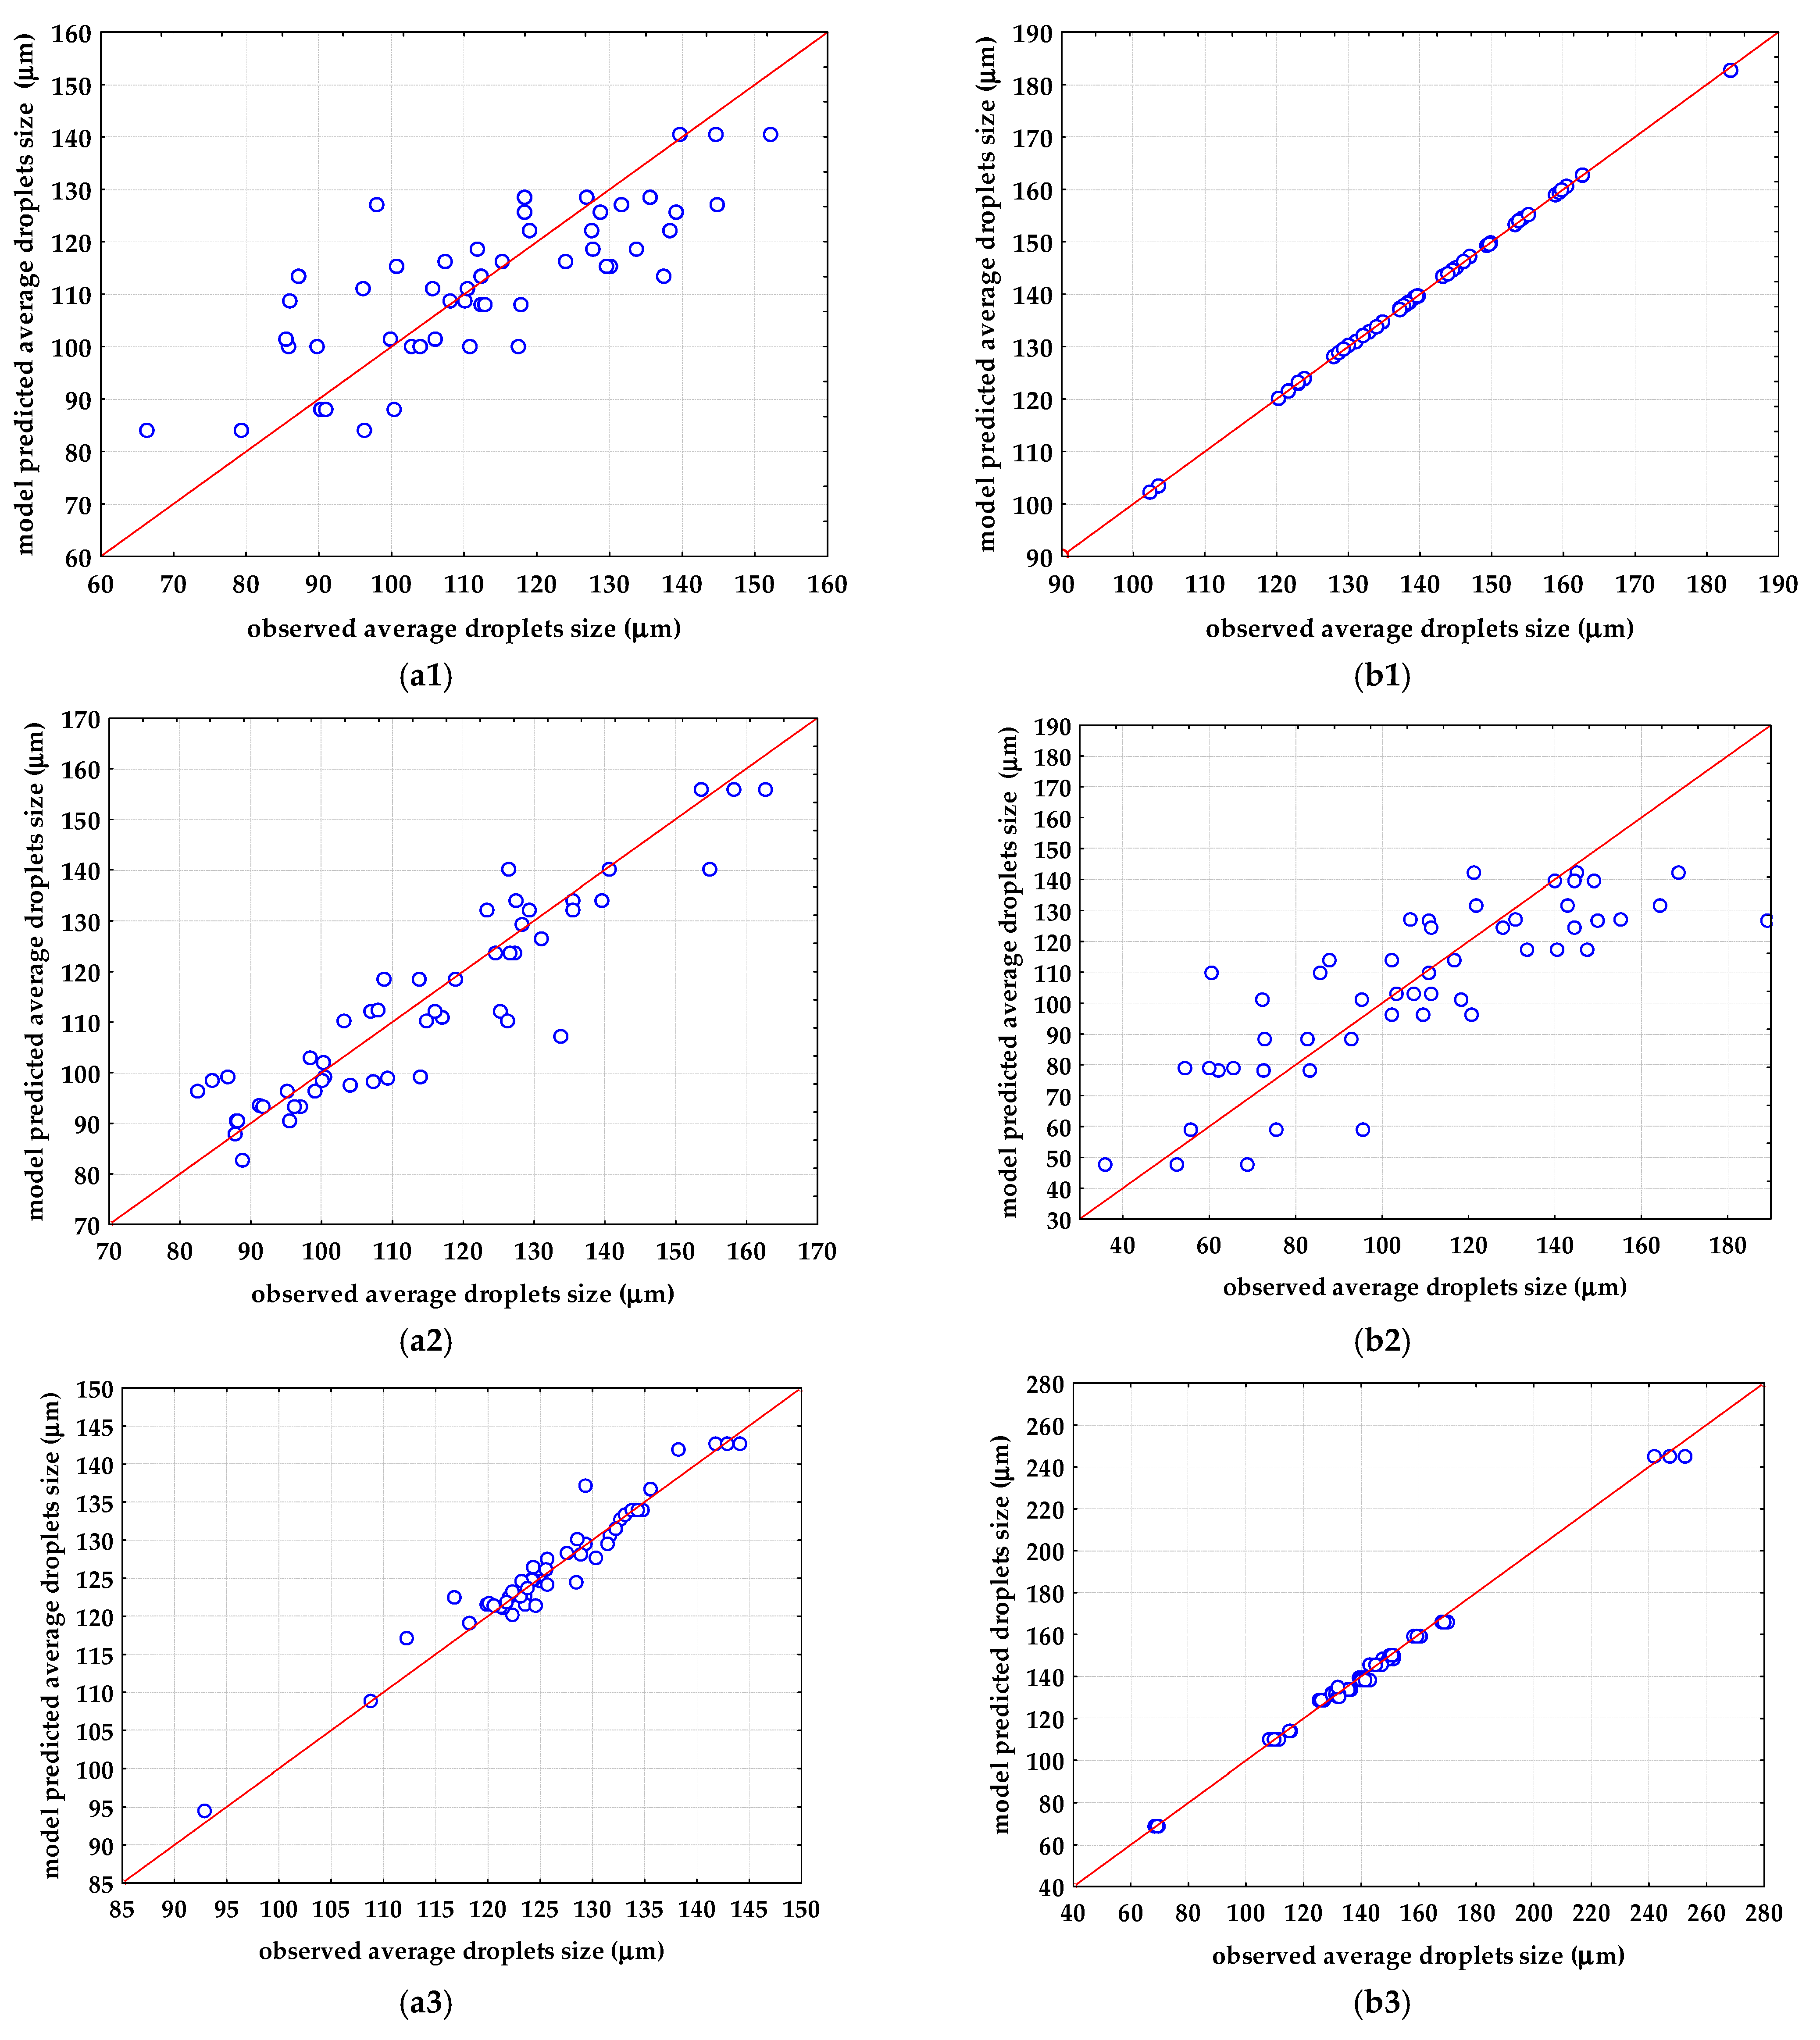
3.3. PLS Modeling of the Average Feret Diameters of Emulsions
3.4. ANN Modeling of the Average Feret Diameters of Emulsions
4. Conclusions
Author Contributions
Funding
Data Availability Statement
Conflicts of Interest
References
- Speisky, H.; Rocco, C.; Carrasco, C.; Lissi, E.A.; López-Alarcón, C. Antioxidant screening of medicinal herbal teas. Phytother. Res. 2006, 20, 462–467. [Google Scholar] [CrossRef] [PubMed]
- Ortega-Ramirez, L.A.; Rodriguez-Garcia, I.; Leyva, J.M.; Cruz-Valenzuela, M.R.; Silva-Espinoza, B.A.; Gonzalez-Aguilar, G.A.M.W.; Ayala-Zavala, J.F. Potential of medicinal plants as antimicrobial and antioxidant agents in food industry: A hypothesis. J. Food Sci. 2014, 79, R129–R137. [Google Scholar] [CrossRef] [PubMed]
- Al-Maqtari, Q.A.A.; Ghaleb, A.D.S.; Mahdi, A.A.; Al-Ansi, W.; Noman, A.E.; Wei, M.; Al-Adeeb, A.; Yao, W. Stabilization of water-in-oil emulsion of Pulicaria jaubertii extract by ultrasonication: Fabrication, characterization, and storage stability. Food Chem. 2021, 350, 129249. [Google Scholar] [CrossRef] [PubMed]
- Gothsch, T.; Finke, J.H.; Beinert, S.; Lesche, C.; Schur, J.; Buttgenbach, S.; Muller-Goymann, C.; Kwade, A. Effect of mi-crochannel geometry on high-pressure dispersion and emul-sification. Chem. Eng. Technol. 2011, 34, 335–343. [Google Scholar] [CrossRef]
- Komaiko, J.; Sastrosubroto, A.; McClements, D.J. Formation of oil-in-water emulsions from natural emulsifiers using spontaneous emulsification: Sunflower phospholipids. J. Agric. Food Chem. 2015, 63, 10078–10088. [Google Scholar] [CrossRef]
- Al-Bukhaiti, W.Q.; Noman, A.; Wang, H. Emulsions: Micro and nano-emulsions and their applications in industries—A mini-review. Int. J. Agric. Innov. Res. 2018, 7, 69–73. [Google Scholar]
- Jurkin, T.; Gotić, M. Uvod u mikroemulzije. Kem. Ind. 2013, 62, 389–399. [Google Scholar]
- Čulo, I.; Grgić, F.; Jurina, T.; Šalić, A.; Benković, M.; Valinger, D.; Gajdoš Kljusurić, J.; Jurinjak Tušek, A.; Zelić, B. Emulsification on a microscale: Faster, better, and more effective. Kem. Ind. 2022, 71, 653–659. [Google Scholar] [CrossRef]
- Adheeb Usaid, A.S.; Premkumar, J.; Ranganathan, T.V. Emulsion and it’s applications in food industry—A review. Int. J. Eng. Res. Appl. 2014, 4, 241–248. [Google Scholar]
- Jurinjak Tušek, A.; Jurina, T.; Čulo, I.; Valinger, D.; Gajdoš Kljusurić, J.; Benković, M. Application of NIRs coupled with PLS and ANN modelling to predict average droplet size in oil- in-water emulsions prepared with different microfluidic devices. Spectrochim. Acta A Mol. 2022, 270, 120860. [Google Scholar] [CrossRef]
- Goodarzi, F.; Zendehboudi, S. A comprehensive review on emulsions and emulsion stability in chemical and energy industries. Can. J. Chem. Eng. 2019, 97, 281–309. [Google Scholar] [CrossRef]
- Ravera, F.; Dziza, K.; Santini, E.; Cristofolini, L.; Liggieri, L. Emulsification and emulsion stability: The role of the interfacial properties. Adv. Colloid Interface Sci. 2021, 288, 102344. [Google Scholar] [CrossRef] [PubMed]
- Porras, M.; Solans, C.; González, C.; Gutiérrez, J.M. Properties of water-in-oil (W/O) nano-emulsions prepared by a low-energy emulsification method. Colloids Surf. A Physicochem. Eng. 2008, 324, 181–188. [Google Scholar] [CrossRef]
- Usón, N.; Garcia, M.J.; Solans, C. Formation of water-in-oil (W/O) nanoemulsions in a water/mixed non-ionic surfactant/oil systems prepared by a lowenergy emulsification method. Colloids Surf. A Physicochem. Eng. 2004, 250, 415–421. [Google Scholar] [CrossRef]
- Tadros, F.T. Emulsion formation, stability, and industrial application. In Emulsion, Formation, Industrial Applications; Tadros, F.T., Ed.; De Gruyter: Berlin, Germany, 2016; pp. 1–8. [Google Scholar]
- Hadžiabdić, J.; Orman, D.; Elezović, A.; Vranić, E.; Rahić, O. Preparation of nanoemulsions by high-energy and low-energy emulsification methods. IFMBE Proc. 2017, 62, 317–322. [Google Scholar] [CrossRef]
- Maan, A.A.; Nazir, A.; Khan, M.K.I.; Boom, R.; Shroen, K. Microfluidic emulsification in food processing. J. Food Eng. 2015, 147, 1–7. [Google Scholar] [CrossRef]
- Dobhal, A.; Kulkarni, A.; Dandekar, P.; Jain, R. A microreactor-based continuous process for controlled synthesis of poly-methyl-methacrylate-methacrylic acid (PMMA) nanoparticles. J. Mater. Chem. B 2017, 5, 3404–3417. [Google Scholar] [CrossRef]
- Khalid, N.; Kobayashi, I.; Neves, M.A.; Uemura, K.; Nakajima, M.; Nabetani, H. Microchannel emulsification study on formulation and stability characterization of monodisperse oil-in-water emulsions encapsulating quercetin. Food Chem. 2016, 212, 27–34. [Google Scholar] [CrossRef]
- Vladisavljević, G.; Al Nuumani, R.; Nabavi, S. Microfluidic production of multiple emulsions. Micromachines 2017, 8, 75. [Google Scholar] [CrossRef]
- Azarmanesh, M.; Bawazeer, S.; Mohamad, A.A.; Sanati-Nezhad, A. Rapid and highly controlled generation of monodisperse multiple emulsions via a onestep hybrid microfluidic device. Sci. Rep. 2019, 9, 12694. [Google Scholar] [CrossRef]
- Ibrahim, A.M.; Padovani, J.I.; Howe, R.T.; Anis, Y.H. Modeling of Droplet Generation in a Microfluidic Flow-Focusing Junction for Droplet Size Control. Micromachines 2021, 12, 590. [Google Scholar] [CrossRef] [PubMed]
- Vidovič, S.; Bizjak, A.; Sitar, A.; Horvat, M.; Janković, B.; Golobič, I. Development of a semi-empirical model for droplet size determination of a three-channel spray nozzle for pellet coating based on the optical method concept. Processes 2022, 10, 86. [Google Scholar] [CrossRef]
- Sohrabi, S.; Kassir, N.; Keshavarz Moraveji, M. Droplet microfluidics: Fundamentals and its advanced applications. RSC Adv. 2020, 23, 27560–27574. [Google Scholar] [CrossRef] [PubMed]
- Wang, M.; Kong, C.; Liang, Q.; Zhao, J.; Wen, M.; Xu, Z.; Ruan, X. Numerical simulations of wall contact angle effects on droplet size during step emulsification. RSC Adv. 2018, 8, 33042–33047. [Google Scholar] [CrossRef]
- Xu, J.H.; Li, S.W.; Lan, W.J.; Luo, G.S. Microfluidic approach for rapid interfacial tension measurement. Langmuir 2008, 24, 11287–11292. [Google Scholar] [CrossRef] [PubMed]
- Alade, O.S.; Mahmoud, M.; Al Shehri, D.A.; Sultan, A.S. Rapid determination of emulsion stability using turbidity measurement incorporating artificial neural network (ANN): Experimental validation using video/optical microscopy and kinetic modelling. ASC Omega 2021, 6, 5910–5920. [Google Scholar] [CrossRef] [PubMed]
- Bampi, M.; Scheer, A.D.P.; de Castilhos, F. Application of near infrared spectroscopy to predict the average droplet size and water content in biodiesel emulsions. Fuel 2013, 113, 546–552. [Google Scholar] [CrossRef]
- Borges, G.R.; Farias, G.B.; Braz, T.M.; Santos, L.M.; Amaral, M.J.; Fortuny, M.; Franceschi, E.; Dariva, C.; Santos, A.F. Use of near infrared for evaluation of droplet size distribution and water content in water-in-crude oil emulsions in pressurized pipeline. Fuel 2015, 147, 43–52. [Google Scholar] [CrossRef]
- Rizkin, B.A.; Popovic, F.G.; Hartman, R.L. Review article: Spectroscopic microreactors for heterogeneous catalysis. J. Vac. Sci. Technol. A 2019, 37, 050801. [Google Scholar] [CrossRef]
- Holroyd, S.E. The use of near infrared spectroscopy on milk and milk products. J. Near Infrared Spectrosc. 2013, 21, 311–322. [Google Scholar] [CrossRef]
- Grossi, M.; Di Lecce, G.; Arru, M.; Toschi, T.G.; Riccò, B. An opto-electronic system for in-situ determination of peroxide value and total phenol content in olive oil. J. Food Eng. 2015, 146, 1–7. [Google Scholar] [CrossRef]
- Zareef, M.; Chen, Q.; Hassan, M.M.; Arslan, M.; Hashim, M.M.; Ahmad, W.; Kutsanedzie, F.Y.H.; Agyekum, A.A. An Overview on the applications of typical non-linear algorithms coupled with NIR spectroscopy in food analysis. Food Eng. Rev. 2020, 12, 173–190. [Google Scholar] [CrossRef]
- Chen, Q.; Zhang, D.; Pan, W.; Ouyang, Q.; Li, H.; Urmila, K.; Zhao, J. Recent developments of green analytical techniques in analysis of tea’s quality and nutrition. Trends Food Sci. Technol. 2015, 43, 63–82. [Google Scholar] [CrossRef]
- Wulandari, L.; Retnaningtyas, Y.; Lukman, H. Analysis of flavonoid in medicinal plant extract using infrared spectroscopy and chemometrics. J. Anal. Methods Chem. 2016, 2016, 4696803. [Google Scholar] [CrossRef] [PubMed]
- Valinger, D.; Kušen, M.; Jurinjak Tušek, A.; Panić, M.; Jurina, T.; Benković, M.; Radojčić Redovniković, I.; Gajdoš Kljusurić, J. Development of near infrared spectroscopy models for quantitative prediction of the content of bioactive compounds in olive leaves. Chem. Biochem. Eng. Q. 2018, 32, 535–543. [Google Scholar] [CrossRef]
- Valinger, D.; Longin, L.; Grbeš, F.; Banković, M.; Jurina, T.; Gajdoš Kljusurić, J.; Jurinjak Tušek, A. Detection of honey adulteration—The potential of UV-VIS and NIR spectroscopy coupled with multivariate analysis. LWT 2021, 145, 111316. [Google Scholar] [CrossRef]
- Fang, Z.; Bhandari, B. Encapsulation of polyphenols-A review. Trends Food Sci. Tech. 2010, 21, 510–523. [Google Scholar] [CrossRef]
- Grgić, F.; Benković, M.; Valinger, D.; Jurina, T.; Gajodš Kljusurić, J.; Jurinjak Tušek, A. Macro-batch and continuously operated microfluidic emulsification—Differences, Similarities and Optimization. Processes 2022, 10, 449. [Google Scholar] [CrossRef]
- Shah, R.K.; Shzm, H.C.; Rowat, A.C.; Lee, D.; Agresti, J.J.; Utada, A.S.; Chu, L.-Y.; Kim, J.-W.; Fernadez-Nieves, A.; Martinez, C.J.; et al. Designer emulsions using microfluidics. Mater. Today 2008, 11, 18–27. [Google Scholar] [CrossRef]
- Wang, J.; Li, Y.; Wang, X.; Wang, J.; Tian, H.; Zhao, P.; Tian, Y.; Gu, Y.; Wang, L.; Wang, C. Droplet microfluidics for the production of microparticles and nanoparticles. Micromachines 2017, 8, 22. [Google Scholar] [CrossRef]
- Park, D.; Kim, H.; Kim, J.W. Microfluidic production of monodisperse emulsions for cosmetics. Biomicrofluidics 2021, 15, 051302. [Google Scholar] [CrossRef] [PubMed]
- Bi, Y.; Yuan, K.; Xiao, W.; Jizhoug, W.; Shi, C.; Chu, G.; Zhang, G.; Zhiu, G. A local pre-processing method for near-infrared spectra, combined with spectral segmentation and standard normal variate transformation. Anal. Chim. Acta 2016, 909, 30–40. [Google Scholar] [CrossRef] [PubMed]
- Grisanti, E.; Totska, M.; Huber, S.; Calderon, C.K.; Hohmann, M.; Lingenfelser, D.; Otto, M. Dynamic localized SNV, Peak SNV, and partial peak SNV: Novel standardization methods for preprocessing of spectroscopic data used in predictive modeling. J. Spectrosc. 2018, 2018, 5037572. [Google Scholar] [CrossRef]
- Sohn, S.-I.; Pandian, S.; Oh, Y.-J.; Zaukuu, J.-L.Z.; Na, C.-S.; Lee, Y.-H.; Shin, E.-K.; Kang, H.-J.; Ryu, T.-H.; Cho, W.-S.; et al. Vis-NIR spectroscopy and machine learning methods for the discrimination of transgenic Brassica napus L. and their hybrids with B. juncea. Processes 2022, 10, 240. [Google Scholar] [CrossRef]
- Feng, X.; Peng, C.; Chen, Y.; Liu, X.; Feng, X.; He, Y. Discrimination of CRISPR/Cas9-induced mutants of rice seeds using near-infrared hyperspectral imaging. Sci. Rep. 2017, 7, 15934. [Google Scholar] [CrossRef]
- Rinnan, Å.; van den Berg, F.; Engelsen, S.B. Review of the most common pre-processing techniques for near-infrared spectra. TrAC Trend Anal. Chem. 2009, 28, 1201–1222. [Google Scholar] [CrossRef]
- Winding, W.; Shaver, J.; Bro, R. Loopy MSC: A simple way to improve multiplicative scatter correction. J. Appl. Spectrospc. 2008, 62, 1153–1159. [Google Scholar] [CrossRef]
- Basile, T.; Marsico, A.D.; Perniola, R. Use of Artificial Neural Networks and NIR Spectroscopy for Non-Destructive Grape Texture Prediction. Foods 2022, 11, 281. [Google Scholar] [CrossRef]
- Balage, J.M.; e Silva, S.D.L.; Gomide, C.A.; Bonin Mde, N.; Figueira, A.C. Predicting pork quality using Vis/NIR spectroscopy. Meat Sci. 2015, 108, 37–43. [Google Scholar] [CrossRef]
- Zhang, F.; Zhang, R.; Ge, J.; Chen, W.; Yang, W.; Du, Y. Calibration transfer based on the weight matrix (CTWM) of PLS for near infrared (NIR) spectral analysis. Anal. Methods 2018, 10, 2169–2179. [Google Scholar] [CrossRef]
- Dinache, A.; Tozar, T.; Smarandache, A.; Andrei, I.R.; Nistorescu, S.; Nastasa, V.; Staicu, A.; Pascu, M.-L.; Romanitan, M.O. Spectroscopic characterization of emulsions generated with a new laser-assisted device. Molecules 2020, 25, 1729. [Google Scholar] [CrossRef] [PubMed]
- Kawasaki, A.; Kawamura, G.; Zin, W.W. A local level relationship between floods and poverty: A case in Myanmar. Int. J. Disaster Risk Reduct. 2020, 42, 101348. [Google Scholar] [CrossRef]
- Rambo, M.K.D.; Ferreira, M.M.C.; de Melo, P.M.; Santana Junior, C.C.; Bertuol, D.A.; Rambo, M.C.D. Prediction of quality parameters of food residues using NIR spectroscopy and PLS models based on proximate analysis. Food Sci. Technol. 2020, 40, 444–450. [Google Scholar] [CrossRef]
- Hayati, R.; Zulfahrizal, Z.; Munawar, A. A Robust prediction performance of inner quality attributes in intact cocoa beans using near infrared spectroscopy and multivariate analysis. Heliyon 2021, 7, e06286. [Google Scholar] [CrossRef] [PubMed]
- Willimas, P.C.; Sobering, D.C. Comparison of commercial near infrared transmittance and reflectance instruments for analysis of whole grains and seeds. J. Near Infrared Spectrosc. 2010, 1, 25–32. [Google Scholar] [CrossRef]
- Parrini, S.; Staglianò, N.; Bozzi, R.; Argenti, G. Can grassland chemical quality be quantified using transform near-infrared spectroscopy? Animals 2022, 12, 86. [Google Scholar] [CrossRef]
- Eskildsen, E.C.; Næs, T. Sample-specific prediction error measures in spectroscopy. Appl. Spectrosc. 2020, 74, 791–798. [Google Scholar] [CrossRef]
- Mishra, P.; van Dijk, M.; Wintermeyer, C.; Sabater, C.; Bot, A.; Verkleij, T.; Broeze, J. At-line and inlin epredisction of droplet size in mayonnaise with near-infrared spectroscopy. Infrared Phys. Technol. 2022, 123, 104155. [Google Scholar] [CrossRef]
- Amsaraj, R.; Ambade, N.D.; Muzzuri, S. Variable selection coupled to PLS2, ANN and SVM for simultaneous detection of multiple adulterants in milk using spectral data. Int. Dairy J. 2021, 123, 105172. [Google Scholar] [CrossRef]
- Lin, M.B.; Groves, W.A.; Freivalds, A.; Lee, E.G.; Harper, M. Comparison of artificial neural network (ANN) and partial least squares (PLS) regression models for predicting respiratory ventilation: An exploratory study. Eur. J. Appl. Physiol. 2012, 112, 1603–1611. [Google Scholar] [CrossRef]
- Panagou, E.Z.; Mohareb, F.R.; Argyri, A.A.; Bessant, C.B.; Nychas, G.-J.E. A comparison of artificial neural networks and partial least squares modelling for the rapid detection of the microbial spoilage of beef fillets based on Fourier transform infrared spectral fingerprints. Food Microbiol. 2011, 28, 782–790. [Google Scholar] [CrossRef] [PubMed]
- Tekin, Y.; Tűmsavas, Z.; Mouazen, A.M. Comparing the artificial neural network with partial least squares for prediction of soil organic carbon and pH at different moisture content levels using visible and near-infrared spectroscopy. Rev. Bras. Ciênc. Solo. 2014, 38, 1794–1804. [Google Scholar] [CrossRef]
- Salehi, M.; Zare, A.; Taheri, A. Artificial neural networks (ANNs) and partial least squares (PLS) regression in the quantitative analysis of respirable crystalline silica by Fourier-transform infrared spectroscopy (FTIR). Ann. Work Expo. Health 2021, 65, 346–357. [Google Scholar] [CrossRef] [PubMed]

 ) and oil-in-aqueous mint extract emulsions (
 ). (a1,b1) PEG 1500, (a2,b2) PEG 6000, (a3,b3) PEG 20,000.
) and oil-in-aqueous mint extract emulsions (). (a1,b1) PEG 1500, (a2,b2) PEG 6000, (a3,b3) PEG 20,000.
). (a1,b1) PEG 1500, (a2,b2) PEG 6000, (a3,b3) PEG 20,000.
) and oil-in-aqueous mint extract emulsions (). (a1,b1) PEG 1500, (a2,b2) PEG 6000, (a3,b3) PEG 20,000.

 PEG 1500,
  PEG 6000,
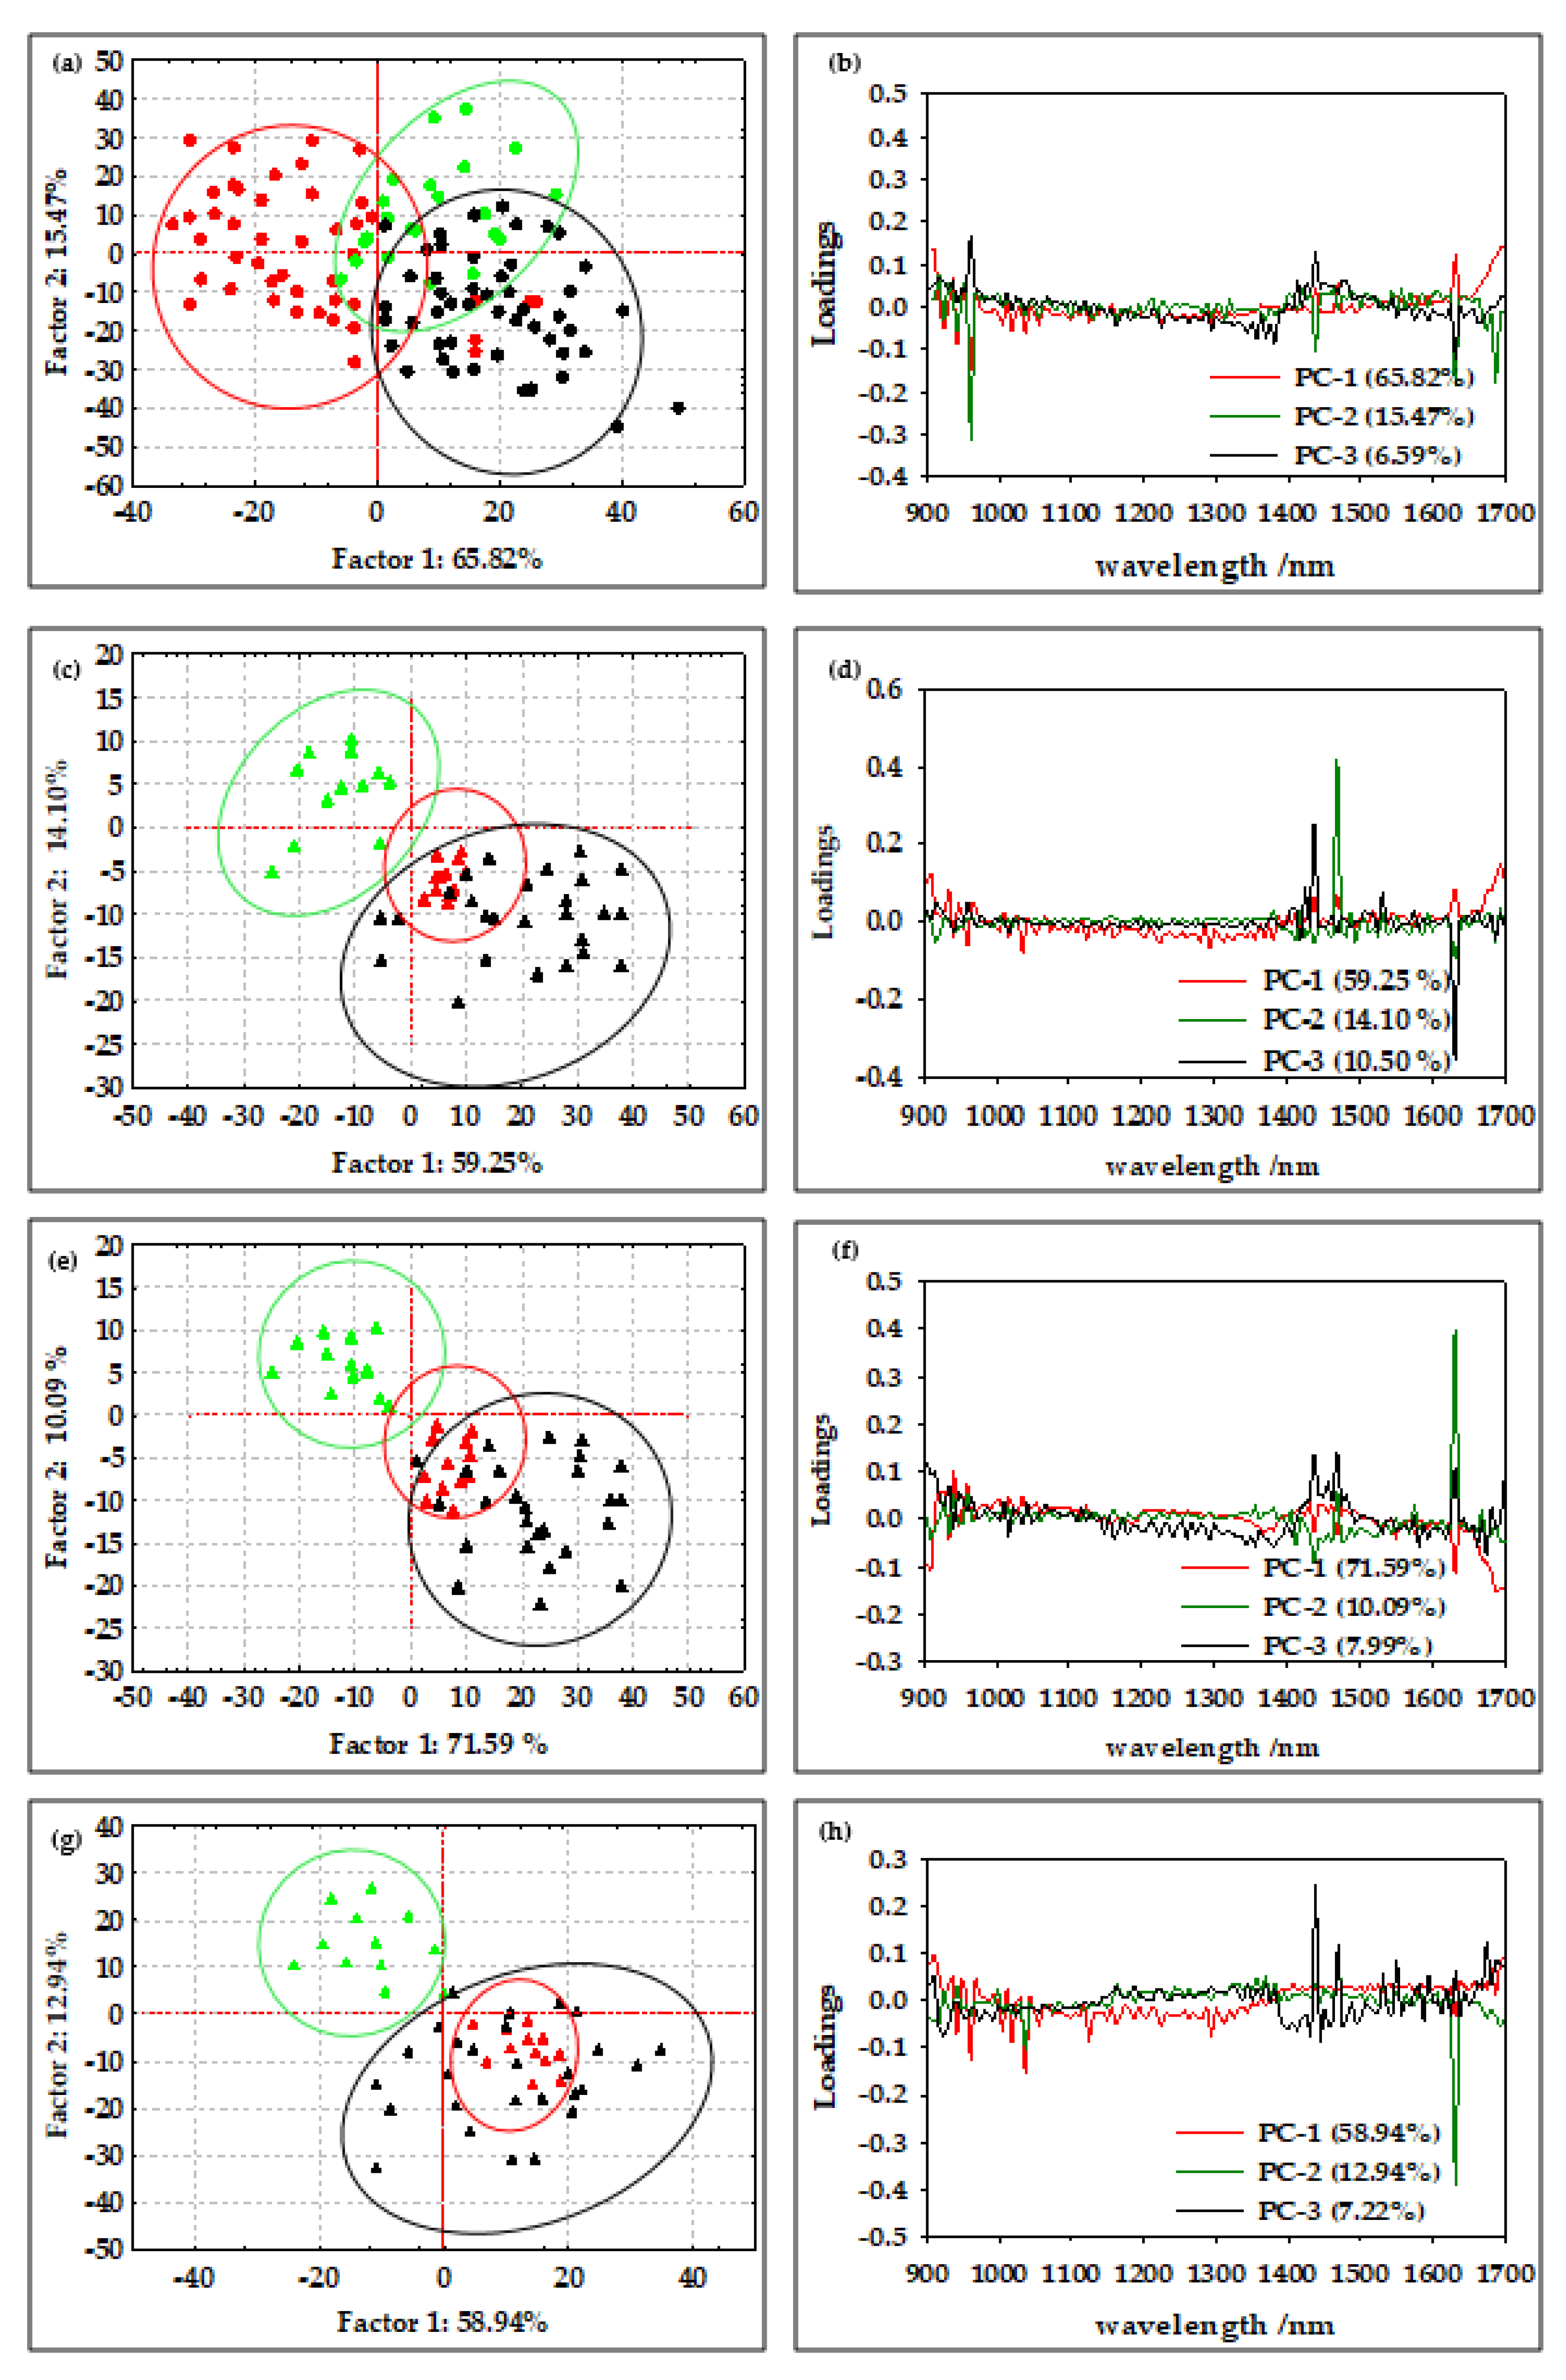
  PEG 20,000). (b) PCA loading of all average oil-in-water emulsion NIR spectra after SNV preprocessing. PCA score plot of NIR spectra of oil-in-water emulsion NIR spectra after SNV preprocessing with (c) PEG 1500, (e) PEG 6000, and (g) PEG 20,000 (
 2% emulsifier,
  4% emulsifier,
  6% emulsifier). PCA loading of NIR spectra of oil-in water emulsion NIR spectra after SNV preprocessing with (d) PEG 1500, (f) PEG 6000, and (h) PEG 20,000.
PEG 1500, PEG 6000, PEG 20,000). (b) PCA loading of all average oil-in-water emulsion NIR spectra after SNV preprocessing. PCA score plot of NIR spectra of oil-in-water emulsion NIR spectra after SNV preprocessing with (c) PEG 1500, (e) PEG 6000, and (g) PEG 20,000 ( 2% emulsifier, 4% emulsifier, 6% emulsifier). PCA loading of NIR spectra of oil-in water emulsion NIR spectra after SNV preprocessing with (d) PEG 1500, (f) PEG 6000, and (h) PEG 20,000.
6% emulsifier). PCA loading of NIR spectra of oil-in water emulsion NIR spectra after SNV preprocessing with (d) PEG 1500, (f) PEG 6000, and (h) PEG 20,000.
PEG 1500, PEG 6000, PEG 20,000). (b) PCA loading of all average oil-in-water emulsion NIR spectra after SNV preprocessing. PCA score plot of NIR spectra of oil-in-water emulsion NIR spectra after SNV preprocessing with (c) PEG 1500, (e) PEG 6000, and (g) PEG 20,000 ( 2% emulsifier, 4% emulsifier, 6% emulsifier). PCA loading of NIR spectra of oil-in water emulsion NIR spectra after SNV preprocessing with (d) PEG 1500, (f) PEG 6000, and (h) PEG 20,000. PEG 1500, PEG 6000, PEG 20,000). (b) PCA loading of all average oil-in-aqueous mint extract emulsion NIR spectra after MSC preprocessing. PCA score plot of NIR spectra of oil-in-aqueous mint extract emulsion NIR spectra after SNV preprocessing with (c) PEG 1500, (e) PEG 6000, and (g) PEG 20,000 ( 2% emulsifier, 4% emulsifier, 6% emulsifier). PCA loading of NIR spectra of oil-in-aqueous mint extract emulsion NIR spectra after SNV preprocessing with (d) PEG 1500, (f) PEG 6000, and (h) PEG 20,000.
PEG 1500, PEG 6000, PEG 20,000). (b) PCA loading of all average oil-in-aqueous mint extract emulsion NIR spectra after MSC preprocessing. PCA score plot of NIR spectra of oil-in-aqueous mint extract emulsion NIR spectra after SNV preprocessing with (c) PEG 1500, (e) PEG 6000, and (g) PEG 20,000 ( 2% emulsifier, 4% emulsifier, 6% emulsifier). PCA loading of NIR spectra of oil-in-aqueous mint extract emulsion NIR spectra after SNV preprocessing with (d) PEG 1500, (f) PEG 6000, and (h) PEG 20,000.
PEG 1500, PEG 6000, PEG 20,000). (b) PCA loading of all average oil-in-aqueous mint extract emulsion NIR spectra after MSC preprocessing. PCA score plot of NIR spectra of oil-in-aqueous mint extract emulsion NIR spectra after SNV preprocessing with (c) PEG 1500, (e) PEG 6000, and (g) PEG 20,000 ( 2% emulsifier, 4% emulsifier, 6% emulsifier). PCA loading of NIR spectra of oil-in-aqueous mint extract emulsion NIR spectra after SNV preprocessing with (d) PEG 1500, (f) PEG 6000, and (h) PEG 20,000.


| Exp. | Emulsifier Concentration (%) | Oil Concentration (%) | Total Flow Rate (µL/min) |
|---|---|---|---|
| 1. | 2 (−1) | 30 (0) | 200 (−1) |
| 2. | 6 (1) | 30 (0) | 200 (−1) |
| 3. | 2 (−1) | 30 (0) | 400 (1) |
| 4. | 6 (1) | 30 (0) | 400 (1) |
| 5. | 2 (−1) | 25 (−1) | 300 (0) |
| 6. | 6 (1) | 25 (−1) | 300 (0) |
| 7. | 2 (−1) | 35 (1) | 300 (0) |
| 8. | 6 (1) | 35 (1) | 300 (0) |
| 9. | 4 (0) | 25 (−1) | 200 (−1) |
| 10. | 4 (0) | 25 (−1) | 400 (1) |
| 11. | 4 (0) | 35 (1) | 200 (−1) |
| 12. | 4 (0) | 35 (1) | 400 (1) |
| 13. | 4 (0) | 30 (0) | 300 (0) |
| 14. | 4 (0) | 30 (0) | 300 (0) |
| 15. | 4 (0) | 30 (0) | 300 (0) |
| 16. | 4 (0) | 30 (0) | 300 (0) |
| 17. | 4 (0) | 30 (0) | 300 (0) |
| Emulsifier | Pretreatment | R2cal | RSEC | R2val | RMSECV | R2pred | RMSEP | Bias | RPD | RER |
|---|---|---|---|---|---|---|---|---|---|---|
| PEG 1500 | No | 0.6900 | 11.3085 | 0.5496 | 14.5378 | 0.5357 | 13.5556 | 6.2689 | 1.6265 | 9.2493 |
| SG1 | 0.5803 | 13.1587 | 0.4589 | 15.6916 | 0.3509 | 14.5654 | 5.2033 | 1.5138 | 8.6081 | |
| SNV | 0.6863 | 11.3765 | 0.5617 | 13.4810 | 0.4618 | 13.4267 | 6.8044 | 1.6421 | 9.3381 | |
| MSC | 0.6891 | 11.4375 | 0.5154 | 14.2484 | 0.4582 | 14.8875 | 6.8439 | 1.4810 | 8.4218 | |
| SG1-SNV | 0.6105 | 12.6752 | 0.4871 | 15.2877 | 0.3640 | 16.9920 | 1.1515 | 1.2976 | 7.3788 | |
| SG1-MSC | 0.6127 | 12.6396 | 0.4479 | 15.2402 | 0.2065 | 18.5027 | 1.6547 | 1.1916 | 6.7763 | |
| PEG 6000 | No | 0.9467 | 4.6815 | 0.5865 | 13.2891 | 0.5874 | 13.0513 | 2.2884 | 1.6805 | 7.4023 |
| SG | 0.9575 | 4.1833 | 0.7304 | 11.9565 | 0.4831 | 14.8774 | 1.5755 | 1.4742 | 6.4937 | |
| SNV | 0.9601 | 4.0536 | 0.6204 | 13.0093 | 0.6254 | 12.4360 | 2.5424 | 1.7636 | 7.7686 | |
| MSC | 0.9587 | 4.1230 | 0.6239 | 12.6438 | 0.5862 | 13.0704 | 2.2782 | 1.6780 | 7.3915 | |
| SG1-SNV | 0.9567 | 1.0402 | 0.8733 | 2.7853 | 0.6105 | 13.2121 | 2.4787 | 1.6600 | 7.3122 | |
| SG1-MSC | 0.9459 | 4.7151 | 0.6572 | 12.0521 | 0.6915 | 14.8931 | 2.1356 | 1.4727 | 6.4869 | |
| PEG 20,000 | No | 0.9766 | 1.5039 | 0.5695 | 7.1978 | 0.5534 | 5.2628 | 4.8615 | 2.4455 | 13.2401 |
| SG1 | 0.7898 | 4.5089 | 0.3751 | 8.3623 | 0.3963 | 11.5998 | 1.8105 | 1.1095 | 6.0070 | |
| SNV | 0.9692 | 1.757 | 0.8740 | 7.4639 | 0.8692 | 1.7257 | 1.7257 | 7.4581 | 9.3778 | |
| MSC | 0.9682 | 1.7532 | 0.4821 | 7.2293 | 0.5117 | 6.1176 | 2.7696 | 2.1038 | 11.3901 | |
| SG1-SNV | 0.9991 | 0.3024 | 0.9973 | 0.5394 | 0.9165 | 1.8562 | 2.8638 | 6.9337 | 37.5391 | |
| SG1-MSC | 0.7853 | 4.5565 | 0.3304 | 8.4233 | 0.3808 | 11.7133 | 1.1713 | 1.0988 | 5.9488 | |
| PEG 1500 | No | 0.8412 | 4.8959 | 0.6454 | 7.5579 | 0.6901 | 10.2962 | 0.4921 | 1.4379 | 7.8740 |
| SG1 | 0.8296 | 5.0706 | 0.6613 | 8.0253 | 0.4400 | 17.1542 | 4.1051 | 0.8631 | 4.7261 | |
| SNV | 0.8385 | 4.9369 | 0.6262 | 7.2036 | 0.7261 | 9.7119 | 0.4814 | 1.5244 | 8.2477 | |
| MSC | 0.8319 | 5.0366 | 0.6620 | 7.3342 | 0.7234 | 9.7707 | 0.4076 | 1.5153 | 8.2975 | |
| SG1-SNV | 0.8385 | 4.9369 | 0.6221 | 7.2793 | 0.7261 | 9.7119 | 0.4814 | 1.5244 | 8.1477 | |
| SG1-MSC | 0.8317 | 5.0404 | 0.5182 | 8.6245 | 0.4607 | 19.9587 | 7.4658 | 0.7418 | 4.0620 | |
| PEG 6000 | No | 0.8931 | 9.3504 | 0.4184 | 22.1524 | 0.5524 | 27.0695 | 1.9972 | 1.3227 | 5.6627 |
| SG1 | 0.8661 | 10.4682 | 0.1864 | 25.5765 | 0.1678 | 41.4123 | 6.4073 | 0.8646 | 3.7015 | |
| SNV | 0.8932 | 9.3476 | 0.5232 | 21.0092 | 0.5576 | 26.8832 | 2.1530 | 1.3319 | 5.7019 | |
| MSC | 0.8934 | 9.3411 | 0.5017 | 20.5099 | 0.5587 | 26.8457 | 2.1110 | 1.3337 | 5.7099 | |
| SG1-SNV | 0.8802 | 9.9017 | 0.2595 | 23.7959 | 0.1396 | 48.6993 | 6.5399 | 0.7352 | 3.1476 | |
| SG1-MSC | 0.9034 | 8.8882 | 0.2949 | 24.0148 | 0.2087 | 48.2772 | 5.8181 | 0.7417 | 3.1751 | |
| PEG 20,000 | No | 0.5648 | 23.0535 | 0.3161 | 31.0397 | 0.2218 | 29.6369 | 5.7822 | 1.1706 | 6.2226 |
| SG | 0.6155 | 21.6689 | 0.2418 | 31.2997 | 0.2004 | 33.8383 | 3.9401 | 1.0253 | 5.4500 | |
| SNV | 0.5891 | 22.4006 | 0.3106 | 29.2811 | 0.2393 | 29.3017 | 6.0420 | 1.1840 | 6.2938 | |
| MSC | 0.8109 | 15.1972 | 0.5123 | 24.1765 | 0.7062 | 18.6126 | 3.5765 | 1.8640 | 9.9083 | |
| SG-SNV | 0.7916 | 15.9512 | 0.4772 | 30.3806 | 0.1364 | 41.0687 | 8.9847 | 0.8448 | 4.4905 | |
| SG-MSC | 0.9894 | 3.5941 | 0.4334 | 31.4240 | 0.1064 | 44.1265 | 9.0842 | 0.7862 | 4.1793 |
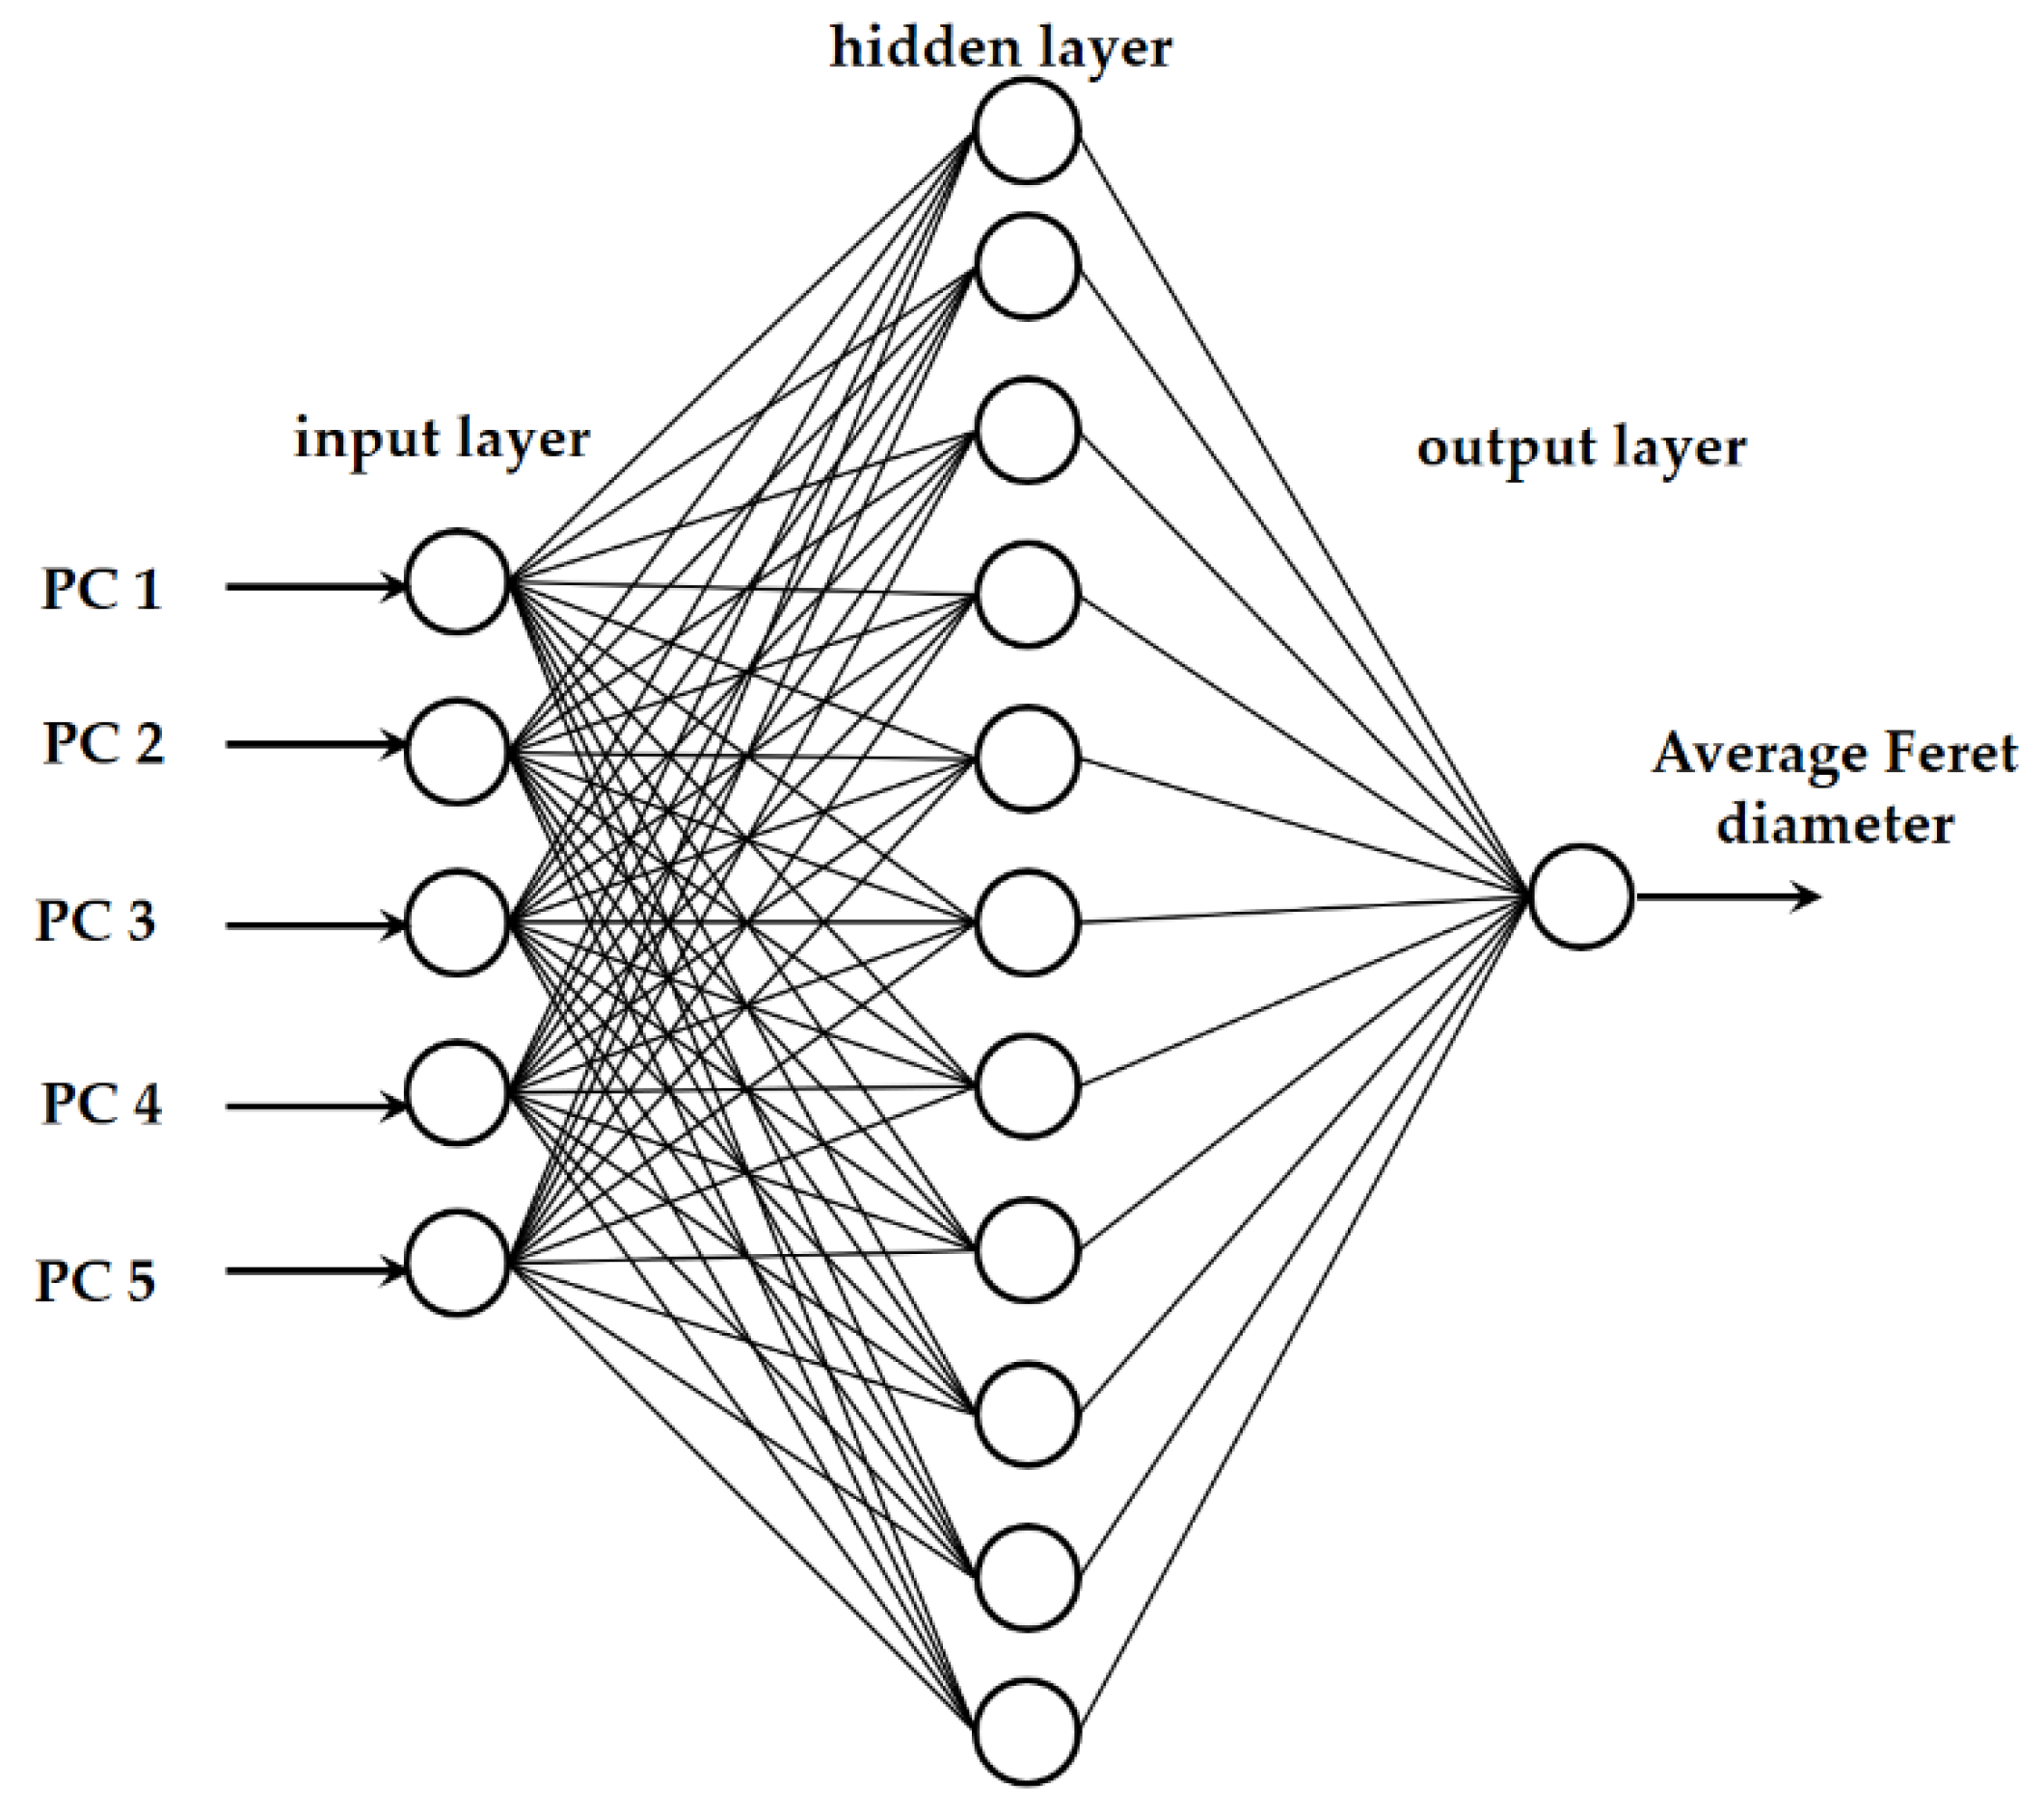
| Emulsifier/ Pretreatment | MLP | Training Perf./ Training Error | Test Perf./ Test Error | Validation Perf./ Validation Error | Hidden Activation | Output Activation |
|---|---|---|---|---|---|---|
| PEG 1500/ SNV | MLP 5-10-1 | 0.9843 0.0073 | 0.8085 0.0101 | 0.7443 0.0128 | Identity | Exponential |
| MLP 5-9-1 | 0.9844 0.0041 | 0.8496 0.0100 | 0.7364 0.0161 | Identity | Identity | |
| MLP 5-10-1 | 0.9828 0.0058 | 0.8508 0.0125 | 0.7348 0.0172 | Exponential | Exponential | |
| MLP 5-8-1 | 0.9836 0.0072 | 0.8515 0.0079 | 0.7615 0.0121 | Logistic | Identity | |
| MLP 5-5-1 | 0.9835 0.0032 | 0.8115 0.0120 | 0.7358 0.0166 | Exponential | Exponential | |
| PEG 6000/ SNV | MLP 5-4-1 | 0.9374 0.0048 | 0.9083 0.0064 | 0.7160 0.0074 | Tanh | Exponential |
| MLP 5-8-1 | 0.9428 0.0044 | 0.8675 0.0044 | 0.7377 0.0119 | Exponential | Identity | |
| MLP 5-8-1 | 0.9270 0.0056 | 0.8551 0.0056 | 0.7094 0.0145 | Tanh | Identity | |
| MLP 5-8-1 | 0.9261 0.0057 | 0.8287 0.0057 | 0.7176 0.0149 | Exponential | Exponential | |
| MLP 5-6-1 | 0.9297 0.0054 | 0.8689 0.0054 | 0.7101 0.0103 | Exponential | Exponential | |
| PEG 20000/ SNV | MLP 5-7-1 | 0.9912 0.0003 | 0.7979 0.0028 | 0.7501 0.0061 | Exponential | Exponential |
| MLP 5-4-1 | 0.8970 0.0036 | 0.8056 0.0052 | 0.7808 0.0064 | Exponential | Identity | |
| MLP 5-7-1 | 0.8329 0.0046 | 0.8036 0.0043 | 0.7844 0.0068 | Logistic | Tanh | |
| MLP 5-7-1 | 0.8154 0.0043 | 0.8042 0.0054 | 0.6151 0.0091 | Logistic | Tanh | |
| MLP 5-5-1 | 0.9917 0.0002 | 0.9294 0.00184 | 0.8533 0.0027 | Exponential | Exponential | |
| PEG 1500/ MSC | MLP 5-11-1 | 0.9998 0.0002 | 0.9994 0.0005 | 0.9985 0.0015 | Exponential | Identity |
| MLP 5-11-1 | 0.9993 0.0007 | 0.9988 0.0012 | 0.9972 0.0028 | Exponential | Identity | |
| MLP 5-10-1 | 0.9966 0.0034 | 0.9921 0.0079 | 0.9920 0.0080 | Exponential | Identity | |
| MLP 5-11-1 | 0.9997 0.0003 | 0.9996 0.0004 | 0.9993 0.0007 | Logistic | Identity | |
| MLP 5-8-1 | 0.9996 0.0004 | 0.9994 0.0006 | 0.9995 0.0005 | Logistic | Identity | |
| PEG 6000/ MSC | MLP 5-3-1 | 0.9516 0.0044 | 0.9311 0.0075 | 0.8113 0.0096 | Tanh | Logistic |
| MLP 5-11-1 | 0.9227 0.0042 | 0.8667 0.0086 | 0.7257 0.0185 | Tanh | Tanh | |
| MLP 5-10-1 | 0.7311 0.0092 | 0.7104 0.0128 | 0.6716 0.0167 | Logistic | Logistic | |
| MLP 5-5-1 | 0.7693 0.0092 | 0.7285 0.0113 | 0.7182 0.0142 | Tanh | Logistic | |
| MLP 5-4-1 | 0.8271 0.0087 | 0.7577 0.0125 | 0.7192 0.0128 | Tanh | Logistic | |
| PEG 20000/ MSC | MLP 5-5-1 | 0.9924 0.0003 | 0.8273 0.0031 | 0.6731 0.0091 | Logistic | Identity |
| MLP 5-5-1 | 0.9990 0.0003 | 0.9915 0.005 | 0.9978 0.0008 | Exponential | Tanh | |
| MLP 5-9-1 | 0.9868 0.0001 | 0.9691 0.0007 | 0.9528 0.0016 | Exponential | Logistic | |
| MLP 5-5-1 | 0.9969 0.0004 | 0.7644 0.0055 | 0.7234 0.0084 | Logistic | Logistic | |
| MLP 5-11-1 | 0.9908 0.0005 | 0.9392 0.0006 | 0.9281 0.0023 | Exponential | Identity |
Publisher’s Note: MDPI stays neutral with regard to jurisdictional claims in published maps and institutional affiliations. |
© 2022 by the authors. Licensee MDPI, Basel, Switzerland. This article is an open access article distributed under the terms and conditions of the Creative Commons Attribution (CC BY) license (https://creativecommons.org/licenses/by/4.0/).
Share and Cite
Grgić, F.; Jurina, T.; Valinger, D.; Gajdoš Kljusurić, J.; Jurinjak Tušek, A.; Benković, M. Near-Infrared Spectroscopy Coupled with Chemometrics and Artificial Neural Network Modeling for Prediction of Emulsion Droplet Diameters. Micromachines 2022, 13, 1876. https://doi.org/10.3390/mi13111876
Grgić F, Jurina T, Valinger D, Gajdoš Kljusurić J, Jurinjak Tušek A, Benković M. Near-Infrared Spectroscopy Coupled with Chemometrics and Artificial Neural Network Modeling for Prediction of Emulsion Droplet Diameters. Micromachines. 2022; 13(11):1876. https://doi.org/10.3390/mi13111876
Chicago/Turabian StyleGrgić, Filip, Tamara Jurina, Davor Valinger, Jasenka Gajdoš Kljusurić, Ana Jurinjak Tušek, and Maja Benković. 2022. "Near-Infrared Spectroscopy Coupled with Chemometrics and Artificial Neural Network Modeling for Prediction of Emulsion Droplet Diameters" Micromachines 13, no. 11: 1876. https://doi.org/10.3390/mi13111876
APA StyleGrgić, F., Jurina, T., Valinger, D., Gajdoš Kljusurić, J., Jurinjak Tušek, A., & Benković, M. (2022). Near-Infrared Spectroscopy Coupled with Chemometrics and Artificial Neural Network Modeling for Prediction of Emulsion Droplet Diameters. Micromachines, 13(11), 1876. https://doi.org/10.3390/mi13111876