Abstract
Flavin adenine dinucleotide (FAD) is a coenzyme and acts as a redox cofactor in metabolic process. Owing to such problems as poor electron transfer properties, unfavorable adsorption, and lack of stability on rigid electrodes, the bio-electrochemical applications of FAD have been limited. Herein, a novel fabrication method was developed for the immobilization process using 2D MXene (Ti3C2Tx), which enhanced the redox property of FAD and improved the electro-catalytic reduction of hydrogen peroxide (H2O2) in neutral medium. The FAD-immobilized Ti3C2Tx electrode (FAD/Ti3C2Tx) was studied by UV-Visible and Raman spectroscopies, which confirmed the successful adsorption of FAD on the Ti3C2Tx surface. The surface morphology and the elemental composition of Ti3C2Tx were investigated by high resolution transmission electron microscopy and the energy dispersive X-ray analysis. The redox property of the FAD/Ti3C2Tx modified glassy carbon electrode (FAD/Ti3C2Tx/GCE) was highly dependent on pH and exhibited a stable redox peak at −0.455 V in neutral medium. Higher amounts of FAD molecules were loaded onto the 2D MXene (Ti3C2Tx)-modified electrode, which was two times higher than the values in the reported work, and the surface coverage (ᴦFAD) was 0.8 × 10⁻¹⁰ mol/cm2. The FAD/Ti3C2Tx modified sensor showed the electrocatalytic reduction of H2O2 at −0.47 V, which was 130 mV lower than the bare electrode. The FAD/Ti3C2Tx/GCE sensor showed a linear detection of H2O2 from 5 nM to 2 µM. The optimization of FAD deposition, amount of Ti3C2Tx loading, effect of pH and the interference study with common biochemicals such as glucose, lactose, dopamine (DA), potassium chloride (KCl), ascorbic acid (AA), amino acids, uric acid (UA), oxalic acid (OA), sodium chloride (NaCl) and acetaminophen (PA) have been carried out. The FAD/Ti3C2Tx/GCE showed high selectivity and reproducibility. Finally, the FAD/Ti3C2Tx modified electrode was successfully applied to detect H2O2 in ovarian cancer cell lines.
1. Introduction
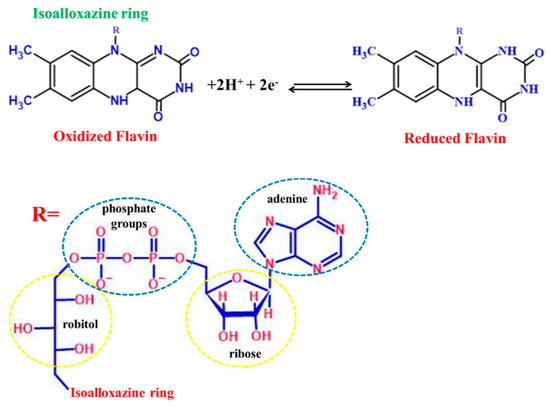
Inspired by nature, the mimicking of naturally occurring enzymes and the study of bio-electron transfer reactions using in-vitro models has been the long term goal of researchers [1]. The detection of hydrogen peroxide (H2O2) is of great importance in the fields of food industry, organic reactions, cell signaling and clinical systems [2]. The artificial enzymes have been used to understand physiological electron transfer reactions and for the development of bio-electrodes [3,4]. In this connection, the biomolecules gained immense interest in relation to the fabrication of catalytic material for the reduction of H2O2 [5]. Flavin mononucleotide (FMN) and flavin adenine dinucleotide (FAD) are the cofactors of riboflavin, which is known as vitamin B2 [6]. The flavin cofactors contain the isoalloxazine ring, which tethered to the ribityl phosphate or ribityl adenine diphosphate chain [7,8]. These flavin proteins are involved in a wide range of biochemical reactions involving the transferring of two or single electrons in a single step or two-step process, as shown in Scheme 1. The flavin proteins are attracted towards the biological system where it acts as a photo receptor [9]. The FAD is composed of a unique structure with isoalloxazine ring attributes the fluorescence, and the attached adenine moiety as the quencher. The structure of FAD exists in three conformations (stacked, unstacked and partially stacked) [10]. Depending on the pH, FAD can show different conformations, exhibit fluorescence properties, and its lifespan also varies [11]. Due to FAD’s peculiar properties, the vast applications of FAD were demonstrated in imaging and catalysis reactions [12]. Moreover, due to its simple electron transfer property, different FAD-modified electrodes had been demonstrated for various electrochemical sensor applications [13]. For example, FAD immobilized on nickel oxide-modified GCE was used for the detection of persulphate from 3 µM to 1.5 mM and the limit of detection (LOD) was 0.38 µM [14]. FAD/cobalt oxide nanoparticle-immobilized GCE was also utilized for the detection of nitrite from 1 to 30 µM with a limit of detection(LOD) of 0.2 µM [15].
Scheme 1.
Illustration of the redox mechanism of FAD.
However, the direct immobilization of FAD on bare GCE and other noble metal electrodes were found to be difficult due to its large size and lack of stability [14]. These issues had been avoided by using humic acid/halloysite nanotube(HA/HNT) modified electrodes [16], carbon nanotube/chitosan electrodes [17] and electrochemically deposited titanium oxide nanoparticles (TiO2) [18]. Thus, the successfully immobilized FAD on TiO2 modified GCE showed a redox peak at −0.45 V [18]. In order to further improve the immobilization process and electrocatalytic applications of FAD, a new generation of 2D materials have been used. Recently, 2D transition metal carbides, nitrides and carbonitrides have been synthesized as MXenes [19,20]. Mn+1XnTX is the general formula of MXene, where M stands for the metal and X is for nitrogen, carbon and carbonitrides and T is the functional groups (hydroxyl, oxygen and fluorine) on the surface [21,22]. Among the other 2D materials, MXene exhibited some special properties such as hydrophilicity, high specific surface area and good adsorption phenomena [23]. Due to the peculiar properties of MXenes, they have been used in various applications which include supercapacitors [24], batteries [25], microbial fuel cells [26], photocatalysis [27] and sensors [19]. Recently, MXene based electrochemical sensors had been reported for the sensing of glucose [28], ascorbic acid (AA), dopamine (DA) and uric acid (UA) [29], L-cysteine [30] and superoxide anions from human liver cancer cell lines (HepG2) [31]. In addition, enzymatic [32] and a non-enzymatic H2O2 sensors were also prepared using the platinum nanoparticle (Pt NPs) decorated MXene [33] and polyaniline/Pt NPs/MXene modified electrodes [34].
In this work, for the first time, we reported MXene as a host material for the immobilization of FAD and used it as a H2O2 biosensor. Firstly, the Ti3C2Tx (MXene) modified electrode was prepared and immobilization of FAD was carried out by electrochemical deposition. The surface coverage of FAD was higher on Ti3C2Tx than the reported methods. Secondly, the selectivity of the FAD/Ti3C2Tx modified electrode was investigated against peroxide reduction. Finally, the real sample analysis of the FAD/Ti3C2Tx electrode was tested by detecting spiked H2O2 in the sample with cancer cell lines.
2. Materials and Methods
2.1. Materials
Preparation of Ti3C2Tx was carried out as reported elsewhere [29]. FAD and DA were purchased from the Sigma-Aldrich, Bangalore India. The other used chemicals, such as AA, UA, OA, PA, glucose, lactose, NaCl, KCl, monosodium dihydrogen phosphate (NaH2PO4), disodium hydrogen phosphate (Na2HPO4), L-cystine, L-isoleucine, L-alanine and L-tyrosine, were obtained from SRL chemicals, Chennai, Tamil Nadu, India. The phosphate buffer solution (PBS) (supporting electrolyte) and the different pH solutions were prepared using (NaH2PO4 and Na2HPO4). OVCAR-5 and SKOV-3 ovarian cancer cell lines were procured from ATCC, Manassas, VA, USA. RPMI-1640 medium, fetal bovine serum (FBS), trypsin EDTA and antibiotics were obtained from Sigma-Aldrich, St. Louis, Missouri, MO, USA.
2.2. Apparatus
Electrochemical studies were carried out on CH Instruments—760E (CH Instruments, Austin, TX, USA) using a three-electrode system with FAD/Ti3C2Tx or unmodified GCE as the working electrode. The Ag/AgCl/3M KCl and platinum wire were used as the reference and the counter electrodes. For the electro-catalytic study, the de-aerated supporting electrolyte was used. The physiochemical characterization of materials, and the charge transfer properties of FAD/Ti3C2Tx, were analyzed using UV-visible spectroscopy—2000c Nanodrop technology, Wilmington, NC, USA. The Raman spectrum of FAD/Ti3C2Tx was recorded with the 532 nm laser excitation source, using a Micro-Raman spectrometer (Labram HR evolution-Horiba, Eugène Avinée, France). The morphology and elemental composition of Ti3C2Tx were analyzed by high resolution transmission electron microscopy (HR-TEM) and energy dispersive X-ray (EDX) analysis, using a 2100 plus Electron microscope (JEOL, Tokyo, Japan).
2.3. Preparation of FAD/Ti3C2Tx Modified Sensor
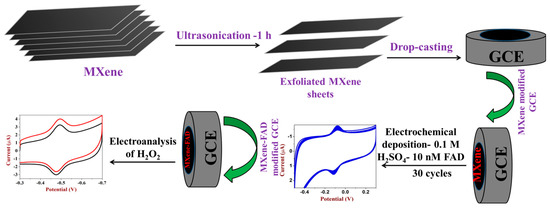
To prepare Ti3C2Tx dispersion, different amounts of Ti3C2Tx (0.2, 0.4, 0.6, 0.8 and 1 mg/mL) powder were probe sonicated in distilled water for 1 h with the amplitude of 54%, 3 s ON and 2 s OFF. Then, the each one of the Ti3C2Tx dispersions (10 µL) was coated on the GCE and dried at 50 °C for 5 min. For the process of FAD immobilization, the Ti3C2Tx modified electrode was used as shown in Scheme 2. The FAD immobilization was successfully carried out using a Ti3C2Tx modified electrode by potential sweeping between 0.3 and −0.5 V for 30 continuous CV cycles in 0.1 M H2SO4 containing 10 nM FAD. After that, the FAD-immobilized Ti3C2Tx electrode was completely dried at room temperature for 30 min. The FAD/Ti3C2Tx modified electrode showed a redox peak at −0.1 V in acidic medium [18]. However, when a FAD/Ti3C2Tx electrode was used to record cyclic voltammograms (CVs) in 0.1 M PBS, it showed a redox peak at −0.455 V due to the pH effect. Moreover, FAD/Ti3C2Tx modified GCE was applied for the electro-analysis of H2O2 in de-aerated PBS solution. The FAD/Ti3C2Tx modified electrode was stored in PBS when not in use (Scheme 2).
Scheme 2.
Electro-deposition of FAD (from 0.1 M H2SO4 containing 10 nM FAD) on to biocompatible Ti3C2Tx modified GCE for the electro-catalytic reduction of H2O2.
2.4. Real Sample Preparation
OVCAR-5 and SKOV-3 cell lines were cultured in RPMI-1640 medium supplemented with 10% FBS, 1% penicillin and streptomycin. The cells were maintained under 5% CO2 atmospheric pressure at 37 °C in a CO2 incubator. The cells were sub-cultured using Trypin (0.05%) and EDTA (0.02%). The trypsinized cells were washed with 10% FBS media to inhibit trypsin activity and further washed twice with PBS (0.1 M). The cell viability was determined by using Trypan Blue exclusion method. The viable cells (1 × 10⁶/mL) were re-suspended separately and used for electro-analysis of H2O2.
3. Results and Discussion
3.1. UV-Vis and Raman Spectroscopy
The interaction between FAD and Ti3C2Tx was analyzed by UV-Vis spectroscopy (UV-Vis). The UV-Vis absorption spectra of FAD showed three transition peaks at 265, 375 and 450 nm. The absorption bands at 375 and 450 nm corresponded to the oxidized form of FAD (Figure 1A). The absorption at 375 nm was due to the S0–S2 transition and 450 nm peak for the S0–S1 transition [35]. To investigate the charge-transfer between MXene and FAD, 0.3 mL of (1 mg/mL) Ti3C2Tx dispersion was added to the 100 nM FAD aqueous solution and mechanically mixed well using an orbital shaker. The FAD solution showed an absorbance peak, with high intensity, due to isoalloxazine. However, after FAD interacted with MXene, the absorbance peak of FAD decreased slightly, which may be due to the interaction of FAD with Ti3C2Tx through the surface functional groups (Figure 1A). From the UV-Vis spectra, it was confirmed that the N-7 adenine group might have interacted with the Ti3C2Tx [14].
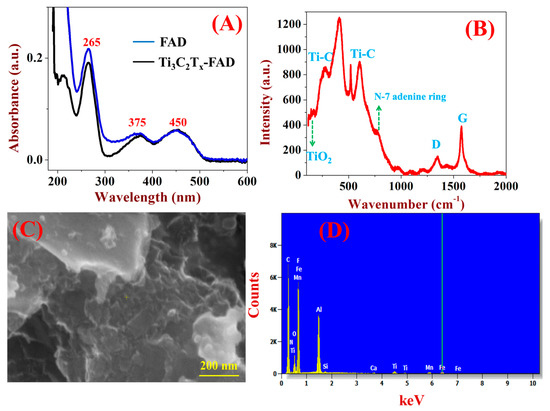
Figure 1.
(A) UV-Vis spectra of the FAD and Ti3C2Tx-FAD solutions. (B) The Raman spectrum of the FAD/Ti3C2Tx film. (C) The HR-TEM image and (D) EDX spectrum of Ti3C2Tx.
The Raman spectrum of FAD/Ti3C2Tx was recorded using the 532 nm laser excitation. As reported earlier, the Raman spectrum of the Ti3C2Tx showed the presence of Ti-C, Ti-Al and TiO2 vibrational bands [36]. The major Ti3C2Tx vibration bands appeared at 215, 352, 620 and 688 cm−1 [29], which confirmed the formation of Ti3C2Tx. The Ti-C vibrational bands appeared at 352 [29], 620 and 688 cm−1 [37]. TiO2 vibration was also observed at 157 cm−1. Additionally, the Ti-Al vibration band was found at 215 cm−1 which indicated the formation of mixed phase of MXene [36]. The functional groups present on the Ti3C2Tx were helped in the strong immobilization of FAD by electrochemical deposition. During the deposition of FAD on Ti3C2Tx, the (N-7) adenine ring of FAD may be oriented in parallel with the Ti3C2Tx surface, as was confirmed by the vibrational band of adenine found at 775 cm−1 [38]. In addition, for the FAD/Ti3C2Tx film, TiO2 and Ti-C vibrational bands were shifted to higher wavenumbers at 168 and 271 cm−1 (Figure 1B). Moreover, the graphitic carbon bands appeared at 1347 (D band) and 1577 cm−1 (G band), which corresponded to the sp3 and sp2 hybridized carbon atoms. The calculated ratio of ID/IG was 0.4, which indicated that there were less defects present on the surface of FAD/Ti3C2Tx than the individual Ti3C2Tx (ID/IG = 1.8).
The surface morphology of Ti3C2Tx was recorded by HR-TEM, which confirmed that the layered/sheet-like morphology was obtained and the average sheet sizes were about 400–500 nm (Figure 1C). The d-spacing of the Ti3C2Tx film was measured as 0.354 nm, which was matched with the d value of Ti-C. Furthermore, the elemental mapping analysis also showed the presence of the Ti, Al, C, F and O elements, as shown in (Figure 1D) [29].
3.2. Electrochemical Characterization of FAD/Ti3C2Tx Modified Electrode
Figure 2 shows the typical CVs of (A) bare GCE, (B) Ti3C2Tx/GCE and (C) FAD/Ti3C2Tx/GCE in N2 saturated 0.1 M PBS. The CVs of Ti3C2Tx/GCE showed that the capacitive current increased due to intercalation of ions from the electrolyte and pseudo capacitance behavior of Ti3C2Tx (Figure 2B, curve i) [39]. The presence of surface functional groups on Ti3C2Tx might have helped to immobilize the FAD enzyme without any additional binder molecules. The redox activity of the FAD enzyme was strongly dependent on pH and the redox potential was also shifted with the pH. After the electrochemical deposition, FAD/Ti3C2Tx/GCE was tested in 0.1 M PBS, which showed a redox peak at −0.455 V, and the cathodic and anodic peak currents appeared almost equally (Figure 2C, curve-i) [16]. It was believed that Ti3C2Tx film had shown greater effect on the immobilization process and transfer of electrons to the electrode surface. FAD immobilization was carried out on the bare GCE (without MXene) in the same condition. However, the FAD immobilization was found not to be favorable due to the lack of catalytic and biocompatible sites on the bare surface. The heterogeneous electron transfer kinetics of FAD were highly dependent on the catalyst material and the charge transfer interaction. The adenine ring of FAD was adsorbed on the MXene surface and the isoalloxazine ring was oriented away from the surface. The higher loading of FAD molecules on Ti3C2Tx surface was due to favorable interaction between them through the adenine moiety [40]. The interaction between FAD and the Ti3C2Tx nanosheets was also confirmed by UV-vis spectroscopy. Next, CVs were recorded for the electroanalysis of H2O2 using the (Figure 2A, curve ii) bare-GCE, (Figure 2B, curve ii) Ti3C2Tx and (Figure 2C, curve ii) FAD/Ti3C2Tx/GCE’s. The bare GCE showed a broad reduction peak of H2O2 at −0.6 V. However, after modification with Ti3C2Tx, the H2O2 reduction peak appeared at −0.53 V with the increase in catalytic current. Interestingly, at the FAD/Ti3C2Tx/GCE (Figure 2C, curve ii), the H2O2 reduction current was increased at −0.47 V, with the reduction in the overpotential by about 130 mV as compared to the bare GCE. These results confirmed that the immobilized FAD functioned as an effective electron transfer mediator for the reduction of the H2O2 molecule to H2O.
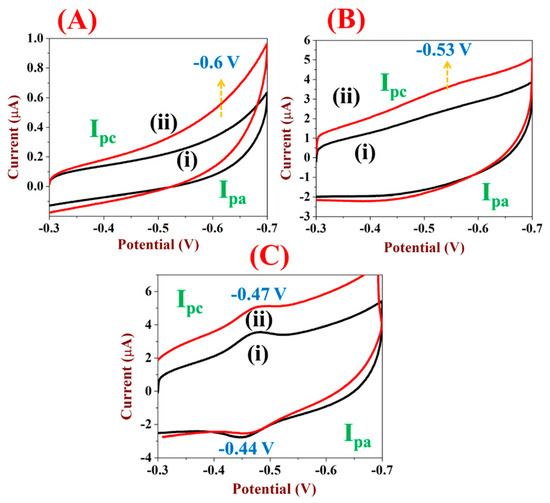
Figure 2.
CVs were recorded using (A) bare GCE, (B) Ti3C2Tx/GCE, and (C) FAD/Ti3C2Tx/GCE in 0.1 PBS without (curves i) and with 100 nM H2O2 (curves ii) in 0.1 M PBS, scan rate = 50 mV/s.
3.3. The Effect of Ti3C2Tx Concentration on the FAD Immobilization
In order to find out the optimum amount of Ti3C2Tx for the FAD immobilization process, dispersions of different Ti3C2Tx concentrations (0.2, 0.4, 0.6, 0.8 and 1 mg/mL) were prepared and 10 µL of each was coated on the GCE. Each of the Ti3C2Tx/GCE was used to immobilize FAD molecules. Figure 3A shows the CVs of FAD immobilized on different modified GCE’s with different amounts of Ti3C2Tx films (see Section 2.3). The obtained results showed that each of the Ti3C2Tx/GCE had the ability to adsorb FAD molecules. However, when we varied the amount of Ti3C2Tx (host) on the GCE, the surface adsorption of FAD was also increased. For the lowest amount of Ti3C2Tx, a thin layer of FAD was formed on the surface of Ti3C2Tx [41]. When the amount of Ti3C2Tx was gradually increased, the deposition of FAD (molecules) was also increased on the electrode surface. The surface coverage of FAD was calculated for the all electrodes using Equation (1) [42].
where, Q is the coulombic charge, n is number of electrons, F is faraday constant and A is the surface area of the electrode [43]. Using the above parameters, the ᴦFAD was calculated as 0.0681 × 10⁻¹⁰, 0.139 × 10⁻¹⁰, 0.15 × 10⁻¹⁰, 0.35 × 10⁻¹⁰, and 0.7 × 10⁻¹⁰ for 2, 4, 6, 8 and 10 µg of Ti3C2Tx on GCE’s. As can be seen, with the increase in the quantity of Ti3C2Tx on GCE, the FAD surface adsorption was also increased. Figure 3B shows the non-linear plot established between the amount of Ti3C2Tx on GCE and cathodic peak currents of FAD. This study demonstrated that the GCE coated with 10 µL of 1 mg/mL Ti3C2Tx dispersion was suitable for maximum adsorption of FAD. Due to its hydrophilic functional groups, high surface area and biocompatible nature, MXene strongly interacted with the FAD and helped in the immobilization process. Finally, 1 mg/mL (10 µL) Ti3C2Tx dispersion was selected for the immobilization of FAD to carry out further studies on the electrocatalytic reduction of H2O2.
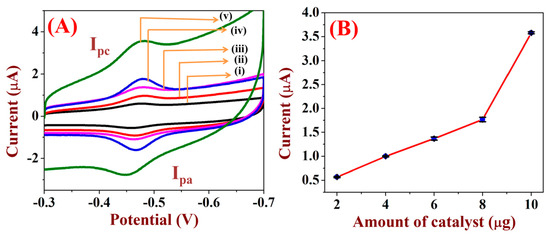
Figure 3.
(A) CVs were recorded using different FAD/Ti3C2Tx GCE’s which were prepared with different amounts of Ti3C2Tx: (i) 2, (ii) 4, (iii) 6, (iv) 8 and (v) 10 µg. For all the electrodes, electro-deposition of FAD was carried out using 10 nM FAD in 0.1 M H2SO4 for 30 cycles, scan rate = 50 mV/s. (B) The non-linear plot shows the relationship between the amount of Ti3C2Tx and the reduction peak currents of FAD (immobilized).
3.4. The Optimization of FAD Loading on Ti3C2Tx/GCE
The amount of FAD immobilized on Ti3C2Tx may play a major role in the enhancement of the H2O2 reduction current. To tune the optimum FAD loading on Ti3C2Tx/GCE for the effective H2O2 reduction, 10 µL of (1 mg/mL) Ti3C2Tx dispersion was drop-casted on the GCE and used for the immobilization of FAD (see Section 2.3). The immobilization of the FAD process was carried out from 0.1 M H2SO4 containing 10 nM FAD by varying the potential cycles between 0.3 and −0.5 V (examples: 10, 20, 30 and 40 cycles). After that, CVs of each FAD/Ti3C2Tx/GCE were recorded in 0.1 M PBS, as shown in Figure 4A. The lowest peak currents (low adsorption) of FAD were recorded for the electro-deposition of 10 cycles. With the number of potential cycles increased, FAD adsorption was also increased, and the maximum adsorption of FAD was recorded for 30 cycles. Figure 4B illustrates the relationship between the FAD reduction peak current vs. number of electrochemical deposition cycles. After 30 CV cycles, the FAD adsorption (immobilization) was saturated, which indicated that the FAD was entirely adsorbed on the Ti3C2Tx/GCE surface. From this study, 1 mg/mL (10 µL) Ti3C2Tx dispersion was found to be optimal for the modification of the GCE surface to immobilize higher amounts of FAD through 30 potential cycles in 0.1 M H2SO4 containing 10 nM FAD. As a control experiment, FAD adsorption was carried out on bare GCE (without MXene); it did not help to immobilize FAD molecules. So, it was confirmed that Ti3C2Tx might have played a major role in the immobilization process of FAD.
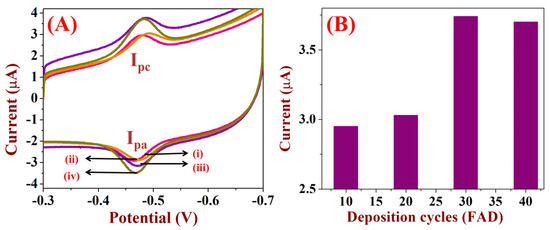
Figure 4.
(A) CVs were recorded using Ti3C2Tx/GCE after the FAD immobilization process by varying the number of potential cycles (i—10, ii—20, iii—30 and iv—40 cycles) in 0.1 M PBS, scan rate = 50 mV/s. (B) The bar diagram represents the relationship between the FAD deposition cycles and the reduction peak current of FAD/Ti3C2Tx/GCE’s.
3.5. Kinetic Study of FAD/Ti3C2Tx/GCE
The electrode kinetics of the FAD/Ti3C2Tx modified electrode were studied in 0.1 M KCl with 5 mM [Fe(CN)6]4−/3− (Figure 5A). For the bare electrode, the peak-to-peak separation (ΔEp) was about 120 mV with the peak current of ~40 µA (curve i). After modification with Ti3C2Tx, the ΔEp value was shifted to 100 mV with the decrease in peak current (29.89 µA). Ti3C2Tx acts as the electron transfer mediator between the electrode and the electrolyte but the redox peak currents were decreased due to the negatively charged repulsion between the Ti3C2Tx electrode and [Fe(CN)6]4−/3− (curve iii) [44]. Furthermore, after FAD immobilization on Ti3C2Tx, the redox peak currents of 5 mM [Fe(CN)6]4−/3− were increased on the FAD/Ti3C2Tx modified electrode as compared to the Ti3C2Tx/GCE (curve ii). From this comparative CVs, it was found that FAD/Ti3C2Tx/GCE possess good electron conduction pathways compared to the other modified electrodes [18]. Next, CVs were recorded using FAD/Ti3C2Tx/GCE at varying the scan rates from 10 to 100 mV/s (Figure 5B). This study helped to examine whether the electrode reaction was a diffusion-controlled or surface-controlled process. Figure 5C shows the linear plot was drawn for the square root of the scan rate (ν)1/2 vs. Ipc (cathodic peak current of 5 mM [Fe(CN)6]3−/4−). This data indicated that the peak current (anodic and cathodic) increases linearly with respect to (ν)1/2, and the linear regression equation was Y = 4.88 × 10⁻⁶ + 2.154 × 10⁻⁶ (R2 = 0.999). This was due to the diffusion-controlled process at lower scan rate [45]. From the slope value of the linear curve, the surface area (A) of the different electrodes were calculated using the Randles–Sevcik Equation (2) [46]. The parameters are as follows: ‘n’ is the number of electrons (n = 1), D is the diffusion coefficient of [Fe(CN)6]3−/4−] (7.6 × 10⁻⁶ cm2/s), Co is the concentration of [Fe(CN)6]3−/4− (5 mM) and A is the surface area of the electrode.
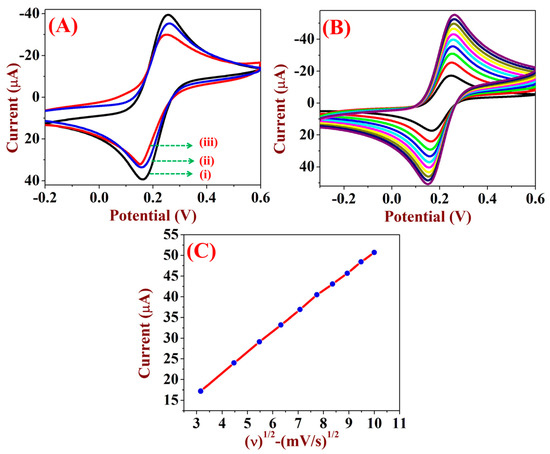
Figure 5.
(A) CVs were recorded using unmodified electrode (curve i), FAD/Ti3C2Tx/GCE (curve ii) and Ti3C2Tx/GCE (curve iii) in 0.1 M KCl/5 mM [Fe(CN)6]3−/4− at the scan rate of 50 mV/s. (B) CVs for FAD/Ti3C2Tx/GCE at different scan rates from 10 to 100 mV/s. (C) The linear plot was made between the ν1/2 and the reduction peak currents.
Using Equation (2), the electrochemical surface area (A) was calculated for FAD/Ti3C2Tx/GCE, bare GCE and Ti3C2Tx/GCE as 0.13 cm2, 0.113 cm2 and 0.078 cm2, respectively. It was found that the surface area was higher for FAD/Ti3C2Tx/GCE compared to the other modified electrode and bare GCE.
3.6. The Effect of PH
The pH effect on the redox activity of FAD/Ti3C2Tx/GCE was studied in different pH solutions (examples: pH 1.5, 5, 6, 7, 7.4, 8, and 9). It was already known that the redox peak of FAD was highly dependent on the pH. Since the redox behavior of FAD was due to the presence of isoalloxazine ring, the CVs of the FAD/Ti3C2Tx/GCE were shifted with the pH of the buffer solutions. As shown in Figure 6A, the redox peak was highly active in acidic medium due to the structural conformation of FAD. In acidic solution, FAD was present in the open stack structure [47]. When the pH of the solution was increased, the FAD structural conformation changed to a closed structure at high pH [12]. The formal potential of FAD was −0.1 V in acidic medium; when the pH of solution was increased, the formal potential was shifted to more negative values and the peak current started to decline (Figure 6A). A linear plot was made between the pH and formal potentials, as shown in Figure 6B, which gave a linear regression equation with the slope value of −57.7 mV/pH. This slope value was closer to −59 mV/pH, which indicated that the transfer process of FAD, with equal numbers of protons and electrons, showed Nernstian behavior [48]. From this study, neutral pH (0.1 M PBS, pH = 7.4) was selected for the further analysis of H2O2 in in-vivo studies.
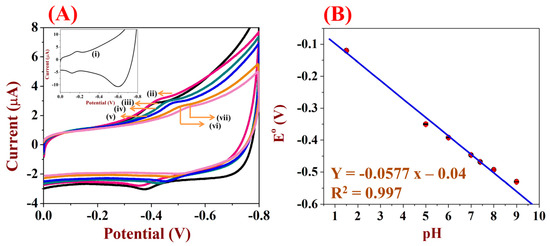
Figure 6.
(A) CVs were recorded using FAD/Ti3C2Tx/GCE in different pH buffers [(ii) pH 5, (iii) pH 6, (iv) pH 7, (v) pH 7.4, (vi) pH 8 and (viii) pH 9]. Inset figure was the CVs of FAD/Ti3C2Tx/GCE recorded at pH 1.5 (curve i) at the scan rate of 50 mV/s. (B) The linear plot was made between the pH and formal potentials of FAD.
3.7. Effect of Scan Rate
Figure 7A illustrates the CVs of FAD/Ti3C2Tx modified GCE recorded at different scan rates from 0.01 to 0.2 V/s. The redox peak currents of FAD/Ti3C2Tx/GCE were increased linearly with respect to the scan rate. From this observation, the redox potential remained the same and the peak currents were increased due to the surface-controlled process on the FAD/Ti3C2Tx/GCE [18]. The ΔEp for FAD redox peak was found to be 16 mV, which suggested that immobilized FAD had a higher rate of electron transfer compared to the other modified electrodes [48]. Figure 7B shows the linear plot of ν vs. cathodic peak currents (Ipc), which gave a straight line with the linear regression equation of Y = 4.37 × 10⁻⁵ + 8.08 × 10⁻⁷ (R2 = 0.999) [46]. The surface coverage of the FAD/Ti3C2Tx modified electrode was calculated using Equation (3)
where n is the number of electrons involved in the reaction (2), F is the faraday constant, R is the gas constant, A is the area of the electrode (0.13 cm2) and T is the temperature. From the slope of the linear curve, the surface coverage (ᴦFAD) of the electrode was calculated as 0.8 × 10⁻¹⁰ mol/cm2 using Equation (3). This was similar to the surface coverage, which was calculated from Equation (1) as 0.7 × 10⁻¹⁰ mol/cm2. These values indicated the formation of the FAD monolayer (adsorption) on the surface of the Ti3C2Tx modified GCE.
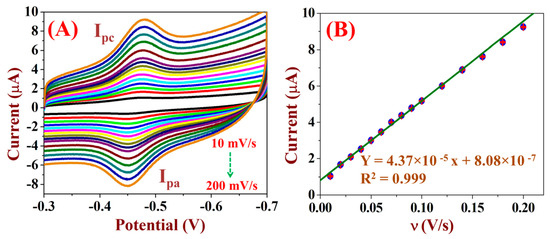
Figure 7.
(A) CVs were recorded using FAD/Ti3C2Tx/GCE in 0.1 M PBS at different scan rates from 0.01 to 0.2 V/s. (B) The linear plot was made between the scan rates and the reduction peak currents.
3.8. Analysis of H2O2 Using FAD/Ti3C2Tx/GCE
The FAD/Ti3C2Tx/GCE was used as an electron transfer mediator for the detection of H2O2. CVs were recorded with the different concentrations of H2O2 from 5 nM to 2 µM using the FAD/Ti3C2Tx/GCE (Figure 8A). It can be seen that the reduction peak currents were increased with the increment of H2O2 concentrations. A calibration plot was established between the [H2O2] and the reduction peak currents, which exhibited a linear regression equation of Y = 1.63 × 10⁻⁸ + 3.98 × 10⁻⁶ (R2 = 0.97) (Figure 8B) [49]. From the calibration curve of H2O2, the LOD was calculated as 0.7 nM using the formula below [50]:
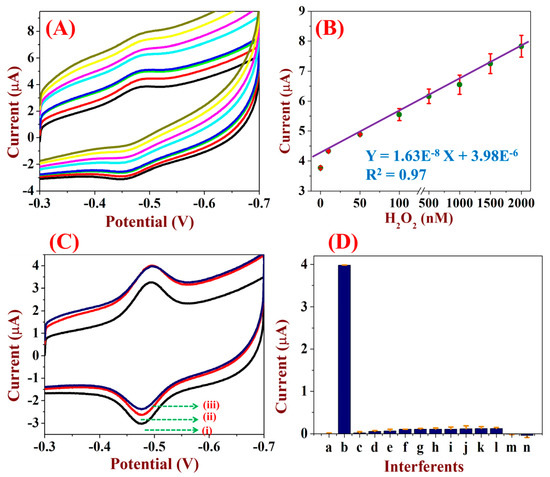
Figure 8.
(A) CVs of FAD/Ti3C2Tx/GCE were recorded in 0.1 M PBS with different concentrations of H2O2 from 5 nM to 2 µM at a scan rate of 50 mV/s. (B) The calibration plot was established between the concentrations of H2O2 and the reduction peak currents. (C) CVs were recorded using FAD/Ti3C2Tx modified electrode in 0.1 M PBS before (curve i) and after addition of 100 nM H2O2 (curve ii) and (curve iii) represents CV curve after the addition of 1 µM concentration of each interfering molecule with 100 nM H2O2. (D) The bar diagram represents the changes in the current responses caused by FAD/Ti3C2Tx/GCE with (a) 0 nM H2O2 and (b) 100 nM H2O2. The catalytic current was recorded after the addition of 1 µΜ of each interfering molecule, (c) L-alanine, (d) L-isoleucine, (e) L-cysteine, (f) NaCl, (g) KCl, (h) glucose, (i) lactose, (j) AA, (k) UA, (l) OA (m) PA, and (n) DA (these experiments were repeated three times and the SD values are given, n = 3).
LOD = 3.3 × standard deviation of the blank/slope of the calibration curve [51].
The obtained LOD was compared with the other reported methods using FAD as an electron transfer mediator. Previously, HA/HNT film was used for the immobilization of FAD on GCE and it was used for the analysis of H2O2 from 1 to 250 µM with a LOD of 0.49 µM [16]. Similarly, FAD immobilized on the carbon nanotube/chitosan modified electrode was used to detect H2O2 from 1 µM to 2.2 mM [17]. It was possible that FAD/Ti3C2Tx/GCE could show better performance than the previously reported methods for H2O2 sensing, with improved sensitivity.
3.9. Selectivity of the FAD/Ti3C2Tx/GCE Based Sensor
Selectivity is an important factor of the electrochemical sensors. The selectivity of the FAD/Ti3C2Tx/GCE towards H2O2 was confirmed by CVs recorded with biomolecules associated with the human body. First, Figure 8D(a) CVs were recorded using FAD/Ti3C2Tx/GCE with (b) 100 nM H2O2. This was followed by 10 fold concentrations of interfering substances being added, including ((c) L-alanine, (d) L-isoleucine, (e) L-cysteine, (f) NaCl, (g) KCl, (h) glucose, (i) lactose, (j) AA, (k) UA, (l) OA (m) PA, and (n) DA); then, current responses were recorded [52]. Figure 8C shows the CVs recorded for the FAD/Ti3C2Tx/GCE in 0.1 M PBS before (curve-i) and after the addition of 100 nM H2O2, which showed that the reduction peak current was increased (curve-ii). Next, CVs were recorded with the subsequent additions of interfering molecules where the reduction current was significantly decreased (curve-iii). This analysis confirmed that the FAD/Ti3C2Tx/GCE was more selective and responded only for H2O2, and not for the other biomolecules (Figure 8C). After analysis with the interfering molecules, the FAD reduction peak current was significantly decreased. Figure 8D shows the bar diagram of the overall current responses observed for the interfering substances. It was obvious that the selectivity of the FAD/Ti3C2Tx/GCE towards H2O2 was maintained at about 98%.
The electro-catalytic reduction of H2O2 on FAD/Ti3C2Tx/GCE was mediated by the FAD. The electrochemically reduced FAD to FADH2 by transfer of two electrons and protons. The reduced FADH2 aids in the reduction of H2O2 to H2O (see Equations (4) and (5)) [17,53].
3.10. Stability, Reproducibility and Repeatability
To study the stability of FAD/Ti3C2Tx/GCE, CVs were recorded for 50 potential cycles in 0.1 M PBS at a scan rate of 50 mV/s. The redox peak currents of FAD were decreased by about 2% only after the 50 potential cycles (Figure 9A). The reproducibility of the FAD/Ti3C2Tx-modified GCE was evaluated. For this purpose, five different FAD/Ti3C2Tx/GCE’s were prepared as given in Section 2.3. The bar diagram represents the reduction peak currents of FAD/Ti3C2Tx/GCE as shown in Figure 9B. The relative standard deviation (RSD) was 1.7%, which indicated that the described electrode fabrication procedure was accurate. The repeatability test was also studied by using FAD/Ti3C2Tx/GCE for a period of three days, and the sensor stability was maintained up to 87% (Figure 9C).
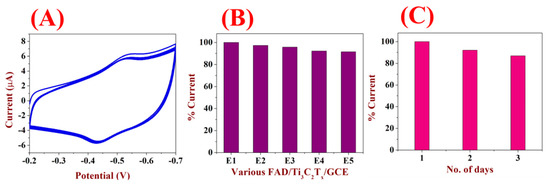
Figure 9.
(A) CVs were recorded using the FAD/Ti3C2Tx/GCE in 0.1 M PBS for the 50 continuous potential cycles at a scan rate of 50 mV/s. (B) The reproducibility of the five different FAD/Ti3C2Tx/GCE’s were tested in 0.1 M PBS and the corresponding reduction current percentages were noted. (C) The repeatability of the FAD/Ti3C2Tx/GCE was studied for continuous usage for 3 days in 0.1 M PBS and the changes in the reduction peak currents were recorded.
3.11. ORR Study
The oxygen reduction reaction (ORR) was also carried out on FAD/Ti3C2Tx/GCE in O2 and N2 saturated PBS solution. When a bare GCE was used for the O2 reduction, there was no significant catalytic effect noted (Figure 10A, black curve i). However, for FAD/Ti3C2Tx/GCE, the O2 reduction peak appeared at −0.38 V (curve iii). After the electrolyte solution was purged with N2, the redox peak of FAD appeared (curve ii). As shown in Figure 2C, the H2O2 reduction appeared at −0.47 V. This indicated that the FAD/Ti3C2Tx/GCE could separate the reduction peak of H2O2 from the O2 reduction peak at different potentials. Thus, this sensor may be suitable for the selective detection of H2O2 in the presence of oxygen.
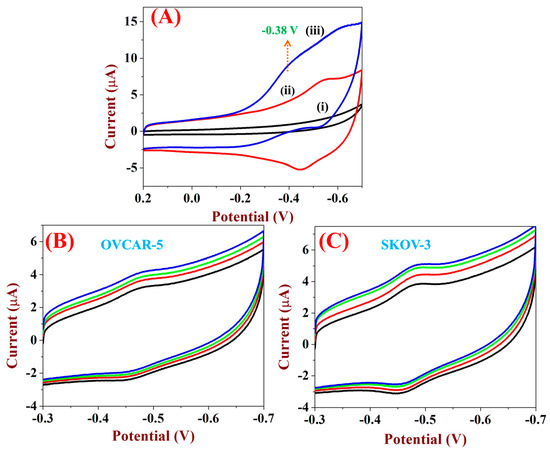
Figure 10.
(A) The ORR on (curve i) bare GCE and (curve iii) FAD/Ti3C2Tx/GCE in 0.1 M PBS with dissolved oxygen. Curve ii shows the CVs of the FAD/Ti3C2Tx/GCE in N2 saturated solution, scan rate = 50 mV/s. (B,C) The CVs were recorded for the analysis of spiked H2O2 concentrations (10, 50 and 100 nM) in OVCAR-5 and SKOV-3 cancer cell lines samples using FAD/Ti3C2Tx/GCE.
3.12. Detecting H2O2 in Ovarian Cancer Cell Lines
The real applications of the FAD/Ti3C2Tx/GCE were tested in the analysis of H2O2 in OVCAR-5 and SKOV-3 ovarian cancer cell lines. As reported earlier, the excretion of H2O2 was higher in cancer cells [54]. The release of H2O2 has been reported in induction of cell death (PMID: 25433364; PMID: 27172875]. The cancer cells do not normally excrete H2O2, however, after adding the stimulant, they can release H2O2 by disrupted intracellular redox homeostasis of cancer cells [55]. For this purpose, AA was used as a stimulant. The FAD/Ti3C2Tx/GCE was used to record CVs in 0.1 M PBS before and after the addition of the stimulant. Then, the OVCAR-5, SKOV-3 cell lines were added, which did not show any current responses. This indicated that the FAD/Ti3C2Tx/GCE did not provide any response, which may be due to absence of H2O2 or the lower sensitivity of the sensor [56]. Using the proposed sensor, we confirmed that the ovarian cell lines did not excrete H2O2 while adding the stimulant. Furthermore, the known concentrations of H2O2 (such as 10, 50 and 100 nM H2O2) were spiked in the PBS containing the ovarian cancer cell lines. The cathodic peak currents were increased with respect to the spiked concentrations of H2O2 [57] (Figure 10B,C). From this analysis, the spiked concentrations of H2O2 were estimated and the recovery percentages (92–97.7%) were calculated (Table 1). These results corroborated that the FAD/Ti3C2Tx/GCE may be used for the detection of H2O2 in cancer cell lines or other biological samples. However, further optimization and control studies will be required.

Table 1.
The FAD/Ti3C2Tx modified electrode was used for the analysis of spiked H2O2 in to OVCAR-5 and SKOV-3 cancer cell lines.
4. Conclusions
In summary, we have demonstrated that Ti3C2Tx is a biocompatible material for the immobilization of FAD by electrochemical deposition. The surface functional groups of Ti3C2Tx helped in the electro-adsorption of FAD. FAD-immobilized Ti3C2Tx was studied by UV-Vis and Raman spectroscopies, which confirmed the adsorption of FAD on the Ti3C2Tx. The FAD-immobilized Ti3C2Tx electrode was used as an electrochemical transducer for the detection of H2O2. The amount of Ti3C2Tx and concentration of FAD were optimized to develop an effective sensor for H2O2. FAD/Ti3C2Tx/GCE showed a redox peak at −0.1 V in 0.1 M H2SO4. Compared to the non-enzymatic sensors, Ti3C2Tx-FAD modified electrode exhibited good sensitivity (0.125 µA nM/cm2) and a linear range of detection from 5 nM to 2 μM with an LOD of 0.7 nM. This FAD enzyme-modified electrode was very selective towards H2O2 reduction in the presence of other interfering molecules. Finally, the real application of the sensor was successfully demonstrated in the cancer cell lines samples spiked with known concentrations of H2O2, with good recovery.
Author Contributions
R.D.N. and A.K.S. conceived the idea, developed the work plan and conducted the experimental work. R.D.N., P.M. and R.A. recorded and analyzed all the data, and wrote the first draft of the manuscript. A.K.S. revised the manuscript. K.P. provided the cancer cell lines for real sample analysis and wrote up the relevant discussions. All authors have read and agreed to the published version of the manuscript.
Funding
Department of Science and Technology (DST) (International Bilateral Cooperation Division) for the financial support through “INDO-RUSSIA Project (Ref. INT/RUS/RFBR/385)” & Science and Engineering Research Board (SERB), Government of India for financial support (Award No.: ECR/2016/001446).
Acknowledgments
We thank the Department of Science and Technology (International Bilateral Cooperation Division) for the financial support through “INDO-RUSSIA Project (Ref. INT/RUS/RFBR/385)”. We also like to acknowledge the Department of Science and Technology (DST) and Science and Engineering Research Board (SERB), Government of India for financial support. Award No.: ECR/2016/001446. NR acknowledges the Ph.D. scholarship and CSIR-SRF fellowship from the Council of Scientific and Industrial Research (CSIR), Government of India. Award no-09/1045(0043)/2020-EMR-I.
Conflicts of Interest
The authors declare no competing financial interest.
References
- Amreen, K.; Senthil Kumar, A. Highly Redox-Active Hematin-Functionalized Carbon Mesoporous Nanomaterial for Electrocatalytic Reduction Applications in Neutral Media. ACS Appl. Nano Mater. 2018, 1, 2272–2283. [Google Scholar] [CrossRef]
- Chen, X.; Wu, G.; Cai, Z.; Oyama, M.; Chen, X. Advances in enzyme-free electrochemical sensors for hydrogen peroxide, glucose, and uric acid. Microchim. Acta 2014, 181, 689–705. [Google Scholar] [CrossRef]
- Amreen, K.; Kumar, A.S. A human whole blood chemically modified electrode for the hydrogen peroxide reduction and sensing: Real-time interaction studies of hemoglobin in the red blood cell with hydrogen peroxide. J. Electroanal. Chem. 2018, 815, 189–197. [Google Scholar] [CrossRef]
- Chen, S.; Yuan, R.; Chai, Y.; Hu, F. Electrochemical sensing of hydrogen peroxide using metal nanoparticles: A review. Microchim. Acta 2013, 180, 15–32. [Google Scholar] [CrossRef]
- Kumar, S.A.; Chen, S.-M. Myoglobin/arylhydroxylamine film modified electrode: Direct electrochemistry and electrochemical catalysis. Talanta 2007, 72, 831–838. [Google Scholar] [CrossRef] [PubMed]
- Shinohara, H.; Grätzel, M.; Vlachopoulos, N.; Aizawa, M. Interfacial electron transfer of flavin coenzymes and riboflavin adsorbed on textured TiO2 films. J. Electroanal. Chem. Interfacial Electrochem. 1991, 321, 307–320. [Google Scholar] [CrossRef]
- Kumar, S.A.; Chen, S.-M. Electrochemical, microscopic, and EQCM studies of cathodic electrodeposition of ZnO/FAD and anodic polymerization of FAD films modified electrodes and their electrocatalytic properties. J. Solid State Electrochem. 2007, 11, 993–1006. [Google Scholar] [CrossRef]
- Choudhury, S.D.; Mohanty, J.; Bhasikuttan, A.C.; Pal, H. A fluorescence perspective on the differential interaction of riboflavin and flavin adenine dinucleotide with cucurbit [7] uril. J. Phys. Chem. B 2010, 114, 10717–10727. [Google Scholar] [CrossRef]
- Sengupta, A.; Singh, R.K.; Gavvala, K.; Koninti, R.K.; Mukherjee, A.; Hazra, P. Urea induced unfolding dynamics of flavin adenine dinucleotide (FAD): Spectroscopic and molecular dynamics simulation studies from femto-second to nanosecond regime. J. Phys. Chem. B 2014, 118, 1881–1890. [Google Scholar] [CrossRef]
- May, J.C.; Morris, C.B.; McLean, J.A. Ion mobility collision cross section compendium. Anal. Chem. 2017, 89, 1032–1044. [Google Scholar] [CrossRef] [Green Version]
- Sengupta, A.; Khade, R.V.; Hazra, P. pH dependent dynamic behavior of flavin mononucleotide (FMN) and flavin adenine dinucleotide (FAD) in femtosecond to nanosecond time scale. J. Photochem. Photobiol. A Chem. 2011, 221, 105–112. [Google Scholar] [CrossRef]
- Galbán, J.; Sanz-Vicente, I.; Navarro, J.; De Marcos, S. The intrinsic fluorescence of FAD and its application in analytical chemistry: A review. Methods Appl. Fluoresc. 2016, 4, 42005. [Google Scholar] [CrossRef] [Green Version]
- Marafon, E.; Kubota, L.T.; Gushikem, Y. FAD-modified SiO 2/ZrO 2/C ceramic electrode for electrocatalytic reduction of bromate and iodate. J. Solid State Electrochem. 2009, 13, 377–383. [Google Scholar] [CrossRef]
- Salimi, A.; Noorbakhsh, A.; Semnani, A. Immobilization of flavine adenine dinucleotide onto nickel oxide nanostructures modified glassy carbon electrode: Fabrication of highly sensitive persulfate sensor. J. Solid State Electrochem. 2011, 15, 2041–2052. [Google Scholar] [CrossRef]
- Salimi, A.; Hallaj, R.; Mamkhezri, H.; Hosaini, S.M.T. Electrochemical properties and electrocatalytic activity of FAD immobilized onto cobalt oxide nanoparticles: Application to nitrite detection. J. Electroanal. Chem. 2008, 619–620, 31–38. [Google Scholar] [CrossRef]
- Preethika, M.; Sundramoorthy, A.K. Humic acid/halloysite nanotube/flavin adenine dinucleotide nanocomposite based selective electrochemical biosensor for hydrogen peroxide. Appl. Surf. Sci. 2019, 488, 503–511. [Google Scholar] [CrossRef]
- Kumar, S.A.; Chen, S.-L.; Chen, S.-M. Electrochemical Sensing of H2O2 at flavin adenine dinucleotide/chitosan/CNT nanocomposite modified electrode. Electrochem. Solid State Lett. 2010, 13, K83. [Google Scholar] [CrossRef]
- Kumar, S.A.; Lo, P.-H.; Chen, S.-M. Electrochemical synthesis and characterization of TiO2 nanoparticles and their use as a platform for flavin adenine dinucleotide immobilization and efficient electrocatalysis. Nanotechnology 2008, 19, 255501. [Google Scholar] [CrossRef] [PubMed] [Green Version]
- Lorencova, L.; Bertok, T.; Dosekova, E.; Holazova, A.; Paprckova, D.; Vikartovska, A.; Sasinkova, V.; Filip, J.; Kasak, P.; Jerigova, M.; et al. Electrochemical performance of Ti(3)C(2)T(x) MXene in aqueous media: Towards ultrasensitive H2O2 sensing. Electrochim. Acta 2017, 235, 471–479. [Google Scholar] [CrossRef] [Green Version]
- Li, D.; Liu, G.; Zhang, Q.; Qu, M.; Fu, Y.Q.; Liu, Q.; Xie, J. Virtual sensor array based on MXene for selective detections of VOCs. Sens. Actuators B Chem. 2021, 331, 129414. [Google Scholar] [CrossRef]
- Ronchi, R.M.; Arantes, J.T.; Santos, S.F. Synthesis, structure, properties and applications of MXenes: Current status and perspectives. Ceram. Int. 2019, 45, 18167–18188. [Google Scholar] [CrossRef]
- Gogotsi, Y.; Anasori, B. The rise of MXenes. ACS Nano 2019, 13, 8491–8494. [Google Scholar] [CrossRef] [PubMed] [Green Version]
- Khazaei, M.; Ranjbar, A.; Arai, M.; Sasaki, T.; Yunoki, S. Electronic properties and applications of MXenes: A theoretical review. J. Mater. Chem. C 2017, 5, 2488–2503. [Google Scholar] [CrossRef] [Green Version]
- Zou, R.; Quan, H.; Pan, M.; Zhou, S.; Chen, D.; Luo, X. Self-assembled MXene(Ti3C2Tx)/α-Fe2O3 nanocomposite as negative electrode material for supercapacitors. Electrochim. Acta 2018, 292, 31–38. [Google Scholar] [CrossRef]
- Tang, H.; Hu, Q.; Zheng, M.; Chi, Y.; Qin, X.; Pang, H.; Xu, Q. MXene–2D layered electrode materials for energy storage. Prog. Nat. Sci. Mater. Int. 2018, 28, 133–147. [Google Scholar] [CrossRef]
- Tahir, K.; Miran, W.; Jang, J.; Maile, N.; Shahzad, A.; Moztahida, M.; Ghani, A.A.; Kim, B.; Jeon, H.; Lim, S.-R.; et al. Nickel ferrite/MXene-coated carbon felt anodes for enhanced microbial fuel cell performance. Chemosphere 2021, 268, 128784. [Google Scholar] [CrossRef] [PubMed]
- Chertopalov, S.; Mochalin, V.N. Environment sensitive photoresponse of spontaneously partially oxidized Ti3C2Tx MXene thin films. ACS Nano 2018, 12, 6109. [Google Scholar] [CrossRef] [PubMed]
- Li, K.; Jiao, T.; Xing, R.; Zou, G.; Zhao, Q.; Zhou, J.; Zhang, L.; Peng, Q. Fabrication of hierarchical MXene-based AuNPs-containing core–shell nanocomposites for high efficient catalysts. Green Energy Environ. 2018, 3, 147–155. [Google Scholar] [CrossRef]
- Murugan, N.; Jerome, R.; Preethika, M.; Sundaramurthy, A.; Sundramoorthy, A.K. 2D-titanium carbide (MXene) based selective electrochemical sensor for simultaneous detection of ascorbic acid, dopamine and uric acid. J. Mater. Sci. Technol. 2021, 72, 122–131. [Google Scholar] [CrossRef]
- Rasheed, P.A.; Pandey, R.P.; Jabbar, K.A.; Ponraj, J.; Mahmoud, K.A. Sensitive electrochemical detection of l-cysteine based on a highly stable Pd@ Ti 3 C 2 T x (MXene) nanocomposite modified glassy carbon electrode. Anal. Methods 2019, 11, 3851–3856. [Google Scholar] [CrossRef]
- Zheng, J.; Wang, B.; Jin, Y.; Weng, B.; Chen, J. Nanostructured MXene-based biomimetic enzymes for amperometric detection of superoxide anions from HepG2 cells. Microchim. Acta 2019, 186, 1–9. [Google Scholar] [CrossRef]
- Ma, B.K.; Li, M.; Cheong, L.Z.; Weng, X.C.; Shen, C.; Huang, Q. Enzyme-MXene Nanosheets: Fabrication and Application in Electrochemical Detection of H2O2. J. Inorg. Mater. 2019, 35, 131–138. [Google Scholar]
- Lorencova, L.; Bertok, T.; Filip, J.; Jerigova, M.; Velic, D.; Kasak, P.; Mahmoud, K.A.; Tkac, J. Highly stable Ti3C2Tx (MXene)/Pt nanoparticles-modified glassy carbon electrode for H2O2 and small molecules sensing applications. Sens. Actuators B Chem. 2018, 263, 360–368. [Google Scholar] [CrossRef]
- Neampet, S.; Ruecha, N.; Qin, J.; Wonsawat, W.; Chailapakul, O.; Rodthongkum, N. A nanocomposite prepared from platinum particles, polyaniline and a Ti3C2 MXene for amperometric sensing of hydrogen peroxide and lactate. Mikrochim. Acta 2019, 186, 752. [Google Scholar] [CrossRef]
- Delfino, I.; Esposito, R.; Portaccio, M.; Lepore, M. Dynamical and structural properties of flavin adenine dinucleotide in aqueous solutions and bound to free and sol–gel immobilized glucose oxidase. J. Sol-Gel Sci. Technol. 2017, 82, 239–252. [Google Scholar] [CrossRef]
- Parse, H.B.; Patil, I.; Ingavale, S.; Manohar, C.; Roy, V.A.L.; Kakade, B. Efficient oxygen electroreduction kinetics by titanium carbide@ nitrogen doped carbon nanocomposite. Int. J. Hydrog. Energy 2019, 44, 23649–23657. [Google Scholar] [CrossRef]
- Cao, Y.; Deng, Q.; Liu, Z.; Shen, D.; Wang, T.; Huang, Q.; Du, S.; Jiang, N.; Lin, C.-T.; Yu, J. Enhanced thermal properties of poly (vinylidene fluoride) composites with ultrathin nanosheets of MXene. RSC Adv. 2017, 7, 20494–20501. [Google Scholar] [CrossRef] [Green Version]
- Zheng, Y.; Carey, P.R.; Palfey, B.A. Raman spectrum of fully reduced flavin. J. Raman Spectrosc. 2004, 35, 521–524. [Google Scholar] [CrossRef]
- Yang, C.; Tang, Y.; Tian, Y.; Luo, Y.; Faraz Ud Din, M.; Yin, X.; Que, W. Flexible nitrogen-doped 2D titanium carbides (MXene) films constructed by an ex situ solvothermal method with extraordinary volumetric capacitance. Adv. Energy Mater. 2018, 8, 1802087. [Google Scholar] [CrossRef]
- Mansouri Majd, S.; Salimi, A.; Astinchap, B. Manganese Oxide Nanoparticles/Reduced Graphene Oxide as Novel Electrochemical Platform for Immobilization of FAD and its Application as Highly Sensitive Persulfate Sensor. Electroanalysis 2016, 28, 493–502. [Google Scholar] [CrossRef]
- Nagarajan, R.D.; Sundramoorthy, A.K. One-pot electrosynthesis of silver nanorods/graphene nanocomposite using 4-sulphocalix [4] arene for selective detection of oxalic acid. Sens. Actuators B Chem. 2019, 301, 127132. [Google Scholar] [CrossRef]
- Lo, P.-H.; Kumar, S.A.; Chen, S.-M. Amperometric determination of H2O2 at nano-TiO2/DNA/thionin nanocomposite modified electrode. Colloids Surf. B Biointerfaces 2008, 66, 266–273. [Google Scholar] [CrossRef] [PubMed]
- Ma, W.; Tian, D. Direct electron transfer and electrocatalysis of hemoglobin in ZnO coated multiwalled carbon nanotubes and Nafion composite matrix. Bioelectrochemistry 2010, 78, 106–112. [Google Scholar] [CrossRef] [PubMed]
- Nayak, P.; Jiang, Q.; Mohanraman, R.; Anjum, D.; Hedhili, M.N.; Alshareef, H.N. Inherent electrochemistry and charge transfer properties of few-layered two-dimensional Ti 3 C 2 T x MXene. Nanoscale 2018, 10, 17030–17037. [Google Scholar] [CrossRef] [PubMed] [Green Version]
- Palanisamy, S.; Lee, H.F.; Chen, S.-M.; Thirumalraj, B. An electrochemical facile fabrication of platinum nanoparticle decorated reduced graphene oxide; application for enhanced electrochemical sensing of H2O2. RSC Adv. 2015, 5, 105567–105573. [Google Scholar] [CrossRef]
- Bard, A.J.; Faulkner, L.R.; Leddy, J.; Zoski, C.G. Electrochemical Methods: Fundamentals and Applications; Wiley: New York, NY, USA, 1980; Volume 2. [Google Scholar]
- Molano-Arevalo, J.C.; Hernandez, D.R.; Gonzalez, W.G.; Miksovska, J.; Ridgeway, M.E.; Park, M.A.; Fernandez-Lima, F. Flavin adenine dinucleotide structural motifs: From solution to gas phase. Anal. Chem. 2014, 86, 10223–10230. [Google Scholar] [CrossRef] [Green Version]
- Nisha, S.; Kumar, A.S. Highly redox-active organic molecular nanomaterials: Naphthalene and phenanthrene molecular species π-stacked MWCNT modified electrodes for oxygen-interference free H2O2 sensing in neutral pH. J. Electroanal. Chem. 2020, 878, 114680. [Google Scholar] [CrossRef]
- Jerome, R.; Sundramoorthy, A.K. Preparation of hexagonal boron nitride doped graphene film modified sensor for selective electrochemical detection of nicotine in tobacco sample. Anal. Chim. Acta 2020, 1132, 110–120. [Google Scholar] [CrossRef]
- Murugan, N.; Kumar, T.H.V.; Devi, N.R.; Sundramoorthy, A.K. A flower-structured MoS 2-decorated f-MWCNTs/ZnO hybrid nanocomposite-modified sensor for the selective electrochemical detection of vitamin C. New J. Chem. 2019, 43, 15105–15114. [Google Scholar] [CrossRef]
- Olsen, E.D. Analytical chemistry, fourth edition (Christian, Gary D.). J. Chem. Educ. 1986, 63, A277. [Google Scholar] [CrossRef] [Green Version]
- Nagarajan, R.D.; Murugan, P.; Sundramoorthy, A.K. Selective Electrochemical Sensing of NADH and NAD+ Using Graphene/Tungstate Nanocomposite Modified Electrode. Chemistryselect 2020, 5, 14643–14651. [Google Scholar] [CrossRef]
- Lin, K.C.; Lin, Y.C.; Chen, S.M. Electrocatalytic reaction of hydrogen peroxide and NADH based on poly(neutral red) and FAD hybrid film. Analyst 2012, 137, 186–194. [Google Scholar] [CrossRef] [PubMed]
- Yang, N.; Xiao, W.; Song, X.; Wang, W.; Dong, X. Recent Advances in Tumor Microenvironment Hydrogen Peroxide-Responsive Materials for Cancer Photodynamic Therapy. Nano-Micro Lett. 2020, 12, 15. [Google Scholar] [CrossRef] [PubMed] [Green Version]
- Ramaraj, S.; Sakthivel, M.; Chen, S.-M.; Lou, B.-S.; Ho, K.-C. Defect and Additional Active Sites on the Basal Plane of Manganese-Doped Molybdenum Diselenide for Effective Enzyme Immobilization: In Vitro and in Vivo Real-Time Analyses of Hydrogen Peroxide Sensing. ACS Appl. Mater. Interfaces 2019, 11, 7862–7871. [Google Scholar] [CrossRef]
- Liu, H.; Yan, Y.; Wen, H.; Jiang, X.; Cao, X.; Zhang, G.; Liu, G. A novel estrogen receptor GPER mediates proliferation induced by 17β-estradiol and selective GPER agonist G-1 in estrogen receptor α (ERα)-negative ovarian cancer cells. Cell Biol. Int. 2014, 38, 631–638. [Google Scholar] [CrossRef] [PubMed]
- Dervisevic, E.; Dervisevic, M.; Wang, Y.; Malaver-Ortega, L.F.; Cheng, W.; Tuck, K.L.; Voelcker, N.H.; Cadarso, V.J. Highly Selective Nanostructured Electrochemical Sensor Utilizing Densely Packed Ultrathin Gold Nanowires Film. Electroanalysis 2020, 32, 1850–1858. [Google Scholar] [CrossRef]
Publisher’s Note: MDPI stays neutral with regard to jurisdictional claims in published maps and institutional affiliations. |
© 2021 by the authors. Licensee MDPI, Basel, Switzerland. This article is an open access article distributed under the terms and conditions of the Creative Commons Attribution (CC BY) license (https://creativecommons.org/licenses/by/4.0/).