Color-Coded Front-of-Pack Nutrition Labels—An Option for US Packaged Foods?

 , ,
, , 
Abstract
:1. Introduction
2. Materials and Methods
2.1. Data Collection
2.2. Food Categorization
2.3. Assignment of Traffic Light Criteria
2.4. Overall Healthfulness
2.5. Statistical Analysis
3. Results
3.1. Overall Results
3.2. Total Fat and Saturated Fat
3.3. Total Sugars
3.4. Sodium
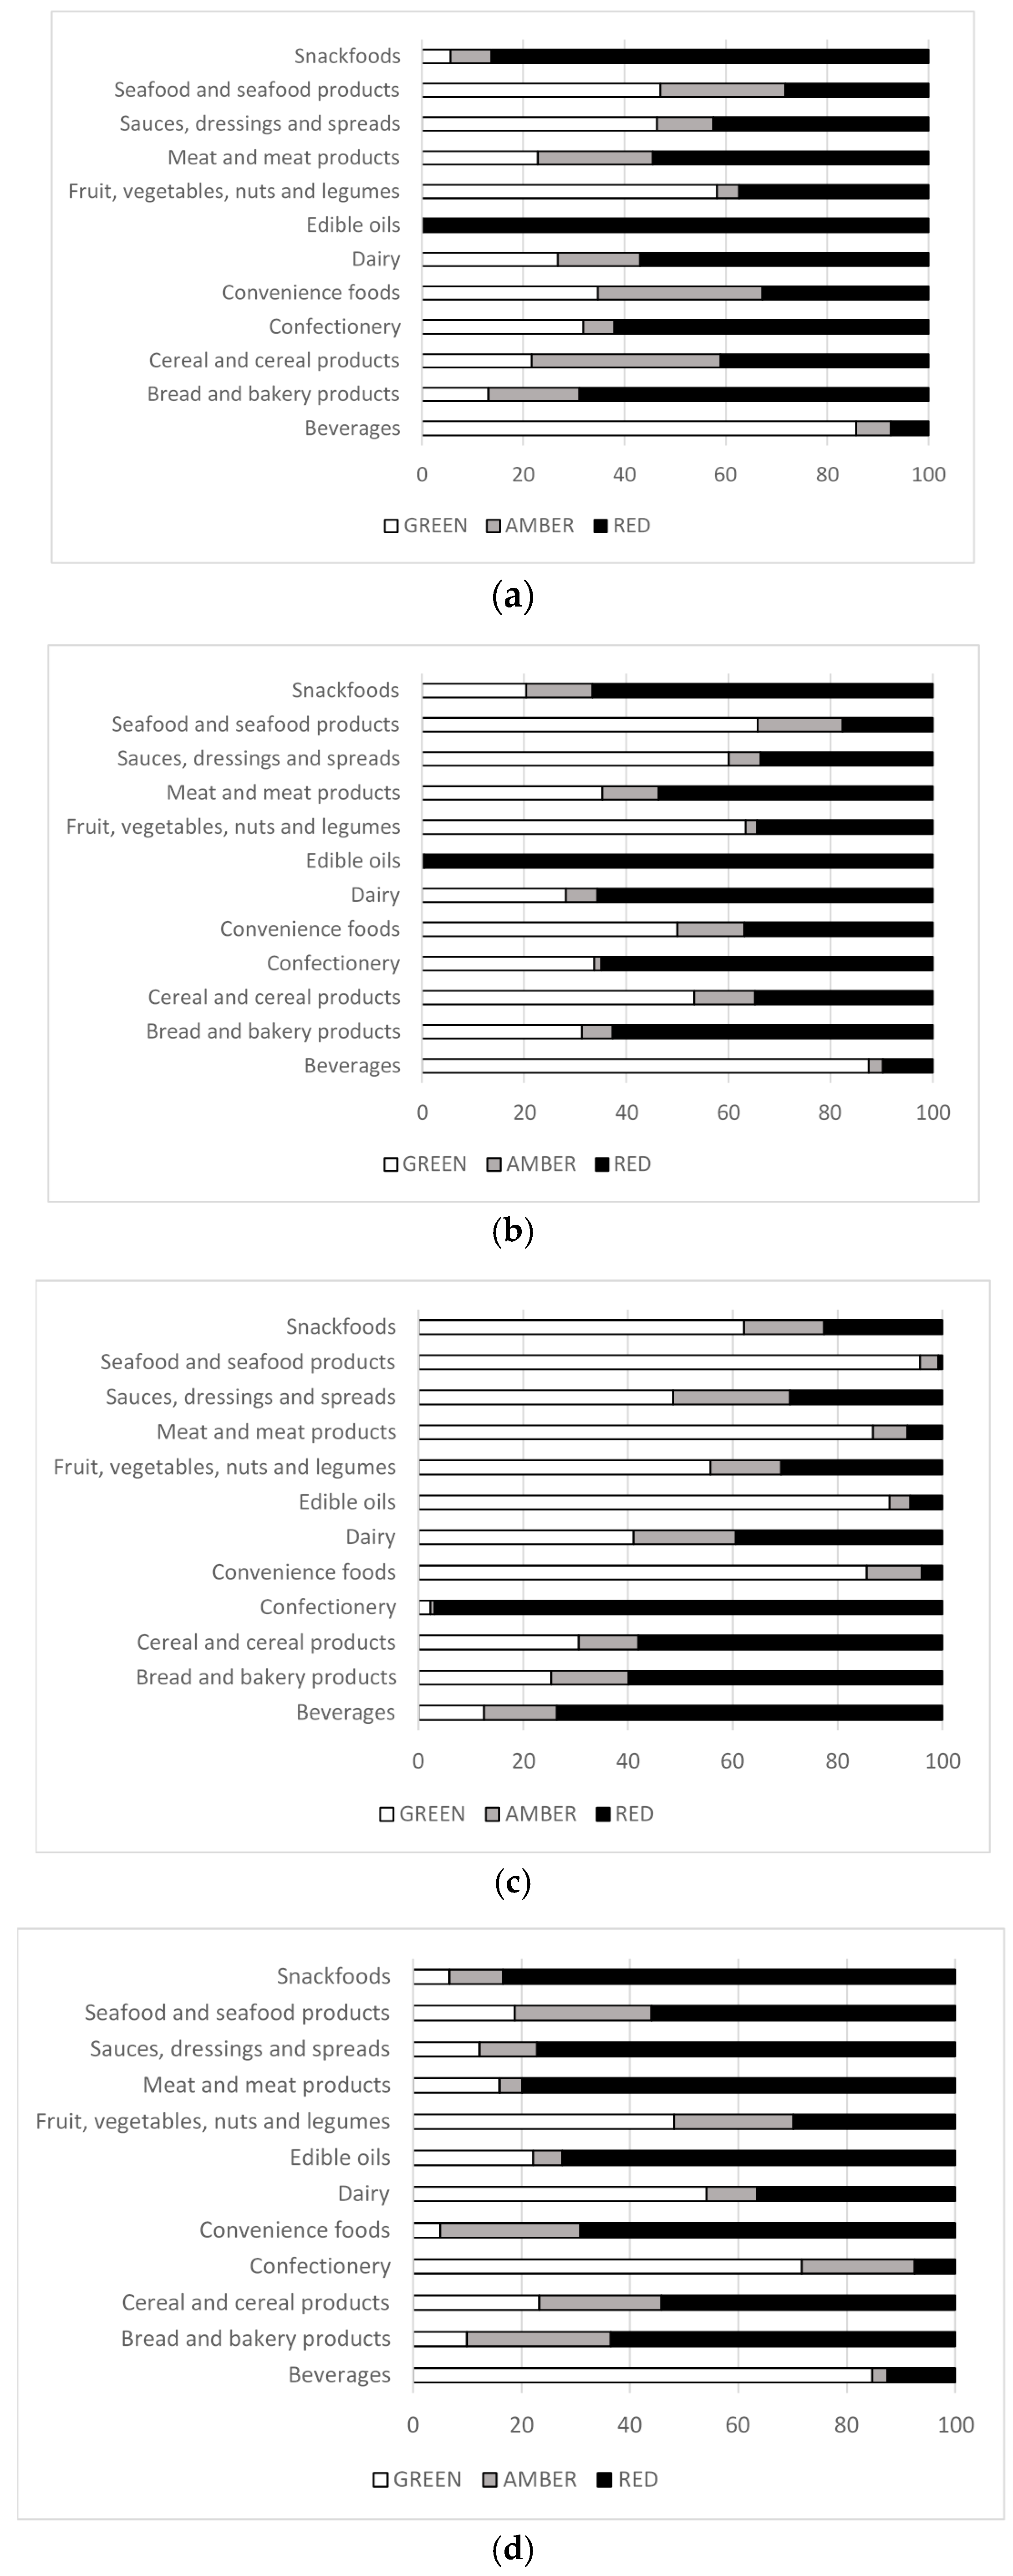
3.5. Traffic Light Label Combinations
4. Discussion
5. Conclusions
Supplementary Materials
Acknowledgments
Author Contributions
Conflicts of Interest
References
- Food and Drug Administration. Food Labeling Guide. Available online: https://www.fda.gov/Food/GuidanceRegulation/GuidanceDocumentsRegulatoryInformation/LabelingNutrition/ucm2006828.htm (accessed on 10 April 2017).
- Ng, S.W.; Slining, M.M.; Popkin, B.M. Turning point for US diets? Recessionary effects or behavioral shifts in foods purchased and consumed. Am. J. Clin. Nutr. 2014, 99, 609–616. [Google Scholar] [CrossRef] [PubMed]
- World Health Organization. Global Status Report on Noncommunicable Diseases 2010. Available online: http://www.who.int/nmh/publications/ncd_report_full_en.pdf (accessed on 10 April 2017).
- Committee on Examination of Front-of-Package Nutrition Rating Systems and Symbols (Phase II); Food and Nutrition Board. Front-of-Package Nutrition Rating Systems and Symbols Promoting Healthier Choices; Wartella, E.A., Lichtenstein, A.H., Yaktine, A., Nathan, R., Eds.; The National Academies Press: Washington, DC, USA, 2012; Available online: https://www.nap.edu/read/13221/chapter/1 (accessed on 10 April 2017).
- Institute of Medicine, Food and Nutrition Board, Committee on Examination of Front-of-Package Nutrition Rating Systems and Symbols (Phase II). Front-of-Package Nutrition Rating Systems and Symbols: Promoting Healthier Choices; Nathan, R., Yaktine, A., Lichtenstein, A.H., Wartella, E.A., Eds.; National Academies Press: Washington, DC, USA, 2012; Volume 3, pp. 332–333.
- Nestle, M. FDA: What is Happening with Front-of-Package Labels? Available online: http://wwwfoodpoliticscom/tag/fopfront-of-packagelabels (accessed on 1 February 2017).
- European Food Information Council. Global Update on Nutrition Labelling Executive Summary February 2016. Available online: http://www.eufic.org/images/uploads/files/ExecutiveSummary.pdf (accessed on 10 February 2017).
- Kelly, B.; Hughes, C.; Chapman, K.; Louie, J.C.; Dixon, H.; Crawford, J.; King, L.; Daube, M.; Slevin, T. Consumer testing of the acceptability and effectiveness of front-of-pack food labelling systems for the Australian grocery market. Health Promot. Int. 2009, 24, 120–129. [Google Scholar] [CrossRef] [PubMed]
- Larrivee, S.; Greenway, F.L.; Johnson, W.D. A statistical analysis of a traffic-light food rating system to promote healthy nutrition and body weight. J. Diabetes Sci. Technol. 2015, 9, 1336–1341. [Google Scholar] [CrossRef] [PubMed]
- Roberto, C.A.; Bragg, M.A.; Schwartz, M.B.; Seamans, M.J.; Musicus, A.; Novak, N.; Brownell, K.D. Facts up front versus traffic light food labels: A randomized controlled trial. Am. J. Prev. Med. 2012, 43, 134–141. [Google Scholar] [CrossRef] [PubMed]
- Roberto, C.A.; Bragg, M.A.; Seamans, M.J.; Mechulan, R.L.; Novak, N.; Brownell, K.D. Evaluation of consumer understanding of different front-of-package nutrition labels, 2010–2011. Prev. Chronic Dis. 2012, 9, E149. [Google Scholar] [CrossRef] [PubMed]
- UK Department of Health. Guide to Creating a Front of Pack (FoP) Nutrition Label for Pre-Packed Products Sold through Retail Outlets. Available online: https://wwwgovuk/government/uploads/system/uploads/attachment_data/file/300886/2902158_FoP_Nutrition_2014pdf (accessed on 1 February 2017).
- BMRB Social Research. Comprehension and Use of UK Nutrition Signpost Labelling Schemes. Available online: http://www.food.gov.uk/multimedia/pdfs/pmpreport.pdf (accessed on 1 February 2017).
- Temple, N.J.; Fraser, J. Food labels: A critical assessment. Nutrition 2014, 30, 257–260. [Google Scholar] [CrossRef] [PubMed]
- Dunford, E.; Webster, J.; Metzler, A.B.; Czernichow, S.; Ni Mhurchu, C.; Wolmarans, P.; Snowdon, W.; L’Abbe, M.; Li, N.; Maulik, P.K.; et al. International collaborative project to compare and monitor the nutritional composition of processed foods. Eur. J. Prev. Cardiol. 2012, 19, 1326–1332. [Google Scholar] [CrossRef] [PubMed]
- Sacks, G.; Tikellis, K.; Millar, L.; Swinburn, B. Impact of ‘traffic-light’ nutrition information on online food purchases in Australia. Aust. N. Z. J. Public Health 2011, 35, 122–126. [Google Scholar] [CrossRef] [PubMed]
- Rosentreter, S.C.; Eyles, H.; Ni Mhurchu, C. Traffic lights and health claims: A comparative analysis of the nutrient profile of packaged foods available for sale in New Zealand supermarkets. Aust. N. Z. J. Public Health 2013, 37, 278–283. [Google Scholar] [CrossRef] [PubMed]
- Young, L.; Swinburn, B. Impact of the Pick the Tick food information programme on the salt content of food in New Zealand. Health Promot. Int. 2002, 17, 13–19. [Google Scholar] [CrossRef] [PubMed]
- Balcombe, K.; Fraser, I.; Falco, S.D. Traffic lights and food choice: A choice experiment examining the relationship between nutritional food labels and price. Food Policy 2010, 35, 211–220. [Google Scholar] [CrossRef]
- Young, L.R.; Nestle, M. The contribution of expanding portion sizes to the US obesity epidemic. Am. J. Public Health 2002, 92, 246–249. [Google Scholar] [CrossRef] [PubMed]
- Piernas, C.; Popkin, B.M. Increased portion sizes from energy-dense foods affect total energy intake at eating occasions in US children and adolescents: Patterns and trends by age group and sociodemographic characteristics, 1977–2006. Am. J. Clin. Nutr. 2011, 94, 1324–1332. [Google Scholar] [CrossRef] [PubMed]
- Julia, C.; Kesse-Guyot, E.; Ducrot, P.; Peneau, S.; Touvier, M.; Mejean, C.; Hercberg, S. Performance of a five category front-of-pack labelling system – The 5-colour nutrition label–To differentiate nutritional quality of breakfast cereals in France. BMC Public Health 2015, 15, 179. [Google Scholar] [CrossRef] [PubMed]
- Curtis, C.J.; Clapp, J.; Niederman, S.A.; Ng, S.W.; Angell, S.Y. US food industry progress during the National Salt Reduction Initiative: 2009–2014. Am. J. Public Health 2016, 106, 1815–1819. [Google Scholar] [CrossRef] [PubMed]
- US Food and Drug Administration. Draft Guidance for Industry: Voluntary Sodium Reduction Goals: Target Mean and Upper Bound Concentrations for Sodium in Commercially Processed, Packaged, and Prepared Foods. Available online: https://www.fda.gov/food/guidanceregulation/guidancedocumentsregulatoryinformation/ucm494732.htm (accessed on 10 April 2017).
- Kypridemos, C.; Guzman-Castillo, M.; Hyseni, L.; Hickey, G.L.; Bandosz, P.; Buchan, I.; Capewell, S.; O'Flaherty, M. Estimated reductions in cardiovascular and gastric cancer disease burden through salt policies in England: An IMPACTNCD microsimulation study. BMJ Open 2017, 7, e013791. [Google Scholar] [CrossRef] [PubMed]
- Ni Mhurchu, C.; Volkova, E.; Jiang, Y.; Eyles, H.; Michie, J.; Neal, B.; Blakely, T.; Swinburn, B.; Rayner, M. Effects of interpretive nutrition labels on consumer food purchases: The Starlight randomized controlled trial. Am. J. Clin. Nutr. 2017, 105, 695–704. [Google Scholar] [CrossRef] [PubMed]
- Volkova, E.; Li, N.; Dunford, E.; Eyles, H.; Crino, M.; Michie, J.; Ni Mhurchu, C. “Smart” RCTs: Development of a smartphone app for fully automated nutrition-labeling intervention trials. JMIR Mhealth Uhealth 2016, 4, e23. [Google Scholar] [CrossRef] [PubMed]
- Jumpertz, R.; Venti, C.A.; Le, D.S.; Michaels, J.; Parrington, S.; Krakoff, J.; Votruba, S. Food label accuracy of common snack foods. Obesity (Silver Spring) 2013, 21, 164–169. [Google Scholar] [CrossRef] [PubMed]
- Mozaffarian, D.; Ludwig, D.S. Dietary guidelines in the 21st century—A time for food. JAMA 2010, 304, 681–682. [Google Scholar] [CrossRef]


| Green (Low) | Amber (Medium) | Red (High) | ||
|---|---|---|---|---|
| Total fat | ≤3.0 g/100 g | >3.0 to ≤17.5 g/100 g | >17.5 g/100 g | >21 g/serving |
| Saturated fat | ≤1.5 g/100 g | >1.5 to ≤5.0 g/100 g | >5.0 g/100 g | >6.0 g/serving |
| Total sugars | ≤5.0 g/100 g | >5.0 to ≤22.5 g/100 g | >22.5 g/100 g | >27 g/serving |
| Sodium | ≤120 mg/100 g | >120 to ≤600 mg/100 g | >600 mg/100 g | >720 mg/serving |
| Green (Low) | Amber (Medium) | Red (High) | ||
|---|---|---|---|---|
| Total fat | ≤1.5 g/100 mL | >1.5 to ≤8.75 g/100 mL | >8.75 g/100 mL | >10.5 g/serving |
| Saturated fat | ≤0.75 g/100 mL | >0.75 to ≤2.5 g/100 mL | >2.5 g/100 mL | >3 g/serving |
| Total sugars | ≤2.5 g/100 mL | >2.5 to ≤11.25 g/100 mL | >11.25 g/100 mL | >13.5 g/serving |
| Sodium | ≤120 mg/100 mL | >120 to ≤300 mg/100 mL | >300 mg/100 mL | >400 mg/serving |
| Total Fat | Saturated Fat | Sugars | Sodium | |||||
|---|---|---|---|---|---|---|---|---|
| n | % | n | % | n | % | n | % | |
| Food | ||||||||
| Green | 50,753 | 31.1 | 68,910 | 42.2 | 79,288 | 48.6 | 45,568 | 27.9 |
| Amber | 24,580 | 15.1 | 11,369 | 7.0 | 20,224 | 12.4 | 29,561 | 18.1 |
| Red | 87,889 | 53.9 | 82,943 | 50.8 | 63,710 | 39.0 | 88,093 | 54.0 |
| Beverages | ||||||||
| Green | 7992 | 67.2 | 8743 | 73.6 | 1692 | 14.2 | 10,360 | 87.2 |
| Amber | 2354 | 19.8 | 812 | 6.8 | 3163 | 26.6 | 468 | 3.9 |
| Red | 1540 | 13.0 | 2331 | 19.6 | 7031 | 59.2 | 1058 | 8.9 |
| All foods | ||||||||
| Green | 58,781 | 33.6 | 77,689 | 44.4 | 81,028 | 46.3 | 55,952 | 31.9 |
| Amber | 26,941 | 15.4 | 12,187 | 7.0 | 23,391 | 13.4 | 30,077 | 17.2 |
| Red | 89,455 | 51.1 | 85,301 | 48.7 | 70,758 | 40.4 | 89,148 | 50.9 |
| Total Fat (g/100 g) | Saturated Fat (g/100 g) | Total Sugars (g/100 g) | Sodium (mg/100 g) | ||||||
|---|---|---|---|---|---|---|---|---|---|
| Food category | n | Mean | Range | Mean | Range | Mean | Range | Mean | Range |
| Beverages | 7075 | 1.7 | 0–56.3 | 1.2 | 0–37.5 | 16.3 | 0–100.0 | 104 | 0–3000 |
| Bread and bakery products | 26,804 | 14.2 | 0–75.0 | 5.4 | 0–52.2 | 20.6 | 0–97.0 | 396 | 0–3069 |
| Cereal and cereal products | 8855 | 9.6 | 0–53.6 | 2.5 | 0–40.7 | 17.4 | 0–75.0 | 427 | 0–6000 |
| Confectionery | 15,394 | 18.3 | 0–100.0 | 10.5 | 0–64.3 | 51.9 | 0–100.0 | 107 | 0–2422 |
| Convenience foods | 14,375 | 6.7 | 0–64.3 | 2.3 | 0–24.2 | 3.1 | 0–63.3 | 541 | 0–29,000 |
| Dairy | 25,815 | 13.7 | 0–85.7 | 8.2 | 0–50.0 | 10.2 | 0–100.0 | 335 | 0–3929 |
| Edible oils and emulsions | 357 | 68.7 | 0–100.0 | 31.0 | 0–71.4 | 2.0 | 0–47.5 | 517 | 0–1950 |
| Seafood | 4876 | 6.0 | 0–84.9 | 1.3 | 0–25.9 | 0.8 | 0–38.3 | 464 | 0–10,625 |
| Foods for specific dietary use | 2053 | 13.1 | 0–46.4 | 4.9 | 0–27.7 | 18.1 | 0–100.0 | 267 | 0–1282 |
| Fruit, vegetables, nuts and legumes | 26,861 | 15.5 | 0–100.0 | 2.5 | 0–66.7 | 13.6 | 0–95.2 | 252 | 0–6300 |
| Meat and meat products | 12,374 | 13.6 | 0–100.0 | 4.7 | 0–38.5 | 2.7 | 0–57.1 | 781 | 0–8375 |
| Sauces, dressings and spreads | 18,805 | 14.4 | 0–100.0 | 2.6 | 0–64.3 | 10.2 | 0–100.0 | 751 | 0–19,286 |
| Snack foods | 11,464 | 22.9 | 0–91.7 | 5.4 | 0–60.0 | 10.3 | 0–98.9 | 651 | 0–7800 |
| TOTAL | 175,108 | 13.8 | 0–100.0 | 4.8 | 0–71.4 | 15.3 | 0–100.0 | 424 | 0–29,000 |
© 2017 by the authors. Licensee MDPI, Basel, Switzerland. This article is an open access article distributed under the terms and conditions of the Creative Commons Attribution (CC BY) license (http://creativecommons.org/licenses/by/4.0/).
Share and Cite
Dunford, E.K.; Poti, J.M.; Xavier, D.; Webster, J.L.; Taillie, L.S. Color-Coded Front-of-Pack Nutrition Labels—An Option for US Packaged Foods? Nutrients 2017, 9, 480. https://doi.org/10.3390/nu9050480
Dunford EK, Poti JM, Xavier D, Webster JL, Taillie LS. Color-Coded Front-of-Pack Nutrition Labels—An Option for US Packaged Foods? Nutrients. 2017; 9(5):480. https://doi.org/10.3390/nu9050480
Chicago/Turabian StyleDunford, Elizabeth K., Jennifer M. Poti, Dagan Xavier, Jacqui L. Webster, and Lindsey Smith Taillie. 2017. "Color-Coded Front-of-Pack Nutrition Labels—An Option for US Packaged Foods?" Nutrients 9, no. 5: 480. https://doi.org/10.3390/nu9050480
APA StyleDunford, E. K., Poti, J. M., Xavier, D., Webster, J. L., & Taillie, L. S. (2017). Color-Coded Front-of-Pack Nutrition Labels—An Option for US Packaged Foods? Nutrients, 9(5), 480. https://doi.org/10.3390/nu9050480