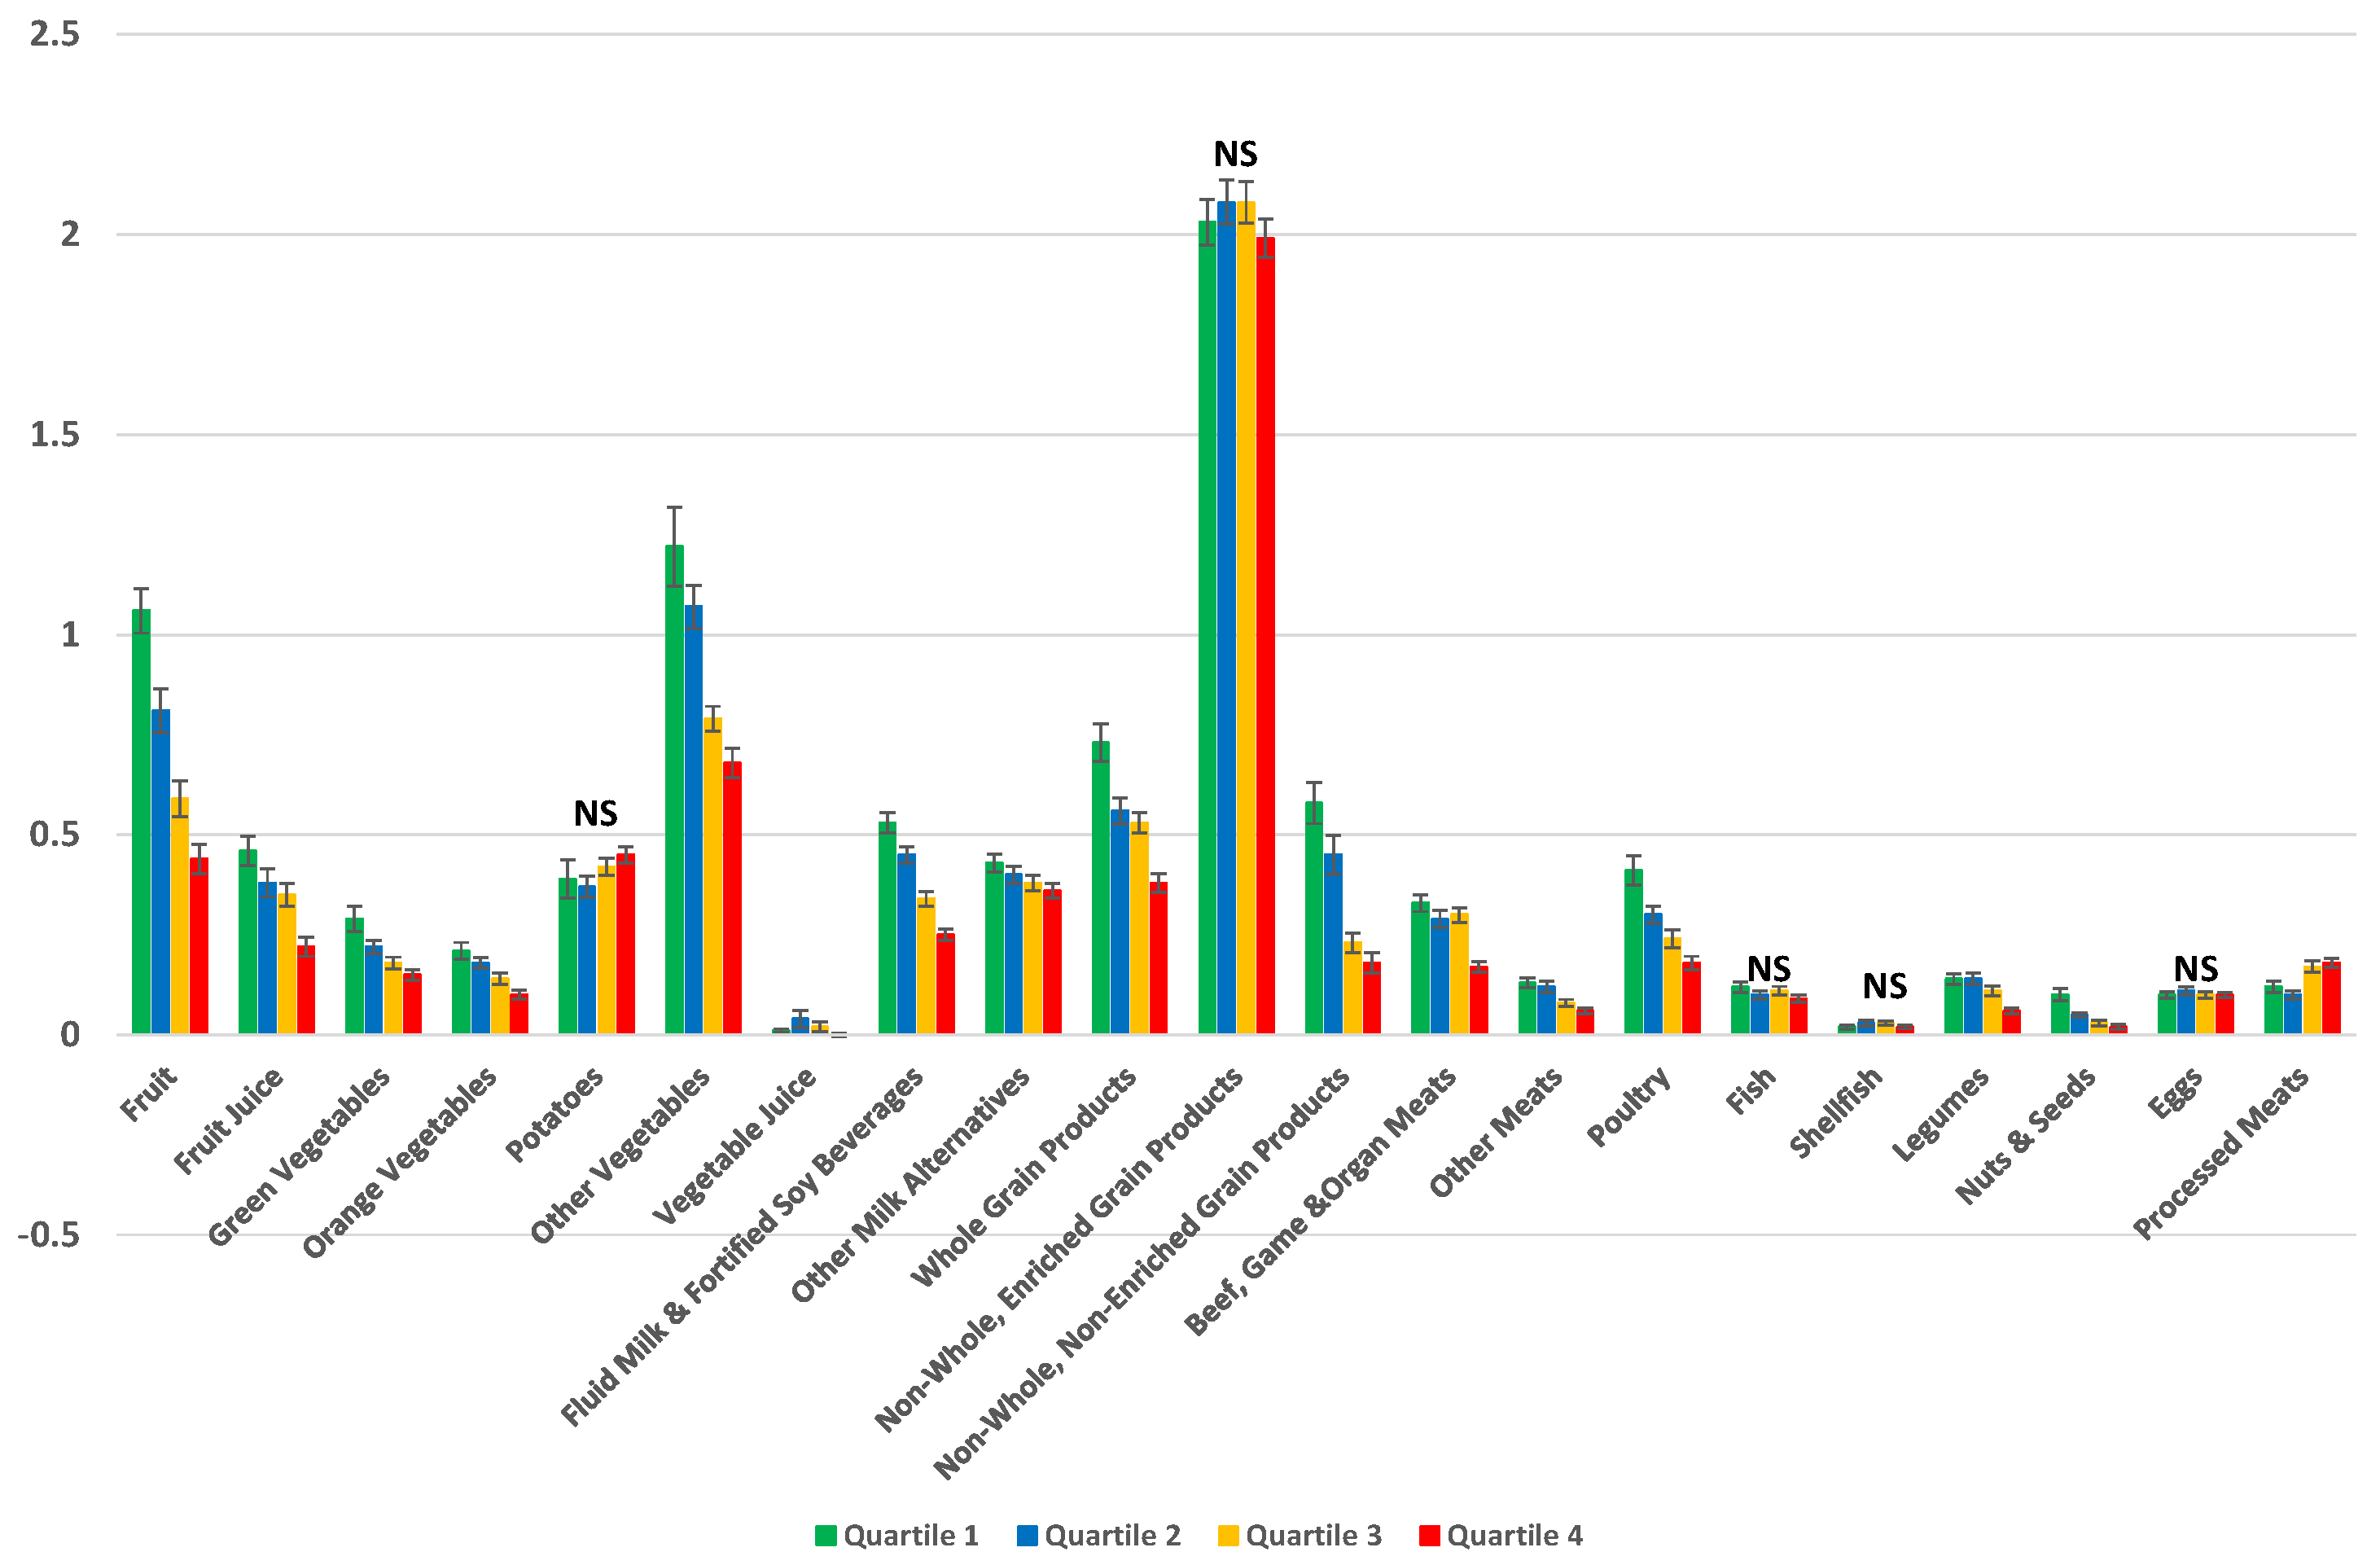
Due to a mistake in the publication process, “NS” symbols are missing from Figure 3 from this article [1]. The correct figure is shown below.
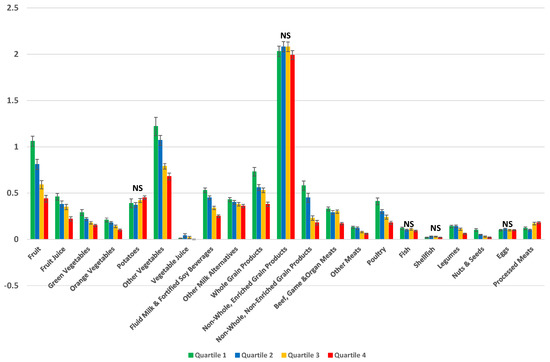
Figure 3.
Implementation of 2014 Health Canada Surveillance Tool Tier system to the dietary intakes of Canadian adults (≥19 years) in a weighted analysis to assess the number of servings from each of the ‘Eating Well with Canada’s Food Guide’ subgroups per 1000 kcal [25]. Dietary profiles of compliers (Quartile 1) *, intermediates (Quartiles 2 and 3) †, and non-compliers (Quartile 4) ‡ are compared §,‖ NS, Not significant; * The 25% of individuals with the lowest percentage of energy from Tier 4 and “other” foods and beverages; † The individuals in the interquartile range for energy intakes from Tier 4 and “other” foods and beverages; ‡ The 25% of individuals with the highest percentage of energy from Tier 4 and “other” foods and beverages; § Adjusted for age, sex, and misreporting status (under-reporters, plausible-, and over-reporters); ‖ Quartiles are based upon percentage of energy from all Tier 4 foods based on 2014 Health Canada’s Surveillance Tool Tier system plus “other” foods and beverages not recommended in the Eating Well with Canada’s Food Guide.
The change does not affect the scientific results. The manuscript will be updated and the original will remain online on the article webpage. We would like to apologize for any inconvenience caused to the readers by this mistake.
Conflicts of Interest
The authors declare no conflict of interest.
Reference
- Jessri, M.; Nishi, S.K.; L’Abbé, M.R. Assessing the Nutritional Quality of Diets of Canadian Adults Using the 2014 Health Canada Surveillance Tool Tier System. Nutrients 2015, 7, 10447–10468. [Google Scholar] [CrossRef] [PubMed]
© 2017 by the authors; licensee MDPI, Basel, Switzerland. This article is an open access article distributed under the terms and conditions of the Creative Commons Attribution (CC-BY) license (http://creativecommons.org/licenses/by/4.0/).