Abstract
Background/Objectives: Genetic variation has been thought to alter the human dietary requirement for choline and subsequent circulating levels of its metabolites betaine and dimethylglycine (DMG). The aim of this genome-wide association study (GWAS) was to identify single nucleotide polymorphisms (SNPs) associated with serum choline, betaine, and dimethylglycine (DMG) as well as choline-to-betaine and betaine-to-DMG ratios. Methods: Data from the Collaborative Study of Genes, Nutrients and Metabolites (CSGNM; n = 2402) were used to model individual associations of choline, betaine, and DMG circulating metabolites and their ratios with 680,975 SNPs, using linear regression. Models were unadjusted (model 1), adjusted for age and sex (model 2), and further adjusted for selected principal components (model 3) and B12, B9, B6, and holotranscobalamin (model 4). Statistical significance was set at p < 5.0 × 10⁻⁵. Affected SNPs in the dbSNP (database of Single Nucleotide Polymorphisms) were then identified. Results: GWAS revealed both intuitive and novel results, including the recently described SLC25A48, several intronic variants in the gene encoding LYPLAL1, and a pair of SNPs present in the intronic region of PID1 related to serum choline. SNPs related to betaine and DMG included SLCA12, BHMT, DMGDH, and additional SLC family transporters that require further validation. While exploratory, GWAS of the choline-to-betaine and betaine-to-DMG ratios revealed common targets with direct links to choline and one-carbon metabolism. Conclusions: These results suggest that metabolic handling of choline has genetic determinants not formerly recognized in the scientific literature. Replication is needed in larger cohorts due to low statistical power.
1. Introduction
An adequate supply of choline is essential for supporting its diverse physiological functions, including maintenance of hepatic, cardiovascular, and neurological function [1,2]. Choline is a critical metabolic substrate for the synthesis of the following: phosphatidylcholine, a key component of membranes; lipoproteins, cell signaling compounds; acetylcholine, a critical neurotransmitter; and betaine, an osmolyte and methyl donor that supports one-carbon metabolism. Choline’s oxidation to betaine and use as a methyl donor by betaine-homocysteine methyltransferase (BHMT) regenerates methionine from homocysteine, yielding dimethylglycine (DMG), which can be further oxidatively demethylated and contribute one-carbon units to folate for use in one-carbon metabolism to support methylation reactions as well as the synthesis of nucleotides.
Maintenance of an adequate supply of choline to tissues is supported by the endogenous synthesis of choline through the phosphatidylethanolamine N-methyltransferase pathway, but it is insufficient to maintain plasma choline and betaine levels and organ function without an exogenous source of choline in the diet. When dietary choline intakes are adequate, plasma levels of choline, betaine, and DMG can still vary considerably among healthy individuals (7–20 μM, 20–60 μM, and 2.5–7.5 μM, respectively) [3]. In general, dietary intakes of choline and betaine only minimally impact plasma levels [4], suggesting other biological factors are likely to influence metabolite homeostasis. To date, little is known about variation in metabolic kinetics that might influence plasma metabolite concentrations, including variability in choline and betaine absorption, altered distribution of metabolites between plasma and tissue compartments, altered metabolism, and/or altered excretion.
It is thought that genetic factors may contribute to the metabolic homeostasis of choline, betaine, and DMG. Several common single nucleotide polymorphisms (SNPs) in genes encoding enzymes involved in choline and one-carbon metabolism have been thought to significantly modify the odds of developing organ dysfunction under conditions of deficiency [5]. However, this body of research comprises predominantly post hoc analyses of smaller trials that have employed a candidate gene approach, and variants in these candidate genes explain only a limited degree of the variation in circulating metabolite concentrations, suggestive of untapped genetic determinants.
The emergence of studies with high-throughput genomic data as well as metabolite analysis have allowed for the discovery of novel genetic determinants of circulating metabolites. These cohorts facilitate the discovery of SNPs that influence plasma metabolite levels and additionally have the potential to uncover novel proteins involved in metabolic homeostasis. Indeed, recent genome-wide association studies (GWAS) assessing plasma choline levels have uncovered candidate transporters for the ubiquitously expressed plasma membrane transporter not previously associated with choline dynamics [6]. Candidate SNPs identified in these analyses also serve as potential modifiers of nutrient intake requirements, broadening the rationale for precision nutrition investigations. While GWAS hold great potential, results from our systematic review of genetic determinants of 42 circulating choline-related metabolites, primarily trimethylamine N-oxide (TMAO), betaine, sphingomyelins, lysophosphatidylcholines, and phosphatidylcholines, identified a need to undertake GWAS analyses in well-phenotyped cohorts that assessed choline and its metabolites using targeted, absolute quantification (as opposed to the untargeted, relative quantification values common to metabolomic data) [7]. To this end, we have undertaken a GWAS of serum choline, betaine, and DMG utilizing data from the Collaborative Study of Genes, Nutrients and Metabolites (CSGNM) to expand on the genetic determinants of circulating metabolite concentrations and facilitate the discovery of candidates for functional analyses.
2. Materials and Methods
2.1. Study Sample
The CSGNM conducted genome-wide genotyping and serum metabolite quantification on 2402 ethnically Irish participants attending Trinity College Dublin, who were recruited between February 2003 and 2004 [8]. Participants provided a non-fasting blood sample for genetic and circulating metabolite quantification. Extracted DNA was genotyped using the HumanOmni1-Quad BeadChip (Illumina, San Diego, CA, USA). Circulating choline, betaine, and DMG were reported in micromoles per liter. Participants also completed a diet, lifestyle, and demographics questionnaire, which included information on age, sex, height, weight, medical conditions, smoking, dietary habits, and consumption of alcohol, fortified foods, and dietary supplements. Participants with non-Irish grandparents, major medical problems, or missing questionnaires were excluded from the cohort. We requested the CSGNM data for the present analyses from the dbGaP (database of Genotypes and Phenotypes) (n = 2232) [9]. The study has been described in detail elsewhere [8].
2.2. Genetic Quality Control
Genetic data quality control was conducted using PLINK (version 1.9) [10]. SNPs were limited to autosomal chromosomes. SNPs and individuals with a >20% missingness rate, call rate < 98%, minor allele frequency (MAF) < 0.05, or Hardy–Weinberg equilibrium p < 1 × 10⁻⁶ were excluded from our analyses. Sex discrepancies were checked; males with a homozygosity estimate < 0.08 and females with a homozygosity estimate > 0.2 were excluded from our analyses. Relatedness was investigated by calculating identity by descent of all sample pairs. If pi-hat was >0.2, the related pairs were excluded from our analyses. Individuals who deviated more than 3 SD from the heterozygosity rate mean were additionally excluded from our analyses. The 1000 Genomes Project data served as a reference to help define genetic ancestry [11]. Multidimensional scaling (MDS) analysis was conducted using PLINK to evaluate population structure and identify ethnic outliers by anchoring individual genetic data to the 1000 Genomes reference panel. Genotype data from CSGNM and 1000 Genomes were merged after harmonizing SNP sets, aligning reference alleles, and resolving strand inconsistencies. A pairwise identity-by-state (IBS) distance matrix was computed from linkage disequilibrium-pruned SNPs. An MDS plot was created using RStudio. We then performed MDS using only the Irish samples after excluding any potential ethnic outliers. The top 10 MDS components derived from the Irish samples were then extracted. To determine component inclusion, Scree and Scree-Eigen plots were created using the factoextra R package (version 1.0.7). Due to the small sample size, imputation and fine mapping were not performed in these analyses.
2.3. Genome-Wide Association and Statistical Analysis
The distribution of serum choline was visualized with a histogram and QQ plot and quantitatively tested using the Shapiro–Wilk test. Genome-wide association analysis was performed using linear regression models to test the individual association of serum choline, betaine, and DMG as well as choline-to-betaine and betaine-to-DMG ratio concentrations (in micromoles per liter) with 680,975 SNPs, under an additive genetic model. Serum choline models were unadjusted (model 1), adjusted for age and sex (model 2), and further adjusted for selected principal components (PCs) (model 3) and B12, B9, B6, and holotranscobalamin (HoloTC) (model 4). Models 3 and 4 were employed for serum betaine, DMG, and choline-to-betaine and betaine-to-DMG ratios. λ values were assessed in all choline-to-betaine and betaine-to-DMG ratio models. The analysis was conducted in R (version 4.2.0; R Foundation for Statistical Computing) on the Tufts University secure high-performance computing cluster.
QQ plots were used to visualize deviations of the observed p-values for each SNP under the null hypothesis. p < 5.0 × 10⁻⁵ was used as the genome-wide statistical significance threshold. False discovery rate (FDR) adjustments were performed for comparison using 0.05 as the significance threshold. Significant SNPs were searched for in the National Center for Biotechnology Information dbSNP (database of Single Nucleotide Polymorphisms) [12] to identify the associated gene. LocusZoom [13] was used to create a plot displaying association signals, linkage disequilibrium, and nearby genes for relevant loci from choline model 3. Significant SNPs from models 3 and 4 were searched on the National Institutes of Health Genotype-Tissue Expression (GTEx) Portal [14] to determine whether SNPs were significantly associated with altered gene expression levels in tissues. A final p < 5.0 × 10⁻⁵ was used as the genome-wide significance threshold. FDR correction was also applied as an additional method and used to compare against SNPs meeting the p < 5.0 × 10⁻⁵ threshold, using an FDR threshold of < 0.05. Finally, we compared SNPs identified in our GWAS with those within our previously published scoping review [7], which sought to identify and summarize reported SNPs present in the scientific literature prior to these analyses.
3. Results
3.1. Participant Characteristics
A summary of participant characteristics is displayed in Table 1. The total genotyping rate was 0.99. All participants passed the 98% call rate. We removed 3095 variants with a missingness rate > 20%, 71,983 variants with a MAF < 0.05, and 1524 variants with a Hardy–Weinberg equilibrium p < 1 × 10⁻⁶ from the dataset. Thus, there are a total of 604,373 SNPs included in our analyses. Since genetic data on participant sex were not available via dbGaP, phenotypic data were utilized in the analyses. No related individuals with a pi-hat value > 0.02 were identified in the dataset. We removed 12 participants from the dataset (8 with a heterozygosity rate deviating >3 SD from the mean and 4 with missing serum choline data). An MDS plot anchored to 1000 Genomes reference data is presented in Figure 1. For component inclusion, according to the Scree plot, there was a noticeable inflection point at component 4. The Scree-Eigen plot showed the first five components had eigenvalues > 1. Thus, components 1 to 4 were included as covariates based on information from the Scree (Figure S1) and Scree-Eigen (Figure S2) plots.

Table 1.
Participant characteristics.
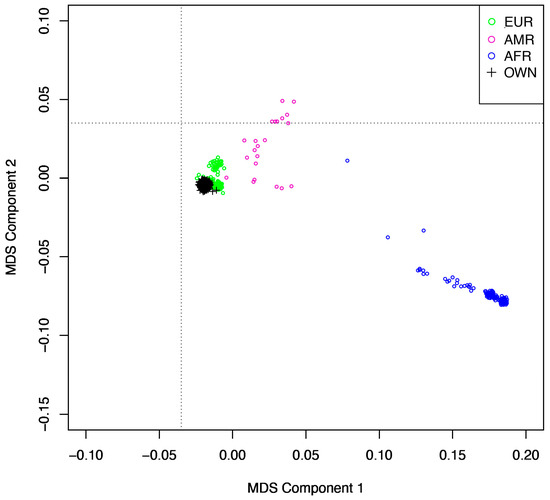
Figure 1.
Multidimensional scaling plot of the study cohort anchored to the 1000 Genomes reference panel. AFR = African ancestry; AMR = Admixed American ancestry; EUR = European ancestry; OWN = the study cohort.
3.2. Metabolite Distributions
Based on histogram, QQ plot, and Shapiro–Wilk test results for serum choline (W = 0.96, p < 2.2 × 10⁻¹⁶), betaine (W = 0.98, p < 2.2 × 10⁻¹⁶), and DMG (W = 0.90, p < 2.2 × 10⁻¹⁶), the distribution of each metabolite was right skewed. Therefore, log-transformations were applied to normalize the distributions.
3.3. GWAS of Serum Choline, Betaine, and DMG
All SNP and regression results from model 3 that met the p < 5.0 × 10⁻⁵ significance threshold are presented in Table 2, Table 3 and Table 4. Model 4 results and FDR comparisons are presented in Tables S1–S3. QQ plots used to visualize deviations of the observed p-values for each SNP under the null hypothesis are presented in Figures S3, S4 and S5 for choline, betaine, and DMG (model 3), respectively. QQ plots for choline, betaine, and DMG (model 4) are presented in Tables S6, S7 and S8, respectively. All results from model 3 are visualized in the circular Manhattan plot presented in Figure 2. Model 3 results for SNPs in choline and folate metabolism that have previously been identified to modify the risk of organ dysfunction in post hoc analyses of controlled feeding studies that administer choline-deficient diets (<50 mg/d) to participants are presented in Table 5. None of these SNPs reached statistical significance (p < 5.0 × 10⁻⁵). A LocusZoom plot of chromosome 5 from the choline model results is presented in Figure 3. Data from GTEx that matched genes from SNP IDs meeting the significance threshold for model 3 are presented in Tables S7, S8, S10, S11, S13 and S14.
Table 2.
GWAS of serum choline (model 3).
Table 3.
GWAS of serum betaine (model 3).
Table 4.
Serum DMG model results adjusted for age, sex, and PCs.
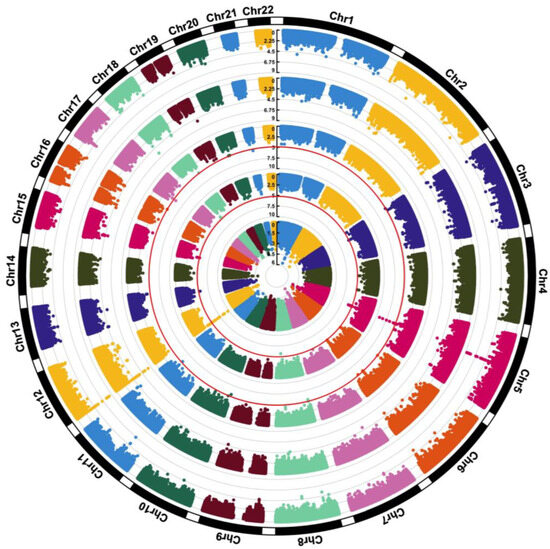
Figure 2.
A circular Manhattan plot visualizing all model 3 results (adjusted for age, sex, and PCs). Starting from the inner circle, the rings represent choline, betaine, DMG, and the choline-to-betaine and betaine-to-DMG ratios. The scales represent GWAS p-values, individual data points represent SNPs, and SNPs are aggregated by chromosome. Red circular lines mark the significance p value threshold.
Table 5.
GWAS results for SNPs classically associated with choline and folate metabolism (model 3).
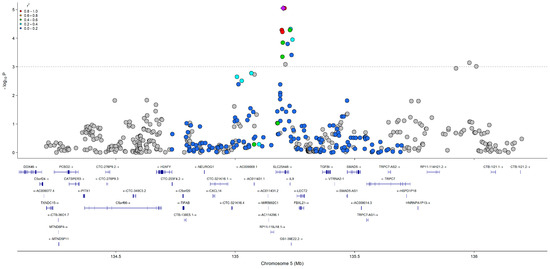
Figure 3.
LocusZoom plot of chromosome 5 from the choline GWAS (model 3), displaying association signals, linkage disequilibrium, and nearby genes. The purple diamond indicates the most significant SNP, and gray solid circles indicate SNPs not in NIH LDlink API database.
3.4. GWAS of Serum Choline-to-Betaine and Betaine-to-DMG Ratios
Both choline-to-betaine and betaine-to-DMG ratio distributions were right skewed. Therefore, for clarity of the interpretation of results, genomic control (λ) values were checked for both the choline-to-betaine (model 3: λ = 0.982; model 4: λ = 0.97) and betaine-to-DMG (model 3: λ = 1.01; model 4: λ = 1.01) ratio models. No transformations were performed, since λ values were deemed acceptable for both ratio models. SNP and regression results from model 3 with a p < 5.0 × 10⁻⁵ significance threshold for the choline-to-betaine and betaine-to-DMG ratio models are presented in Table 6 and Table 7, respectively. Model 4 results and FDR comparisons are presented in Tables S4 and S5. QQ plots used to visualize deviations of the observed p-values for each SNP under the null hypothesis are presented in Figures S9 and S10 for choline-to-betaine and betaine-to-DMG ratios (model 3), respectively. QQ plots for choline-to-betaine and betaine-to-DMG ratios (model 4) are presented in Tables S11 and S12, respectively. Data from GTEx that matched genes from SNP IDs meeting the significance threshold for model 3 are presented in Tables S18 and S19.
Table 6.
GWAS of serum choline-to-betaine ratio (model 3).
Table 7.
GWAS of serum betaine-to-DMG ratio (model 3) PCs.
3.5. SNP Literature Comparison
In our recent scoping review, we identified 577 SNPs from prior GWAS of circulating choline metabolites, of which only 28 were identified in ≥2 unique cohorts. None of these SNPs previously identified in the scientific literature met our p < 5.0 × 10⁻⁵ significance threshold; however, 2 SNPS (rs1800588 and rs261332) reached the p < 5.0 × 10⁻³ threshold.
4. Discussion
Although wide variability in circulating choline, betaine, and DMG is observed in generally healthy populations, determinants of this variation are poorly characterized in the scientific literature to date. The results of this GWAS indicate the potential for significant genetic determinants of these key metabolites. While our results certainly require repetition in larger cohorts, they are useful as candidate genes for functional analyses to uncover novel cellular determinants of choline handling and metabolism and for future exploration in diet-x-genotype analyses aiming to advance ‘precision nutrition’.
The idea that genetic variants modify choline metabolism is generally supported by post hoc analyses of controlled feeding trials demonstrating that when individuals are fed choline-deficient diets, the carrier status for common SNPs in choline and folate metabolism dramatically modifies the risk of displaying choline deficiency–associated organ dysfunction [5,15]. Whether such genetic variants play a role in explaining the variation in circulating choline metabolites in the general population has received limited attention, in part due to the lack of large cohorts with complete genetic and metabolite data. In our analysis, classical variants described as modifiers of choline deficiency–associated phenotypes did not emerge as determinants of plasma choline (Table 5). Rather, SNPs nearby to genes not previously linked directly to choline metabolism emerged in our analysis, with the exception of the recently described solute carrier SLC25A48 locus that encodes the mitochondrial choline importer [16,17].
Several of these novel SNPs not previously linked to choline homeostasis, particularly those with multiple SNPs, may be worthy of additional functional characterization. While the emergence of SLC25A48 in this analysis is encouraging, we note caution in assuming observed relationships represent causal links to choline biology. Several intronic variants in the gene encoding lysophospholipase 1 (LYPLAL1), a cytosolic acyl thioesterase protein reported to de-palmitoylate its target proteins, were associated with serum choline concentrations; intriguingly, LYPLAL1 has been reported to lack lysophospholipase activity, a potential avenue toward a more direct link to choline homeostasis through lysophosphatidylcholine metabolism. LYPLAL1 has not previously been associated directly with choline metabolism; given its broad tissue expression profile and the limited description of its target proteins for de-palmitoylation, its link to choline metabolism remains speculative. Variants in LYPLAL1 have been associated with other metabolic phenotypes, including waist-to-hip ratio, fat distribution, and metabolic dysfunction-associated steatotic liver disease (MASLD; previously nonalcoholic fatty liver disease or NAFLD) [18,19,20,21,22,23], and results in sex-specific body composition phenotypes in LYPLAL1 knockout mice, which suggests that this protein’s de-palmitoylation activity has broad effects on metabolic homeostasis. Consistent with such sex-specific effects in the knockout mouse, an indirect link between LYPLAL1 and choline homeostasis may result from differences in estrogen signaling secondary to altered palmitoylation of its receptor [24]. An additional pair of SNPs present in the intronic region of phosphotyrosine interaction domain containing 1 (PID1) emerged in our analysis that have also been reported to regulate key metabolic processes, including the clearance of triglyceride-rich lipoproteins as well as antagonizing insulin receptor signaling, and common variants in PID1 are associated with obesity and cardiometabolic disease. Direct links between PID1 and choline metabolism have also not been reported but might theoretically occur due to altered lipoprotein fluxes and redistribution of choline across metabolic compartments.
Our GWAS results for serum betaine and DMG, the oxidative products of choline metabolism that shunt choline toward one-carbon metabolism, revealed both intuitive and novel results worthy of exploration in repetition cohorts and for further functional validation. Top hits directly related to betaine and DMG metabolism included the following: SLC6A12, the known sodium- and chloride-dependent betaine transporter; BHMT, catalyzing the use of betaine as a methyl donor to remethylate homocysteine; and dimethylglycine dehydrogenase (DMGDH), catalyzing the use of DMG as a methyl donor in mitochondrial folate metabolism. While directly linked to choline and one-carbon metabolism, it is intriguing that few variants in these genes have yet been explored as potential modifiers of the dietary choline requirement or in the heterogeneous metabolic responses to choline and betaine supplementation. Additional SLC family transporters also emerged from our analysis, including SLC6A13 and SLC22A3, that require further functional validation for links to one-carbon metabolism.
In addition to absolute concentrations of metabolites, we explored novel ratio outcome variables (choline-to-betaine and betaine-to-DMG) given their direct metabolic interrelationships and potential to inform upon metabolic partitioning. Ratios of choline metabolites have previously been explored in small, randomized trials as well as epidemiological cohorts, but they have received little attention in GWAS investigations. While exploratory, it is notable that this approach revealed common targets, including a broader array of SLC6A12 variants, and a novel lipid droplet-associated phosphatidylserine hydrolase (LDAH), of theoretical relevance given phosphatidylcholine’s role as a precursor to phosphatidylserine. Few other direct links to choline and one-carbon metabolism emerged, questioning the added benefit of this approach; further exploration in larger cohorts is warranted.
Our results have notable strengths and limitations worth highlighting. Our results build on the emerging analyses of cohorts with both whole-genome sequencing as well as metabolomic data, facilitating the uncovering of genetic determinants of metabolic homeostasis and potentially novel genes involved in metabolic regulation. The use of CSGNM data is particularly useful due to the targeted absolute quantification of several nutritional biomarkers, whereas other cohorts use metabolomic data that have semi-quantitative analyses (e.g., untargeted NMR metabolomics). We sought to leverage these strengths to undertake an exploratory GWAS that could consider not only predictors of absolute serum concentrations but also adjust for nutrient status indicators, a critical consideration given the many nutrient–nutrient interactions across choline and one-carbon metabolism. Our analyses, however, have significant limitations, largely owing to the relatively small sample size of the CSGNM cohort and resulting limited statistical power within our analyses. The use of a p-value threshold of 5.0 × 10⁻⁵, which is common in exploratory settings, increases the risk of false positives. While our analysis contained important internal positive controls, such as our observation that variants in SLC25A48, a recently recognized mitochondrial choline importer, are associated with circulating serum choline, betaine, DMG, choline-to-betaine, and/or betaine-to-DMG, not all variants observed are necessarily true genetic determinants and may indeed be false positives. The LD of the region could be indicated by a different gene located close to the signal. The wide array of targets without clear or direct links to choline or general metabolic processes may yield potential insights into cellular determinants of choline homeostasis, but they should generally be viewed with caution until repetition in larger cohorts provide similar signals for these loci and/or other plausible physiological links emerge. Furthermore, the generalizability of our results may be limited by changing in lifestyle, environment, or medical advances over time, given the CSGNM cohort data are 20 years old. We further note that the CSGNM cohort is comprised solely of individuals of Caucasian descent, which inhibits broad extrapolation of the results. Future research should replicate or validate our findings using more recent data.
5. Conclusions
In summary, the results of this GWAS suggest that metabolic handling of choline has genetic determinants not formerly recognized in the scientific literature. However, replication is needed in larger cohorts due to low statistical power.
Supplementary Materials
The following supporting information can be downloaded at https://www.mdpi.com/article/10.3390/nu17162630/s1: Table S1: Choline—B-vitamin adjusted GWAS results. Table S2: Betaine—B-vitamin adjusted GWAS results. Table S3: Dimethylglycine—B-vitamin adjusted GWAS results. Table S4: Choline-to-betaine ratio—B-vitamin adjusted GWAS results. Table S5: Betaine-to-dimethylglycine—B-vitamin adjusted GWAS results. Table S6: Choline adjusted GWAS results. Table S7: Choline adjusted-GTEx GWAS results. Table S8: Choline and B-vitamin adjusted-GTEx GWAS results. Table S9: Betaine adjusted GWAS results. Table S10: Betaine adjusted-GTEx GWAS results. Table S11: Betaine and B-vitamin adjusted-GTEx GWAS results. Table S12: Dimethylglycine adjusted GWAS results. Table S13: Dimethylglycine adjusted-GTEx GWAS results. Table S14: Dimethylglycine and B-vitamin adjusted-GTEx GWAS results. Table S15: Betaine-to-dimethylglycine ratio adjusted GWAS results. Table S16: Choline-to-betaine ratio adjusted GWAS results. Table S17: Choline-to-betaine and B-vitamin adjusted-GTEx GWAS results. Table S18: Betaine-to-dimethylglycine adjusted-GTEx GWAS results. Table S19: Betaine-to-dimethylglycine and B-vitamin adjusted-GTEx GWAS results. Figure S1: Scree plot. Figure S2: Scree-Eigen plot. Figure S3: QQ plot for choline GWAS. Figure S4: QQ plot for betaine GWAS. Figure S5: QQ plot for dimethylglycine GWAS. Figure S6: QQ plot for choline GWAS (b-vitamin adjusted). Figure S7: QQ plot for betaine GWAS (b-vitamin adjusted). Figure S8: QQ plot for dimethylglycine GWAS (b-vitamin adjusted). Figure S9: QQ plot for choline-to-betaine ratio GWAS. Figure S10: QQ plot for betaine-to-dimethylglycine ratio GWAS.
Author Contributions
Conceptualization, T.C.W. and M.C.; methodology, L.E.L., K.C.K., T.C.W., J.M. and M.C.; software, L.E.L., K.C.K., T.C.W., J.M. and M.C.; validation, L.E.L., K.C.K., T.C.W., J.M. and M.C.; formal analysis, L.E.L.; investigation, L.E.L., K.C.K., T.C.W., J.M. and M.C.; resources, T.C.W., J.M. and M.C.; data curation, L.E.L., K.C.K., T.C.W., J.M. and M.C.; writing—original draft preparation, L.E.L.; writing—review and editing, L.E.L., K.C.K., T.C.W., J.M. and M.C.; visualization, L.E.L., K.C.K., T.C.W., J.M. and M.C.; supervision, T.C.W. and M.C.; project administration, T.C.W. and M.C.; and funding acquisition, T.C.W. All authors have read and agreed to the published version of the manuscript.
Funding
This work was primarily supported by an investigator-initiated unrestricted educational grant from the Egg Nutrition Center to Think Healthy Group, LLC. The data used in this study were supported by the Intramural Research Programs of the National Institutes of Health, the National Human Genome Research Institute, and the Eunice Kennedy Shriver National Institute of Child Health and Development. The Genotype-Tissue Expression (GTEx) Project was supported by the Common Fund of the Office of the Director of the National Institutes of Health and by the National Cancer Institute, the National Human Genome Research Institute, the National Heart, Lung, and Blood Institute, the National Institute on Drug Abuse, the National Institute of Mental Health, and the National Institute of Neurological Disorders and Stroke. The funders had no role in the design of the study; in the collection, analyses, or interpretation of data; in the writing of the manuscript; or in the decision to publish the results.
Institutional Review Board Statement
Not applicable.
Informed Consent Statement
Not applicable.
Data Availability Statement
All data are available at dbGaP study accession phs000789.v1.p1.
Conflicts of Interest
K.C.K. has received past research grants unrelated to this paper, funded by the Bill and Melinda Gates Foundation and Balchem, Corp. K.C.K. has served as an independent research consultant for Androvia LifeSciences and Chromadex. He is also a consultant clinical dietitian for Precision Preventive Cardiology. T.C.W. has received competitive unrestricted research grants related from the American Pulse Association, Balchem, Corp., Egg Nutrition Center, Florida Citrus, National Dairy Council, National Pork Board, Nestlé Health Sciences, New Capstone, Inc., Oak Ridge Institute for Science and Education (ORISE) through the U.S. Army Research Institute for Environmental Medicine, The Simply Good Foods Company, and Reach Global Strategies. T.C.W. receives royalties from the Academy of Nutrition and Dietetics for editing the Health Professionals Guide to Dietary Supplements. T.C.W. has received consulting fees from the Academy of Nutrition and Dietetics and the National Pork Board. T.C.W. has received honoraria for lectures from the American Society for Nutrition, Berry Health Benefits Symposium, Tea Institute, Amazentis, and Balchem, Corp. T.C.W. has received support for attending meetings from the Academy of Nutrition and Dietetics and Brightseed, Inc. T.C.W. is on the science advisory board for AHARA, Beli, Deerland Probiotics & Enzymes, Forbes Health, National Pork Board, and Produce for Better Health Foundation; is a member of the Brightseed Bioactives Coalition; and is a past member of the Academy of Nutrition and Dietetics Working Group on Flavan-3-ols. T.C.W. is the Editor-in-Chief of the Journal of Dietary Supplements, Deputy Editor-in-Chief of the Journal of the American Nutrition Association, and Nutrition Section Editor of Annals of Medicine. T.C.W. has received in-kind nutrient analyses services from Eurofins U.S. Food and is a Senior Fellow of the Center for Magnesium Education & Research. MC has received unrestricted education grants from Egg Nutrition Center, Florida Citrus, National Dairy Council, National Pork Board, and Nestle Health Sciences through Think Healthy Group, Inc. L.E.L. and J.M. have no conflicts to disclose.
Abbreviations
The following abbreviations are used in this manuscript:
| BHMT | betaine-homocysteine methyltransferase |
| CSGNM | Collaborative Study of Genes, Nutrients and Metabolites |
| dbGaP | database of Genotypes and Phenotypes |
| dbSNP | database of Single Nucleotide Polymorphisms |
| DMG | dimethylglycine |
| DMGDH | dimethylglycine dehydrogenase |
| FDR | false discovery rate |
| GTEx | Genotype-Tissue Expression |
| GWAS | genome-wide association studies |
| HoloTC | holotranscobalamin |
| IBS | identity-by-state |
| LDAH | lipid droplet-associated phosphatidylserine hydrolase |
| MAF | minor allele frequency |
| MASLD | metabolic dysfunction-associated steatotic liver disease |
| MDS | multidimensional scaling |
| PC | principal component |
| SLC | solute carrier |
| SNP | single nucleotide polymorphism |
| TMAO | trimethylamine N-oxide |
References
- Wallace, T.C.; Blusztajn, J.K.; Caudill, M.A.; Klatt, K.C.; Natker, E.; Zeisel, S.H.; Zelman, K.M. Choline: The underconsumed and underappreciated essential nutrient. Nutr. Today 2018, 53, 240–253. [Google Scholar] [CrossRef] [PubMed]
- Institute of Medicine. Dietary Reference Intakes for Thiamin, Riboflavin, Niacin, Vitamin B6, Folate, Vitamin B12, Pantothenic Acid, Biotin, and Choline. Available online: https://www.ncbi.nlm.nih.gov/books/NBK114310/ (accessed on 1 October 2024).
- Holm, P.I.; Ueland, P.M.; Kvalheim, G.; Lien, E.A. Determination of choline, betaine, and dimethylglycine in plasma by a high-throughput method based on normal-phase chromatography-tandem mass spectrometry. Clin. Chem. 2003, 49, 286–294. [Google Scholar] [CrossRef] [PubMed]
- de Zwart, F.J.; Slow, S.; Payne, R.J.; Lever, M.; George, P.M.; Gerrard, J.A.; Chambers, S.T. Glycine betaine and glycine betaine analogues in common foods. Food Chem. 2003, 83, 197–204. [Google Scholar] [CrossRef]
- Ganz, A.B.; Klatt, K.C.; Caudill, M.A. Common genetic variants alter metabolism and influence dietary choline requirements. Nutrients 2017, 9, 837. [Google Scholar] [CrossRef] [PubMed]
- Kenny, T.C.; Khan, A.; Son, Y.; Yue, L.; Heissel, S.; Sharma, A.; Pasolli, H.A.; Liu, Y.; Gamazon, E.R.; Alwaseem, H.; et al. Integrative genetic analysis identifies FLVCR1 as a plasma-membrane choline transporter in mammals. Cell Metab. 2023, 35, 1057–1071. [Google Scholar] [CrossRef] [PubMed]
- Louck, L.E.; Cara, K.C.; Klatt, K.; Wallace, T.C.; Chung, M. The relationship of circulating choline and choline-related metabolite levels with health outcomes: A scoping review of genome-wide association studies and Mendelian randomization studies. Adv. Nutr. 2024, 15, 100164. [Google Scholar] [CrossRef] [PubMed]
- Mills, J.L.; Carter, T.C.; Scott, J.M.; Troendle, J.F.; Gibney, E.R.; Shane, B.; Kirke, P.N.; Ueland, P.M.; Brody, L.C.; Molloy, A.M. Do high blood folate concentrations exacerbate metabolic abnormalities in people with low vitamin B-12 status? Am. J. Clin. Nutr. 2011, 94, 495–500. [Google Scholar] [CrossRef]
- National Center for Biotechnology Information. dbGaP (Database of Genotypes and Phenotypes): Accession phs000789.v1.p1. Available online: https://www.ncbi.nlm.nih.gov/projects/gap/cgi-bin/study.cgi?study_id=phs000789.v1.p1 (accessed on 1 October 2024).
- Purcell, S.; Neale, B.; Todd-Brown, K.; Thomas, L.; Ferreira, M.A.; Bender, D.; Maller, J.; Sklar, P.; de Bakker, P.I.; Daly, M.J.; et al. PLINK: A tool set for whole-genome association and population-based linkage analyses. Am. J. Hum. Genet. 2007, 81, 559–575. [Google Scholar] [CrossRef] [PubMed]
- Auton, A.; Brooks, L.D.; Durbin, R.M.; Garrison, E.P.; Kang, H.M.; Korbel, J.O.; Marchini, J.L.; McCarthy, S.; McVean, G.A.; Abecasis, G.R. A global reference for human genetic variation. Nature 2015, 526, 68–74. [Google Scholar] [CrossRef] [PubMed]
- National Center for Biotechnology Information. dbSNP (Database of Single Nucleotide Polymorphisms). Available online: https://www.ncbi.nlm.nih.gov/snp/ (accessed on 1 October 2024).
- Boughton, A.P.; Welch, R.P.; Flickinger, M.; VandeHaar, P.; Taliun, D.; Abecasis, G.R.; Boehnke, M. LocusZoom.js: Interactive and embeddable visualization of genetic association study results. Bioinformatics 2021, 37, 3017–3018. [Google Scholar] [CrossRef]
- Genotype-Tissue Expression (GTEx) Project. GTEx Portal. Available online: https://gtexportal.org/home/ (accessed on 1 June 2024).
- Ganz, A.B.; Cohen, V.V.; Swersky, C.C.; Stover, J.; Vitiello, G.A.; Lovesky, J.; Chuang, J.C.; Shields, K.; Fomin, V.G.; Lopez, Y.S.; et al. Genetic variation in choline-metabolizing enzymes alters choline metabolism in young women consuming choline intakes meeting current recommendations. Int. J. Mol. Sci. 2017, 18, 252. [Google Scholar] [CrossRef] [PubMed]
- Khan, A.; Unlu, G.; Lin, P.; Liu, Y.; Kilic, E.; Kenny, T.C.; Birsoy, K.; Gamazon, E.R. Metabolic gene function discovery platform GeneMAP identifies SLC25A48 as necessary for mitochondrial choline import. Nat. Genet. 2024, 56, 1614–1623. [Google Scholar] [CrossRef] [PubMed]
- Verkerke, A.R.P.; Shi, X.; Li, M.; Higuchi, Y.; Yamamuro, T.; Katoh, D.; Nishida, H.; Auger, C.; Abe, I.; Gerszten, R.E.; et al. SLC25A48 controls mitochondrial choline import and metabolism. Cell Metab. 2024, 36, 2156–2166. [Google Scholar] [CrossRef] [PubMed]
- Randall, J.C.; Winkler, T.W.; Kutalik, Z.; Berndt, S.I.; Jackson, A.U.; Monda, K.L.; Kilpeläinen, T.O.; Esko, T.; Mägi, R.; Li, S.; et al. Sex-stratified genome-wide association studies including 270,000 individuals show sexual dimorphism in genetic loci for anthropometric traits. PLoS Genet. 2013, 9, e1003500. [Google Scholar] [CrossRef] [PubMed]
- Speliotes, E.K.; Yerges-Armstrong, L.M.; Wu, J.; Hernaez, R.; Kim, L.J.; Palmer, C.D.; Gudnason, V.; Eiriksdottir, G.; Garcia, M.E.; Launer, L.J.; et al. Genome-wide association analysis identifies variants associated with nonalcoholic fatty liver disease that have distinct effects on metabolic traits. PLoS Genet. 2011, 7, e1001324. [Google Scholar] [CrossRef] [PubMed]
- Di Costanzo, A.; Belardinilli, F.; Bailetti, D.; Sponziello, M.; D’Erasmo, L.; Polimeni, L.; Baratta, F.; Pastori, D.; Ceci, F.; Montali, A.; et al. Evaluation of polygenic determinants of non-alcoholic fatty liver disease (NAFLD) by a candidate genes resequencing strategy. Sci. Rep. 2018, 8, 3702. [Google Scholar] [CrossRef] [PubMed]
- Shungin, D.; Winkler, T.W.; Croteau-Chonka, D.C.; Ferreira, T.; Locke, A.E.; Mägi, R.; Strawbridge, R.J.; Pers, T.H.; Fischer, K.; Justice, A.E.; et al. New genetic loci link adipose and insulin biology to body fat distribution. Nature 2015, 518, 187–196. [Google Scholar] [CrossRef] [PubMed]
- Heid, I.M.; Jackson, A.U.; Randall, J.C.; Winkler, T.W.; Qi, L.; Steinthorsdottir, V.; Thorleifsson, G.; Zillikens, M.C.; Speliotes, E.K.; Mägi, R.; et al. Meta-analysis identifies 13 new loci associated with waist-hip ratio and reveals sexual dimorphism in the genetic basis of fat distribution. Nat. Genet. 2010, 42, 949–960. [Google Scholar] [CrossRef]
- Saliba-Gustafsson, P.; Justesen, J.M.; Ranta, A.; Sharma, D.; Bielczyk-Maczynska, E.; Li, J.; Najmi, L.A.; Apodaka, M.; Aspichueta, P.; Björck, H.M.; et al. A functional genomic framework to elucidate novel causal metabolic dysfunction-associated fatty liver disease genes. Hepatology 2024. published ahead of print. [Google Scholar] [CrossRef] [PubMed]
- Vohnoutka, R.B.; Kuppa, A.; Hegde, Y.; Chen, Y.; Pant, A.; Tohme, M.E.; Choi, E.K.; McCarty, S.M.; Bagchi, D.P.; Du, X.; et al. Knockout of murine Lyplal1 confers sex-specific protection against diet-induced obesity. J. Mol. Endocrinol. 2023, 70, e220131. [Google Scholar] [CrossRef]
Disclaimer/Publisher’s Note: The statements, opinions and data contained in all publications are solely those of the individual author(s) and contributor(s) and not of MDPI and/or the editor(s). MDPI and/or the editor(s) disclaim responsibility for any injury to people or property resulting from any ideas, methods, instructions or products referred to in the content. |
© 2025 by the authors. Licensee MDPI, Basel, Switzerland. This article is an open access article distributed under the terms and conditions of the Creative Commons Attribution (CC BY) license (https://creativecommons.org/licenses/by/4.0/).