
Two-Month Consumption of Orange Juice Enriched with Vitamin D3 and Probiotics Decreases Body Weight, Insulin Resistance, Blood Lipids, and Arterial Blood Pressure in High-Cardiometabolic-Risk Patients on a Westernized Type Diet: Results from a Randomized Clinical Trial

 , , , ,
  ,
,  , , , and
Abstract
1. Introduction
2. Materials and Methods
2.1. Participants
2.2. Study Design
2.3. Encapsulation of the Microbial Cultures and Orange Juice Inoculation
2.4. Dietary Assessment, Physical Activity Assessment, and Subjective Appetite
2.5. Blood Sampling and Laboratory Methods
2.6. Blood Pressure (BP)
2.7. Pulse Wave Velocity (PWV) and Central Blood Pressure
2.8. Statistical Analysis
3. Results
3.1. Macro- and Selected Micronutrient Intakes at Baseline and at the End of 8 Weeks
3.2. Anthropometric Characteristics of the Participants at Baseline and at the End of the 8-Week Period
3.3. Biochemical Characteristics of the Participants at Baseline and after 8 Weeks
3.4. Peripheral and Central BP at Baseline and at the End of the 8-Week Study Period
4. Discussion
5. Conclusions
Author Contributions
Funding
Institutional Review Board Statement
Informed Consent Statement
Data Availability Statement
Acknowledgments
Conflicts of Interest
References
- Musazadeh, V.; Kavyani, Z.; Mirhosseini, N.; Dehghan, P.; Vajdi, M. Effect of vitamin D supplementation on type 2 diabetes biomarkers: An umbrella of interventional meta-analyses. Diabetol. Metab. Syndr. 2023, 15, 76. [Google Scholar] [CrossRef] [PubMed]
- Gao, H.; Li, Y.; Yan, W.; Gao, F. The Effect of Vitamin D Supplementation on Blood Lipids in Patients with Polycystic Ovary Syndrome: A Meta-Analysis of Randomized Controlled Trials. Int. J. Endocrinol. 2021, 2021, 8849688. [Google Scholar] [CrossRef] [PubMed]
- Krajewska, M.; Witkowska-Sedek, E.; Ruminska, M.; Stelmaszczyk-Emmel, A.; Sobol, M.; Majcher, A.; Pyrzak, B. Vitamin D Effects on Selected Anti-Inflammatory and Pro-Inflammatory Markers of Obesity-Related Chronic Inflammation. Front. Endocrinol. 2022, 13, 920340. [Google Scholar] [CrossRef] [PubMed]
- Mei, L.H.; Zheng, W.X.; Zhao, Z.T.; Meng, N.; Zhang, Q.R.; Zhu, W.J.; Li, R.D.; Liang, X.L.; Li, Q.Y. A Pilot Study of the Effect of Lactobacillus casei Obtained from Long-Lived Elderly on Blood Biochemical, Oxidative, and Inflammatory Markers, and on Gut Microbiota in Young Volunteers. Nutrients 2021, 13, 3891. [Google Scholar] [CrossRef] [PubMed]
- Milajerdi, A.; Mousavi, S.M.; Sadeghi, A.; Salari-Moghaddam, A.; Parohan, M.; Larijani, B.; Esmaillzadeh, A. The effect of probiotics on inflammatory biomarkers: A meta-analysis of randomized clinical trials. Eur. J. Nutr. 2020, 59, 633–649. [Google Scholar] [CrossRef] [PubMed]
- Cho, Y.A.; Kim, J. Effect of Probiotics on Blood Lipid Concentrations: A Meta-Analysis of Randomized Controlled Trials. Medicine 2015, 94, e1714. [Google Scholar] [CrossRef] [PubMed]
- Abboud, M.; Rizk, R.; AlAnouti, F.; Papandreou, D.; Haidar, S.; Mahboub, N. The Health Effects of Vitamin D and Probiotic Co-Supplementation: A Systematic Review of Randomized Controlled Trials. Nutrients 2020, 13, 111. [Google Scholar] [CrossRef] [PubMed]
- Ruxton, C.H.S.; Derbyshire, E.; Sievenpiper, J.L. Pure 100% fruit juices—More than just a source of free sugars? A review of the evidence of their effect on risk of cardiovascular disease, type 2 diabetes and obesity. Nutr. Bull. 2021, 46, 415–431. [Google Scholar] [CrossRef]
- Zacharodimos, N.; Athanasaki, C.; Vitsou-Anastasiou, S.; Papadopoulou, O.S.; Moniaki, N.; Doulgeraki, A.I.; Nychas, G.E.; Tassou, C.C.; Papakonstantinou, E. Short-Term Effects of Fruit Juice Enriched with Vitamin D3, n-3 PUFA, and Probiotics on Glycemic Responses: A Randomized Controlled Clinical Trial in Healthy Adults. Metabolites 2023, 13, 791. [Google Scholar] [CrossRef]
- Athanasaki, C.; Zacharodimos, N.; Tsitsou, S.; Bothou, D.-L.; Vitsou-Anastasiou, S.; Papadopoulou, O.S.; Papakonstantinou, E. Short-term effects of a snack including fruit juice enriched with vitamin D3, n-3 Fatty Acids, and Probiotics on Energy Intake and Satiety in Normal-Weight and Overweight Individuals. Proceedings 2023, 91, 104. [Google Scholar] [CrossRef]
- Urbaniak, G.C.; Plous, S. Research Randomizer (Version 4.0) [Computer Software]. Available online: http://www.randomizer.org (accessed on 15 January 2022).
- Bosnea, L.A.; Moschakis, T.; Nigam, P.; Biliaderis, C.G. Growth adaptation of probiotics in biopolymer-based coacervate structures to enhance cell viability. LWT 2017, 77, 282–289. [Google Scholar] [CrossRef]
- Minelli, E.B.; Benini, A. Relationship between number of bacteria and their probiotic effects. Microb. Ecol. Health Dis. 2008, 20, 180–183. [Google Scholar]
- FAO; WHO. Probiotics in Food: Health and Nutritional Properties and Guidelines for Evaluation; FAO: Rome, Italy, 2006. [Google Scholar]
- Flint, A.; Raben, A.; Blundell, J.E.; Astrup, A. Reproducibility, power and validity of visual analogue scales in assessment of appetite sensations in single test meal studies. Int. J. Obes. Relat. Metab. Disord. 2000, 24, 38–48. [Google Scholar] [CrossRef]
- Papathanasiou, G.; Georgoudis, G.; Papandreou, M.; Spyropoulos, P.; Georgakopoulos, D.; Kalfakakou, V.; Evangelou, A. Reliability measures of the short International Physical Activity Questionnaire (IPAQ) in Greek young adults. Hell. J. Cardiol. 2009, 50, 283–294. [Google Scholar]
- Dimakopoulos, I.; Magriplis, E.; Mitsopoulou, A.V.; Karageorgou, D.; Bakogianni, I.; Micha, R.; Michas, G.; Chourdakis, M.; Ntouroupi, T.; Tsaniklidou, S.M.; et al. Association of serum vitamin D status with dietary intake and sun exposure in adults. Clin. Nutr. ESPEN 2019, 34, 23–31. [Google Scholar] [CrossRef]
- McCarty, C.A. Sunlight exposure assessment: Can we accurately assess vitamin D exposure from sunlight questionnaires? Am. J. Clin. Nutr. 2008, 87, 1097S–1101S. [Google Scholar] [CrossRef]
- Medicine, I.O. Dietary Reference Intakes for Calcium and Vitamin D; The National Academies Press: Washington, DC, USA, 2018. [Google Scholar]
- Matthews, D.R.; Hosker, J.P.; Rudenski, A.S.; Naylor, B.A.; Treacher, D.F.; Turner, R.C. Homeostasis model assessment: Insulin resistance and beta-cell function from fasting plasma glucose and insulin concentrations in man. Diabetologia 1985, 28, 412–419. [Google Scholar] [CrossRef]
- Bonora, E.; Formentini, G.; Calcaterra, F.; Lombardi, S.; Marini, F.; Zenari, L.; Saggiani, F.; Poli, M.; Perbellini, S.; Raffaelli, A.; et al. HOMA-estimated insulin resistance is an independent predictor of cardiovascular disease in type 2 diabetic subjects: Prospective data from the Verona Diabetes Complications Study. Diabetes Care 2002, 25, 1135–1141. [Google Scholar] [CrossRef] [PubMed]
- Parra, A.; Ramirez, A.; Espinosa de los Monteros, A. Fasting glucose/insulin ratio. An index to differentiate normo from hyperinsulinemic women with polycystic ovary syndrome. Rev. Investig. Clin. 1994, 46, 363–368. [Google Scholar]
- Gokcel, A.; Baltali, M.; Tarim, E.; Bagis, T.; Gumurdulu, Y.; Karakose, H.; Yalcin, F.; Akbaba, M.; Guvener, N. Detection of insulin resistance in Turkish adults: A hospital-based study. Diabetes Obes. Metab. 2003, 5, 126–130. [Google Scholar] [CrossRef]
- Asmar, R.; Benetos, A.; Topouchian, J.; Laurent, P.; Pannier, B.; Brisac, A.M.; Target, R.; Levy, B.I. Assessment of arterial distensibility by automatic pulse wave velocity measurement. Validation and clinical application studies. Hypertension 1995, 26, 485–490. [Google Scholar] [CrossRef] [PubMed]
- Imura, T.; Yamamoto, K.; Kanamori, K.; Mikami, T.; Yasuda, H. Non-invasive ultrasonic measurement of the elastic properties of the human abdominal aorta. Cardiovasc. Res. 1986, 20, 208–214. [Google Scholar] [CrossRef] [PubMed]
- Georgiopoulos, G.A.; Stamatelopoulos, K.S.; Lambrinoudaki, I.; Lykka, M.; Kyrkou, K.; Rizos, D.; Creatsa, M.; Christodoulakos, G.; Alevizaki, M.; Sfikakis, P.P.; et al. Prolactin and preclinical atherosclerosis in menopausal women with cardiovascular risk factors. Hypertension 2009, 54, 98–105. [Google Scholar] [CrossRef] [PubMed]
- Charakida, M.; Georgiopoulos, G.; Dangardt, F.; Chiesa, S.T.; Hughes, A.D.; Rapala, A.; Davey Smith, G.; Lawlor, D.; Finer, N.; Deanfield, J.E. Early vascular damage from smoking and alcohol in teenage years: The ALSPAC study. Eur. Heart J. 2019, 40, 345–353. [Google Scholar] [CrossRef] [PubMed]
- Jenkins, D.J.; Kendall, C.W.; Marchie, A.; Faulkner, D.A.; Wong, J.M.; de Souza, R.; Emam, A.; Parker, T.L.; Vidgen, E.; Trautwein, E.A. Direct comparison of a dietary portfolio of cholesterol-lowering foods with a statin in hypercholesterolemic participants1–3. Am. J. Clin. Nutr. 2005, 81, 380–387. [Google Scholar] [CrossRef] [PubMed]
- Hajipoor, S.; Hekmatdoost, A.; Pasdar, Y.; Mohammadi, R.; Alipour, M.; Rezaie, M.; Nachvak, S.M.; Balthazar, C.F.; Sobhiyeh, M.R.; Mortazavian, A.M.; et al. Consumption of probiotic yogurt and vitamin D-fortified yogurt increases fasting level of GLP-1 in obese adults undergoing low-calorie diet: A double-blind randomized controlled trial. Food Sci. Nutr. 2022, 10, 3259–3271. [Google Scholar] [CrossRef] [PubMed]
- Kim, Y.A.; Keogh, J.B.; Clifton, P.M. Probiotics, prebiotics, synbiotics and insulin sensitivity. Nutr. Res. Rev. 2018, 31, 35–51. [Google Scholar] [CrossRef] [PubMed]
- Noormohammadi, M.; Ghorbani, Z.; Lober, U.; Mahdavi-Roshan, M.; Bartolomaeus, T.U.P.; Kazemi, A.; Shoaibinobarian, N.; Forslund, S.K. The effect of probiotic and synbiotic supplementation on appetite-regulating hormones and desire to eat: A systematic review and meta-analysis of clinical trials. Pharmacol. Res. 2023, 187, 106614. [Google Scholar] [CrossRef]
- Rouhani, M.H.; Hadi, A.; Ghaedi, E.; Salehi, M.; Mahdavi, A.; Mohammadi, H. Do probiotics, prebiotics and synbiotics affect adiponectin and leptin in adults? A systematic review and meta-analysis of clinical trials. Clin. Nutr. 2019, 38, 2031–2037. [Google Scholar] [CrossRef]
- NabizadehAsl, L.; Sendur, S.N.; Ozer, B.; Lay, I.; Erbas, T.; Buyuktuncer, Z. Acute and short-term effects of Lactobacillus paracasei subsp. paracasei 431 and inulin intake on appetite control and dietary intake: A two-phases randomized, double blind, placebo-controlled study. Appetite 2022, 169, 105855. [Google Scholar] [CrossRef]
- Jamilian, M.; Amirani, E.; Asemi, Z. The effects of vitamin D and probiotic co-supplementation on glucose homeostasis, inflammation, oxidative stress and pregnancy outcomes in gestational diabetes: A randomized, double-blind, placebo-controlled trial. Clin. Nutr. 2019, 38, 2098–2105. [Google Scholar] [CrossRef]
- Raygan, F.; Rezavandi, Z.; Bahmani, F.; Ostadmohammadi, V.; Mansournia, M.A.; Tajabadi-Ebrahimi, M.; Borzabadi, S.; Asemi, Z. The effects of probiotic supplementation on metabolic status in type 2 diabetic patients with coronary heart disease. Diabetol. Metab. Syndr. 2018, 10, 51. [Google Scholar] [CrossRef]
- Miao, C.; Guo, Q.; Fang, X.; Chen, Y.; Zhao, Y.; Zhang, Q. Effects of probiotic and synbiotic supplementation on insulin resistance in women with polycystic ovary syndrome: A meta-analysis. J. Int. Med. Res. 2021, 49, 3000605211031758. [Google Scholar] [CrossRef]
- Yefet, E.; Bar, L.; Izhaki, I.; Iskander, R.; Massalha, M.; Younis, J.S.; Nachum, Z. Effects of Probiotics on Glycemic Control and Metabolic Parameters in Gestational Diabetes Mellitus: Systematic Review and Meta-Analysis. Nutrients 2023, 15, 1633. [Google Scholar] [CrossRef]
- Lee, C.J.; Iyer, G.; Liu, Y.; Kalyani, R.R.; Bamba, N.; Ligon, C.B.; Varma, S.; Mathioudakis, N. The effect of vitamin D supplementation on glucose metabolism in type 2 diabetes mellitus: A systematic review and meta-analysis of intervention studies. J. Diabetes Complicat. 2017, 31, 1115–1126. [Google Scholar] [CrossRef]
- Pan, Y.Q.; Zheng, Q.X.; Jiang, X.M.; Chen, X.Q.; Zhang, X.Y.; Wu, J.L. Probiotic Supplements Improve Blood Glucose and Insulin Resistance/Sensitivity among Healthy and GDM Pregnant Women: A Systematic Review and Meta-Analysis of Randomized Controlled Trials. Evid. Based Complement. Altern. Med. 2021, 2021, 9830200. [Google Scholar] [CrossRef]
- Morvaridzadeh, M.; Nachvak, S.M.; Mohammadi, R.; Moradi, S.; Mostafai, R.; Pizarro, A.B.; Abdollahzad, H. Probiotic Yogurt Fortified with Vitamin D Can Improve Glycemic Status in Non-Alcoholic Fatty Liver Disease Patients: A Randomized Clinical Trial. Clin. Nutr. Res. 2021, 10, 36–47. [Google Scholar] [CrossRef]
- Savytska, M.; Kyriienko, D.; Komisarenko, I.; Kovalchuk, O.; Falalyeyeva, T.; Kobyliak, N. Probiotic for Pancreatic beta-Cell Function in Type 2 Diabetes: A Randomized, Double-Blinded, Placebo-Controlled Clinical Trial. Diabetes Ther. 2023, 14, 1915–1931. [Google Scholar] [CrossRef]
- Bock, P.M.; Telo, G.H.; Ramalho, R.; Sbaraini, M.; Leivas, G.; Martins, A.F.; Schaan, B.D. The effect of probiotics, prebiotics or synbiotics on metabolic outcomes in individuals with diabetes: A systematic review and meta-analysis. Diabetologia 2021, 64, 26–41. [Google Scholar] [CrossRef]
- Mousa, A.; Naderpoor, N.; de Courten, M.P.; Teede, H.; Kellow, N.; Walker, K.; Scragg, R.; de Courten, B. Vitamin D supplementation has no effect on insulin sensitivity or secretion in vitamin D-deficient, overweight or obese adults: A randomized placebo-controlled trial. Am. J. Clin. Nutr. 2017, 105, 1372–1381. [Google Scholar] [CrossRef]
- Imamura, F.; O’Connor, L.; Ye, Z.; Mursu, J.; Hayashino, Y.; Bhupathiraju, S.N.; Forouhi, N.G. Consumption of sugar sweetened beverages, artificially sweetened beverages, and fruit juice and incidence of type 2 diabetes: Systematic review, meta-analysis, and estimation of population attributable fraction. BMJ 2015, 351, h3576. [Google Scholar] [CrossRef] [PubMed]
- Wang, B.; Liu, K.; Mi, M.; Wang, J. Effect of fruit juice on glucose control and insulin sensitivity in adults: A meta-analysis of 12 randomized controlled trials. PLoS ONE 2014, 9, e95323. [Google Scholar] [CrossRef]
- Terentes-Printzios, D.; Gardikioti, V.; Vlachopoulos, C. Central Over Peripheral Blood Pressure: An Emerging Issue in Hypertension Research. Heart Lung Circ. 2021, 30, 1667–1674. [Google Scholar] [CrossRef]
- Liu, K.; Xing, A.; Chen, K.; Wang, B.; Zhou, R.; Chen, S.; Xu, H.; Mi, M. Effect of fruit juice on cholesterol and blood pressure in adults: A meta-analysis of 19 randomized controlled trials. PLoS ONE 2013, 8, e61420. [Google Scholar] [CrossRef]
- Esmaeilinezhad, Z.; Barati-Boldaji, R.; Brett, N.R.; de Zepetnek, J.O.T.; Bellissimo, N.; Babajafari, S.; Sohrabi, Z. The effect of synbiotics pomegranate juice on cardiovascular risk factors in PCOS patients: A randomized, triple-blinded, controlled trial. J. Endocrinol. Investig. 2020, 43, 539–548. [Google Scholar] [CrossRef]
- Anugrah, D.P.; Maigoda, T.C.; Yulianti, R. The potency of combination of tomato juice and sweet orange on blood pressure in pre-hypertensive people. AcTion Aceh Nutr. J. 2023, 8, 493–499. [Google Scholar] [CrossRef]
- Liu, Q.; Chiavaroli, L.; Ayoub-Charette, S.; Ahmed, A.; Khan, T.A.; Au-Yeung, F.; Lee, D.; Cheung, A.; Zurbau, A.; Choo, V.L.; et al. Fructose-containing food sources and blood pressure: A systematic review and meta-analysis of controlled feeding trials. PLoS ONE 2023, 18, e0264802. [Google Scholar] [CrossRef]
- D’Elia, L.; Dinu, M.; Sofi, F.; Volpe, M.; Strazzullo, P.; Sinu Working Group, E.b.S. 100% Fruit juice intake and cardiovascular risk: A systematic review and meta-analysis of prospective and randomised controlled studies. Eur. J. Nutr. 2021, 60, 2449–2467. [Google Scholar] [CrossRef]
- Khalesi, S.; Sun, J.; Buys, N.; Jayasinghe, R. Effect of probiotics on blood pressure: A systematic review and meta-analysis of randomized, controlled trials. Hypertension 2014, 64, 897–903. [Google Scholar] [CrossRef] [PubMed]
- Giallauria, F.; Milaneschi, Y.; Tanaka, T.; Maggio, M.; Canepa, M.; Elango, P.; Vigorito, C.; Lakatta, E.G.; Ferrucci, L.; Strait, J. Arterial stiffness and vitamin D levels: The Baltimore longitudinal study of aging. J. Clin. Endocrinol. Metab. 2012, 97, 3717–3723. [Google Scholar] [CrossRef] [PubMed]
- Chen, N.C.; Hsu, C.Y.; Mao, P.C.; Dreyer, G.; Wu, F.Z.; Chen, C.L. The effects of correction of vitamin D deficiency on arterial stiffness: A systematic review and updated meta-analysis of randomized controlled trials. J. Steroid Biochem. Mol. Biol. 2020, 198, 105561. [Google Scholar] [CrossRef]
- Cesar, T.B.; Aptekmann, N.P.; Araujo, M.P.; Vinagre, C.C.; Maranhão, R.C. Orange juice decreases low-density lipoprotein cholesterol in hypercholesterolemic subjects and improves lipid transfer to high-density lipoprotein in normal and hypercholesterolemic subjects. Nutr. Res. 2010, 30, 689–694. [Google Scholar] [CrossRef]
- Bellerba, F.; Muzio, V.; Gnagnarella, P.; Facciotti, F.; Chiocca, S.; Bossi, P.; Cortinovis, D.; Chiaradonna, F.; Serrano, D.; Raimondi, S.; et al. The Association between Vitamin D and Gut Microbiota: A Systematic Review of Human Studies. Nutrients 2021, 13, 3378. [Google Scholar] [CrossRef]


| Enriched OJ with Vitamin D3 and Probiotics Group (n = 26) | Conventional OJ (Control) Group (n = 24) | p-Value | |
|---|---|---|---|
| Gender | |||
| Male, n (%) | 10 (39%) | 7 (29%) | 0.35 |
| Age, years (SD) | 49 ± 2 | 48 ± 2 | 0.71 |
| Height, cm (SD) | 169 ± 2 | 166 ± 2 | 0.43 |
| Drug treatment | |||
| No drug treatment | 17 (65%) | 13 (54%) | 0.65 |
| Antihypertensives, n (%) | 2 (8%) | 1 (4%) | |
| Antihyperlipidemic, n (%) | 3 (12%) | 3 (13%) | |
| Antihypertensive and antihyperlipidemic, n (%) | 0 (0%) | 1 (4%) | |
| Alcohol consumption, n (%) | 17 (65%) | 14 (58%) | 0.32 |
| Smoking, n (%) | 17 (65%) | 14 (58%) | 0.84 |
| Physical activity level, n (%) | |||
| Low | 18 (69%) | 8 (33%) | 0.02 |
| Moderate | 6 (23%) | 8 (33%) | |
| High | 2 (8%) | 8 (33%) | |
| Enriched with Vitamin D3 and Probiotics OJ Group (n = 26) | Control OJ Group (n = 24) | Interaction (Intervention × Time) | ||||||||
|---|---|---|---|---|---|---|---|---|---|---|
| Baseline | 8 Weeks | pa | Baseline | 8 Weeks | pa | pb | Coef. | 95% CI | p0–8 | |
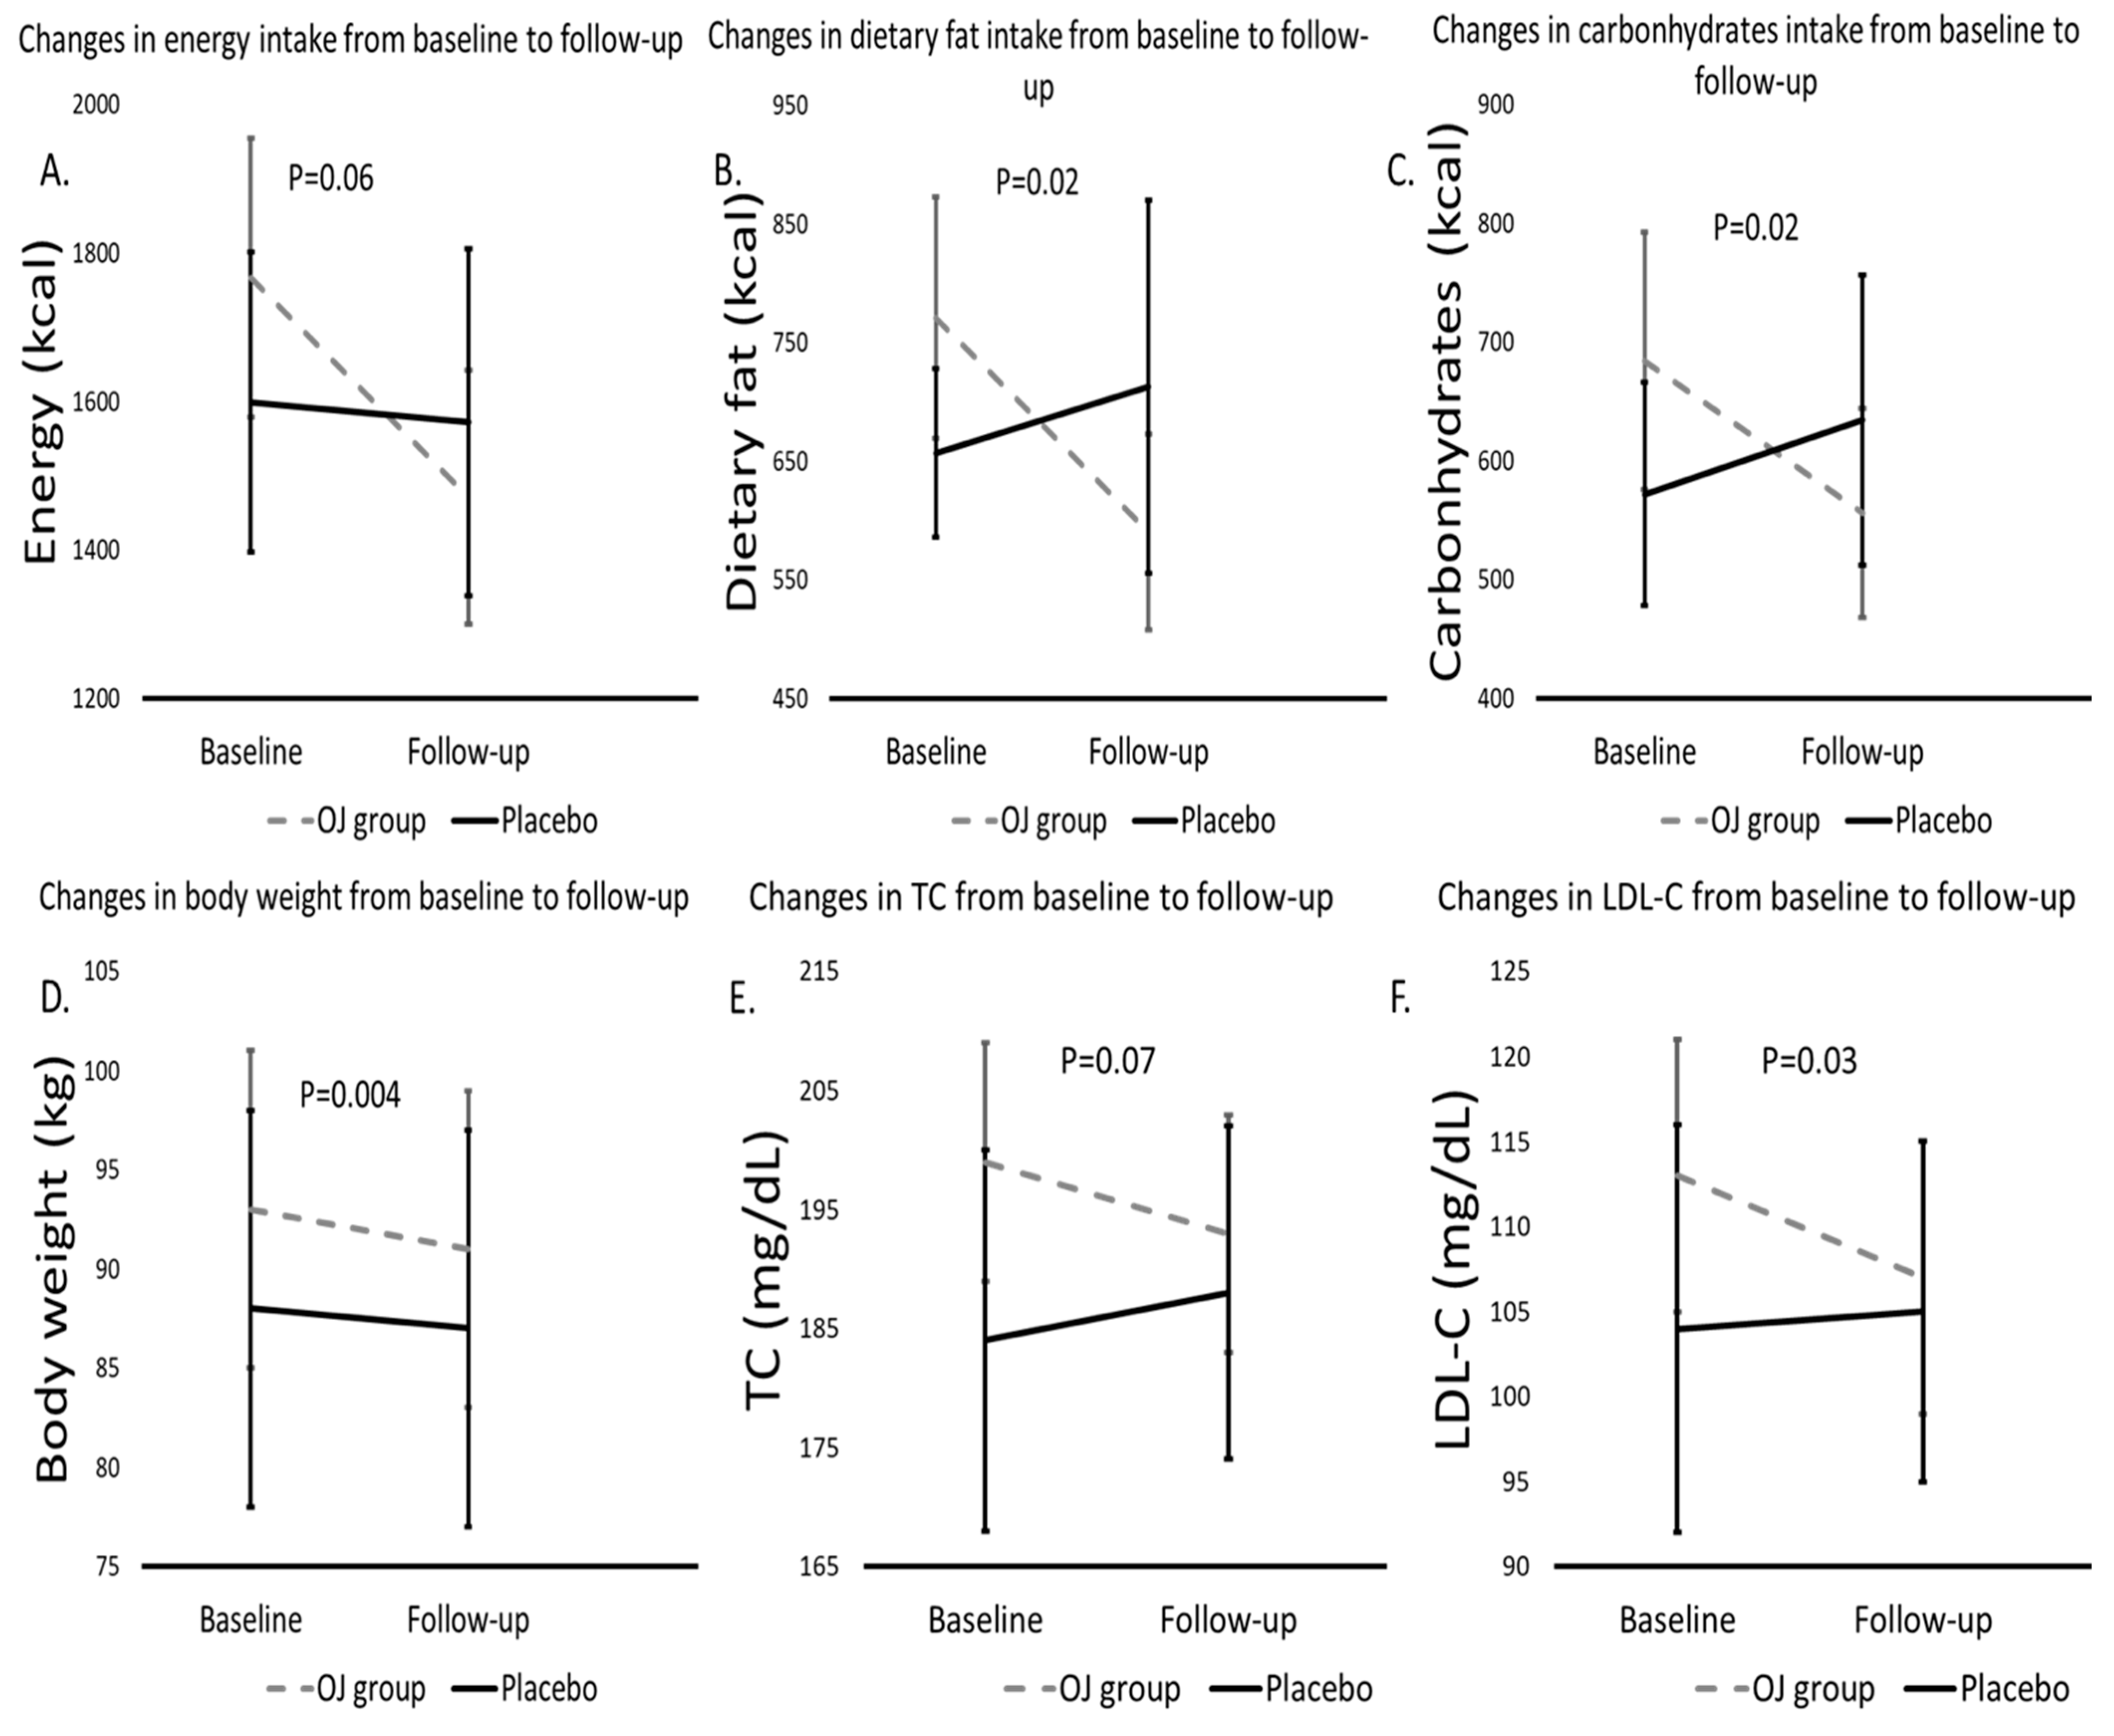
| Energy (kcal) | 1767 ± 94 | 1471 ± 86 | 0.002 | 1599 ± 101 | 1572 ± 117 | 0.83 | 0.23 | −269.8 | (−553.2, 13.7) | 0.06 |
| Protein (g) | 75 ± 4 | 65 ± 5 | 0.02 | 73 ± 6 | 65 ± 5 | 0.18 | 0.82 | −1.4 | (−15.9, 13.1) | 0.85 |
| Protein (kcal) | 300 ± 17 | 259 ± 19 | 0.02 | 294 ± 23 | 258 ± 21 | 0.18 | 0.82 | −5.7 | (−63.9, 52.5) | 0.85 |
| Dietary fat (g) | 86 ± 6 | 66 ± 5 | 0.01 | 73 ± 4 | 79 ± 9 | 0.53 | 0.08 | −26.4 | (−48.9, −3.9) | 0.02 |
| Dietary fat (kcal) | 771 ± 52 | 590 ± 42 | 0.01 | 657 ± 36 | 713 ± 80 | 0.53 | 0.08 | −237.6 | (−440.3, −34.9) | 0.02 |
| Carbohydrates (g) | 162 ± 13 | 139 ± 11 | 0.04 | 143 ± 12 | 159 ± 15 | 0.25 | 0.28 | −38.7 | (−70.6, −6.8) | 0.02 |
| Carbohydrates (kcal) | 684 ± 54 | 556 ± 44 | 0.04 | 572 ± 47 | 634 ± 61 | 0.25 | 0.28 | −154.8 | (−282.4, −27.3) | 0.02 |
| Dietary fiber (g) | 14 ± 1 | 15 ± 3 | 0.84 | 13 ± 1 | 12 ± 1 | 0.53 | 0.45 | 1.7 | (−5.3, 8.8) | 0.63 |
| Sugars (g) | 56 ± 5 | 56 ± 5 | 0.91 | 51 ± 6 | 67 ± 6 | 0.02 | 0.53 | −16.1 | (−31.1, −1.0) | 0.04 |
| Saturated fat (g) | 23 ± 2 | 20 ± 2 | 0.16 | 21 ± 2 | 24 ± 3 | 0.39 | 0.52 | −5.4 | (−11.9, 1.1) | 0.11 |
| Enriched with vitamin D3 and probiotics OJ group (n = 26) | Control OJ group (n = 24) | Interaction (intervention × time) | ||||||||
| Baseline | 8 weeks | pa | Baseline | 8 weeks | pa | pb | Coef. | 95% CI | p0–8 | |
| Trans fat (g) | 0 (0, 2) | 0 (0, 0) | 0.05 | 0 (0, 0) | 0 (0, 0) | 0.65 | 0.23 | 0.2 | (−0.1, 0.3) | 0.16 |
| Monounsaturated fat (g) | 32 ± 3 | 25 ± 2 | 0.02 | 24 ± 2 | 24 ± 3 | 0.90 | 0.04 | −7.2 | (−15.3, 0.8) | 0.08 |
| Polyunsaturated fat (g) | 12 (7, 19) | 8 (5, 10) | 0.002 | 9.7 (7, 15) | 7 (5, 11) | 0.08 | 0.53 | 39.3 | (−44.2, 122.9) | 0.36 |
| Dietary cholesterol (g) | 125 ± 16 | 137 ± 18 | 0.54 | 153 ± 25 | 135 ± 29 | 0.57 | 0.35 | 30.5 | (−39.9, 101.0) | 0.40 |
| Vitamin C (mg) | 88 ± 14 | 104 ± 8 | 0.25 | 51 ± 7 | 88 ± 9 | 0.002 | 0.02 | −21.6 | (−55.2, 11.99) | 0.21 |
| Salt (g) | 4.9 ± 0.5 | 3.8 ± 0.3 | 0.02 | 4.0 ± 0.3 | 3.9 ± 0.4 | 0.71 | 0.15 | −0.9 | (−2.1, 0.3) | 0.15 |
| Sodium (mg) | 1839 ± 185 | 1436 ± 125 | 0.03 | 1544 ± 121 | 1450 ± 153 | 0.59 | 0.19 | −308.3 | (−780.2, 163.6) | 0.20 |
| Potassium (mg) | 1917 ± 98 | 1762 ± 91 | 0.15 | 1591 ± 136 | 1778 ± 89 | 0.19 | 0.06 | −342.8 | (−672.7, 12.8) | 0.04 |
| Enriched with Vitamin D3 and Probiotics OJ Group (n = 26) | Control OJ Group (n = 24) | Interaction Intervention × Time (0–8 weeks) | ||||||||
|---|---|---|---|---|---|---|---|---|---|---|
| Baseline | 8 Weeks | pa | Baseline | 8 Weeks | pa | pb | Coef. | 95% CI | p0–8 | |
| Body weight (kg) | 93 ± 4 | 91 ± 4 | <0.001 | 88 ± 5 | 87 ± 5 | 0.22 | 0.38 | −1.4 | (−2.4, −0.4) | 0.004 |
| BMI (kg/m2) | 33 ± 1 | 32 ± 1 | 0.005 | 32 ± 1 | 31 ± 1 | 0.14 | 0.51 | −0.06 | (−1.1, −0.1) | 0.01 |
| Body fat mass (kg) | 38 ± 2 | 36 ± 2 | 0.003 | 36 ± 2 | 35 ± 3 | 0.01 | 0.54 | −0.5 | (−1.6, 0.6) | 0.38 |
| Body water (kg) | 41 ± 2 | 39 ± 2 | 0.28 | 38 ± 2 | 38 ± 2 | 0.84 | 0.46 | −1.9 | (−5.0, −1.2) | 0.23 |
| Muscle mass (kg) | 28 (25) | 28 (24) | 0.45 | 26 (23) | 26 (24) | 0.32 | 0.43 | −0.3 | (−0.7, 0.2) | 0.27 |
| Lean body mass (kg) | 55 ± 3 | 55 ± 3 | 0.26 | 52 ± 3 | 53 ± 3 | 0.27 | 0.46 | −0.5 | (−1.3, 0.3) | 0.18 |
| Waist circumference (cm) | 108 ± 4 | 103 ± 3 | 0.10 | 101 ± 4 | 101 ± 4 | 0.95 | 0.18 | −4.7 | (−10.4, 1.1) | 0.11 |
| Hip circumference (cm) | 116 ± 2 | 113 ± 2 | <0.001 | 112 ± 2 | 112 ± 2 | 0.76 | 0.13 | −4.2 | (−9.1, 0.6) | 0.08 |
| Waist-to-hip circumference ratio (cm) | 0.9 ± 0.03 | 0.9 ± 0.02 | 0.67 | 0.9 ± 0.03 | 0.89 ± 0.02 | 0.64 | 0.56 | −0.005 | (−0.07, 0.07) | 0.91 |
| BMR (kcal/day) | 1489 ± 109 | 1504 ± 95 | 0.85 | 1334 ± 87 | 1501 ± 92 | 0.04 | 0.28 | −156.6 | (−368.9, 55.7) | 0.15 |
| Enriched with Vitamin D3 and Probiotics OJ Group (n = 26) | Control OJ Group (n = 24) | Interaction 0–8 Weeks | ||||||||
|---|---|---|---|---|---|---|---|---|---|---|
| Baseline | 8 Weeks | pa | Baseline | 8 Weeks | pa | pb | Coef. | 95% CI | p0–8 | |
| Fasting glucose (mg/dL) | 94 ± 2 | 91 ± 2 | 0.12 | 90 ± 2 | 87 ± 2 | 0.02 | 0.18 | −0.6 | (−5.1, 4.0) | 0.80 |
| Fasting insulin (μU/mL) | 9 (7, 12) | 8 (6, 11) | 0.04 | 7 (4, 9) | 6 (4, 8) | 0.45 | 0.01 | −1.5 | (−3.9, 0.8) | 0.21 |
| HOMA-IR | 2.2 (1.4, 2.9) | 2 (1.2, 2.5) | 0.02 | 1.4 (1.0, 2.2) | 1.2 (0.8, 1.7) | 0.28 | 0.02 | −0.4 | (−0.9, 0.2) | 0.23 |
| FGI | 11 ± 0.9 | 13 ± 2 | 0.03 | 15 ± 1.5 | 16 ± 1.5 | 0.66 | 0.02 | −2.1 | (−1.0, 5.1) | 0.19 |
| QUICKI | 0.3 ± 0.01 | 0.4 ± 0.01 | 0.006 | 0.4 ± 0.01 | 0.4 ± 0.01 | 0.23 | 0.01 | 0.007 | (−0.01, 0.02) | 0.27 |
| Total cholesterol (mg/dL) | 199 ± 5 | 193 ± 5 | 0.05 | 184 ± 8 | 188 ± 7 | 0.45 | 0.13 | −10.3 | (−21.4, 0.9) | 0.07 |
| LDL-C (mg/dL) | 113 ± 4 | 107 ± 4 | 0.004 | 104 ± 6 | 105 ± 5 | 0.77 | 0.22 | −6.9 | (−13.5, −0.5) | 0.03 |
| HDL-C (mg/dL) | 50 ± 2 | 47 ± 2 | 0.01 | 51 ± 2 | 50 ± 2 | 0.85 | 0.84 | −2.5 | (−6.4, 1.3) | 0.20 |
| Triglycerides (mg/dL) | 107 ± 10 | 105 ± 10 | 0.65 | 89 ± 11 | 90 ± 9 | 0.83 | 0.22 | −4.1 | (−21.2, 13.0) | 0.64 |
| CRP (mg/dL) | 2 (1, 4) | 2 (1, 6) | 0.87 | 2 (1, 3) | 2 (1, 3) | 0.94 | 0.61 | −0.03 | (−0.8, 0.8) | 0.95 |
| IL-6 (pg/mL) | 2 (2, 3) | 2 (2, 3) | 0.55 | 2 (2, 2) | 2 (2, 3) | 1.00 | 0.14 | 0.05 | (−0.5, 0.6) | 0.87 |
| Vitamin D (ng/mL) | 20 ± 2 | 21 ± 1 | 0.29 | 22 ± 2 | 25 ± 2 | 0.007 | 0.45 | −1.9 | (−4.8, 1.0) | 0.19 |
| Urea (mg/dL) | 28 ± 1 | 28 ± 2 | 0.79 | 31 ± 3 | 32 ± 2 | 0.52 | 0.23 | −0.7 | (−4.5, 3.2) | 0.74 |
| Enriched with Vitamin D3 and Probiotics OJ Group (n = 26) | Control OJ Group (n = 24) | Interaction 0–8 Weeks | ||||||||
|---|---|---|---|---|---|---|---|---|---|---|
| Baseline | 8 Weeks | pa | Baseline | 8 Weeks | pa | pb | Coef. | 95% CI | p0–8 | |
| SBP (mmHg) | 127 ± 3 | 120 ± 2 | 0.002 | 124 ± 2 | 118 ± 2 | 0.01 | 0.48 | −0.0 | (−6.8, 5.1) | 0.77 |
| DBP (mmHg) | 82 ± 3 | 77 ± 2 | 0.02 | 79 ± 2 | 77 ± 2 | 0.43 | 0.27 | −4.1 | (−9.5, 1.3) | 0.14 |
| Central SBP (mmHg) | 117 ± 3 | 116 ± 4 | 0.74 | 120 ± 5 | 113 ± 3 | 0.25 | 0.57 | 5.5 | (−7.1, 18.1) | 0.39 |
| Central DBP (mmHg) | 78 ± 2 | 77 ± 2 | 0.60 | 78 ± 2 | 76 ± 2 | 0.57 | 0.93 | 0.5 | (−4.3, 5.3) | 0.84 |
| Augmentation index, Alx (%) | 4 (−19, 21) | 6 (−8.8, 12.3) | 0.75 | 12 (−35, 30) | 7 (−36, 13.5) | 0.22 | 0.20 | 16.2 | (−8.8, 41.2) | 0.21 |
| PWV (m/s) | 8 (7, 9) | 8 (7, 9) | 0.82 | 8 (8, 10) | 8 (7.3, 8) | 0.03 | 0.12 | 16.2 | (−8.9, 41.2) | 0.26 |
Disclaimer/Publisher’s Note: The statements, opinions and data contained in all publications are solely those of the individual author(s) and contributor(s) and not of MDPI and/or the editor(s). MDPI and/or the editor(s) disclaim responsibility for any injury to people or property resulting from any ideas, methods, instructions or products referred to in the content. |
© 2024 by the authors. Licensee MDPI, Basel, Switzerland. This article is an open access article distributed under the terms and conditions of the Creative Commons Attribution (CC BY) license (https://creativecommons.org/licenses/by/4.0/).
Share and Cite
Papakonstantinou, E.; Zacharodimos, N.; Georgiopoulos, G.; Athanasaki, C.; Bothou, D.-L.; Tsitsou, S.; Lympaki, F.; Vitsou-Anastasiou, S.; Papadopoulou, O.S.; Delialis, D.; et al. Two-Month Consumption of Orange Juice Enriched with Vitamin D3 and Probiotics Decreases Body Weight, Insulin Resistance, Blood Lipids, and Arterial Blood Pressure in High-Cardiometabolic-Risk Patients on a Westernized Type Diet: Results from a Randomized Clinical Trial. Nutrients 2024, 16, 1331. https://doi.org/10.3390/nu16091331
Papakonstantinou E, Zacharodimos N, Georgiopoulos G, Athanasaki C, Bothou D-L, Tsitsou S, Lympaki F, Vitsou-Anastasiou S, Papadopoulou OS, Delialis D, et al. Two-Month Consumption of Orange Juice Enriched with Vitamin D3 and Probiotics Decreases Body Weight, Insulin Resistance, Blood Lipids, and Arterial Blood Pressure in High-Cardiometabolic-Risk Patients on a Westernized Type Diet: Results from a Randomized Clinical Trial. Nutrients. 2024; 16(9):1331. https://doi.org/10.3390/nu16091331
Chicago/Turabian StylePapakonstantinou, Emilia, Nikolaos Zacharodimos, Georgios Georgiopoulos, Christina Athanasaki, Dionysia-Lydia Bothou, Sofia Tsitsou, Foteini Lympaki, Stamatia Vitsou-Anastasiou, Olga S. Papadopoulou, Dimitrios Delialis, and et al. 2024. "Two-Month Consumption of Orange Juice Enriched with Vitamin D3 and Probiotics Decreases Body Weight, Insulin Resistance, Blood Lipids, and Arterial Blood Pressure in High-Cardiometabolic-Risk Patients on a Westernized Type Diet: Results from a Randomized Clinical Trial" Nutrients 16, no. 9: 1331. https://doi.org/10.3390/nu16091331
APA StylePapakonstantinou, E., Zacharodimos, N., Georgiopoulos, G., Athanasaki, C., Bothou, D.-L., Tsitsou, S., Lympaki, F., Vitsou-Anastasiou, S., Papadopoulou, O. S., Delialis, D., Alexopoulos, E. C., Petsiou, E., Keramida, K., Doulgeraki, A. I., Patsopoulou, I.-M., Nychas, G.-J. E., & Tassou, C. C. (2024). Two-Month Consumption of Orange Juice Enriched with Vitamin D3 and Probiotics Decreases Body Weight, Insulin Resistance, Blood Lipids, and Arterial Blood Pressure in High-Cardiometabolic-Risk Patients on a Westernized Type Diet: Results from a Randomized Clinical Trial. Nutrients, 16(9), 1331. https://doi.org/10.3390/nu16091331