Correction: Sugasini et al. Efficient Enrichment of Retinal DHA with Dietary Lysophosphatidylcholine-DHA: Potential Application for Retinopathies. Nutrients 2020, 12, 3114


Funding
Institutional Review Board Statement
Conflicts of Interest
Reference
- Sugasini, D.; Yalagala, P.C.R.; Subbaiah, P.V. Efficient Enrichment of Retinal DHA with Dietary Lysophosphatidylcholine-DHA: Potential Application for Retinopathies. Nutrients 2020, 12, 3114. [Google Scholar] [CrossRef]

| Control | Free DHA | sn-1 DHA LPC | sn-2 DHA LPC | |||||||||||
|---|---|---|---|---|---|---|---|---|---|---|---|---|---|---|
| FA | Mean | ± | SD | Mean | ± | SD | Mean | ± | SD | Mean | ± | SD | ||
| 12:0 | 0.26 | ± | 0.14 | 0.60 | ± | 0.35 | 0.73 | ± | 0.47 | 0.73 | ± | 0.47 | ||
| 14:0 | 0.50 | ± | 0.25 | 0.20 | ± | 0.17 | 0.30 | ± | 0.17 | 0.30 | ± | 0.17 | ||
| 16:0 | 17.92 | ± | 1.41 | 16.11 | ± | 1.56 | 14.62 | ± | 1.22 | ** | 14.62 | ± | 1.22 | ** |
| 16:1 | 0.38 | ± | 0.17 | 0.55 | ± | 0.28 | 0.47 | ± | 0.34 | 0.47 | ± | 0.34 | ||
| 17:1 | 0.29 | ± | 0.13 | 0.43 | ± | 0.16 | 0.48 | ± | 0.38 | 0.48 | ± | 0.38 | ||
| 18:0 | 18.90 | ± | 1.05 | 17.32 | ± | 0.66 | 15.44 | ± | 1.50 | ** | 15.44 | ± | 1.50 | ** |
| 18:1 (n-9) | 18.23 | ± | 0.82 | 17.14 | ± | 0.78 | 15.56 | ± | 1.16 | ** | 15.56 | ± | 1.16 | ** |
| 18:1(n-7) | 4.64 | ± | 0.48 | 4.18 | ± | 0.34 | 3.82 | ± | 0.62 | 3.82 | ± | 0.62 | ||
| 18:2 (n-6) | 0.69 | ± | 0.45 | 0.99 | ± | 0.65 | 1.38 | ± | 0.49 | 1.38 | ± | 0.49 | ||
| 18:3 (n-6) | 0.36 | ± | 0.19 | 0.49 | ± | 0.36 | 0.60 | ± | 0.47 | 0.60 | ± | 0.47 | ||
| 18:3 (n-3) | 0.54 | ± | 0.43 | 0.49 | ± | 0.15 | 0.51 | ± | 0.42 | 0.51 | ± | 0.42 | ||
| 20:0 | 1.86 | ± | 0.69 | 1.90 | ± | 0.64 | 1.18 | ± | 0.72 | 1.18 | ± | 0.72 | ||
| 20:1 (n-9) | 3.71 | ± | 0.42 | 3.42 | ± | 0.59 | 2.87 | ± | 0.60 | 2.87 | ± | 0.60 | ||
| 20:2 (n-6) | 1.28 | ± | 0.84 | 0.71 | ± | 0.50 | 0.88 | ± | 0.95 | 0.88 | ± | 0.95 | ||
| 20:3 (n-6) | 0.69 | ± | 0.54 | 1.30 | ± | 0.66 | 1.44 | ± | 0.35 | 1.44 | ± | 0.35 | ||
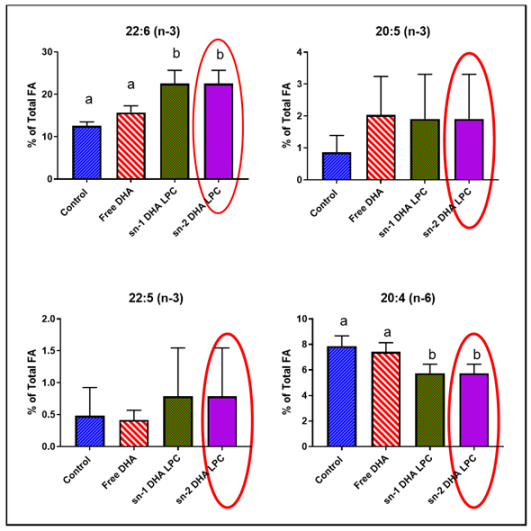
| 20:4 (n-6) | 7.86 | ± | 0.81 | 7.42 | ± | 0.72 | 5.75 | ± | 0.71 | ** | 5.75 | ± | 0.71 | ** |
| 22:0 | 1.20 | ± | 0.41 | 1.08 | ± | 0.59 | 1.24 | ± | 0.95 | 1.24 | ± | 0.95 | ||
| 20:5 (n-3) | 0.86 | ± | 0.53 | 2.03 | ± | 1.21 | 1.91 | ± | 1.40 | 1.91 | ± | 1.40 | ||
| 22:2 | 0.80 | ± | 0.34 | 0.77 | ± | 0.51 | 1.00 | ± | 0.76 | 1.00 | ± | 0.76 | ||
| 22:4 (n-6) | 2.03 | ± | 0.91 | 2.51 | ± | 0.85 | 2.23 | ± | 0.87 | 2.23 | ± | 0.87 | ||
| 22:5 (n-3) | 0.48 | ± | 0.44 | 0.42 | ± | 0.15 | 0.79 | ± | 0.76 | 0.79 | ± | 0.76 | ||
| 22:6 (n-3) | 12.61 | ± | 0.91 | 15.74 | ± | 1.57 | 22.57 | ± | 3.12 | ** | 22.57 | ± | 3.12 | ** |
| 24:1 | 0.78 | ± | 0.48 | 0.51 | ± | 0.25 | 0.49 | ± | 0.17 | 0.49 | ± | 0.17 | ||
| 16:0 DMA | 1.16 | ± | 0.96 | 0.75 | ± | 0.56 | 1.02 | ± | 0.32 | 1.02 | ± | 0.32 | ||
| 18:0 DMA | 1.25 | ± | 1.04 | 2.10 | ± | 0.88 | 1.96 | ± | 0.30 | 1.96 | ± | 0.30 | ||
| 18:1 DMA | 0.73 | ± | 0.75 | 0.85 | ± | 0.56 | 0.78 | ± | 0.64 | 0.78 | ± | 0.64 | ||
| Control | Free DHA | sn-1 DHA LPC | sn-2 DHA LPC | |||||||||||
|---|---|---|---|---|---|---|---|---|---|---|---|---|---|---|
| FA | Mean | ± | SD | Mean | ± | SD | Mean | ± | SD | Mean | ± | SD | ||
| 12:0 | 0.26 | ± | 0.14 | 0.60 | ± | 0.35 | 0.73 | ± | 0.47 | 0.98 | ± | 0.34 | ||
| 14:0 | 0.50 | ± | 0.25 | 0.20 | ± | 0.17 | 0.30 | ± | 0.17 | 0.33 | ± | 0.25 | ||
| 16:0 | 17.92 | ± | 1.41 | 16.11 | ± | 1.56 | 14.62 | ± | 1.22 | ** | 15.05 | ± | 1.56 | ** |
| 16:1 | 0.38 | ± | 0.17 | 0.55 | ± | 0.28 | 0.47 | ± | 0.34 | 0.45 | ± | 0.37 | ||
| 17:1 | 0.29 | ± | 0.13 | 0.43 | ± | 0.16 | 0.48 | ± | 0.38 | 0.61 | ± | 0.47 | ||
| 18:0 | 18.90 | ± | 1.05 | 17.32 | ± | 0.66 | 15.44 | ± | 1.50 | ** | 15.40 | ± | 0.58 | ** |
| 18:1 (n-9) | 18.23 | ± | 0.82 | 17.14 | ± | 0.78 | 15.56 | ± | 1.16 | ** | 15.69 | ± | 1.10 | ** |
| 18:1(n-7) | 4.64 | ± | 0.48 | 4.18 | ± | 0.34 | 3.82 | ± | 0.62 | 3.87 | ± | 0.61 | ||
| 18:2 (n-6) | 0.69 | ± | 0.45 | 0.99 | ± | 0.65 | 1.38 | ± | 0.49 | 1.05 | ± | 0.40 | ||
| 18:3 (n-6) | 0.36 | ± | 0.19 | 0.49 | ± | 0.36 | 0.60 | ± | 0.47 | 0.28 | ± | 0.13 | ||
| 18:3 (n-3) | 0.54 | ± | 0.43 | 0.49 | ± | 0.15 | 0.51 | ± | 0.42 | 0.49 | ± | 0.37 | ||
| 20:0 | 1.86 | ± | 0.69 | 1.90 | ± | 0.64 | 1.18 | ± | 0.72 | 2.13 | ± | 1.71 | ||
| 20:1 (n-9) | 3.71 | ± | 0.42 | 3.42 | ± | 0.59 | 2.87 | ± | 0.60 | 2.62 | ± | 0.48 | ||
| 20:2 (n-6) | 1.28 | ± | 0.84 | 0.71 | ± | 0.50 | 0.88 | ± | 0.95 | 1.06 | ± | 0.76 | ||
| 20:3 (n-6) | 0.69 | ± | 0.54 | 1.30 | ± | 0.66 | 1.44 | ± | 0.35 | 1.16 | ± | 0.77 | ||
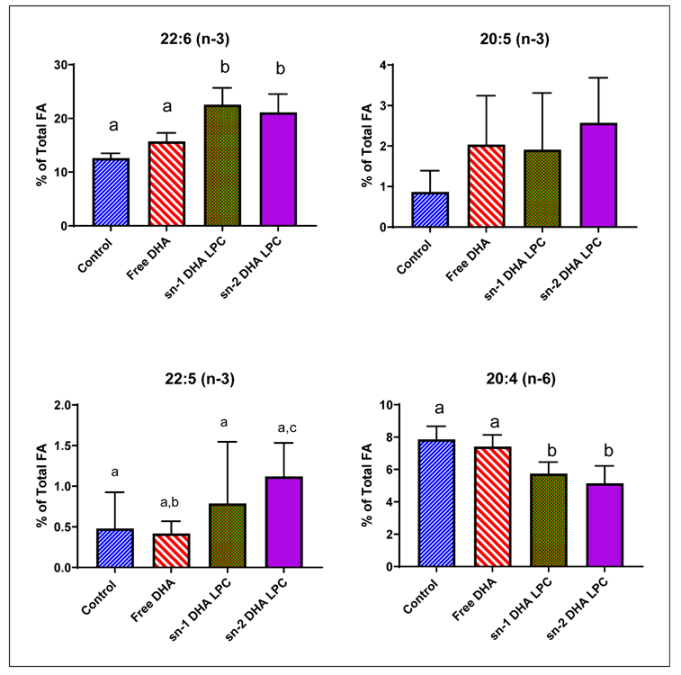
| 20:4 (n-6) | 7.86 | ± | 0.81 | 7.42 | ± | 0.72 | 5.75 | ± | 0.71 | ** | 5.14 | ± | 1.08 | ** |
| 22:0 | 1.20 | ± | 0.41 | 1.08 | ± | 0.59 | 1.24 | ± | 0.95 | 1.27 | ± | 1.14 | ||
| 20:5 (n-3) | 0.86 | ± | 0.53 | 2.03 | ± | 1.21 | 1.91 | ± | 1.40 | 2.57 | ± | 1.11 | ||
| 22:2 | 0.80 | ± | 0.34 | 0.77 | ± | 0.51 | 1.00 | ± | 0.76 | 1.32 | ± | 0.80 | ||
| 22:4 (n-6) | 2.03 | ± | 0.91 | 2.51 | ± | 0.85 | 2.23 | ± | 0.87 | 2.10 | ± | 0.65 | ||
| 22:5 (n-3) | 0.48 | ± | 0.44 | 0.42 | ± | 0.15 | 0.79 | ± | 0.76 | 1.12 | ± | 0.41 | ||
| 22:6 (n-3) | 12.61 | ± | 0.91 | 15.74 | ± | 1.57 | 22.57 | ± | 3.12 | ** | 21.14 | ± | 3.39 | ** |
| 24:1 | 0.78 | ± | 0.48 | 0.51 | ± | 0.25 | 0.49 | ± | 0.17 | 0.54 | ± | 0.40 | ||
| 16:0 DMA | 1.16 | ± | 0.96 | 0.75 | ± | 0.56 | 1.02 | ± | 0.32 | 0.98 | ± | 0.47 | ||
| 18:0 DMA | 1.25 | ± | 1.04 | 2.10 | ± | 0.88 | 1.96 | ± | 0.30 | 1.78 | ± | 1.04 | ||
| 18:1 DMA | 0.73 | ± | 0.75 | 0.85 | ± | 0.56 | 0.78 | ± | 0.64 | 0.89 | ± | 0.51 | ||
Publisher’s Note: MDPI stays neutral with regard to jurisdictional claims in published maps and institutional affiliations. |
© 2021 by the authors. Licensee MDPI, Basel, Switzerland. This article is an open access article distributed under the terms and conditions of the Creative Commons Attribution (CC BY) license (https://creativecommons.org/licenses/by/4.0/).
Share and Cite
Sugasini, D.; Yalagala, P.C.R.; Subbaiah, P.V. Correction: Sugasini et al. Efficient Enrichment of Retinal DHA with Dietary Lysophosphatidylcholine-DHA: Potential Application for Retinopathies. Nutrients 2020, 12, 3114. Nutrients 2021, 13, 2166. https://doi.org/10.3390/nu13072166
Sugasini D, Yalagala PCR, Subbaiah PV. Correction: Sugasini et al. Efficient Enrichment of Retinal DHA with Dietary Lysophosphatidylcholine-DHA: Potential Application for Retinopathies. Nutrients 2020, 12, 3114. Nutrients. 2021; 13(7):2166. https://doi.org/10.3390/nu13072166
Chicago/Turabian StyleSugasini, Dhavamani, Poorna C. R. Yalagala, and Papasani V. Subbaiah. 2021. "Correction: Sugasini et al. Efficient Enrichment of Retinal DHA with Dietary Lysophosphatidylcholine-DHA: Potential Application for Retinopathies. Nutrients 2020, 12, 3114" Nutrients 13, no. 7: 2166. https://doi.org/10.3390/nu13072166
APA StyleSugasini, D., Yalagala, P. C. R., & Subbaiah, P. V. (2021). Correction: Sugasini et al. Efficient Enrichment of Retinal DHA with Dietary Lysophosphatidylcholine-DHA: Potential Application for Retinopathies. Nutrients 2020, 12, 3114. Nutrients, 13(7), 2166. https://doi.org/10.3390/nu13072166