Randomised Controlled Trial of Nutritional Supplement on Bone Turnover Markers in Indian Premenopausal Women


Abstract
1. Introduction
2. Materials and Methods
2.1. Design
2.2. Study Participants
2.3. Endpoints
2.4. Laboratory Methods
2.5. Statistical Analysis
3. Results
3.1. Demographics
3.2. Efficacy
3.2.1. Primary Efficacy Results
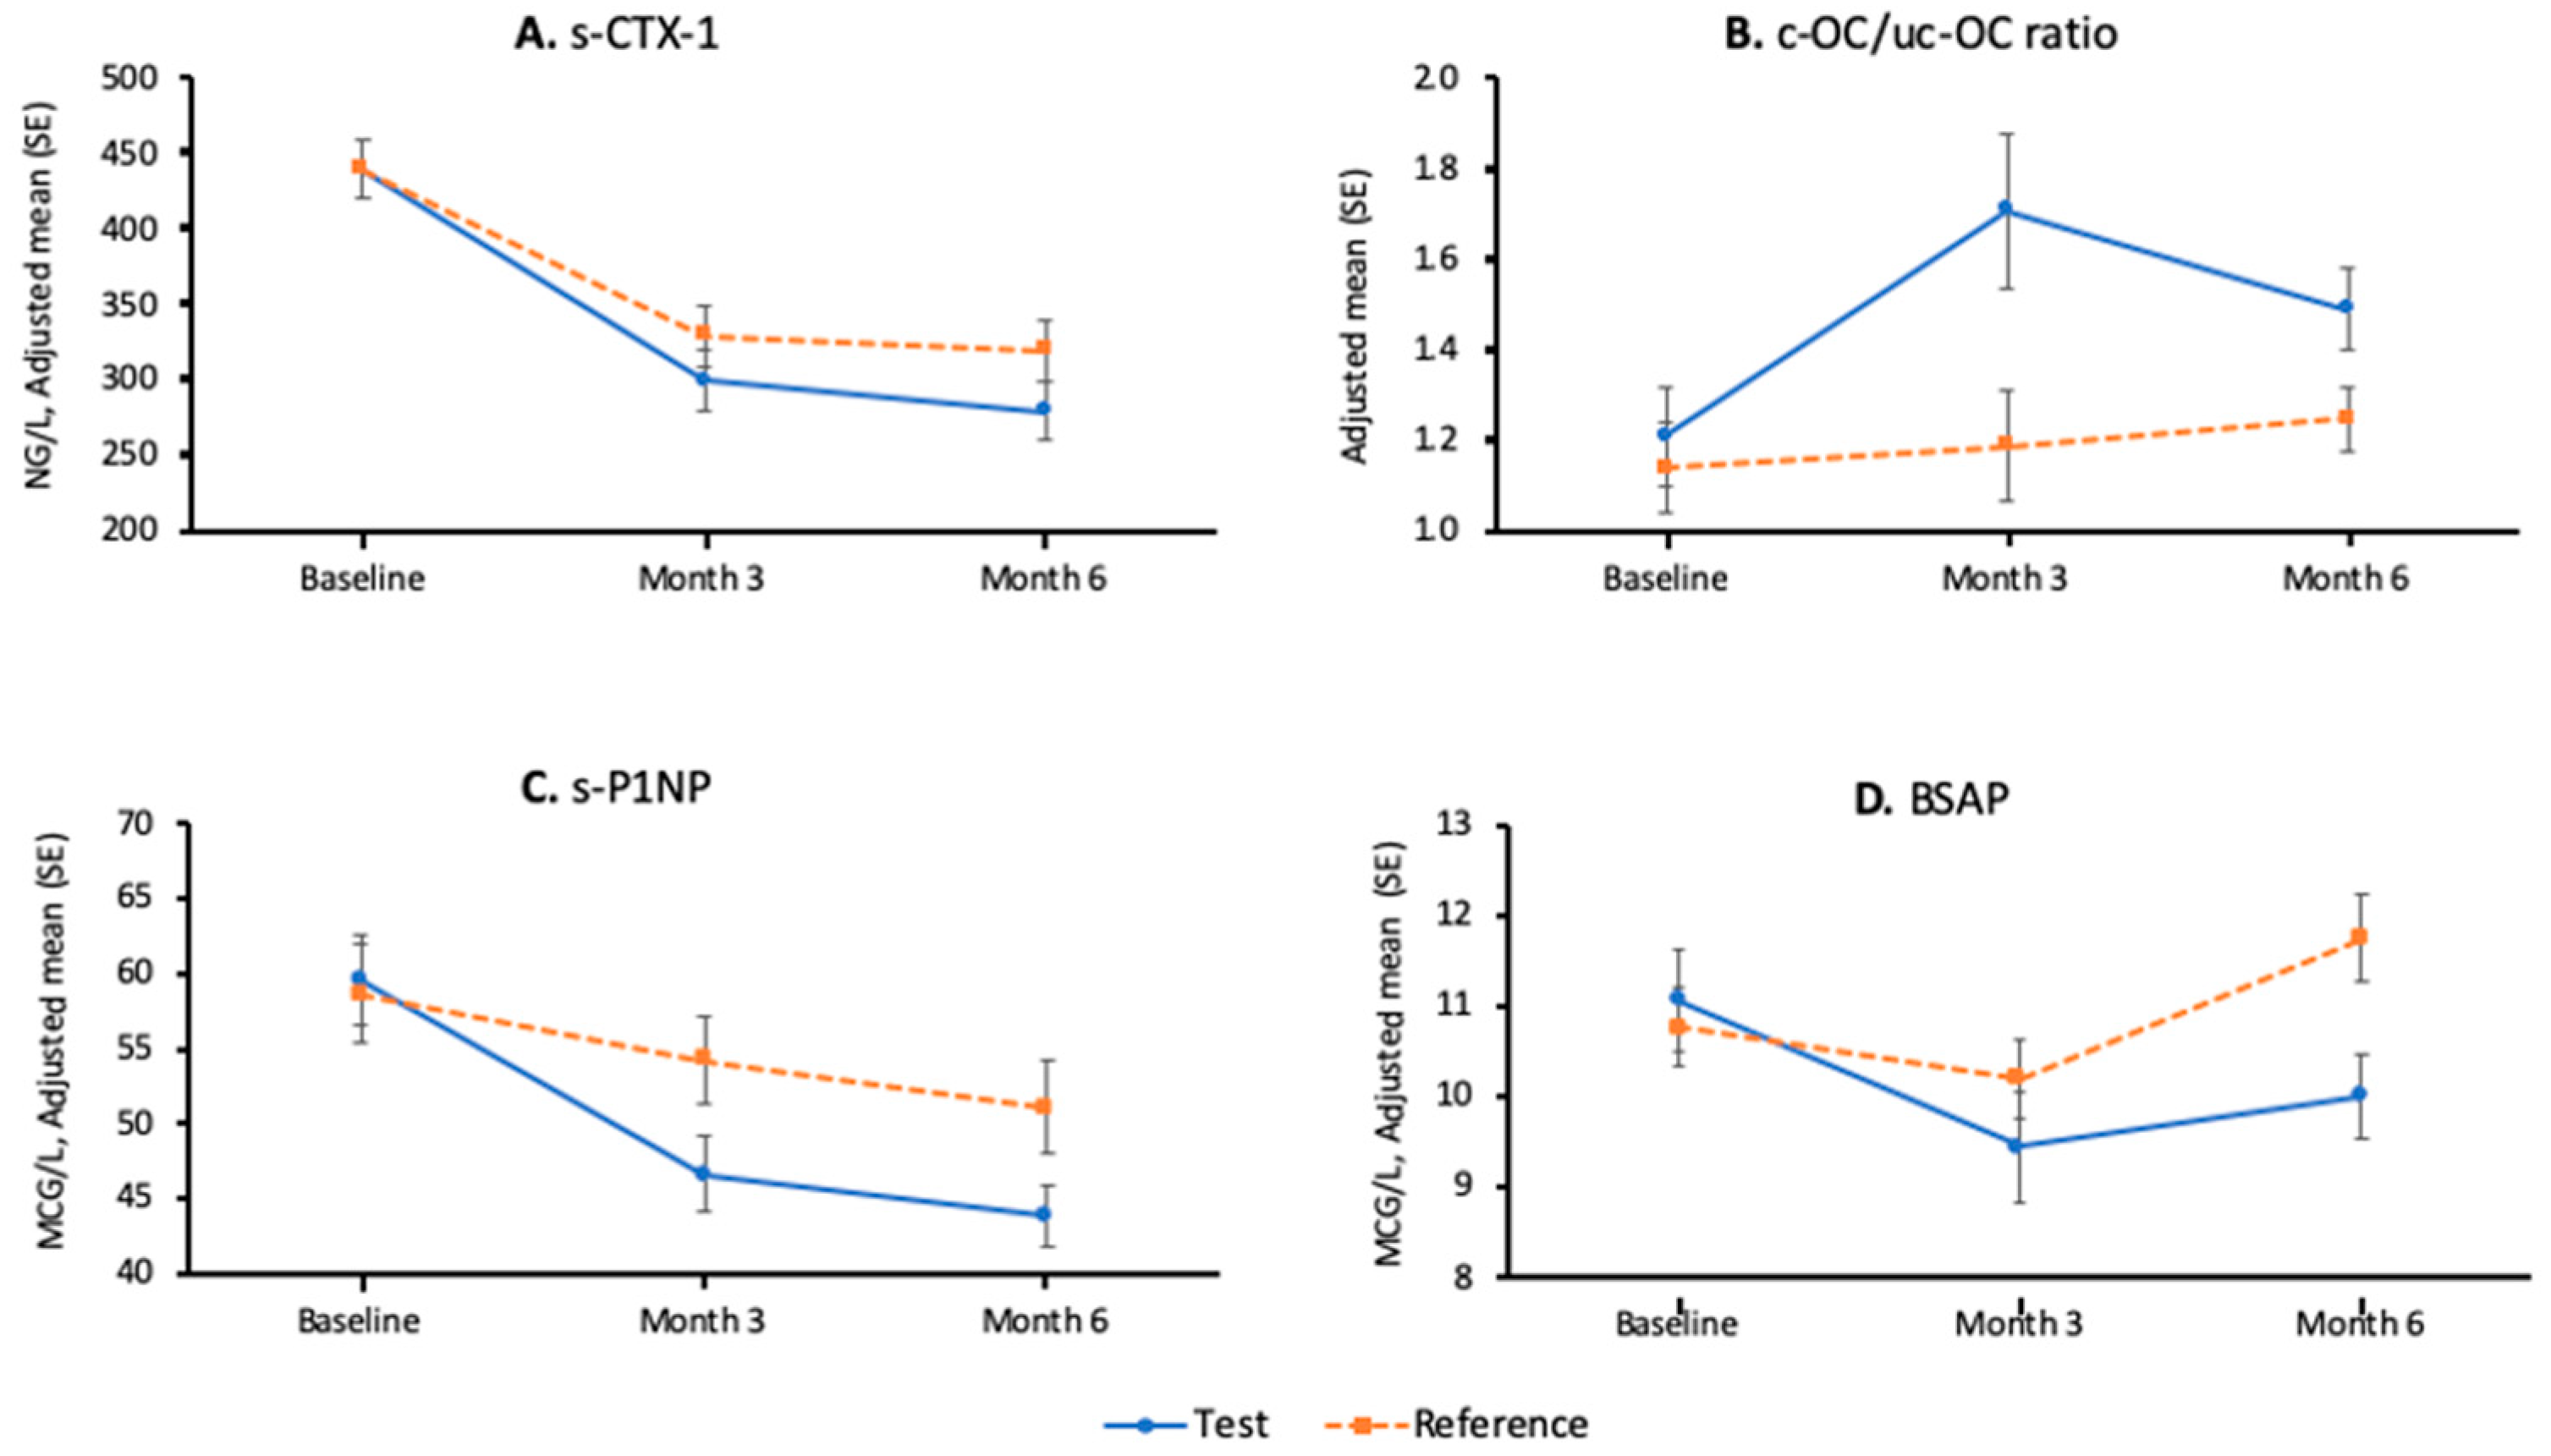
3.2.2. Secondary Efficacy Results—Bone Metabolism Parameters
3.2.3. Secondary Efficacy Results—Micronutrients
3.3. Safety
4. Discussion
4.1. Bone Turnover Markers and Bone Metabolism
4.2. Vitamin K Status
4.3. Other Micronutrients
5. Conclusions
Author Contributions
Funding
Institutional Review Board Statement
Informed Consent Statement
Data Availability Statement
Acknowledgments
Conflicts of Interest
References
- Mithal, A.; Wahl, D.A.; Bonjour, J.P.; Burckhardt, P.; Dawson-Hughes, B.; Eisman, J.A.; El-Hajj Fuleihan, G.; Josse, R.G.; Lips, P.; Morales-Torres, J.; et al. Global vitamin D status and determinants of hypovitaminosis D. Osteoporos. Int. 2009, 20, 1807–1820. [Google Scholar] [CrossRef] [PubMed]
- Shivane, V.K.; Sarathi, V.; Bandgar, T.; Menon, P.; Shah, N.S. High prevalence of hypovitaminosis D in young healthy adults from the western part of India. Postgrad. Med. J. 2011, 87, 514–518. [Google Scholar] [CrossRef] [PubMed]
- Mithal, A.; Bansal, B.; Kyer, C.S.; Ebeling, P. The Asia-Pacific Regional Audit-Epidemiology, Costs, and Burden of Osteoporosis in India 2013: A report of International Osteoporosis Foundation. Indian J. Endocrinol. Metab. 2014, 18, 449–454. [Google Scholar] [CrossRef] [PubMed]
- Bonjour, J.P.; Kohrt, W.; Levasseur, R.; Warren, M.; Whiting, S.; Kraenzlin, M. Biochemical markers for assessment of calcium economy and bone metabolism: Application in clinical trials from pharmaceutical agents to nutritional products. Nutr. Res. Rev. 2014, 27, 252–267. [Google Scholar] [CrossRef]
- Vilaca, T.; Gossiel, F.; Eastell, R. Bone Turnover Markers: Use in Fracture Prediction. J. Clin. Densitom. 2017, 20, 346–352. [Google Scholar] [CrossRef]
- Vasikaran, S.; Eastell, R.; Bruyere, O.; Foldes, A.J.; Garnero, P.; Griesmacher, A.; McClung, M.; Morris, H.A.; Silverman, S.; Trenti, T.; et al. Markers of bone turnover for the prediction of fracture risk and monitoring of osteoporosis treatment: A need for international reference standards. Osteoporos. Int. 2011, 22, 391–420. [Google Scholar] [CrossRef]
- Kruger, M.C.; Booth, C.L.; Coad, J.; Schollum, L.M.; Kuhn-Sherlock, B.; Shearer, M.J. Effect of calcium fortified milk supplementation with or without vitamin K on biochemical markers of bone turnover in premenopausal women. Nutrition 2006, 22, 1120–1128. [Google Scholar] [CrossRef]
- Kruger, M.C.; Schollum, L.M.; Kuhn-Sherlock, B.; Hestiantoro, A.; Wijanto, P.; Li-Yu, J.; Agdeppa, I.; Todd, J.M.; Eastell, R. The effect of a fortified milk drink on vitamin D status and bone turnover in post-menopausal women from South East Asia. Bone 2010, 46, 759–767. [Google Scholar] [CrossRef]
- Ferrar, L.; van der Hee, R.M.; Berry, M.; Watson, C.; Miret, S.; Wilkinson, J.; Bradburn, M.; Eastell, R. Effects of calcium-fortified ice cream on markers of bone health. Osteoporos. Int. 2011, 22, 2721–2731. [Google Scholar] [CrossRef]
- Sami, A.; Abrahamsen, B. The Latest Evidence from Vitamin D Intervention Trials for Skeletal and Non-skeletal Outcomes. Calcif. Tissue Int. 2020, 106, 88–93. [Google Scholar] [CrossRef]
- Inaba, N.; Sato, T.; Yamashita, T. Low-Dose Daily Intake of Vitamin K(2) (Menaquinone-7) Improves Osteocalcin gamma-Carboxylation: A Double-Blind, Randomized Controlled Trials. J. Nutr. Sci. Vitaminol. 2015, 61, 471–480. [Google Scholar] [CrossRef] [PubMed]
- Knapen, M.H.; Drummen, N.E.; Smit, E.; Vermeer, C.; Theuwissen, E. Three-year low-dose menaquinone-7 supplementation helps decrease bone loss in healthy postmenopausal women. Osteoporos. Int. 2013, 24, 2499–2507. [Google Scholar] [CrossRef] [PubMed]
- Huang, Z.B.; Wan, S.L.; Lu, Y.J.; Ning, L.; Liu, C.; Fan, S.W. Does vitamin K2 play a role in the prevention and treatment of osteoporosis for postmenopausal women: A meta-analysis of randomized controlled trials. Osteoporos. Int. 2015, 26, 1175–1186. [Google Scholar] [CrossRef] [PubMed]
- Binkley, N.C.; Krueger, D.C.; Engelke, J.A.; Foley, A.L.; Suttie, J.W. Vitamin K supplementation reduces serum concentrations of under-gamma-carboxylated osteocalcin in healthy young and elderly adults. Am. J. Clin. Nutr. 2000, 72, 1523–1528. [Google Scholar] [CrossRef] [PubMed]
- Eastell, R.; Garnero, P.; Audebert, C.; Cahall, D.L. Reference intervals of bone turnover markers in healthy premenopausal women: Results from a cross-sectional European study. Bone 2012, 50, 1141–1147. [Google Scholar] [CrossRef]
- Aspray, T.J.; Bowring, C.; Fraser, W.; Gittoes, N.; Javaid, M.K.; Macdonald, H.; Patel, S.; Selby, P.; Tanna, N.; Francis, R.M. National Osteoporosis Society Vitamin D Guideline Summary. Age Ageing 2014, 43, 592–595. [Google Scholar] [CrossRef] [PubMed]
- Johansson, H.; IFCC-IOF Joint Working Group on Standardisation of Biochemical Markers of Bone Turnover; Odén, A.; Kanis, J.A.; McCloskey, E.V.; Morris, H.A.; Cooper, C.; Vasikaran, S. A meta-analysis of reference markers of bone turnover for prediction of fracture. Calcif. Tissue Int. 2014, 94, 560–567. [Google Scholar] [CrossRef]
- Bauer, D.C.; Black, D.M.; Bouxsein, M.L.; Lui, L.Y.; Cauley, J.A.; de Papp, A.E.; Grauer, A.; Khosla, S.; McCulloch, C.E.; Eastell, R.; et al. Treatment-Related Changes in Bone Turnover and Fracture Risk Reduction in Clinical Trials of Anti-Resorptive Drugs: A Meta-Regression. J. Bone Miner. Res. 2018, 33, 634–642. [Google Scholar] [CrossRef]
- Zibellini, J.; Seimon, R.V.; Lee, C.M.; Gibson, A.A.; Hsu, M.S.; Shapses, S.A.; Nguyen, T.V.; Sainsbury, A. Does Diet-Induced Weight Loss Lead to Bone Loss in Overweight or Obese Adults? A Systematic Review and Meta-Analysis of Clinical Trials. J. Bone Miner. Res. 2015, 30, 2168–2178. [Google Scholar] [CrossRef]
- Tang, B.M.; Eslick, G.D.; Nowson, C.; Smith, C.; Bensoussan, A. Use of calcium or calcium in combination with vitamin D supplementation to prevent fractures and bone loss in people aged 50 years and older: A meta-analysis. Lancet 2007, 370, 657–666. [Google Scholar] [CrossRef]
- Bolland, M.J.; Leung, W.; Tai, V.; Bastin, S.; Gamble, G.D.; Grey, A.; Reid, I.R. Calcium intake and risk of fracture: Systematic review. BMJ 2015, 351, h4580. [Google Scholar] [CrossRef] [PubMed]
- Cheung, A.M.; Tile, L.; Lee, Y.; Tomlinson, G.; Hawker, G.; Scher, J.; Hu, H.; Vieth, R.; Thompson, L.; Jamal, S.; et al. Vitamin K supplementation in postmenopausal women with osteopenia (ECKO trial): A randomized controlled trial. PLoS Med. 2008, 5, e196. [Google Scholar] [CrossRef] [PubMed]
- Ronn, S.H.; Harslof, T.; Pedersen, S.B.; Langdahl, B.L. Vitamin K2 (menaquinone-7) prevents age-related deterioration of trabecular bone microarchitecture at the tibia in postmenopausal women. Eur. J. Endocrinol. 2016, 175, 541–549. [Google Scholar] [CrossRef] [PubMed]
- Stone, K.L.; Lui, L.Y.; Christen, W.G.; Troen, A.M.; Bauer, D.C.; Kado, D.; Schambach, C.; Cummings, S.R.; Manson, J.E. Effect of Combination Folic Acid, Vitamin B6, and Vitamin B12 Supplementation on Fracture Risk in Women: A Randomized, Controlled Trial. J. Bone Miner. Res. 2017, 32, 2331–2338. [Google Scholar] [CrossRef] [PubMed]
- Yang, J.; Hu, X.; Zhang, Q.; Cao, H.; Wang, J.; Liu, B. Homocysteine level and risk of fracture: A meta-analysis and systematic review. Bone 2012, 51, 376–382. [Google Scholar] [CrossRef]
- Morris, M.S.; Picciano, M.F.; Jacques, P.F.; Selhub, J. Plasma pyridoxal 5’-phosphate in the US population: The National Health and Nutrition Examination Survey, 2003–2004. Am. J. Clin. Nutr. 2008, 87, 1446–1454. [Google Scholar] [CrossRef]
- Hunt, A.; Harrington, D.; Robinson, S. Vitamin B12 deficiency. BMJ 2014, 349, g5226. [Google Scholar] [CrossRef]


| Nutritional Composition | Nutritional Supplement (Test Group) | Placebo (Control Group) | |
|---|---|---|---|
| ICMR/WHO/RDA | Amount per daily serving (% RDA) | Amount per daily serving | |
| Energy (Kcal) | 1900 | 215.9 (11.4) | 215.9 |
| Carbohydrate (g) Of which sugar (g) | NA | 40.9 0 | 47 10.8 (approximately) |
| Fat (g) | 20 | 1.8 (9) | 2 (max) |
| Protein (g) | 55 | 9 (16.4) | 3 (max) |
| Vitamin A (mcg) | 600 | 198 (33) | |
| Vitamin D2 (IU) | 400 | 400 (100) | |
| Vitamin K2 (mcg) | 55 | 55 (100) | |
| Vitamin E (mg) | 10 | 2.5 (25) | |
| Vitamin B1 (mg) | 1 | 0.3 (33) | |
| Vitamin B2 (mg) | 1.1 | 1.1 (100) | |
| Niacin (mg) | 12 | 4 (33) | |
| Vitamin B6 (mg) | 2 | 2 (100) | |
| Vitamin B12 (mcg) | 1 | 1 (100) | |
| Folic acid (mcg) | 120 | 120 (100) | |
| Vitamin C (mg) | 40 | 40 (100) | |
| Biotin (mcg) | 30 | 9.9 (33) | |
| Pantothenic acid (mg) | 5 | 1.7 (34) | |
| Calcium (mg) | 600 | 600 (100) | |
| Iodine (mcg) | 150 | 49.5 (33) | |
| Magnesium (mg) | 310 | 72.6 (23.4) | |
| Zinc (mg) | 10 | 1.6 (16.2) | |
| Selenium (mcg) | 40 | 25.8 (64.5) | |
| Potassium (mg) | 3225 | 325 (10.1) |
| Test | Control | Reference Interval | |
|---|---|---|---|
| General Characteristics | |||
| Female, n (%) | 57 (100) | 57 (100) | |
| Age, years [mean (SD)] | 35.0 (4.4) | 34.2 (4.8) | |
| Height, cm [mean (SD)] | 152.8 (4.9) | 154.1 (5.3) | |
| Weight (kg) [mean (SD)] | 57.5 (7.1) | 59.6 (8.5) | |
| Body mass index, kg/m2 [mean (SD)] | 24.7 (3.0) | 25.0 (2.8) | |
| Bone Metabolism Parameters, Mean (SD) | |||
| Primary endpoints | |||
| s-CTX-1 (ng/L) | 435 (119) | 440 (160) | 111 to 791 [15] |
| c-OC/uc-OC | 1.2 (0.7) | 1.2 (0.8) | 0.69 ± 0.41 [12] |
| Secondary endpoints | |||
| CTX-I/CR, mcg/mmol | 2.6 (1.6) | 2.4 (1.3) | N/A |
| s-NTX-I (nM BCE/L) | 11.5 (3.3) | 11.9 (3.0) | Female 6.2 to 19 |
| s-PINP (mcg/L) | 59.6 (21.6) | 58.0 (22.2) | 17.3 to 75.2 [15] |
| Osteocalcin (mcg/L) | 19.8 (5.2) | 19.3 (5.5) | 7.0 to 38.0 |
| ALP (IU/L) | 67.8 (25.1) | 69.8 (17.9) | 20 to 125 |
| BSAP (mcg/L) | 10.9 (4.0) | 10.7 (2.9) | 4.7 to 18.8 |
| s-PTH (pmol/L) | 5.7 (2.8) | 5.4 (3.0) | 1.1 to 6.8 |
| Calcium (mmol/L) | 2.30 (0.06) | 2.30 (0.07) | 2.12 to 2.56 |
| Phosphorus (mmol/L) | 1.15 (0.13) | 1.13 (0.14) | 0.8 to 1.45 |
| Urinary Ca/CR (mmol/mol CR) | 107.4(85.0) | 107.7 (83.1) | 28 to 905 |
| 25(OH)D3 (nmol/L) | 43.2 (35.4) | 41.6 (19.9) | >50 [16] |
| Micronutrients, Mean (SD) | |||
| Selenium (mcmol/L) | 1.34 (0.17) | 1.31 (0.20) | 0.83 to 2.03 |
| Zinc (mcmol/L) | 10.8 (1.7) | 10.6 (2.0) | 9.2 to 19.9 |
| Folate (nmol/L) | 18.5 (13.2) | 36.5 (129.3) | >12.3 |
| Vitamin B6 (nmol/L) | 23.4 (15.5) | 21.8 (13.3) | 8 to 88 |
| Vitamin B12 (pmol/L) | 174.8 (72.5) | 206.8 (132.3) | 148 to 812 |
| Test (n = 52) | Control (n = 50) | Difference | ||
|---|---|---|---|---|
| s-CTX-1 (ng/L) | ||||
| Baseline | Mean (SD) | 444 (119) | 441 (162) | |
| 6 months | Mean (SD) | 283 (142) | 324 (168) | |
| % Change from baseline, (SD) | −33 (41) *** | −23 (34) *** | NS | |
| c-OC/uc-OC | ||||
| Baseline | Mean (SD) | 1.21 (0.76) | 1.14 (0.68) | |
| 6 months | Mean (SD) | 1.49 (0.67) | 1.25 (0.49) | |
| % Change from baseline, (SD) | 53 (82) *** | 45 (134) | NS |
| Geometric Mean Ratio (Test over Reference Product) | p-Value | |
|---|---|---|
| s-CTX-1 (ng/L) | ||
| 3 months | 0.84 | 0.043 |
| 6 months | 0.85 | 0.121 |
| Urinary Ca/Cr | ||
| 3 months | 1.52 | 0.014 |
| 6 months | 0.73 | 0.242 |
| Vitamin D3 | ||
| 3 months | 0.84 | 0.003 |
| 6 months | 0.90 | 0.308 |
| Folate * | ||
| 3 months | NA | <0.001 |
| 6 months | NA | <0.001 |
| Vitamin B6 | ||
| 3 months | 1.75 | <0.001 |
| 6 months | 1.60 | <0.001 |
| Test | Control | Difference | ||
|---|---|---|---|---|
| s-CTX-1 (ng/L) | ||||
| Baseline | Mean (SD) | 444 (119) | 441 (162) | |
| 3 months | Mean (SD) | 300 (158) | 330 (167) | |
| % Change from baseline, (SD) | −32 (37) *** | −24 (28) *** | NS | |
| c-OC/uc-OC | ||||
| Baseline | Mean (SD) | 1.21 (0.76) | 1.14 (0.68) | |
| 3 months | Mean (SD) | 1.71 (1.21) | 1.19 (0.83) | |
| % Change from baseline, (SD) | 67 (124) *** | 23 (110) | * | |
| s-NTX-1 (nM BCE) | ||||
| Baseline | Mean (SD) | 11.6 (3.4) | 11.9 (3.1) | |
| 3 months | Mean (SD) | 10.7 (6.3) | 10.0 (5.7) | |
| % Change from baseline, (SD) | −3.0 (58.5) | −14.1 (50.4) * | NS | |
| 6 months | Mean (SD) | 8.2 (3.1) | 9.4 (4.2) | |
| % Change from baseline (SD) | −25.2 (33.3) *** | −19.0 (32.3) *** | NS | |
| s-PINP (mcg/L) | ||||
| Baseline | Mean (SD) | 59.6 (22.0) | 58.7 (23.1) | |
| 3 months | Mean (SD) | 46.6 (18.0) | 54.2 (21.0) | |
| % Change from baseline, (SD) | −19 (22) *** | −4 (29) * | ** | |
| 6 months | Mean (SD) | 43.9 (14.2) | 51.1 (23.0) | |
| % Change from baseline, (SD) | −21 (25) *** | −9 (30) *** | ** | |
| ALP (IU/L) | ||||
| Baseline | Mean (SD) | 69.0 (26.0) | 70.4 (18.4) | |
| 3 months | Mean (SD) | 63.3 (23.4) | 67.7 (17.7) | |
| % Change from baseline, (SD) | −8 (11) *** | −2 (13) | * | |
| 6 months | Mean (SD) | 63.4 (20.3) | 70.2 (17.0) | |
| % Change from baseline, (SD) | −5 (23) ** | 1 (14) | * | |
| BSAP (mcg/L) | ||||
| Baseline | Mean (SD) | 11.1 (4.1) | 10.8 (3.1) | |
| 3 months | Mean (SD) | 9.4 (4.3) | 10.2 (3.1) | |
| % Change from baseline, (SD) | −16 (20) *** | −2 (38) * | ** | |
| 6 months | Mean (SD) | 10.0 (3.3) | 11.8 (3.4) | |
| % Change from baseline, (SD) | −5 (35) * | 10 (13) * | *** | |
| s-PTH (pmol/L) | ||||
| Baseline | Mean (SD) | 5.7 (2.9) | 5.3 (2.5) | |
| 3 months | Mean (SD) | 5.0 (3.4) | 5.8 (2.6) | |
| % Change from baseline, (SD) | −6 (46) | 16 (59) | NS | |
| 6 months | Mean (SD) | 7.3 (3.4) | 8.1 (4.3) | |
| %Change from baseline, (SD) | 43 (78) ** | 70 (106) *** | NS | |
| Calcium (mmol/L) | ||||
| Baseline | Mean (SD) | 2.30 (0.06) | 2.30 (0.07) | |
| 3 months | Mean (SD) | 2.27 (0.08) | 2.26 (0.09) | |
| % Change from baseline, (SD) | −2 (4) ** | −2 (4) *** | NS | |
| 6 months | Mean (SD) | 2.40 (0.08) | 2.33 (0.08) | |
| % Change from baseline, (SD) | 3 (4) *** | 1 (4) ** | * | |
| Phosphorus (mmol/L) | ||||
| Baseline | Mean (SD) | 1.14 (0.13) | 1.13 (0.14) | |
| 3 months | Mean (SD) | 1.16 (0.19) | 1.18 (0.16) | |
| % Change from baseline, (SD) | 3 (18) | 6 (15) ** | NS | |
| 6 months | Mean (SD) | 1.13 (0.15) | 1.12 (0.18) | |
| % Change from baseline, (SD) | 0 (15) | 0 (16) | NS |
| Test | Control | Difference | ||
|---|---|---|---|---|
| Selenium (mcmol/L) | ||||
| Baseline | Mean (SD) | 1.35 (0.17) | 1.31 (0.18) | |
| 3 months | Mean (SD) | 1.29 (0.22) | 1.25 (0.29) | |
| % Change from baseline, (SD) | −3 (19) | −4 (20) ** | NS | |
| 6 months | Mean (SD) | 1.41 (0.28) | 1.35 (0.26) | |
| % Change from baseline, (SD) | 5 (21) | 4 (22) | NS | |
| Zinc (mcmol/L) | ||||
| Baseline | Mean (SD) | 10.8 (1.7) | 10.6 (2.1) | |
| 3 months | Mean (SD) | 10.3 (1.8) | 10.0 (1.5) | |
| % Change from baseline, (SD) | −3 (17) | −4 (21) ** | NS | |
| 6 months | Mean (SD) | 10.3 (1.3) | 10.0 (1.6) | |
| % Change from baseline, (SD) | −2 (17) | −4 (20) ** | NS | |
| Vitamin B12 (pmol/L) | ||||
| Baseline | Mean (SD) | 177.1 (75.1) | 209.6 (140.3) | |
| 3 months | Mean (SD) | 212.4 (96.7) | 190.2 (77.0) | |
| % Change from baseline, (SD) | 22 (41) * | −1 (27) | * | |
| 6 months | Mean (SD) | 227.4 (95.4) | 205.4 (92.0) | |
| % Change from baseline, (SD) | 35 (51) ** | 6 (30) | NS |
| Adverse Events Number (%) of Subjects [Events] | Test (n = 57) | Control (n = 57) |
|---|---|---|
| Number of subjects with at least one adverse event | 19 (33.3) [17] | 19 (33.3) [18] |
| Nausea | 5 (8.8) [5] | 2 (3.5) [2] |
| Constipation | 1 (1.8) [1] | 2 (3.5) [2] |
| Dyspepsia | 1 (1.8) [1] | 2 (3.5) [2] |
| Abdominal distension | 1 (1.8) [1] | 1 (1.8) [1] |
| Abdominal pain | 2 (3.5) [2] | 0 |
| Flatulence | 1 (1.8) [1] | 1 (1.8) [1] |
| Abdominal pain upper | 0 | 1 (1.8) [1] |
| Diarrhoea | 0 | 1 (1.8) [1] |
| Vomiting | 1 (1.8) [1] | 0 |
| Serum parathyroid hormone increased | 2 (3.5) [2] | 7 (12.3) [7] |
| Urine calcium/creatinine ratio increased | 3 (5.3) [3] | 6 (10.5) [6] |
| Vitamin D deficiency | 7 (12.3) [7] | 2 (3.5) [2] |
| Vitamin B12 deficiency | 0 | 1 (1.8) [1] |
| Dysgeusia | 0 | 1 (1.8) [1] |
| Headache | 1 (1.8) [1] | 0 |
| Hunger | 1 (1.8) [1] | 0 |
Publisher’s Note: MDPI stays neutral with regard to jurisdictional claims in published maps and institutional affiliations. |
© 2021 by the authors. Licensee MDPI, Basel, Switzerland. This article is an open access article distributed under the terms and conditions of the Creative Commons Attribution (CC BY) license (http://creativecommons.org/licenses/by/4.0/).
Share and Cite
Umarji, P.B.; Verma, P.; Garg, V.; Schini, M.; Eastell, R. Randomised Controlled Trial of Nutritional Supplement on Bone Turnover Markers in Indian Premenopausal Women. Nutrients 2021, 13, 364. https://doi.org/10.3390/nu13020364
Umarji PB, Verma P, Garg V, Schini M, Eastell R. Randomised Controlled Trial of Nutritional Supplement on Bone Turnover Markers in Indian Premenopausal Women. Nutrients. 2021; 13(2):364. https://doi.org/10.3390/nu13020364
Chicago/Turabian StyleUmarji, Pramod B., Pankaj Verma, Vivek Garg, Marian Schini, and Richard Eastell. 2021. "Randomised Controlled Trial of Nutritional Supplement on Bone Turnover Markers in Indian Premenopausal Women" Nutrients 13, no. 2: 364. https://doi.org/10.3390/nu13020364
APA StyleUmarji, P. B., Verma, P., Garg, V., Schini, M., & Eastell, R. (2021). Randomised Controlled Trial of Nutritional Supplement on Bone Turnover Markers in Indian Premenopausal Women. Nutrients, 13(2), 364. https://doi.org/10.3390/nu13020364