Multidimensional Analysis of Food Consumption Reveals a Unique Dietary Profile Associated with Overweight and Obesity in Adolescents


Abstract
1. Introduction
2. Materials and Methods
2.1. Study Design and Participants
2.2. Dietary Evaluation
2.3. Assessment of Anthropometric Status
2.4. Statistical Analysis
2.5. Ethics Statement
3. Results
3.1. Characteristics of Participants
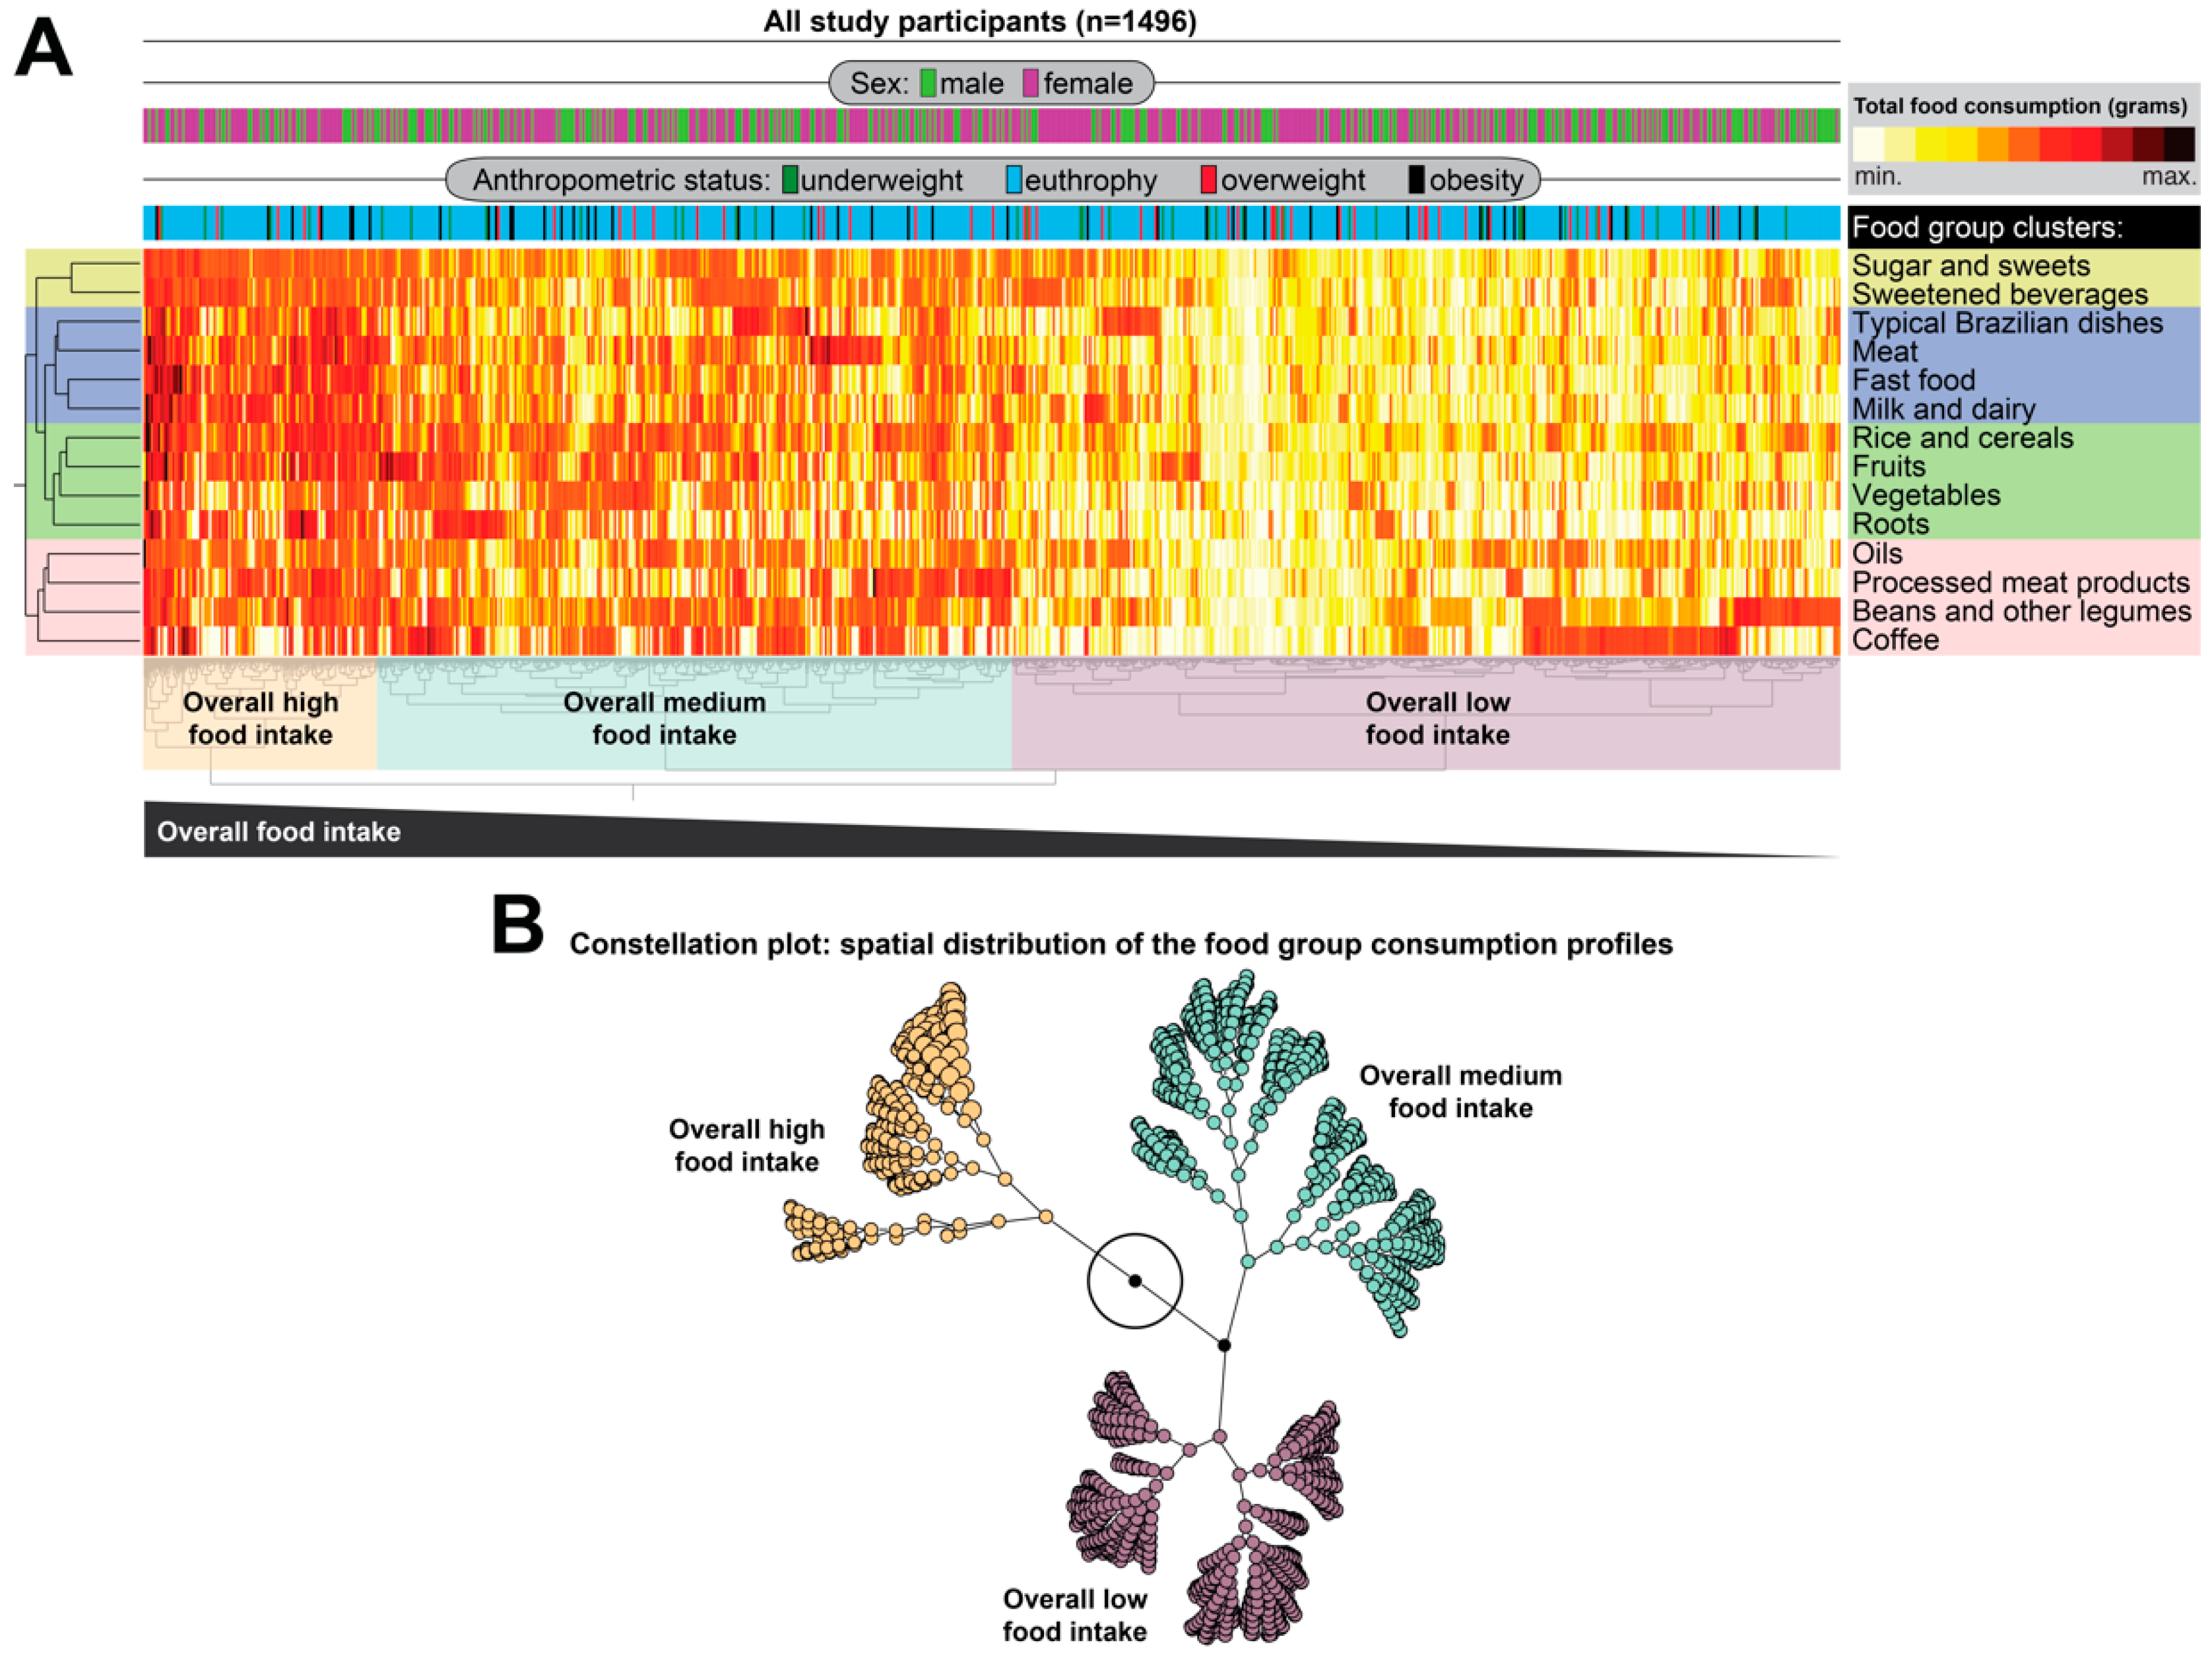
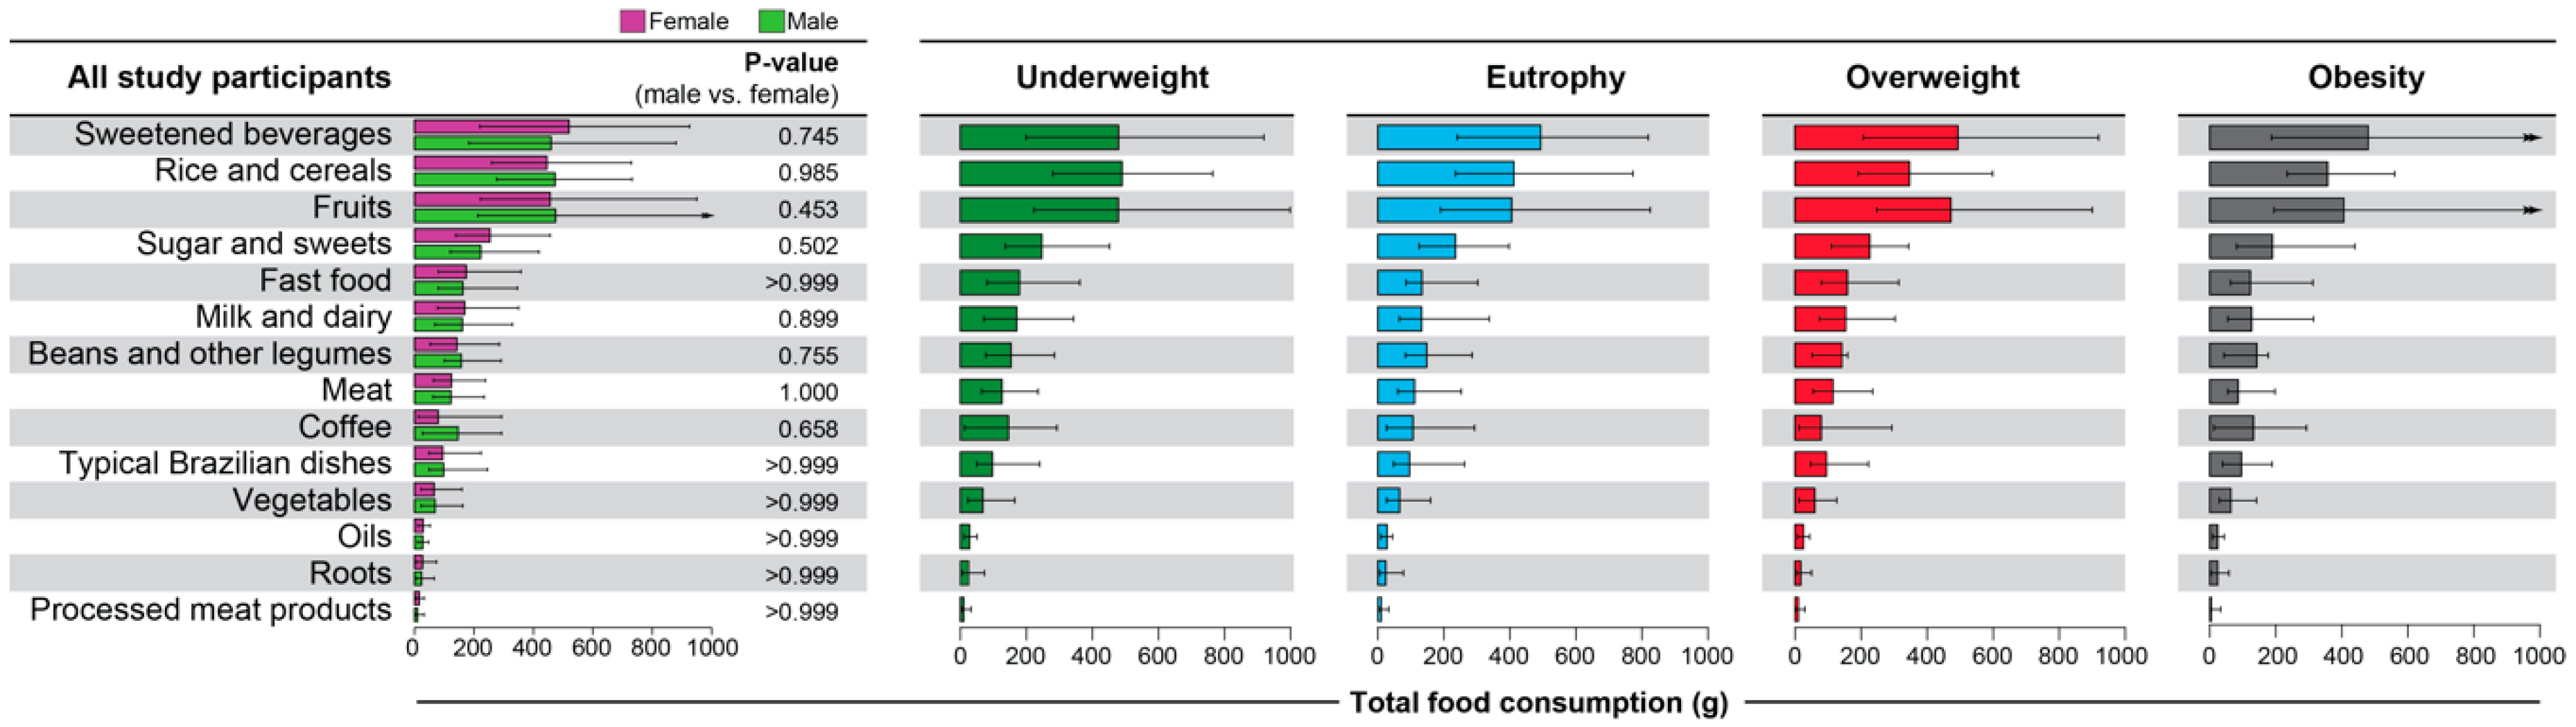
3.2. Evaluation of Food Consumption Profiles
3.3. Network Analyses of Food Consumption
4. Discussion
5. Conclusions
Author Contributions
Funding
Acknowledgments
Conflicts of Interest
References
- WHO. Health for the World’s Adolescents: A Second Chance in the Second Decade. Available online: http://apps.who.int/iris/bitstream/10665/112750/1/WHO_FWC_MCA_14.05_eng.pdf (accessed on 5 January 2019).
- Moreno, L.A.; Rodriguez, G.; Fleta, J.; Bueno-Lozano, M.; Lazaro, A.; Bueno, G. Trends of dietary habits in adolescents. Crit. Rev. Food Sci. Nutr. 2010, 50, 106–112. [Google Scholar] [CrossRef] [PubMed]
- Reedy, J.; Subar, A.F.; George, S.M.; Krebs-Smith, S.M. Extending Methods in Dietary Patterns Research. Nutrients 2018, 10, 571. [Google Scholar] [CrossRef] [PubMed]
- Newby, P.K.; Muller, D.; Hallfrisch, J.; Andres, R.; Tucker, K.L. Food patterns measured by factor analysis and anthropometric changes in adults. Am. J. Clin. Nutr. 2004, 80, 504–513. [Google Scholar] [CrossRef] [PubMed]
- Newby, P.K.; Tucker, K.L. Empirically derived eating patterns using factor or cluster analysis: A review. Nutr. Rev. 2004, 62, 177–203. [Google Scholar] [CrossRef] [PubMed]
- WHO. Preparation and Use of Food Based Dietary Guidelines; WHO: Geneva, Switzerland, 1998. [Google Scholar]
- WHO. Obesity. Available online: http://www.who.int/topics/obesity/en/ (accessed on 5 January 2019).
- Gonzalez-Muniesa, P.; Martinez-Gonzalez, M.A.; Hu, F.B.; Despres, J.P.; Matsuzawa, Y.; Loos, R.J.F.; Moreno, L.A.; Bray, G.A.; Martinez, J.A. Obesity. Nat. Rev. Dis. Primers. 2017, 3, 17034. [Google Scholar] [CrossRef] [PubMed]
- WHO. Obesity and Overweight. Available online: https://www.who.int/news-room/fact-sheets/detail/obesity-and-overweight (accessed on 5 January 2019).
- de Santana, M.L.P.; Assis, A.M.O.; Silva, R.D.C.R.; Raich, R.M.; Machado, M.E.P.D.C.; Pinto, E.D.J.; de Moraes, L.T.L.P.; Ribeiro, H.D.C. Risk Factors for Adopting Extreme Weight-Control Behaviors among Public School Adolescents in Salvador, Brazil: A Case-Control Study. J. Am. Coll. Nutr. 2016, 35, 113–117. [Google Scholar] [CrossRef] [PubMed]
- Tanner, J.M. Growth at Adolescence, 2nd ed.; Blackwell: Oxford, UK, 1962. [Google Scholar]
- WHO. Physical status: The use and interpretation of anthropometry. In Report of A WHO Expert Committee; WHO: Geneva, Switzerland, 1995. [Google Scholar]
- Mascarenhas, J.M.; Silva, R.D.; Machado, M.E.; Santos, C.A.; Marchioni, D.M.; Barreto, M.L. Validation of a food frequency questionnaire designed for adolescents in Salvador, Bahia, Brazil. Rev. Nutr. 2016, 29, 163–171. [Google Scholar] [CrossRef]
- WHO. Growth Reference Data for 5–19 Years, WHO Reference 2007. Available online: http://www.who.int/growthref/en (accessed on 5 January 2019).
- Jin, D.; Jin, S.; Yu, Y.; Lee, C.; Chen, J. Classification of Cannabis Cultivars Marketed in Canada for Medical Purposes by Quantification of Cannabinoids and Terpenes Using HPLC-DAD and GC-MS. J. Anal. Bioanal. Tech. 2017, 8. [Google Scholar] [CrossRef]
- Andrade, B.B.; Singh, A.; Narendran, G.; Schechter, M.E.; Nayak, K.; Subramanian, S.; Anbalagan, S.; Jensen, S.M.; Porter, B.O.; Antonelli, L.R.; et al. Mycobacterial antigen driven activation of CD14++CD16- monocytes is a predictor of tuberculosis-associated immune reconstitution inflammatory syndrome. PLoS Pathog. 2014, 10, e1004433. [Google Scholar] [CrossRef]
- Mendonca, V.R.; Queiroz, A.T.; Lopes, F.M.; Andrade, B.B.; Barral-Netto, M. Networking the host immune response in Plasmodium vivax malaria. Malar. J. 2013, 12, 69. [Google Scholar] [CrossRef]
- Sawyer, S.M.; Afifi, R.A.; Bearinger, L.H.; Blakemore, S.J.; Dick, B.; Ezeh, A.C.; Patton, G.C. Adolescence: A foundation for future health. Lancet 2012, 379, 1630–1640. [Google Scholar] [CrossRef]
- Siervogel, R.M.; Demerath, E.W.; Schubert, C.; Remsberg, K.E.; Chumlea, W.C.; Sun, S.; Czerwinski, S.A.; Towne, B. Puberty and body composition. Horm. Res. 2003, 60, 36–45. [Google Scholar] [CrossRef] [PubMed]
- Rogol, A.D.; Roemmich, J.N.; Clark, P.A. Growth at puberty. J. Adolesc. Health 2002, 31, 192–200. [Google Scholar] [CrossRef]
- Kuczmarski, R.J.; Ogden, C.L.; Guo, S.S.; Grummer-Strawn, L.M.; Flegal, K.M.; Mei, Z.; Wei, R.; Curtin, L.R.; Roche, A.F.; Johnson, C.L. 2000 CDC Growth Charts for the United States: Methods and development. Vital Health Stat. 11 2002, 246, 1–190. [Google Scholar]
- Bauer, K.W.; Larson, N.I.; Nelson, M.C.; Story, M.; Neumark-Sztainer, D. Socio-environmental, personal and behavioural predictors of fast-food intake among adolescents. Public Health Nutr. 2009, 12, 1767–1774. [Google Scholar] [CrossRef] [PubMed]
- Araujo, J.; Teixeira, J.; Gaio, A.R.; Lopes, C.; Ramos, E. Dietary patterns among 13-y-old Portuguese adolescents. Nutrition 2015, 31, 148–154. [Google Scholar] [CrossRef] [PubMed]
- Devlin, U.M.; McNulty, B.A.; Nugent, A.P.; Gibney, M.J. The use of cluster analysis to derive dietary patterns: Methodological considerations, reproducibility, validity and the effect of energy mis-reporting. Proc. Nutr. Soc. 2012, 71, 599–609. [Google Scholar] [CrossRef] [PubMed]
- Hearty, A.P.; Gibney, M.J. Dietary patterns in Irish adolescents: A comparison of cluster and principal component analyses. Public Health Nutr. 2013, 16, 848–857. [Google Scholar] [CrossRef]
- Grieger, J.A.; Scott, J.; Cobiac, L. Cluster analysis and food group consumption in a national sample of Australian girls. J. Hum. Nutr. Diet. 2012, 25, 75–86. [Google Scholar] [CrossRef]
- Ritchie, L.D.; Spector, P.; Stevens, M.J.; Schmidt, M.M.; Schreiber, G.B.; Striegel-Moore, R.H.; Wang, M.C.; Crawford, P.B. Dietary patterns in adolescence are related to adiposity in young adulthood in black and white females. J. Nutr. 2007, 137, 399–406. [Google Scholar] [CrossRef]
- Perez-Rodrigo, C.; Gil, A.; Gonzalez-Gross, M.; Ortega, R.M.; Serra-Majem, L.; Varela-Moreiras, G.; Aranceta-Bartrina, J. Clustering of Dietary Patterns, Lifestyles, and Overweight among Spanish Children and Adolescents in the ANIBES Study. Nutrients 2015, 8, 11. [Google Scholar] [CrossRef]
- Cutler, G.J.; Flood, A.; Hannan, P.J.; Slavin, J.L.; Neumark-Sztainer, D. Association between major patterns of dietary intake and weight status in adolescents. Br. J. Nutr. 2012, 108, 349–356. [Google Scholar] [CrossRef]
- Cutler, G.J.; Flood, A.; Hannan, P.; Neumark-Sztainer, D. Multiple sociodemographic and socioenvironmental characteristics are correlated with major patterns of dietary intake in adolescents. J. Am. Diet. Assoc. 2011, 111, 230–240. [Google Scholar] [CrossRef]
- Kourlaba, G.; Panagiotakos, D.B.; Mihas, K.; Alevizos, A.; Marayiannis, K.; Mariolis, A.; Tountas, Y. Dietary patterns in relation to socio-economic and lifestyle characteristics among Greek adolescents: A multivariate analysis. Public Health Nutr. 2009, 12, 1366–1372. [Google Scholar] [CrossRef]
- Richter, A.; Heidemann, C.; Schulze, M.B.; Roosen, J.; Thiele, S.; Mensink, G.B. Dietary patterns of adolescents in Germany--associations with nutrient intake and other health related lifestyle characteristics. BMC Pediatrics 2012, 12, 35. [Google Scholar] [CrossRef]
- Iqbal, K.; Buijsse, B.; Wirth, J.; Schulze, M.B.; Floegel, A.; Boeing, H. Gaussian Graphical Models Identify Networks of Dietary Intake in a German Adult Population. J. Nutr. 2016, 146, 646–652. [Google Scholar] [CrossRef]
- Hoffmann, K.; Zyriax, B.C.; Boeing, H.; Windler, E. A dietary pattern derived to explain biomarker variation is strongly associated with the risk of coronary artery disease. Am. J. Clin. Nutr. 2004, 80, 633–640. [Google Scholar] [CrossRef]
- Tucker, K.L. Dietary patterns, approaches, and multicultural perspective. Appl. Physiol. Nutr. Metab. 2010, 35, 211–218. [Google Scholar] [CrossRef]
- Villegas, R.; Salim, A.; Collins, M.M.; Flynn, A.; Perry, I.J. Dietary patterns in middle-aged Irish men and women defined by cluster analysis. Public Health Nutr. 2004, 7, 1017–1024. [Google Scholar] [CrossRef]
- Schwedhelm, C.; Iqbal, K.; Knuppel, S.; Schwingshackl, L.; Boeing, H. Contribution to the understanding of how principal component analysis-derived dietary patterns emerge from habitual data on food consumption. Am. J. Clin. Nutr. 2018, 107, 227–235. [Google Scholar] [CrossRef]
- Prada-Medina, C.A.; Fukutani, K.F.; Pavan Kumar, N.; Gil-Santana, L.; Babu, S.; Lichtenstein, F.; West, K.; Sivakumar, S.; Menon, P.A.; Viswanathan, V.; et al. Systems Immunology of Diabetes-Tuberculosis Comorbidity Reveals Signatures of Disease Complications. Sci. Rep. 2017, 7, 1999. [Google Scholar] [CrossRef]


| Food or Food Groups | Food Items from the Food Frequency Questionnaire |
|---|---|
| 1. Sugar and sweets | Sugar, chocolate powder, homemade sweets, industrialized sweets, stuffed biscuit, candies, chewing gum, lollipops, chocolate bar, gelatin, ice cream and popsicle (cream and/or chocolate). |
| 2. Sweetened beverages | Normal, diet or light soda, artificial juice, carbonated drinks, artificial refreshment, energy drink and liquid or powdered sweetener. |
| 3. Typical Brazilian dishes | Acarajé and abará a, vatapá b, caruru c, feijoada d, dobradinha e, feijão tropeiro f and coconut milk. |
| 4. Fast food | Fried potatoes, potato chips, pizza, lasagna, ketchup, ready-made soups, sandwich, industrialized salty snack, instant noodles, ready-to-eat sauce and pizza-ready sauce. |
| 5. Oils | Butter, margarine, vegetable oil, mayonnaise, olive oil, palm oil. |
| 6. Milk and dairy | Whole milk powder or liquid, skimmed milk powder or liquid, fermented milk, yogurt (whole, diet or light), chocolate ready, yellow cheese, white cheese, cream cheese, creamy curd (whole or light). |
| 7. Meat | Bovine (fried or cooked), chicken with or without skin (fried or cooked), cooked or fried fish, seafood, viscera, chicken egg (fried or cooked), dehydrated meat (Jerky beef). |
| 8. Processed meat products | Ham, mortadella, sausage, calabrese. |
| 9. Rice and cereals | Bread (white or whole), rice (white or whole), noodles (white or whole), cassava flour, farinaceous (oats, wheat germ), milk or nest meal, green corn or couscous of corn, popcorn salted), homemade cake, box cake, granola, biscuit (salted or sweet), pasta soup. |
| 10. Roots | Cassava, sweet potato, potato. |
| 11. Beans and legumes | Beans, peanuts, nuts and walnuts. |
| 12. Vegetables | Lettuce, cabbage, cabbage, pumpkin, carrot, tomato, chayote, gherkin, beet, okra, vegetable salad. |
| 13. Fruits | Pineapple, avocado, acerola, silver banana, ground banana, cashew, jackfruit, papaya, mango, apple, watermelon, melon, orange, tangerine, strawberry, fruit juice or fruit pulp, acai-berry. |
| 14. Coffee | Coffee and tea. |
| Characteristic | Total (1496) n (%) | Male (642) n (%) | Female (854) n (%) | p-Value |
|---|---|---|---|---|
| Age–years (median and IQR) * | 14.3 (13.2–15.5) | 15.6 (13.4–15.8) | 14.2 (13.2–15.2) | <0.001 |
| Socioeconomic status | 0.634 | |||
| Good economic condition | 727 | 319 (51.5) | 408 (49.2) | |
| Poor economic condition | 721 | 300 (48.5) | 421 (50.8) | |
| BMI–Kg/m2(median and IQR) * | 18.9 (17.2–21.0) | 18.7 (16.9–20.7) | 19.1 (17.4–21.2) | 0.006 |
| Anthropometric status | 0.005 | |||
| Underweight | 120 | 67 (10.4) | 53 (6.2) | |
| Eutrophy | 1155 | 471 (73.4) | 684 (80.1) | |
| Overweight | 132 | 59 (9.2) | 73 (8.6) | |
| Obesity | 89 | 45 (7.0) | 44 (5.1) | |
| Pubertal development | <0.001 | |||
| Pre-pubertal | 126 | 122 (19.0) | 4 (0.5) | |
| Pubertal | 325 | 162 (25.2) | 163 (19.1) | |
| Post-pubertal | 1040 | 354 (55.1) | 686 (80.3) |
| Parameter | Total * | Underweight | Eutrophy | Overweight | Obesity | Adjusted p-Value ** |
|---|---|---|---|---|---|---|
| n = 1491 | n = 119 | n = 1151 | n = 132 | n = 89 | ||
| Age (years) | 14.3 (13.2–15.5) | 14.3 (13.4–15.2) | 14.4 (13.3–15.5) | 14.0 (12.8–15.4) | 14.0 (13.2–14.9) | 0.31 |
| Sex | ||||||
| Female | 851 (57.1) | 52 (43.7) | 682 (59.3) | 73 (55.3) | 44 (49.4) | 1.00 |
| Male | 640 (42.9) | 67 (56.3) | 469 (40.7) | 59 (44.7) | 45 (50.6) | |
| Socioeconomic status | 1.66 | |||||
| Good economic condition | 724 (50.2) | 54 (47) | 549 (49.3) | 67 (51.9) | 54 (62.8) | |
| Poor economic condition | 719 (49.8) | 61 (53) | 564 (50.7) | 62 (48.1) | 32 (37.2) | |
| Pubertal development | <0.01 | |||||
| Pre-pubertal | 125 (8.4) | 21 (17.6) | 86 (7.5) | 10 (7.6) | 8 (9) | |
| Pubertal | 325 (21.9) | 47 (39.5) | 237 (20.7) | 25 (19.1) | 16 (18) | |
| Post-pubertal | 1036 (69.7) | 51 (42.9) | 824 (71.8) | 96 (73.3) | 65 (73) | |
| Food or food group consumption (grams) | ||||||
| Sugar and sweets | 243.3 (130.2–436.1) | 235.2 (125.5–398.4) | 247.9 (136.9–452.9) | 227.2 (110.5–341.7) | 190.5 (81.7–432.3) | 0.31 |
| Sweetened beverages | 480.4 (200.0–915.3) | 493.3 (240–820) | 480.4 (200–920) | 493.3 (213.3–920.1) | 480 (187.3–973.4) | 1.00 |
| Typical Brazilian dishes | 97.3 (49.3–239.8) | 95.9 (48–262.6) | 98.6 (50.6–240.9) | 95.9 (49.3–223.8) | 95.9 (39.6–189.4) | 1.00 |
| Fast food | 170.4 (80.3–352.7) | 134.3 (86–303.3) | 180 (81.6–363.5) | 158.8 (80.2–310.3) | 123.3 (66–307.3) | 0.42 |
| Oils | 29.3 (11.5–51.1) | 28.7 (9.3–44.5) | 29.7 (12.3–51.9) | 26.6 (9.2–44.7) | 24.7 (9.3–44) | 0.73 |
| Milk and dairy | 166.4 (70.9–337.6) | 132.8 (65.6–338.4) | 171.9 (72.2–344.3) | 154.3 (74.2–296.4) | 126.9 (57–304.4) | 0.99 |
| Meat | 122.7 (64.0–236.7) | 112 (60–253.3) | 127.3 (65.3–236.7) | 115.3 (56–234) | 86.7 (54.7–192) | 0.98 |
| Processed meat products | 11.0 (5.5–33.0) | 11 (5.5–33) | 11 (5.5–33) | 11 (2.7–30.2) | 5.5 (2.7–33) | 0.31 |
| Rice and cereals | 460.7 (261.8–730.6) | 412.7 (235.2–772.8) | 490.6 (280.9–765.4) | 437.4 (193.2–598.8) | 487.4 (244.4–531.6) | 0.08 |
| Roots | 24.7 (6.8–71.8) | 24.5 (6.8–77.9) | 27 (6.8–74.4) | 17.7 (6.8–49.1) | 24.5 (6.8–56.4) | 1.00 |
| Beans and legumes | 148.8 (78.0–286.0) | 148.8 (83.8–286) | 154.6 (78–286) | 153 (52–158.9) | 143 (47.8–177.8) | 0.09 |
| Vegetables | 67.3 (23.1–161.2) | 66.1 (26.6–159.7) | 69.2 (23.2–165.5) | 60.8 (11.6–127.3) | 64.2 (29.6–137.5) | 0.98 |
| Fruits | 465.7 (218.3–988.4) | 405.3 (189.9–825.6) | 479.1 (224.3–999.8) | 472.3 (248.2–894.8) | 407 (195.6–1111) | 1.00 |
| Coffee | 106.7 (13.3–293.3) | 106.7 (26.7–293.3) | 146.7 (13.3–293.3) | 80 (13.3–293.3) | 133.3 (13.3–293.3) | 1.00 |
| Food Group | All Individuals | Underweight | Eutrophy | Overweight | Obesity | |||||
|---|---|---|---|---|---|---|---|---|---|---|
| rho Value | p Value | rho Value | p Value | rho Value | p Value | rho Value | p Value | rho Value | p Value | |
| Sugar and sweets | −0.03 | 0.25 | 0.02 | 0.81 | 0.02 | 0.52 | 0.00 | 1.00 | 0.12 | 0.28 |
| Sweetened beverages | 0.03 | 0.28 | 0.06 | 0.48 | 0.03 | 0.29 | −0.08 | 0.37 | 0.02 | 0.88 |
| Typical Brazilian dishes | 0.01 | 0.65 | 0.03 | 0.75 | 0.03 | 0.34 | −0.03 | 0.72 | 0.11 | 0.31 |
| Fast food | 0.01 | 0.84 | 0.00 | 0.99 | 0.01 | 0.79 | 0.01 | 0.91 | 0.11 | 0.30 |
| Oils | 0.05 | 0.09 | −0.02 | 0.82 | −0.06 | 0.06 | 0.02 | 0.84 | 0.01 | 0.89 |
| Milk and dairy | −0.03 | 0.31 | 0.01 | 0.88 | −0.03 | 0.38 | −0.05 | 0.57 | 0.01 | 0.94 |
| Meat | −0.01 | 0.84 | −0.04 | 0.69 | −0.01 | 0.78 | 0.07 | 0.41 | 0.02 | 0.89 |
| Processed meat products | 0.07 | 0.08 | 0.00 | 0.97 | 0.07 | 0.06 | −0.01 | 0.92 | 0.16 | 0.14 |
| Rice and cereals | 0.08 | 0.05 | 0.06 | 0.52 | −0.05 | 0.12 | −0.09 | 0.31 | 0.07 | 0.50 |
| Roots | 0.02 | 0.41 | 0.11 | 0.22 | −0.01 | 0.62 | −0.07 | 0.41 | 0.14 | 0.19 |
| Beans and legumes | −0.02 | 0.49 | 0.10 | 0.27 | 0.00 | 0.88 | 0.03 | 0.72 | 0.14 | 0.20 |
| Vegetables | −0.04 | 0.13 | 0.03 | 0.73 | −0.05 | 0.08 | −0.04 | 0.67 | 0.10 | 0.38 |
| Fruits | 0.01 | 0.70 | 0.06 | 0.49 | 0.02 | 0.55 | −0.12 | 0.19 | 0.00 | 0.97 |
| Coffee | −0.04 | 0.17 | −0.07 | 0.43 | −0.03 | 0.39 | −0.08 | 0.38 | 0.06 | 0.57 |
© 2019 by the authors. Licensee MDPI, Basel, Switzerland. This article is an open access article distributed under the terms and conditions of the Creative Commons Attribution (CC BY) license (http://creativecommons.org/licenses/by/4.0/).
Share and Cite
Andrade, V.M.B.; de Santana, M.L.P.; Fukutani, K.F.; Queiroz, A.T.L.; Arriaga, M.B.; Conceição-Machado, M.E.P.; Silva, R.d.C.R.; Andrade, B.B. Multidimensional Analysis of Food Consumption Reveals a Unique Dietary Profile Associated with Overweight and Obesity in Adolescents. Nutrients 2019, 11, 1946. https://doi.org/10.3390/nu11081946
Andrade VMB, de Santana MLP, Fukutani KF, Queiroz ATL, Arriaga MB, Conceição-Machado MEP, Silva RdCR, Andrade BB. Multidimensional Analysis of Food Consumption Reveals a Unique Dietary Profile Associated with Overweight and Obesity in Adolescents. Nutrients. 2019; 11(8):1946. https://doi.org/10.3390/nu11081946
Chicago/Turabian StyleAndrade, Vanessa M.B., Mônica L.P. de Santana, Kiyoshi F. Fukutani, Artur T.L. Queiroz, Maria B. Arriaga, Maria Ester P. Conceição-Machado, Rita de Cássia R. Silva, and Bruno B. Andrade. 2019. "Multidimensional Analysis of Food Consumption Reveals a Unique Dietary Profile Associated with Overweight and Obesity in Adolescents" Nutrients 11, no. 8: 1946. https://doi.org/10.3390/nu11081946
APA StyleAndrade, V. M. B., de Santana, M. L. P., Fukutani, K. F., Queiroz, A. T. L., Arriaga, M. B., Conceição-Machado, M. E. P., Silva, R. d. C. R., & Andrade, B. B. (2019). Multidimensional Analysis of Food Consumption Reveals a Unique Dietary Profile Associated with Overweight and Obesity in Adolescents. Nutrients, 11(8), 1946. https://doi.org/10.3390/nu11081946