The authors wish to make the following corrections to their paper [1]. Due to miscalculating, please replace:

with
Table 4.
Results of regression models at different single-cropped rice (SCR) growth stages.
| Growth Stages | LAI | AGB | ||||||
|---|---|---|---|---|---|---|---|---|
| VI | Model | RRMSECV | VI | Model | RRMSECV | |||
| All stages | EVI2 | E | 0.358 | 10.210 | cu EVI2 | Q | 0.923 | 59.912 |
| B | 0.362 | 10.193 | B | 0.918 | 60.586 | |||
| S | 0.444 | 9.968 | S | 0.921 | 107.08 | |||
| NDVI | E | 0.275 | 10.798 | cu NDVI | Q | 0.929 | 57.856 | |
| B | 0.334 | 10.460 | B | 0.922 | 58.984 | |||
| S | 0.467 | 10.185 | S | 0.927 | 105.371 | |||
| Before heading | EVI2 | E | 0.831 | 6.074 | cu EVI2 | Q | 0.909 | 54.037 |
| B | 0.926 | 6.152 | B | 0.901 | 57.484 | |||
| S | 0.900 | 6.776 | S | 0.884 | 96.317 | |||
| NDVI | P | 0.644 | 8.960 | cu NDVI | Q | 0.922 | 50.150 | |
| B | 0.615 | 9.023 | B | 0.902 | 53.759 | |||
| S | 0.629 | 10.363 | S | 0.920 | 86.899 | |||
| After heading | EVI2 | E | 0.421 | 8.036 | cu EVI2 | Q | 0.481 | 61.331 |
| B | 0.474 | 8.019 | B | 0.474 | 65.122 | |||
| S | 0.416 | 8.205 | S | 0.571 | 60.499 | |||
| NDVI | E | 0.496 | 7.607 | cu NDVI | Q | 0.516 | 59.562 | |
| B | 0.610 | 8.630 | B | 0.426 | 53.759 | |||
| S | 0.657 | 7.076 | S | 0.573 | 59.378 | |||
E, P, and Q denote exponential, power, and quadratic polynomial fit of the traditional regression methods, respectively; B, S denote BPNN and SVM regression methods, respectively.
Table 4.
Results of regression models at different single-cropped rice (SCR) growth stages.
| Growth Stages | LAI | AGB | ||||||
|---|---|---|---|---|---|---|---|---|
| VI | Model | RRMSECV | VI | Model | RRMSECV | |||
| All stages | EVI2 | E | 0.358 | 10.210 | cu EVI2 | Q | 0.923 | 18.247 |
| B | 0.362 | 10.193 | B | 0.918 | 18.452 | |||
| S | 0.444 | 9.968 | S | 0.921 | 32.613 | |||
| NDVI | E | 0.275 | 10.798 | cu NDVI | Q | 0.929 | 17.621 | |
| B | 0.334 | 10.460 | B | 0.922 | 17.964 | |||
| S | 0.467 | 10.185 | S | 0.927 | 32.092 | |||
| Before heading | EVI2 | E | 0.831 | 6.074 | cu EVI2 | Q | 0.909 | 25.317 |
| B | 0.926 | 6.152 | B | 0.901 | 26.932 | |||
| S | 0.900 | 6.776 | S | 0.884 | 45.126 | |||
| NDVI | P | 0.644 | 8.960 | cu NDVI | Q | 0.922 | 23.496 | |
| B | 0.615 | 9.023 | B | 0.902 | 25.187 | |||
| S | 0.629 | 10.363 | S | 0.920 | 40.714 | |||
| After heading | EVI2 | E | 0.421 | 8.036 | cu EVI2 | Q | 0.481 | 15.067 |
| B | 0.474 | 8.019 | B | 0.474 | 15.998 | |||
| S | 0.416 | 8.205 | S | 0.571 | 14.862 | |||
| NDVI | E | 0.496 | 7.607 | cu NDVI | Q | 0.516 | 14.632 | |
| B | 0.610 | 8.630 | B | 0.426 | 13.207 | |||
| S | 0.657 | 7.076 | S | 0.573 | 14.587 | |||
E, P, and Q denote exponential, power, and quadratic polynomial fit of the traditional regression methods, respectively; B, S denote BPNN and SVM regression methods, respectively.
Please also replace:
 with
with
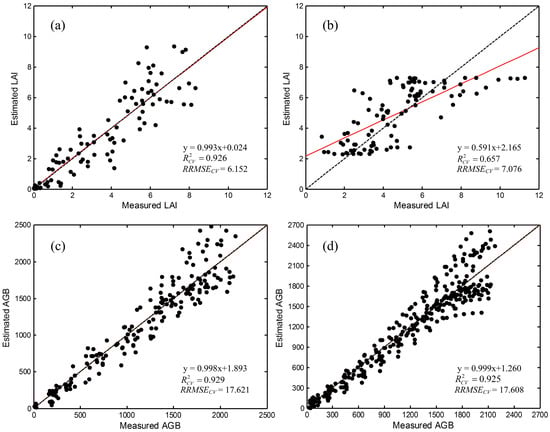
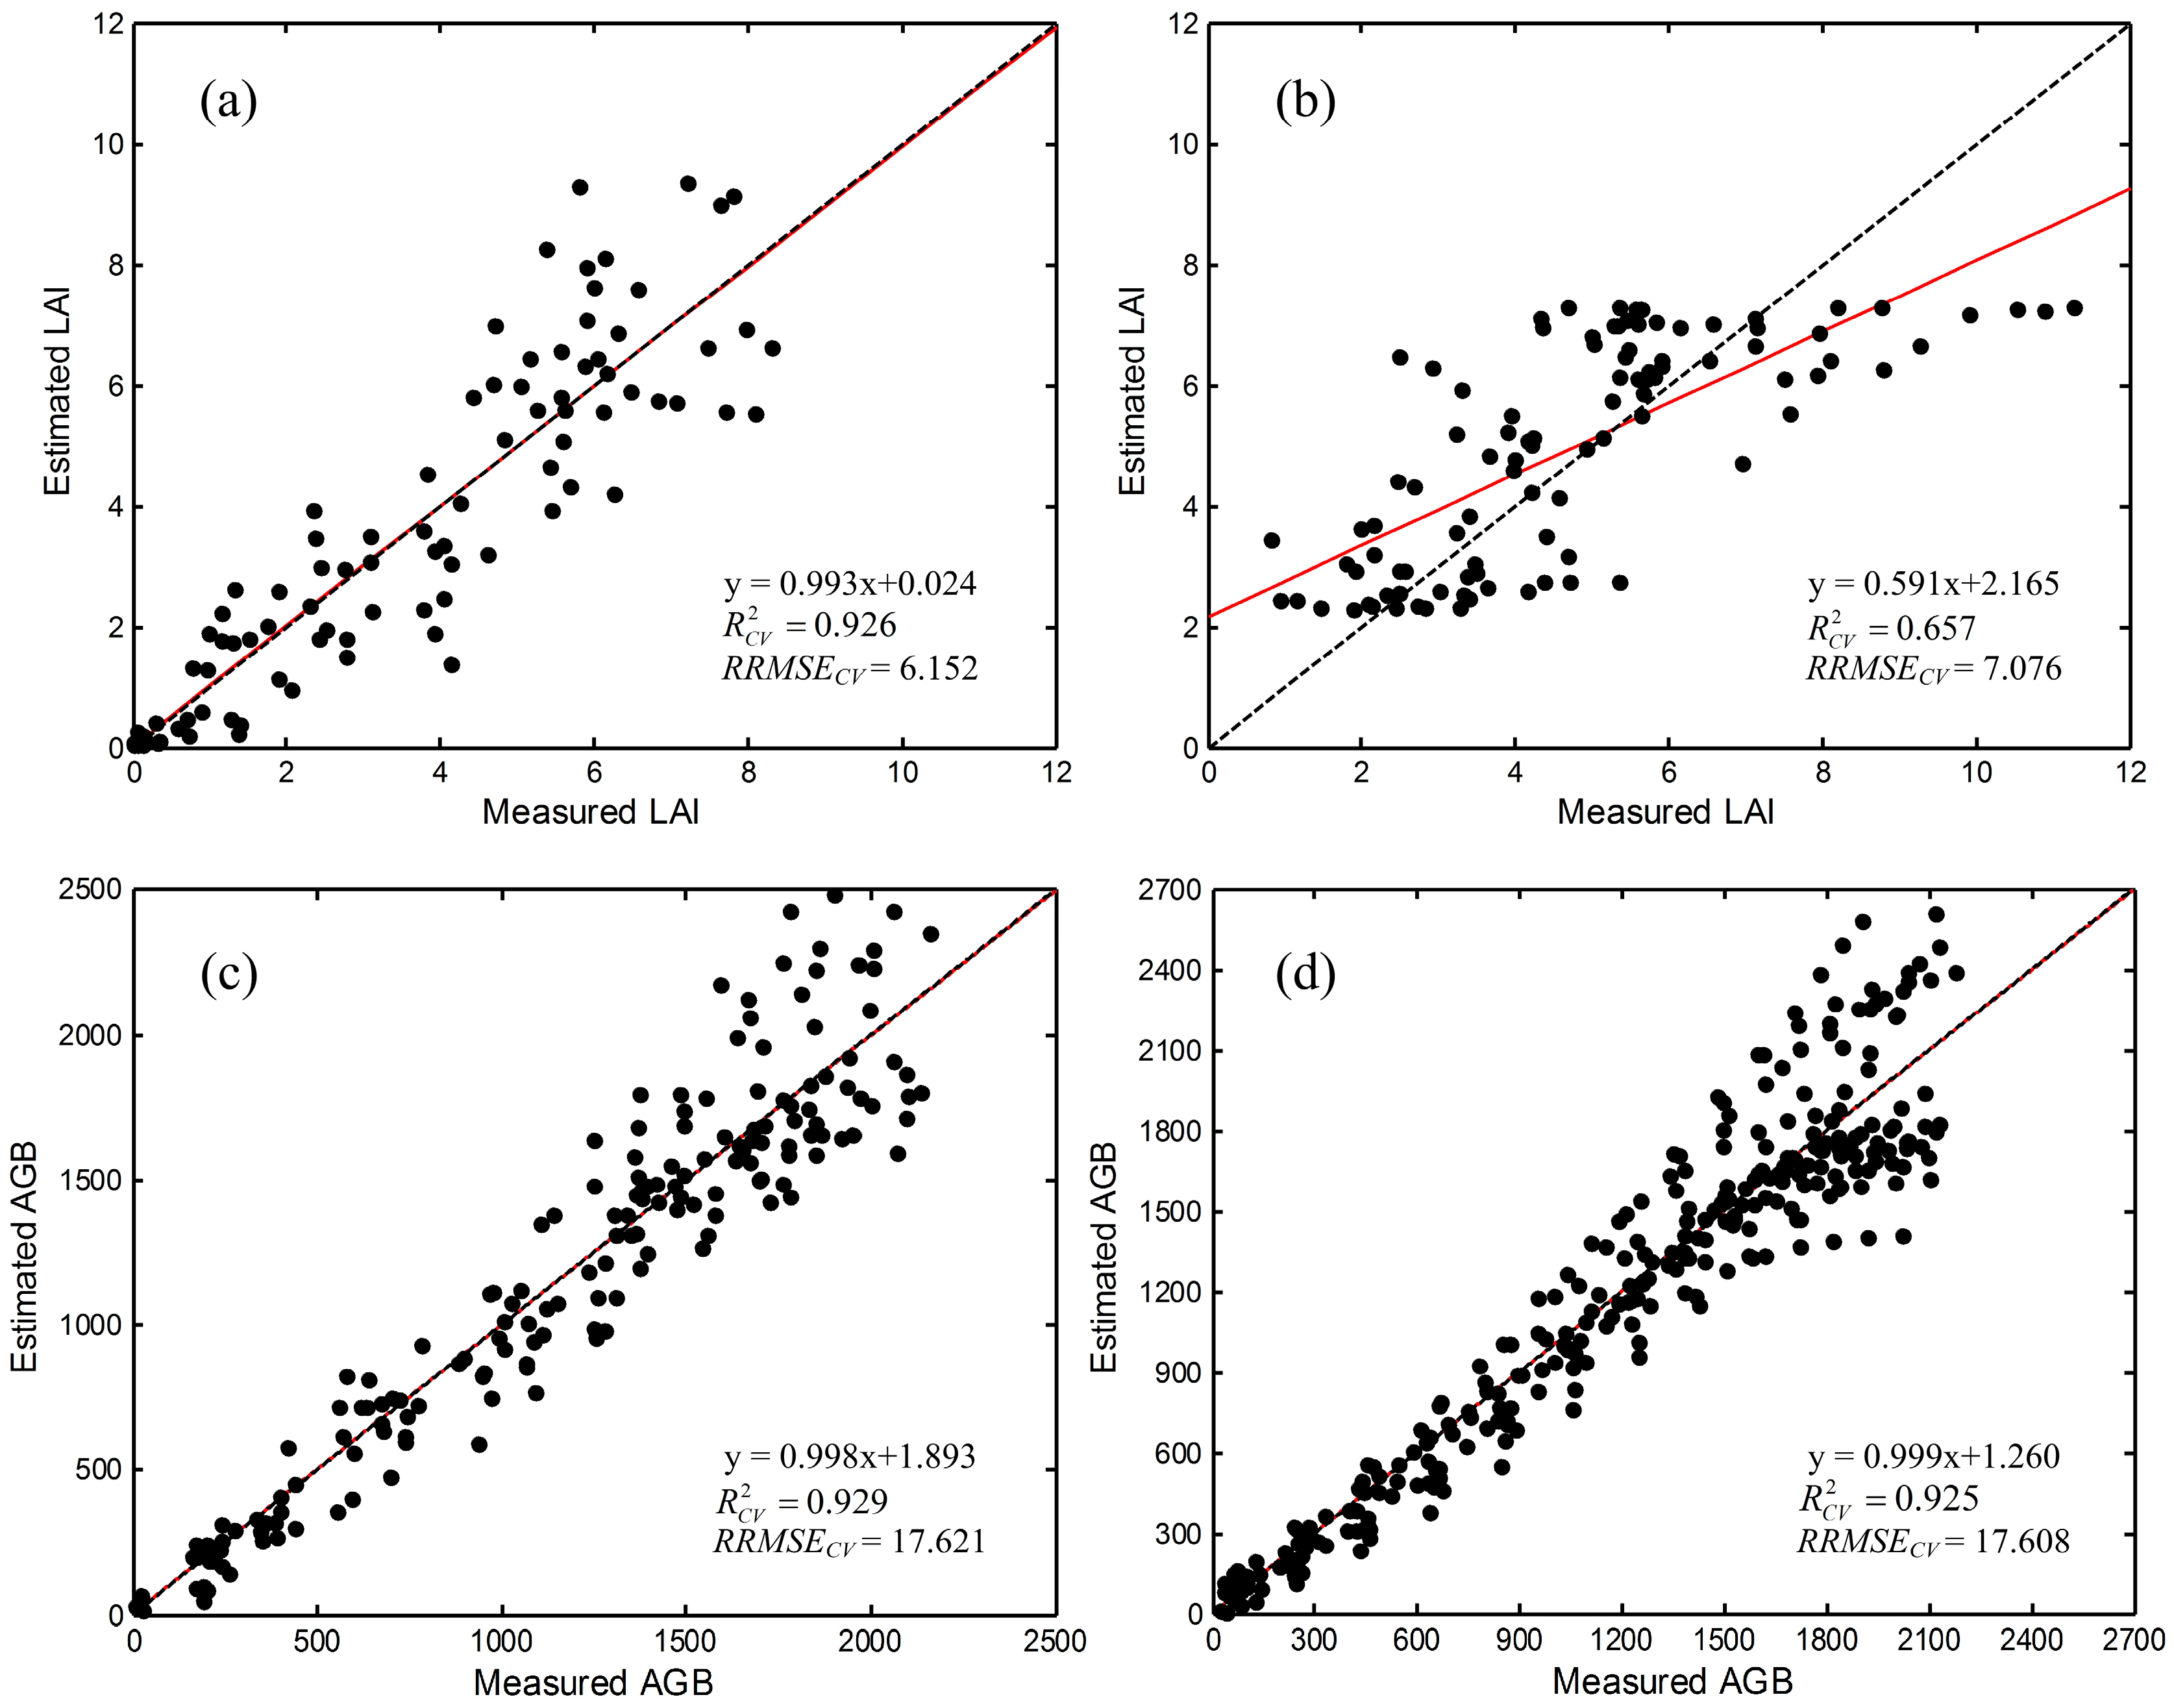
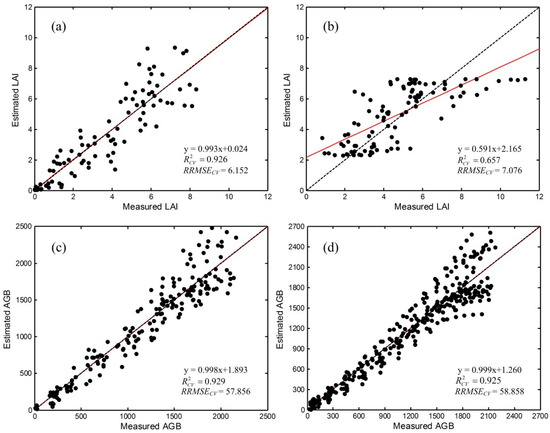
Figure 4.
Relationships between measured rice leaf area index (m2/m2) and dry aboveground biomass (g/m2) at different rice growth stages with VIs. (a) Before heading LAI estimation using EVI2-BPNN regression; (b) after heading LAI estimation using NDVI-SVM regression; (c) all-growth stage AGB estimation using daily cumulative NDVI and based on the quadratic polynomial fit function; (d) all-growth stage AGB estimation using 10-day composite data and based on the cumulative NDVI quadratic polynomial fit function. The black dash lines are the 45° lines, and the red solid lines are the linear regression trend lines.
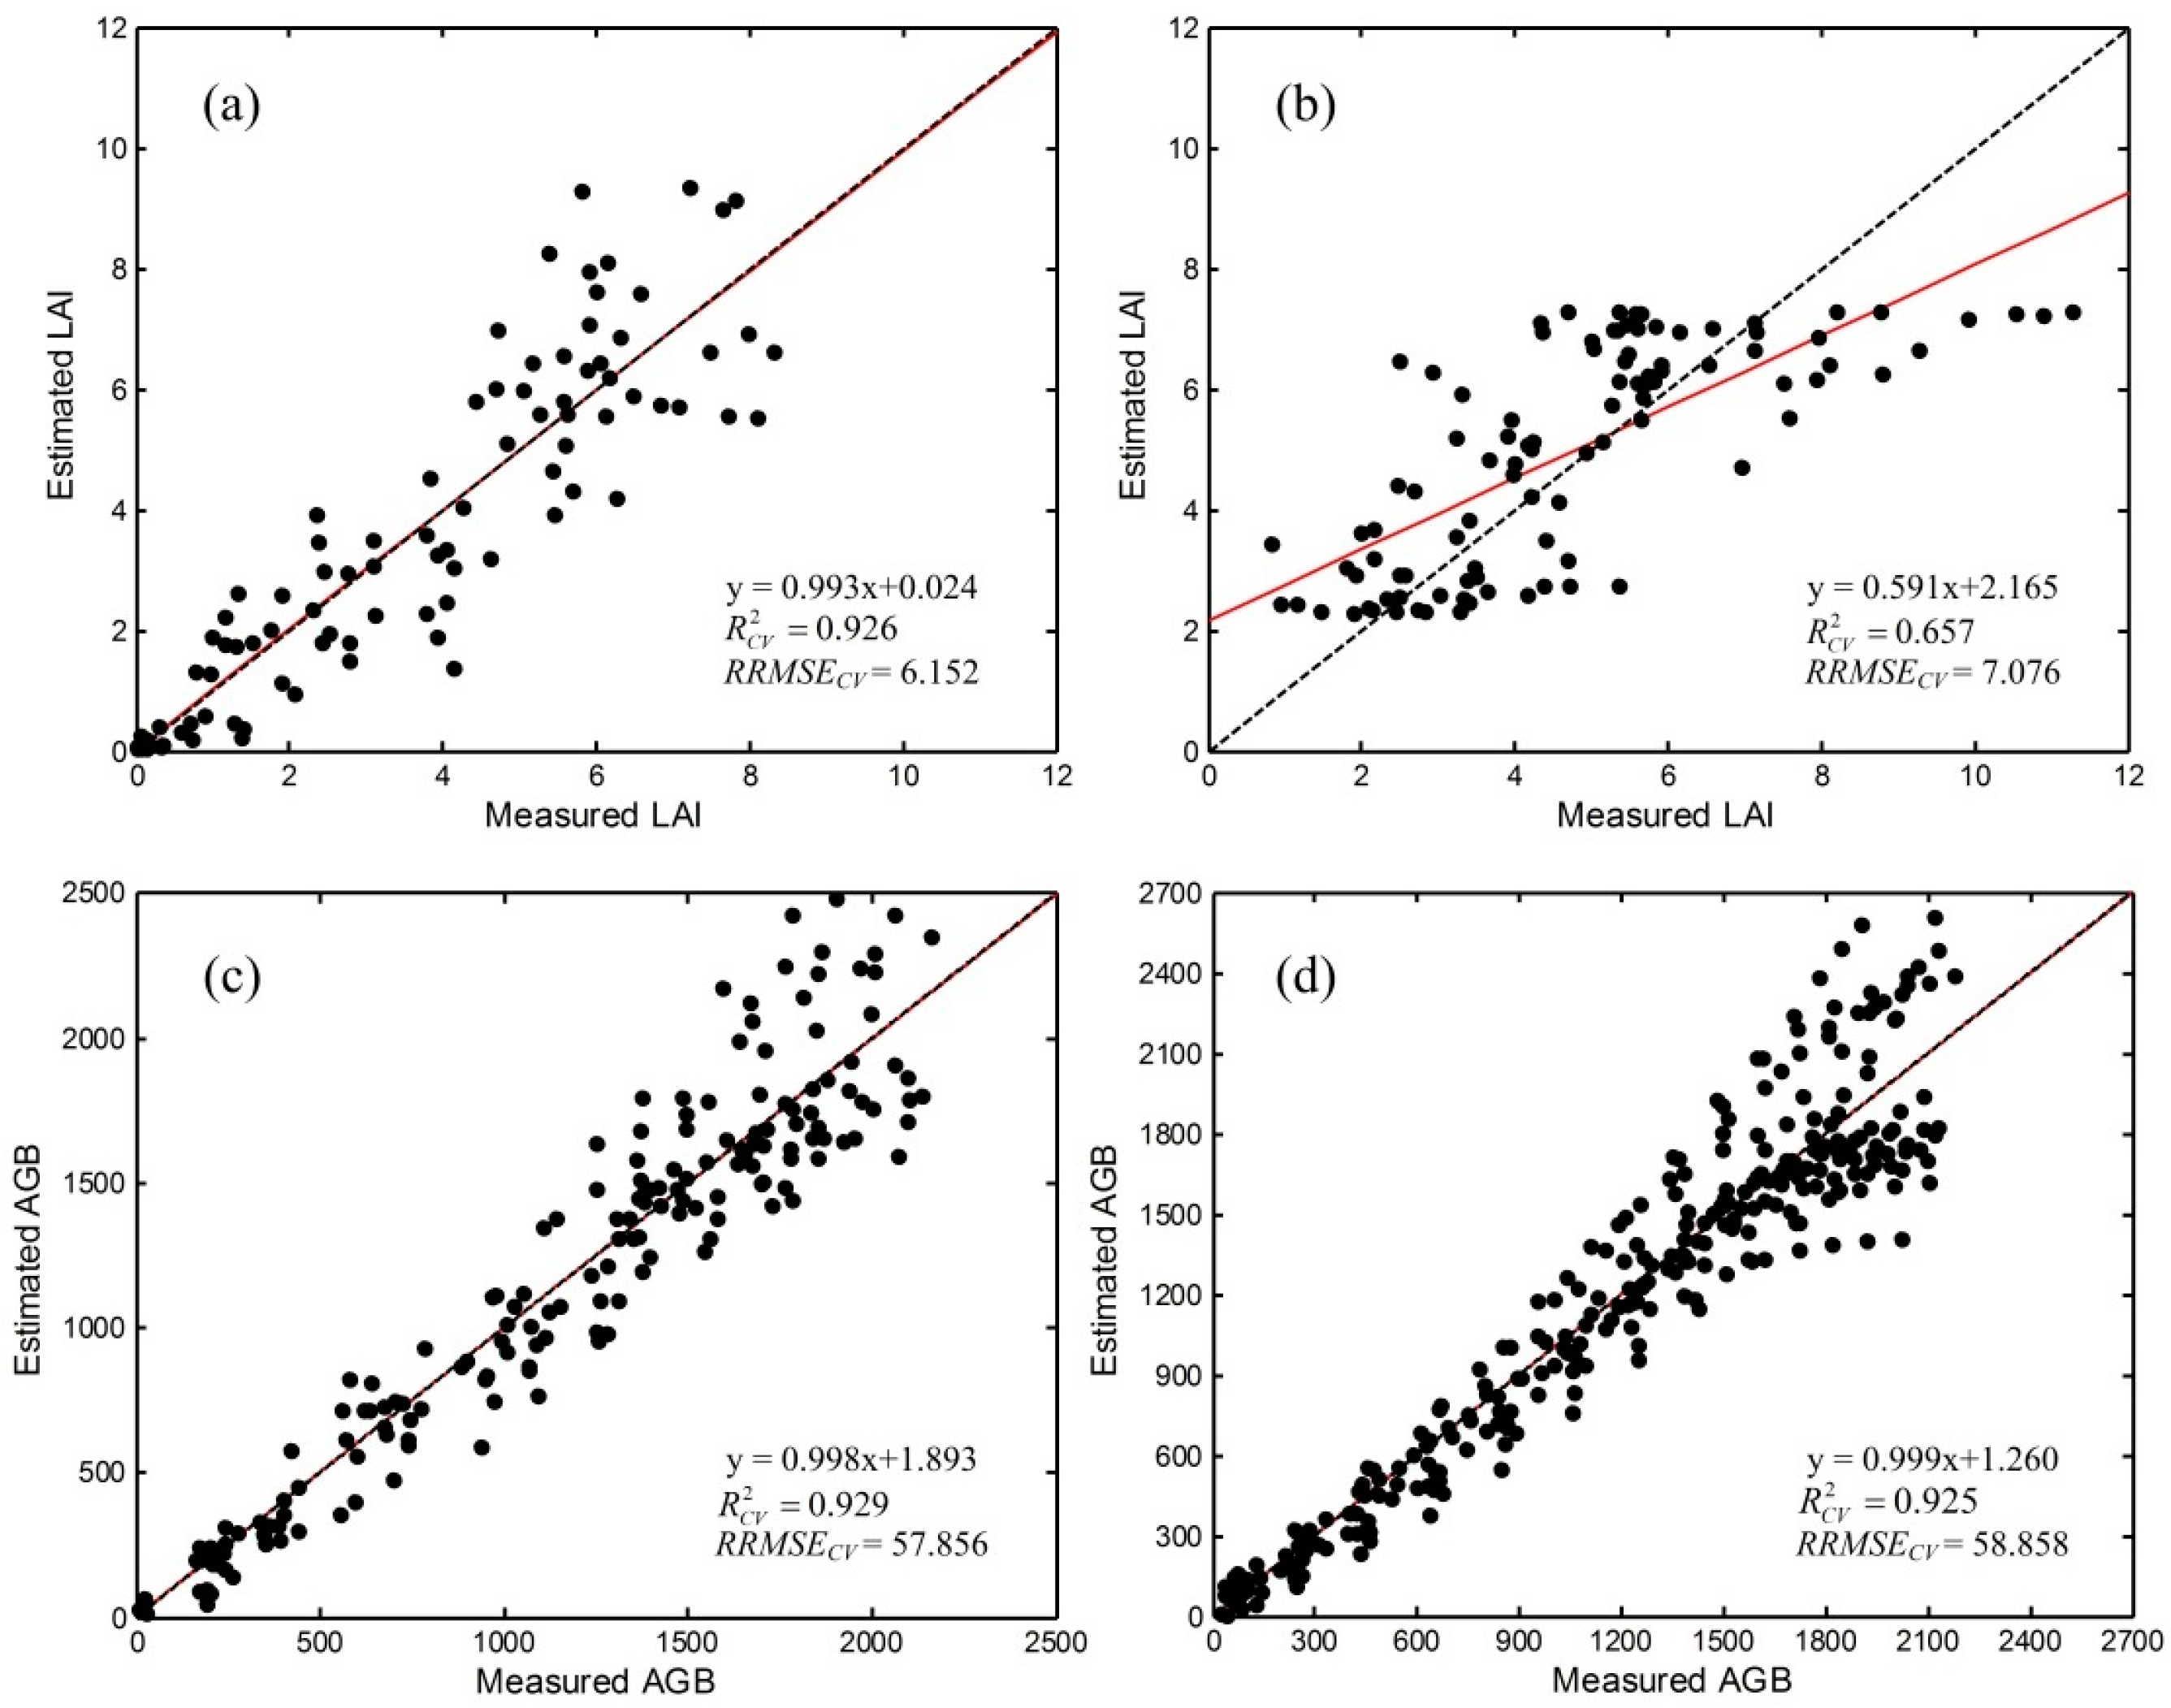
These changes have no material impact on the conclusions of our paper. We apologize to our readers for the inconvenience. The manuscript will be updated and the original will remain online on the article webpage.
Reference
- Wang, J.; Huang, J.F.; Gao, P.; Wei, C.W.; Mansaray, L.R. Dynamic Mapping of Rice Growth Parameters Using HJ-1 CCD Time Series Data. Remote Sens. 2016, 8, 931. [Google Scholar] [CrossRef]
© 2017 by the authors. Licensee MDPI, Basel, Switzerland. This article is an open access article distributed under the terms and conditions of the Creative Commons Attribution (CC BY) license ( http://creativecommons.org/licenses/by/4.0/).