After publication of the research paper [1] an error was recognized. Figure 1 was partly misplotted and should be replaced with the following figure.
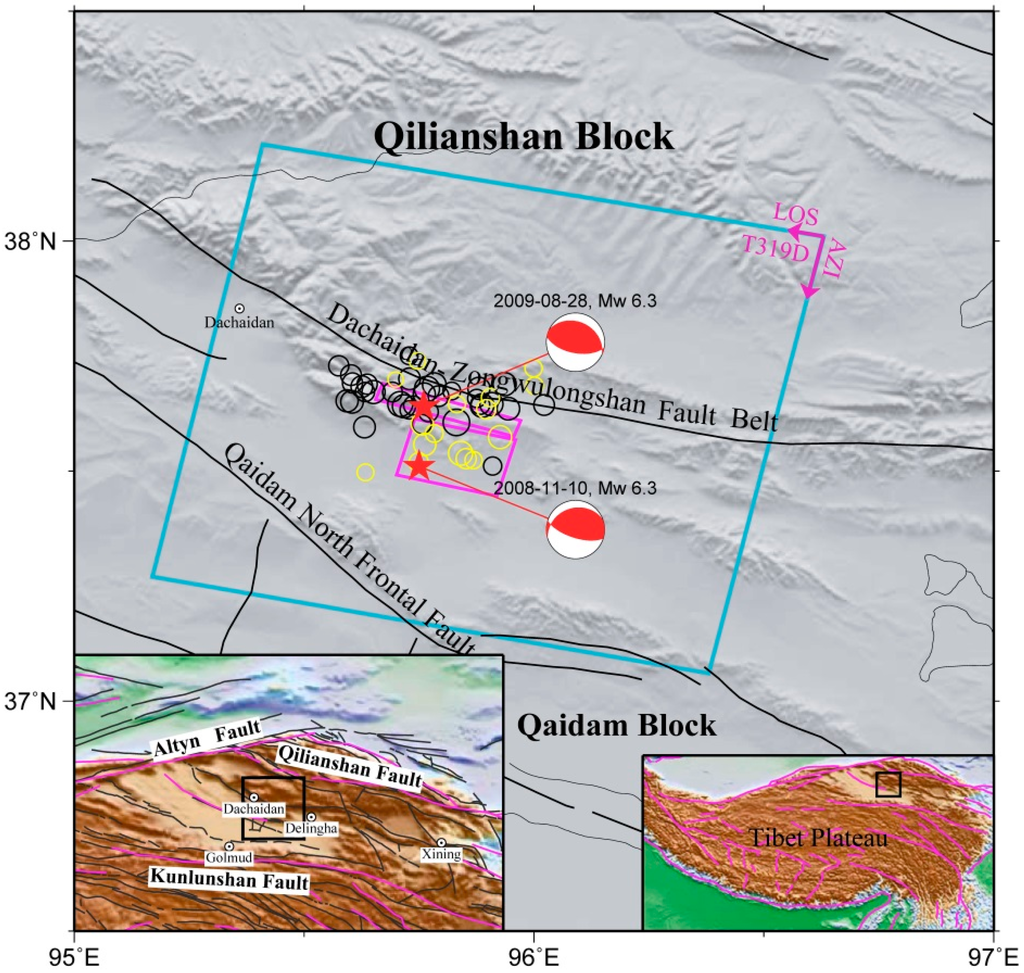
Figure 1.
Tectonics associated with the 2009 Mw 6.3 DCD earthquake. The bottom-left and bottom-right insets show the location of the main figure, respectively. The light blue rectangle is the spatial extent of the Envisat Advanced Synthetic Aperture Radar (ASAR) descending Track 319 images, with AZI and LOS referring to satellite azimuth and look directions. The focal mechanisms of the 2008 and 2009 events are from United States Geological Survey (USGS) [4]. The two purple rectangles are the surface projections of the main fault rupturing zones during the 2008 and 2009 events [3,21]. The black and yellow hollow circles are the aftershocks of the 2008 and 2009 events, respectively [4]. The purple and black lines are the active faults from Peltzer and Saucier [24] and Deng et al. [5], respectively. (Note that the references here correspond to those in the original manuscript).
The change does not affect the results. The manuscript will be updated on the article webpage.
We apologize for any inconvenience this has caused.
Reference
- Liu, Y.; Xu, C.; Li, Z.; Wen, Y.; Chen, J.; Li, Z. Time-dependent afterslip of the 2009 Mw 6.3 Dachaidan earthquake (China) and viscosity beneath the Qaidam Basin inferred from postseismic deformation observations. Remote Sens. 2016, 8, 649. [Google Scholar] [CrossRef]
© 2016 by the authors; licensee MDPI, Basel, Switzerland. This article is an open access article distributed under the terms and conditions of the Creative Commons Attribution (CC-BY) license (http://creativecommons.org/licenses/by/4.0/).