Abstract
Built-up area extraction from polarimetric SAR (PolSAR) imagery has a close relationship with urban planning, disaster management, etc. Since the buildings have complex geometries and may be misclassified as forests due to the significant cross-polarized scattering, built-up area extraction from PolSAR data is still a challenging problem. This paper proposes a new urban extraction method for PolSAR data. First, a multiple-component model-based decomposition method, which was previously proposed by us, is applied to detect the urban areas using the scattering powers. Second, with the sub-aperture decomposition, a new average polarimetric coherence coefficient ratio is proposed to discriminate the urban and natural areas. Finally, these two preliminary detection results are fused on the decision level to improve the overall detection accuracy. We validate our method using one dataset acquired with the Phased Array type L-band Synthetic Aperture Radar (PALSAR) system. Experimental results demonstrate that the decomposed scattering powers and the proposed polarimetric coherence coefficient ratio are both capable of distinguishing urban areas from natural areas with accuracy about 83.1% and 80.1%, respectively. The overall detection accuracy can further increase to 86.9% with the fusion of two detection results.
1. Introduction
Built-up area extraction from remote sensing imagery has attracted more and more attention in recent years since it has a close relationship with various applications, such as city expansion, earthquake or tsunami damage assessment, population estimation, etc. [1,2,3,4,5,6,7,8,9,10]. Synthetic aperture radar (SAR) can image the rapid change of urban areas in almost all-weather and solar illumination conditions, making it become an effective tool for urban remote sensing [7]. Compared with single polarization SAR, fully polarimetric SAR (PolSAR) can provide more information about the urban areas with four polarizations. Therefore, PolSAR data have been increasingly studied for urban area identification and interpretation. For instance, Zhai et al. [1] combined the polarimetric decomposition and the Wishart supervised classification to extract and identify the collapsed buildings after Yushu earthquake in China. To achieve accurate urban extraction and damage assessment, Zhao et al. [2] considered the polarimetric decomposition to discriminate the intact buildings with large orientation angles from the collapsed buildings. Yamaguchi et al. [4] utilized model-based scattering power decomposition images of PolSAR data for city disaster monitoring.
Polarimetric target decomposition, originated from Huynen’s work [11], plays a key role in PolSAR data understanding since it can provide interpretation of the target scattering mechanisms. Buildings in PolSAR imagery are usually distributed targets, making incoherent decompositions using the coherency/covariance matrix suitable for built-up areas. Incoherent decompositions are divided into two categories: eigenvalue–eigenvector-based decomposition [12,13,14] and model-based decomposition [15,16,17]. Polarimetric entropy, mean alpha angle, and polarimetric anisotropy are popular parameters derived from Cloude decomposition and have been used for urban analysis. Pellizzeri et al. [18] utilized Cloude decomposition and multivariate annealed segmentation for PolSAR urban classification, where the anisotropy parameter allows a better discrimination of built-up areas from other classes. Deng et al. [19,20] analyzed polarimetric entropy and mean alpha angle from different sub-aperture images and then proposed robust features for urban identification and classification. Compared with eigenvalue–eigenvector-based decomposition, model-based decomposition using physical scattering matrices can provide a color-coded image of the scattering powers, which is more straightforward to interpret the PolSAR data. In addition, the decomposed scattering powers have the ability of discriminating urban areas from natural areas. However, the scattering mechanisms of buildings are significantly influenced by the relative azimuth angle to radar look directions [21]. Buildings parallel to the flight pass usually have strong double-bounce scattering and weak cross-polarized (HV) scattering. These buildings can be easily discriminated from the natural areas because the latter usually have strong volume scattering or surface scattering. For oriented buildings that are not parallel to the flight pass, the double-bounce scattering is weak and the cross-polarized scattering becomes strong, leading to a scattering ambiguity between the forest and oriented buildings [21,22,23,24]. Kajimoto et al. [3] proposed an urban area extraction method for PolSAR images using volume scattering power, total scattering power, and polarimetric orientation angle. Azmedroub et al. [25] utilized the four-component decomposition and the Wishart maximum likelihood classifier to extract urban areas from PolSAR images. Zou et al. [26] introduced an effective urban area extraction scheme for PolSAR images using the randomness of orientation angle and the scattering powers from the four-component model-based decomposition. It should be noted that these methods are all designed based on the Yamaguchi four-component decomposition with or without deorientation processing. However, the scattering mechanism ambiguity still exists in urban areas with large orientation angles [27], which can diminish the urban extraction accuracy. Recently, many new model-based decomposition schemes [28,29,30,31,32] have been reported to overcome this scattering ambiguity. Among them, a multiple-component decomposition technique with cross scattering model has proven to be effective for urban area analysis [30], where the HV scatterings of oriented buildings and forests are modeled respectively. The scattering powers are capable of discriminating different urban land covers [33], therefore, they have the potential ability for urban extraction in this study.
Fully polarimetric SAR data are presented in four channels and the coherences between two co-polarized channels or co-polarized and cross-polarized channels are important descriptors for scattering mechanism interpretation [34]. These coherences, also called correlation coefficients, have been used for man-made targets characterization and land cover classification. Ainsworth et al. [21] proposed a normalized circular polarization correlation coefficient to detect the scattering from non-reflection symmetric structures. Lee et al. [22] utilized the co-polarized phase-difference to extract buildings parallel to the flight pass and cross-polarized phase-difference to extract oriented buildings. These two phase-difference parameters are also derived from the correlation coefficients. Li et al. [5] analyzed the spatial distribution of collapsed buildings using the circular polarization correlation coefficient and then extract urban areas from RADARSAT-2 PolSAR data. To discriminate the urban areas from non-urban areas, Xiao et al. [35] proposed an optimization scheme to optimize the coherence between two polarimetric channels. The coherence magnitude of oriented buildings is enhanced while that of forests remains relatively low. The results of these methods demonstrate that polarimetric coherence is effective for urban extraction. However, target orientation to the radar line of sight has a significant effect on the polarimetric coherence, making the discrimination between oriented buildings with large orientation angles and natural areas still a challenge.
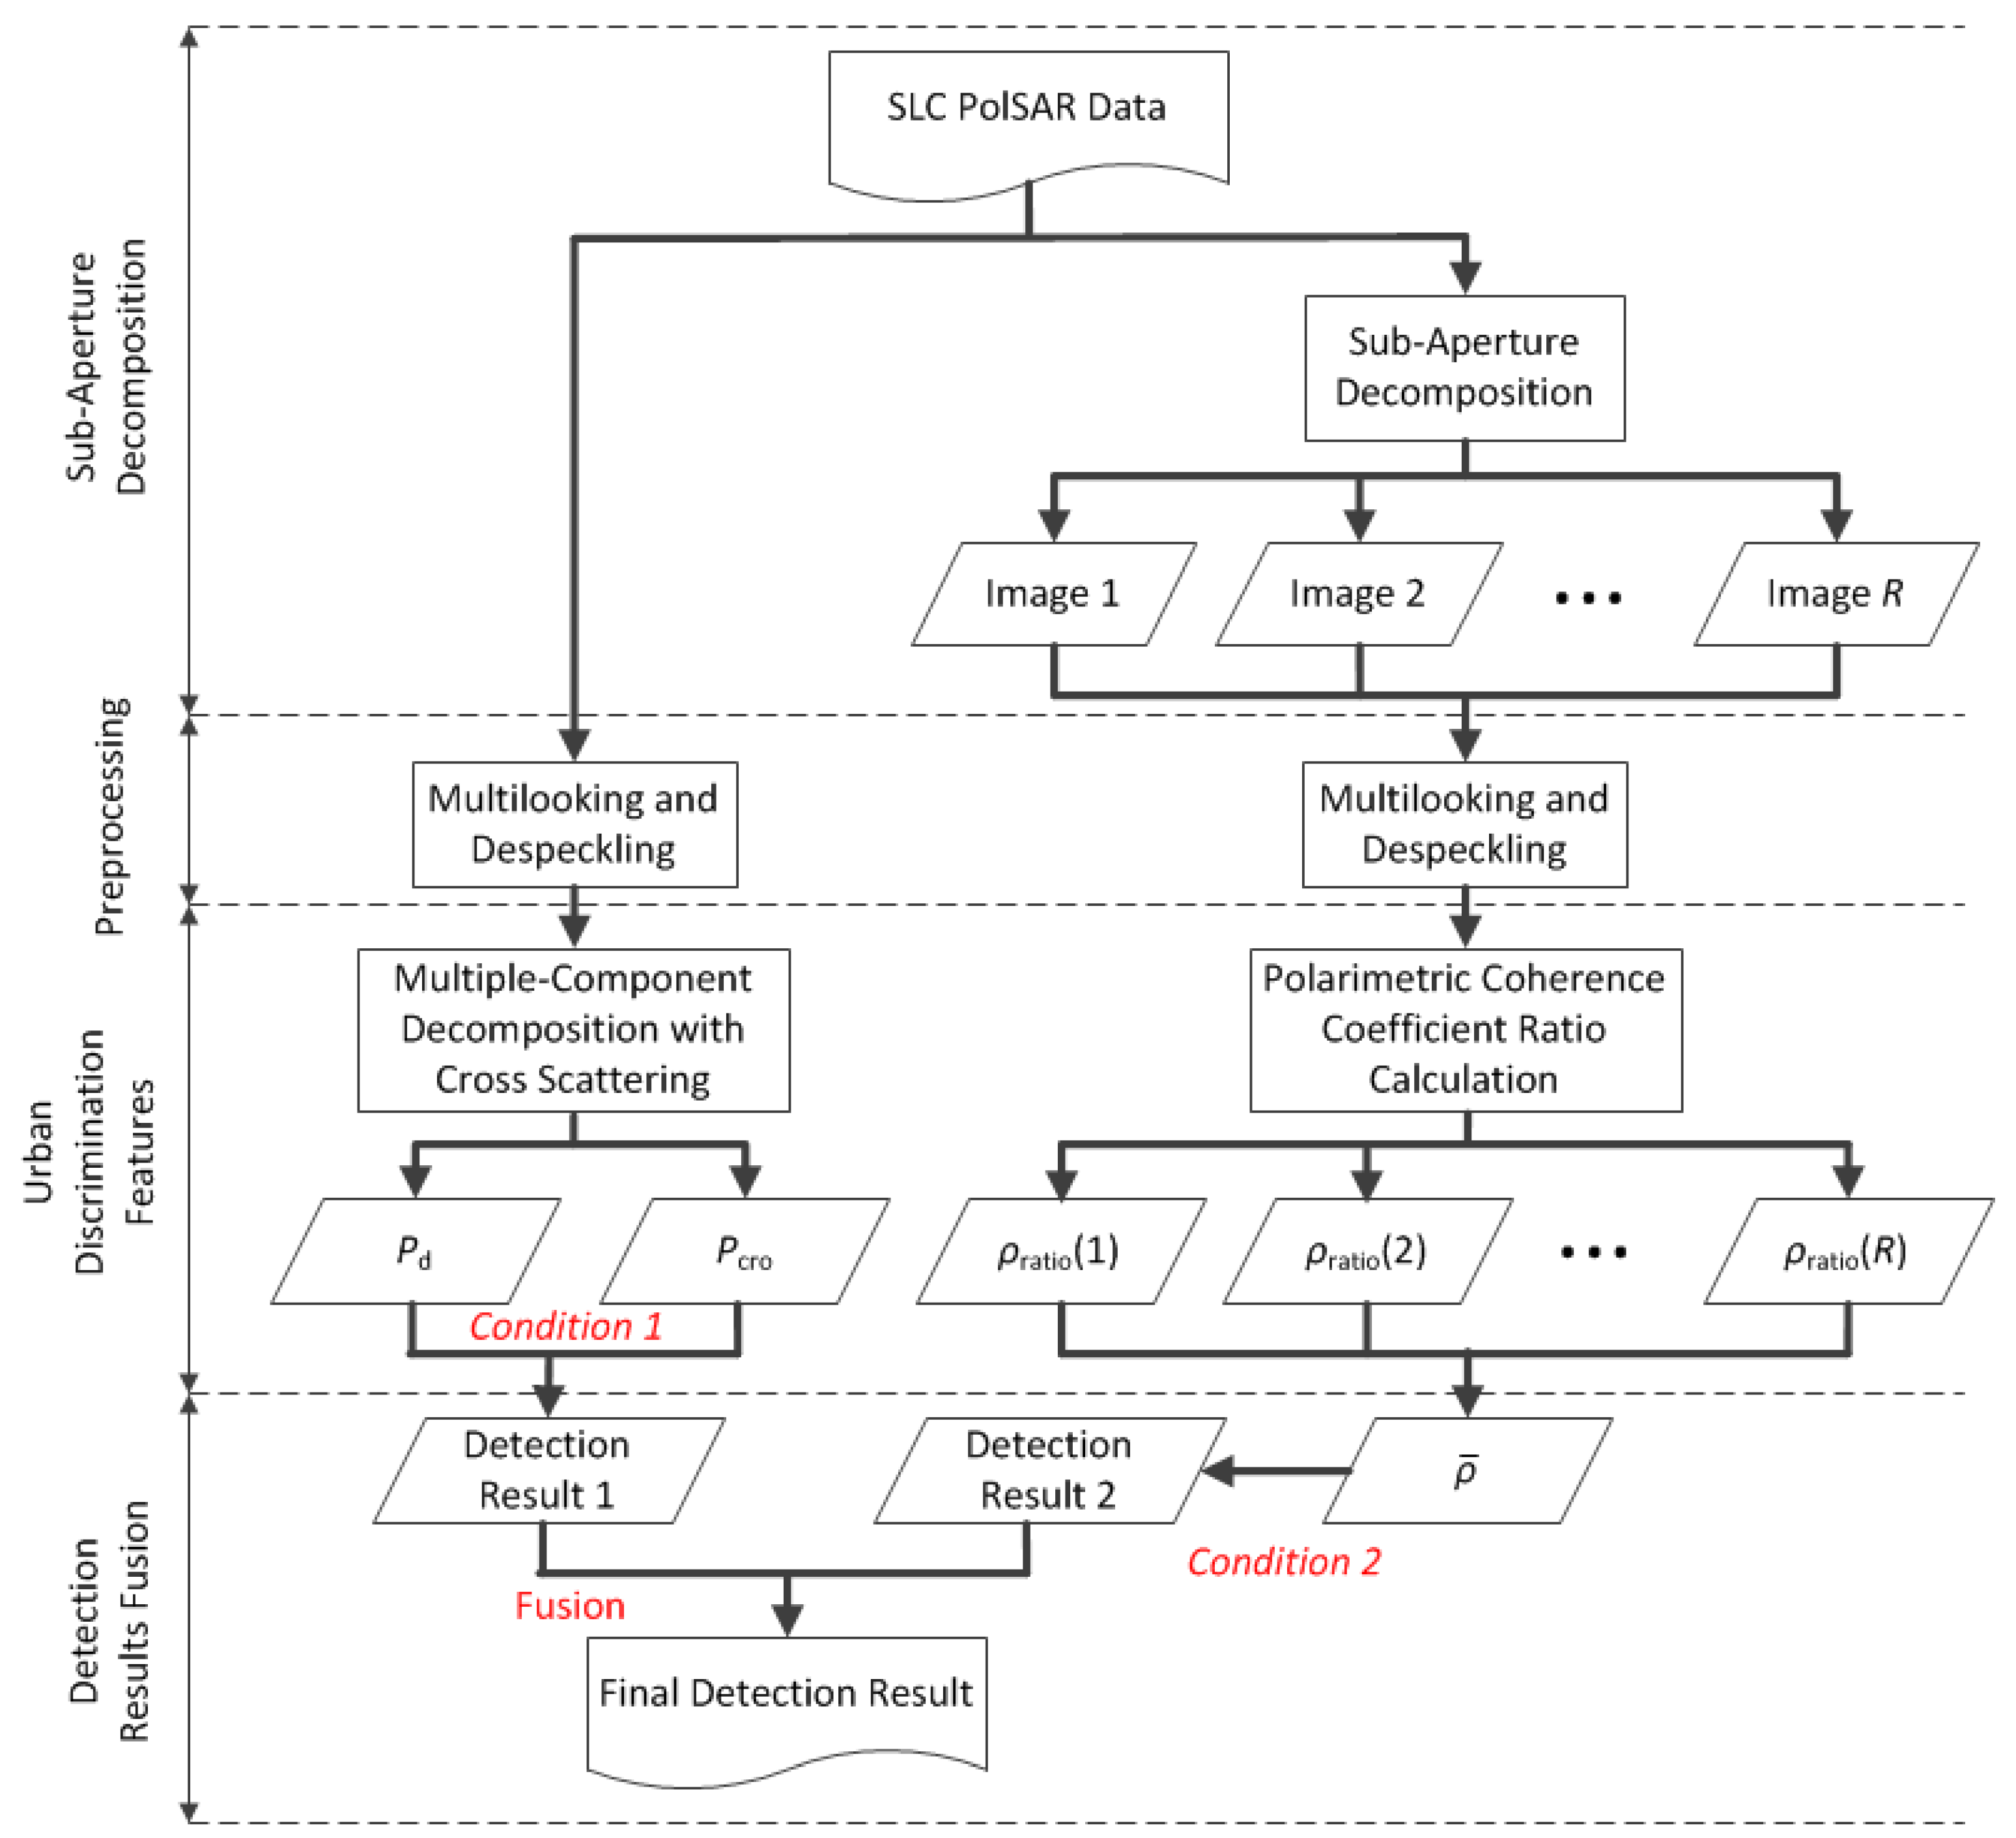
To achieve a better built-up area extraction result than other state-of-the-art methods, in this paper we propose a new average polarimetric coherence coefficient ratio based on the sub-aperture decomposition to discriminate the urban and non-urban areas. This coherence parameter considers the reflection asymmetry of buildings and the scattering divergence between co-polarized and cross-polarized channels. Sub-aperture decomposition is beneficial to urban characterization since it can provide several sub-aperture images with different radar look angles. Moreover, the scattering powers obtained by multiple-component decomposition are also used for urban extraction. To improve the overall detection accuracy, these two preliminary results are finally fused using a correlated probabilities decision fusion method.
2. Methodology
2.1. Multiple-Component Decomposition with Cross Scattering Model
On the basis of the four-component polarimetric decomposition [15], a multiple-component decomposition with cross scattering model was previous proposed by us to analyze the scattering mechanisms in urban areas [30]. The cross scattering model considers the building orientation angles, making it flexible and adaptive in the decomposition. Therefore, it can well describe the HV scattering components from orientated and complex buildings. Polarimetric SAR system measures the complex scattering matrix S, which is formed as
where the subscripts H and V represent horizontal and vertical polarizations, respectively. In each scattering element, the first index represents the polarization of received signal and the second denotes that of the transmitted signal. According to the reciprocity theorem, we can get . The target vector can be formed from this scattering matrix using the Pauli bases as
where the superscript T denotes the matrix transpose.
Then the coherency matrix can be formed as
where the operator represents the ensemble average and the symbol † denotes the complex conjugation and transposition. Then we can calculate the polarization orientation angle as [34]
where is the real part of . The buildings usually have different orientation angles, which can significantly influence the building scattering mechanisms. As mentioned in [30], the cross scattering matrix is derived as
The cross scattering is regarded as an independent component and added to the Yamaguchi four-component decomposition. Therefore, there are five scattering components, i.e., surface, double-bounce, volume, helix, and cross scattering are presented in the decomposition, which can be described as follows:
where and are the expansion coefficients to be determined while , and are the models of surface, double-bounce, volume, and helix scatterings in the four-component decomposition, respectively. The expression of each scattering model and the decomposition approach are described in detail in [30].
If , five scattering coefficients are solved as follows:
while if , the results are:
where is the imaginary part of . It should be noted that if the result is , we set and follow the same decomposition procedure of original four-component decomposition.
Then the surface scattering power , double-bounce scattering power , volume scattering power , helix scattering power and cross scattering power can be obtained as
where and are unknowns in and , respectively, and are expressed as
Helix scattering in the four-component decomposition is obtained from , which focuses on the reflection asymmetry. In contrast, the cross scattering model concentrates on separating the cross scattering power caused by orientated buildings from the overall HV scattering component. Therefore, this decomposition algorithm has a potential ability to discriminate the urban areas from natural areas, which will be further demonstrated in Section 4.
2.2. Sub-Aperture Decomposition
The sub-aperture or time-frequency decomposition, which uses a two-dimensional Fourier transform, or Gabor transform to decompose a full resolution image into several sub-aperture images, has been widely used on SAR image application [36,37,38,39,40]. A 2D signal can be transformed into several different components located around particular spectral coordinates using a convolution with an analyzing function as follows:
where and denote spatial and frequency locations of the component, respectively. We perform 2D Fourier transform on Equation (11) and give the spectrum of by the following formula:
where and denote the signals in the spectral domain. Equations (11) and (12) indicate that using the analyzing function , time-frequency method can characterize the behaviors of a signal in the spatial domain corresponding to particular spectral components. Therefore, the spectral properties of a signal can be analyzed around the specific spatial locations or vice versa.
Sub-aperture decomposition has already been used for PolSAR image analysis. Ferro-Famil et al. [36], Reigber et al. [24], and Wu et al. [41,42] analyzed the non-stationarity of a pixel in different sub-aperture images and then investigate the urban extraction from PolSAR data. Deng et al. [20] integrated the sub-aperture decomposition and the entropy/alpha-Wishart classifier to improve the building extraction accuracy of PolSAR images. Wu et al. [43] analyzed the texture features of sub-aperture images and achieved an effective urban detection result for high resolution PolSAR images. With sub-aperture decomposition, Xiang et al. [44] combined the nonstationarity detection and reflection asymmetry analysis to extract the man-made targets from PolSAR data. Single-Look Complex (SLC) PolSAR images are generally selected for sub-aperture decomposition in order to benefit from error corrections and specific signal compensation operated during the focusing of SAR data. A set of coarser-resolution sub-aperture images containing different parts of the SAR Doppler spectrum can be obtained in the azimuth direction decomposition and another set of sub-aperture images with different observation frequencies are get in the range direction. As building scattering is more significantly affected by the radar look directions than the frequency effects [36], sub-aperture decomposition in the azimuth direction is generally enough for urban analysis in PolSAR data.
The procedure sub-aperture decomposition for PolSAR data is as follows:
- Fourier transformation in azimuth direction.2D Fourier transform is utilized to transform a PolSAR image into the spectral domain.
- Frequency spectrum segmentation using a window function.The total frequency spectrum is divided into several regions centered on the specific spectral locations using a window function such as Hamming window.
- Each part of the spectrum is transformed back into the spatial domain using 2D inverse Fourier transform.Using a 2D inverse Fourier transform, every sub-spectrum is transformed back into the spatial domain, and thus we can get a sub-aperture image representing the focused PolSAR response around a specific spectral location.
It is worth pointing out that the resolutions of the decomposition components in spatial () and frequency () are fixed by the analysis function and verify the Heisenberg’s inequality of [36]. In general, the analyzing function with an excessively narrow bandwidth would involve a high resolution in frequency, but might lead to bad localization accuracy in the space domain. Therefore, having too many sub-aperture images will lead to a serious reduction of the spatial resolution while two few may not be effective to characterize the anisotropic scattering properties of targets in sub-aperture images. Existing studies [41,42,43] stated that four sub-apertures are usually suitable to analyze the urban scattering mechanisms in PolSAR data. Therefore, the number of sub-apertures is set to four in this study.
2.3. Polarimetric Coherence Coefficient Ratio Based on Sub-Aperture Images
Polarimetric coherence is defined as the complex correlation coefficient between two polarization channels, which can be used to characterize the target scattering mechanisms. The correlation coefficient in arbitrary polarization basis can be expressed as [21]
Then the correlation coefficient between two co-polarized channels in the linear polarization basis is
and the correlation coefficient between co-polarized and cross-polarized channels is
It is already known that both and are complex and their magnitudes and vary by the types of scattering mechanisms [34]. However, since the building scattering significantly depends on the polarization orientation angle, and are not always effective for oriented built-up areas [35]. Basically, the oriented buildings usually produce poor coherence compared with the buildings which are parallel to the radar. Some natural areas such as the forests also exhibit poor coherence, leading to a discrimination difficulty. It has been found that the correlation coefficient parameters derived from the circular polarization basis are suitable for oriented buildings detection [21], however, there still exists confusion between the buildings with large orientation angles and forests. Xiao et al. [35] rotated polarimetric coherency matrix around the radar line of sight to enhance the polarimetric coherence of oriented buildings, which can achieve similar performance to that of the circular-pol correlation coefficient.
It has been demonstrated that the natural areas usually have the characteristic of reflection symmetry, i.e., , whereas the reflection scattering of buildings with complex geometry is often asymmetry with [21]. Unlike the correlation coefficients as shown in Equations (14) and (15), which are directly derived from the Sinclair scattering matrix , this paper utilizes the polarimetric coherency matrix to derive a polarimetric correlation coefficient. This correlation coefficient measures the polarimetric coherence between and , which considers the reflection asymmetry of buildings.
It can be seen that the denominator of is the product of double-bounce scattering and volume scattering in the Pauli basis and the numerator measures the reflection asymmetry. The magnitude can characterize the target scattering mechanism. For natural areas with , is almost 0 while for built-up areas, since . The main difference between and is that the latter considers more scattering information. For instance, double-bounce scattering is considered in the denominator of , making it more sensitive to buildings than . It should be noted that for buildings which are not parallel to the radar flight pass, although , the volume scattering is strong. Therefore, is comparatively low. To further improve the discrimination ability, we form a ratio using and as
From Equation (17) we can see that since the value trends of and in urban areas are opposite, combining these two correlation coefficients can significantly improve the probability of discriminating urban and non-urban areas. As we discussed before, sub-aperture images can measure the target scattering mechanisms with different radar look angles. Therefore, is calculated for each sub-aperture image in this study and we can get the average as
where is the number of sub-aperture images and is the coherence coefficient ratio of sub-aperture image. The average ratio will be used to extract urban areas.
2.4. Built-up Area Extraction Method
As discussed in the above subsections, the buildings which are parallel to the radar flight pass usually have strong double-bounce scattering power , making them different from the natural areas. Regards the buildings not parallel to the radar flight pass, our decomposition algorithm can separate the cross scattering caused by oriented buildings from the overall HV scattering. Therefore, the decomposed cross scattering power can be utilized to identify the oriented buildings. Based on these two scattering powers, we have the following discrimination condition as
where is the threshold of double-bounce scattering power. Condition 1 is used to extract the urban areas on the basis of decomposed scattering powers. The reason why we set the threshold of as 0 is that the cross scattering power measures the HV scattering from oriented dihedral structures, which mainly exist in the oriented urban areas.
Based on the average coherence ratio , we have Condition 2 as
where is the threshold of average coherence coefficient ratio.
According to Condition 1 and Condition 2, we have two binary detection results and . It is worth pointing out that these two information sources are correlated since they both contain the urban detection information of the same image. In this study, the fusion of correlated probabilities (FCP) [45] algorithm is used to fuse and since the FCP algorithm can reduce fused error rate and also combine correlated information sources at the same time. The effectiveness of the FCP algorithm has already been proven in [46]. Suppose that the detections using scattering powers and average coherency coefficient ratio provide results and and the class-wise conditional probabilities and for a specific class , i.e., urban and non-urban areas. The aim of the FCP algorithm is to fuse and to produce a joint posterior probability for class . According to [46], the joint posterior probability for class is expressed by
where is the prior probability of class . The parameters and are weights given to the conditional probabilities, which reflect the conditional dependence of two detections. and are the individual prior probabilities of detections and , respectively. is the probability of redundant detections, that is . Note that is a constant in Equation (21) and can be omitted in the subsequent fusion. The conditional probabilities and of each pixel can be calculated from above two detection conditions as
where , , and are the cross scattering power, double-bounce scattering power, and average coherence coefficient ratio of pixel . denotes the maximum operator. The prior probability of each pixel can be estimated as the average of and . The weights and have the following estimations [46]
where and represent the presence and absence of a specific class in the two detection maps, respectively. stands for the total number of pixels detected as class in . denotes the number of pixels which are both detected in and as class . The similar meaning is for , , , and . The range of and is from 0 to 1. Further detailed explanations can be found in [46]. Finally, a maximum posterior probability rule is utilized to get the optimal class label for each pixel from two joint posterior probabilities as .
To sum up, the proposed detection procedures are shown in Figure 1, which consist of four stages as
- (1)
- Sub-aperture decomposition on the SLC PolSAR data to obtain sub-aperture images.
- (2)
- Multilooking and despecking on the original SLC PolSAR data and sub-aperture images to estimate accurate sample coherency matrix.
- (3)
- Polarimetric target decomposition on original PolSAR data using our method to get the double-bounce scattering power and cross scattering power. Coherence coefficient ratio calculation using the sub-aperture images.
- (4)
- Built-up area detection using Condition 1 and Condition 2. Fusion of two detection results using the FCP algorithm.

Figure 1.
Flowchart of the proposed built-up area extraction method.
3. Experimental Data Description
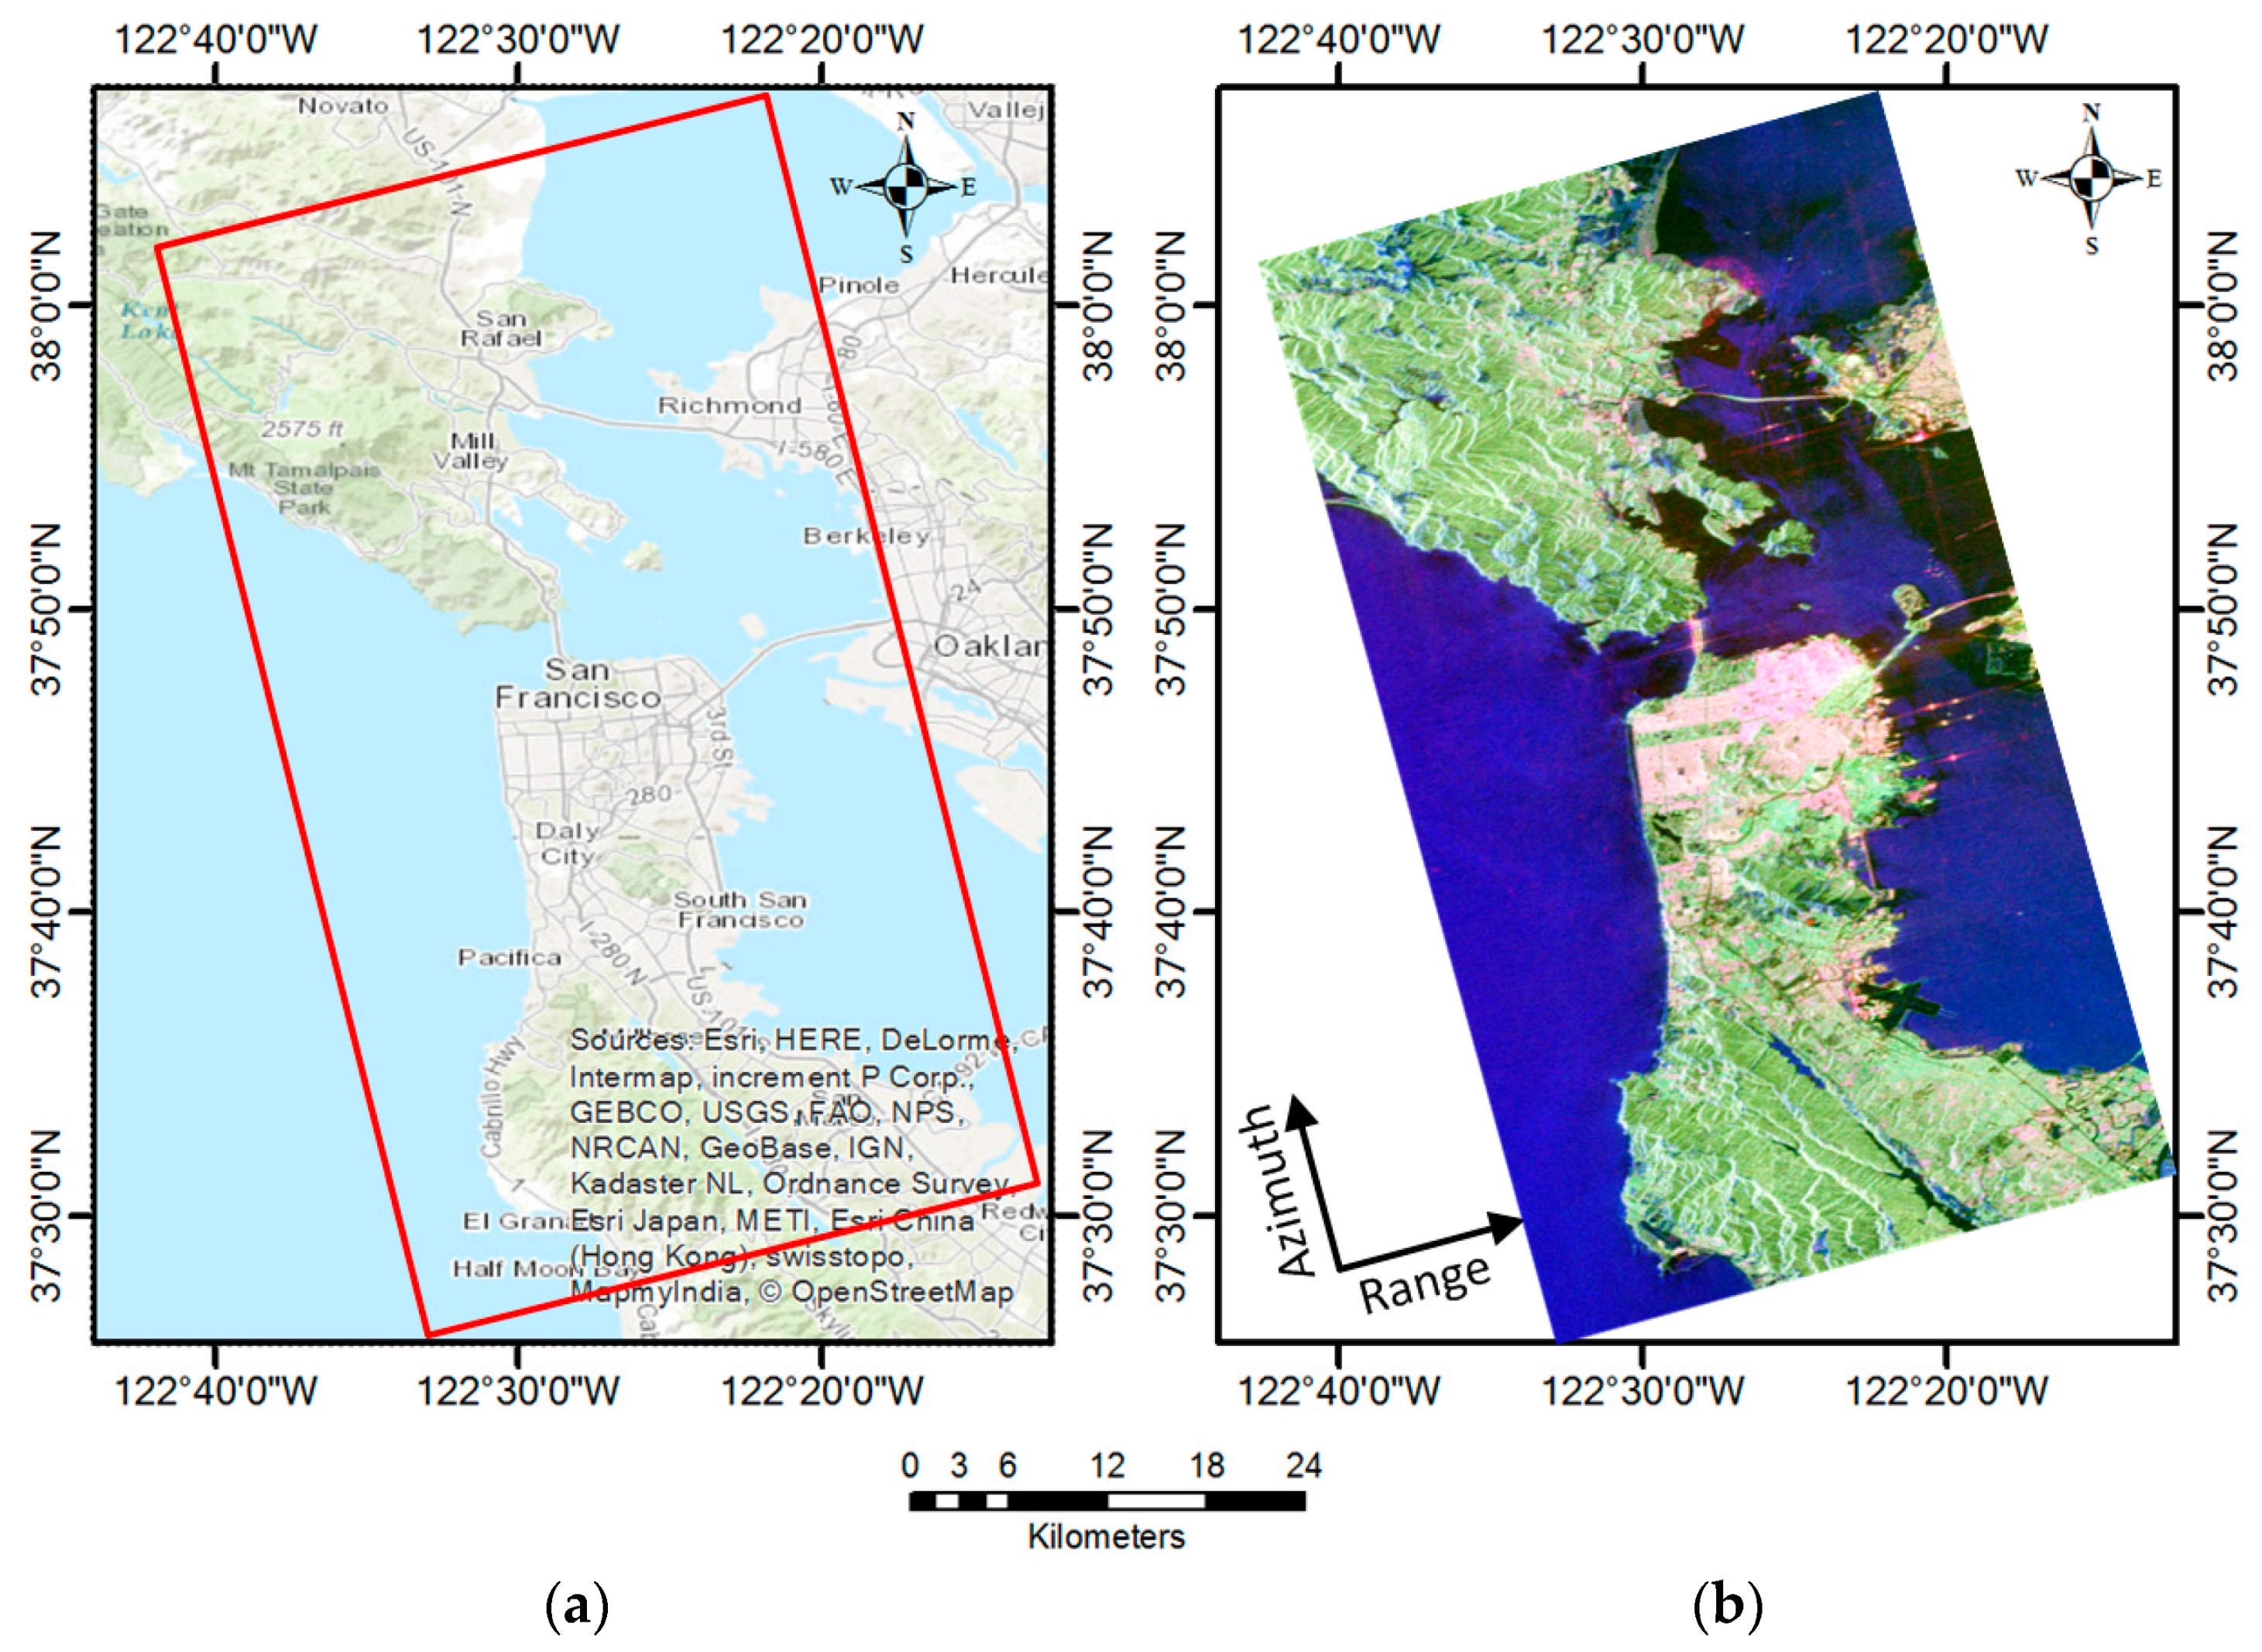
In this study, a SLC polarimetric dataset acquired with the Phased Array type L-band Synthetic Aperture Radar (PALSAR) system on 11 November 2009 was used for the experiments. The study area is located in San Francisco, CA, USA, where has coverage of built-up areas with different orientation angles, forests, and oceans. The azimuth resolution is about 3.54 m, and the range resolution is about 9.36 m. The size of the image is 18,432 × 1248. Some specific parameters about the PolSAR data are listed in Table 1. The Pauli RGB image without despeckling is shown in Figure 2b, where the red channel is |HH−VV|, the green channel is |HV|, and the blue channel is |HH+VV|. Since the image height is much larger than the width, the azimuth direction is multilooked with factor 6 in order to display the PolSAR image properly. Figure 2a gives the map of San Francisco, where the red rectangle indicates the imaging area of PolSAR data.

Table 1.
Acquisition information about the Phased Array type L-band Synthetic Aperture Radar (PALSAR) data.

Figure 2.
Study area and the PolSAR image acquired with the Phased Array type L-band Synthetic Aperture Radar (PALSAR) system: (a) San Francisco map, where the red rectangle indicates the imaging area; and (b) PolSAR image with Pauli color-coding (Red: |HH−VV|, Green: |HV|, Blue: |HH+VV|).
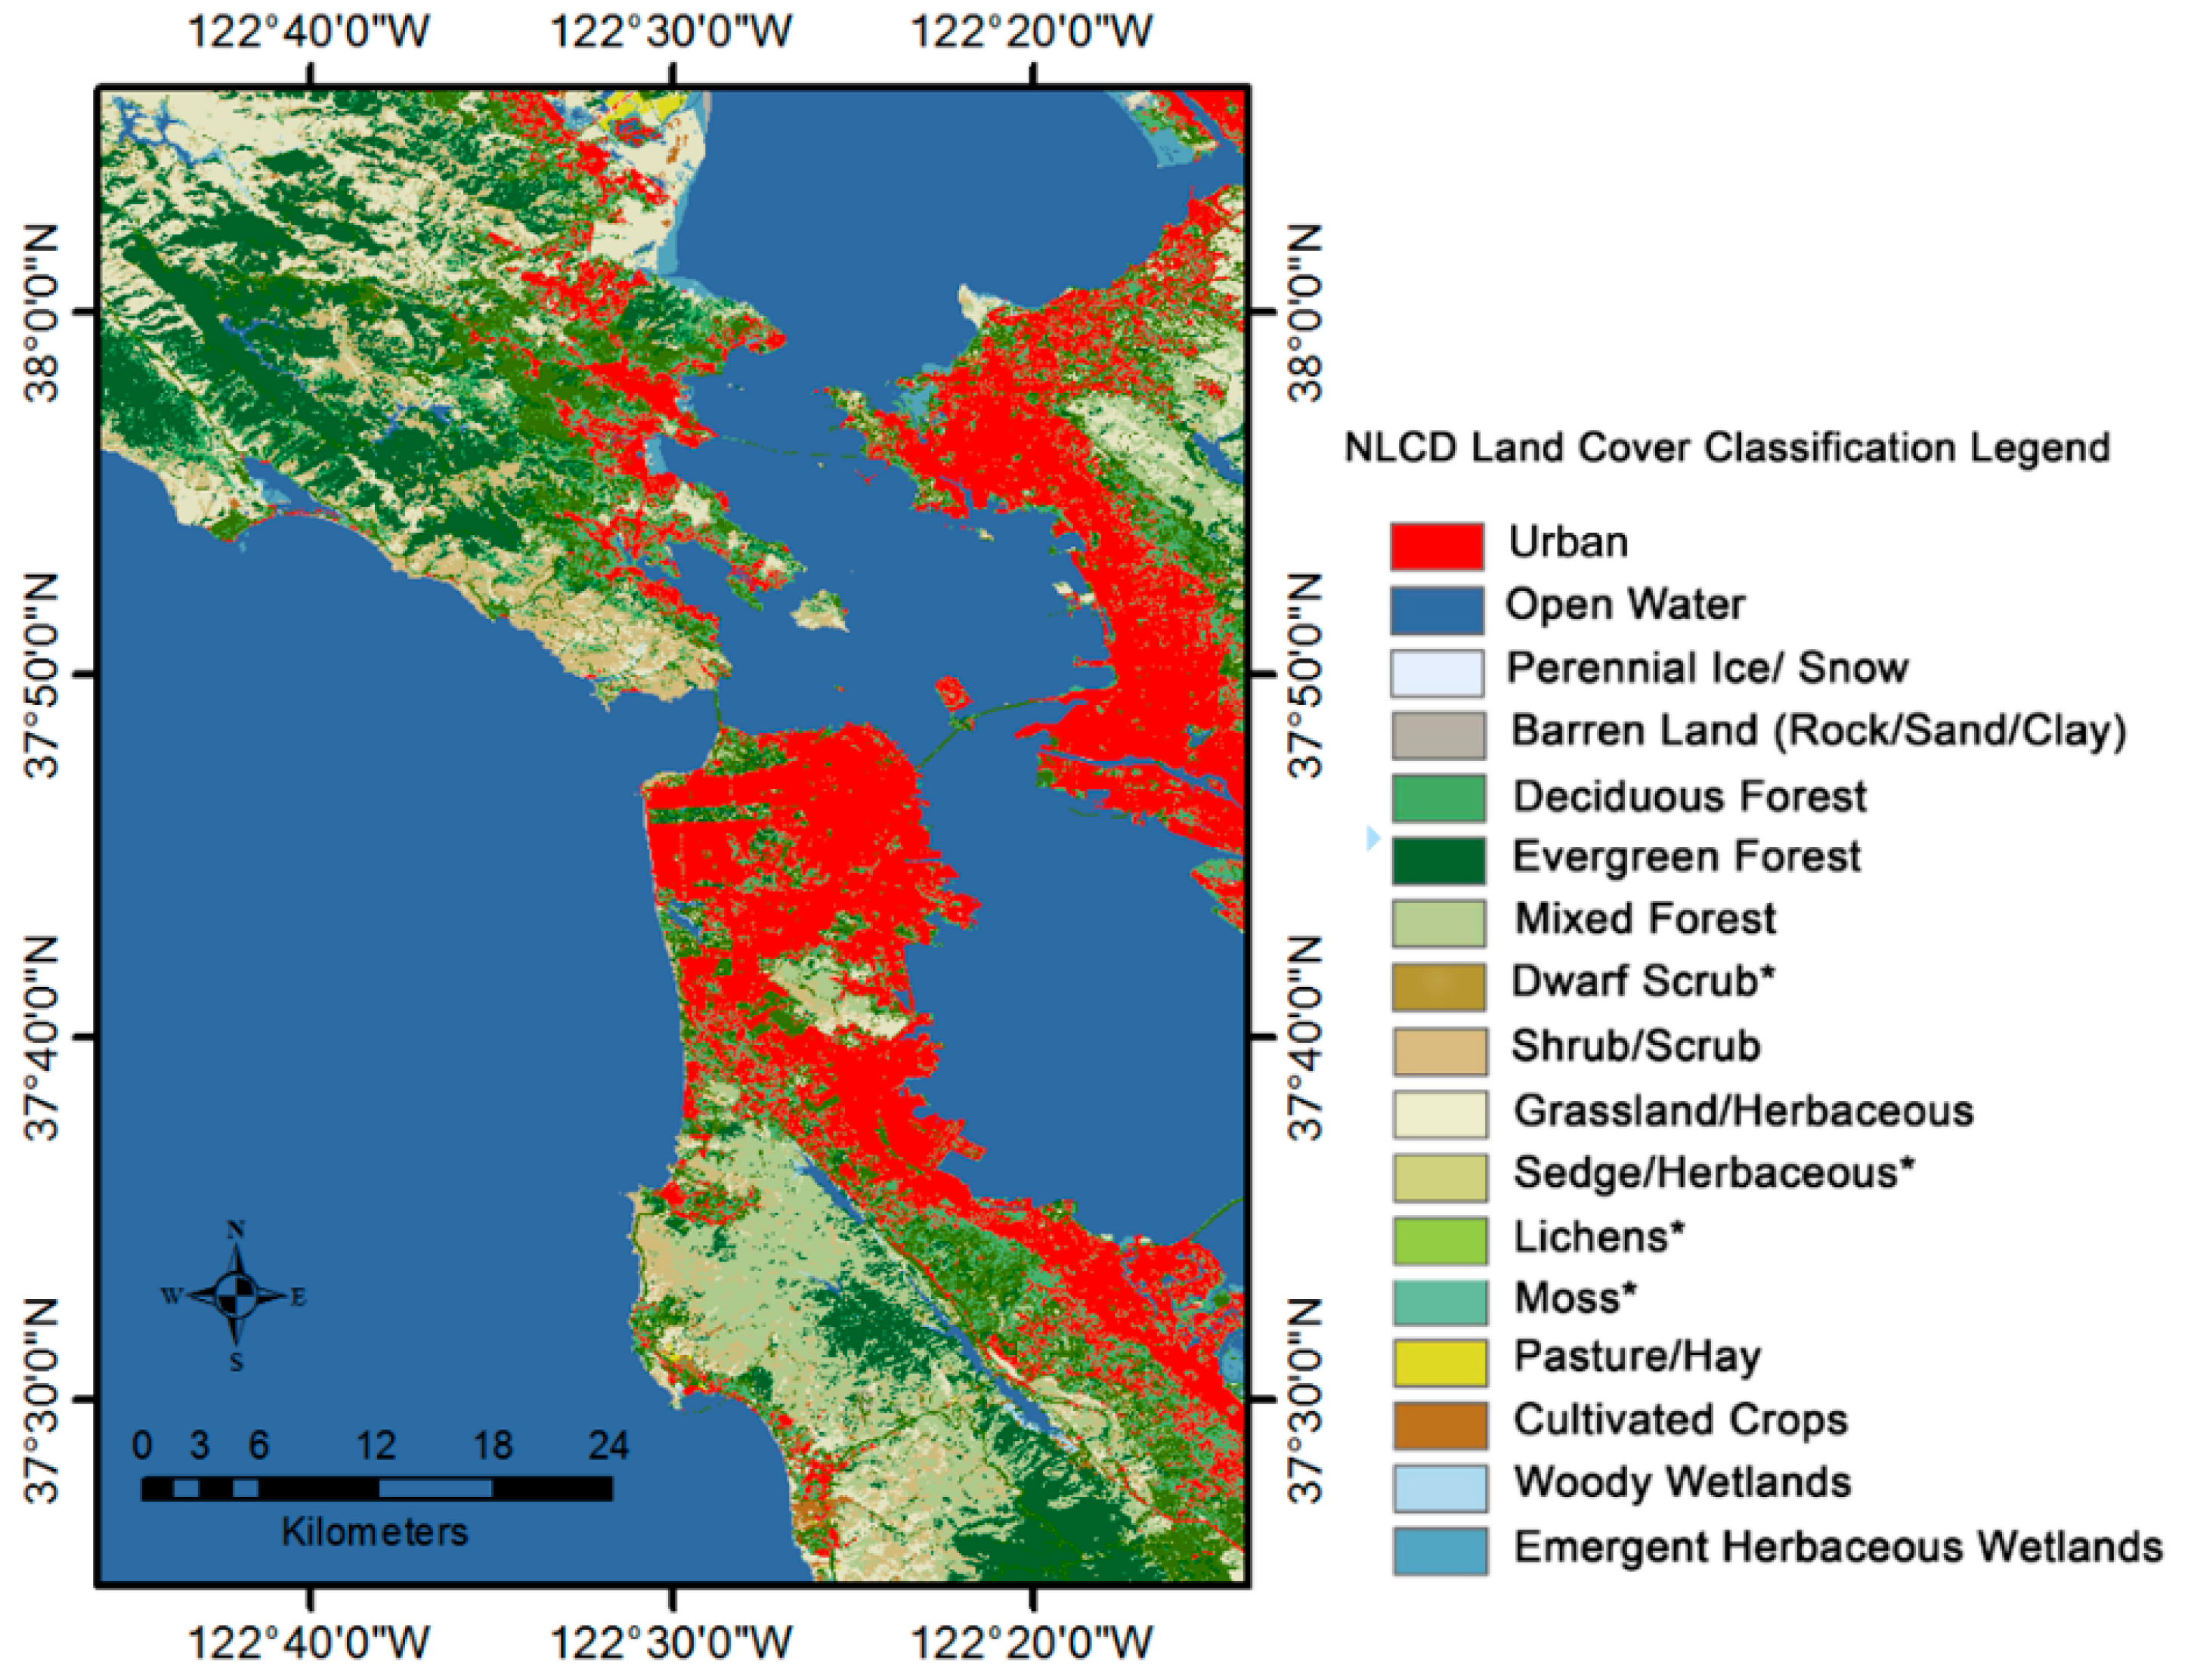
To quantitatively evaluate the performance of built-up area detection results, National Land Cover Database 2006 (NLCD 2006) [47] will be used as the ground reference data, as shown in Figure 3. NLCD 2006 is a land cover classification scheme that has been applied consistently across the conterminous United States at a spatial resolution of 30 m. The result is based primarily on a decision-tree classification of circa 2006 Landsat satellite data. For detection accuracy assessment in this study, all of the natural areas such as water, forest, wetland, barren land, etc. are regarded as non-urban classes. Therefore, in the quantitatively assessment, we have only two classes, i.e., urban and non-urban.

Figure 3.
Ground reference image (NLCD 2006 land cover 30 m) with seventeen classes.
4. Results and Discussions
This section gives the analyses of built-up area detection possibility using the decomposed scattering powers and the average coherence coefficient ratio, respectively. The thresholding parameters involved in these two methods are also analyzed and discussed. Moreover, these two individual results and the final fused result are also compared. In this experiment, for model-based decomposition, the original SLC PALSAR data are multilooked with factor 6 in the azimuth direction and then despeckled using the refined Lee filter [48]. The coherency matrix is adopted in the decomposition. For the calculation of average coherence coefficient ratio, the original SLC data are firstly decomposed into four sub-aperture images, followed by the same multilooking and despeckling processing steps.
4.1. Analysis of the Decomposed Scattering Powers on Built-up Area Detection
Figure 4 gives the decomposition results of our multiple-component decomposition method, where Figure 4a–d are the double-bounce scattering power, helix scatterng power, cross scattering power, and the final color-coded image. All the scattering powers are recalculated in decibels by . Note that the three scattering powers are all related to the building scattering. From Figure 4a, it can be seen that buildings which are parallel to the radar flight pass have strong double-bounce scattering power (5–10 dB), whereas natural areas and oriented buildings do not (−20–−10 dB). In addition, some small man-made targets such as the bridge and ships also exhibit strong double-bounce scattering. Therefore, buildings which are parallel to the radar flight pass and some other man-made structures can be discriminated from the natural areas using the double-bounce scattering power. However, oriented buildings cannot be effectively discriminted, such as the areas marked with red rectangles. What we can see from Figure 4b is that the scattering power difference between built-up areas and forests is very small even though buildings have a little bit larger helix scattering power than forests. Therefore, it is not easy to discriminate buildings from natural areas using the helix scattering power. It is worth mentioning that the helix scattering power of our decomposition method is the same as that of Yamaguchi four-component decomposition method [15] since the calculations are exactly the same. The cross scattering result in Figure 4c is promissing, which has the potential to detect oriented buildings. Since the buildings which are parallel to the radar flight pass and water do not produce HV scattering, the corresponding cross scattering power is quite low. Although oriented buildings and forests both generate HV scattering, our decomposition method can seperate the HV scattering of oriented buildings, i.e., the cross scattering power from the overall cross-polarized scattering component. It can be seen from Figure 4c that the difference of cross scattering power between oriented building and natural areas is appraent. The reason why some forests also exhibit weak cross scattering is that there are some ground-trunk double-bounce and triple-bounce reflections due to the L-band microwave penetration, which is similar to orientated buildings. From the color-coded image shown in Figure 4d, it can be observed that there is a significant difference between orientated urban areas and forests. This is due to the cross scattering, which can contribute to the urban scattering analysis. After polarimetric decomposition, the scattering mechanisms of different land covers are clear, which is beneficial for the identification of built-up areas.
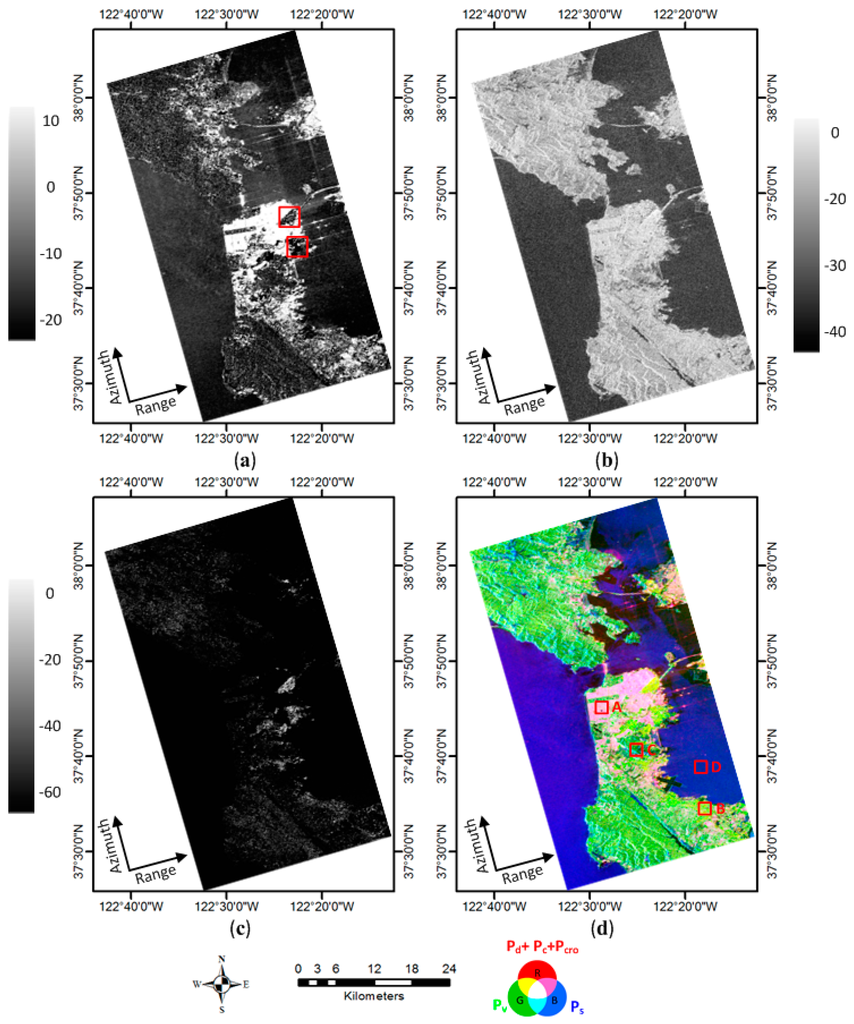
Figure 4.
Results of our multiple-component decomposition method: (a) double-bounce scattering power; (b) helix scattering power; (c) cross scattering power; and (d) color-coded decomposition result. All of the scattering powers are recalculated in decibels by .
To further quantitatively evaluate the abilities of above three scattering powers on built-up area detection, four test patches in Figure 4d, i.e., buildings parallel to the radar flight pass (area A), oriented buildings (area B), forest (area C), and water (area D) are selected to show the three scattering powers respectively in Figure 5. Note that the scattering powers are displayed using the original values. It can be seen that the buildings in Area A exhibit much stronger double-bounce scattering power compared to other land covers, making them be easily discriminated from natural areas using a threshold. From Figure 5, we believe that is appropriate for this study. Regards oriented buildings and forests, the values of double-bounce scattering power and helix scattering power are both similar. Therefore, it is quite difficult to use a threshold for the detection of oriented buildings. In contrast, the cross scattering can well distinguish oriented buildings and other land covers, where the average cross scattering power of Area B is about 0.3, whereas the values in other areas are almost 0. Thus, in Condition 1 can be used to extract the oriented buildings. It is worth mentioning that some forests with weak cross scattering power are probably detected as oriented buildings. These false alarms can be removed in the following stages.
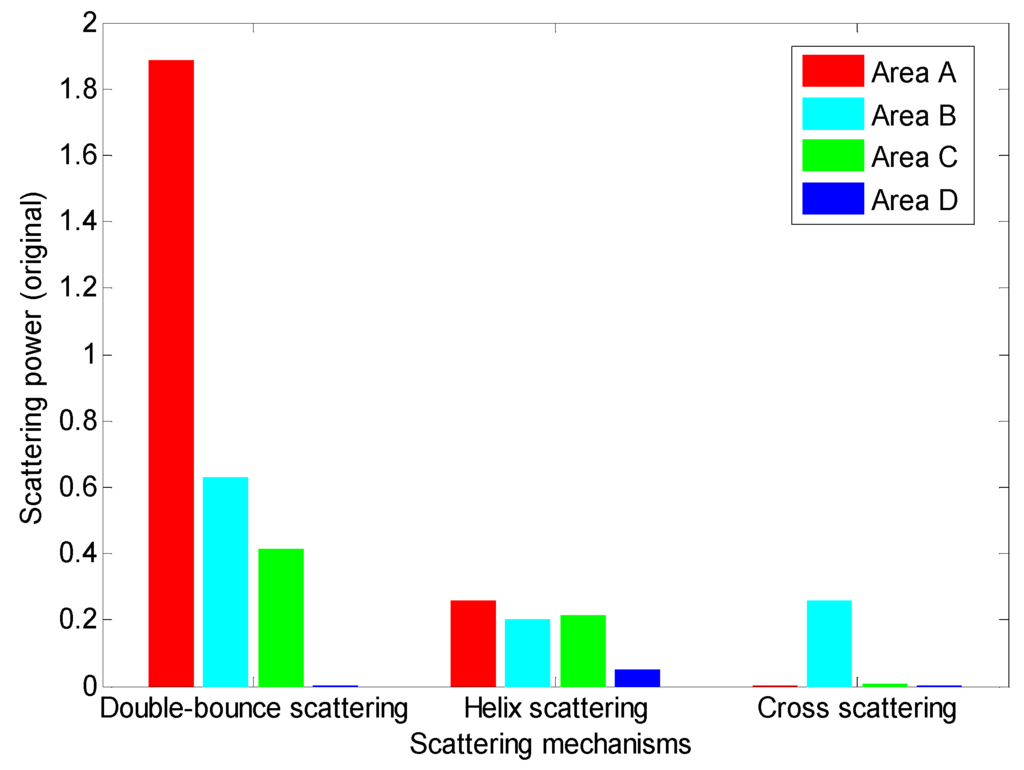
Figure 5.
Quantitative comparison among the double-bounce, helix and cross scattering powers from our decomposition for four selected areas in Figure 4d.
4.2. Analysis of the Average Coherence Coefficient Ratio on Built-up Area Detection
Firstly, in order to compare the performance of different correlation coefficients, we give the magnitudes of , , and , as shown in the left column of Figure 6. The window size for the calculations is set to . Four test areas corresponding to buildings parallel to the radar flight pass, oriented buildings, forests, and water are selected from the magnitude images for quantitative evaluation. It is worth noting that the test area of forests is not the same one in Figure 4. As stated in the previous subsection, some forests may exhibit weak cross scattering due to the L band penetration, which results in false alarms. Therefore, the polarimetric coherence of these areas should be analyzed in this subsection for the sake of false alarms removal. The histograms of these areas are shown in the right column of Figure 6. It can be seen from Figure 6a–d that and cannot effectively discriminate the four land covers, where oriented buildings are seriously mixed up with forests. In addition, it is not easy to accurately extract buildings which are parallel to the radar flight pass because there are some magnitude values mixed up with other land covers, as shown in Figure 6b,d. in Figure 6e seems better than and , where the magnitude difference between built-up areas and natural areas is apparent. However, from Figure 6f, we can see that some oriented buildings are still mixed up with natural areas due to the similar magnitude values.
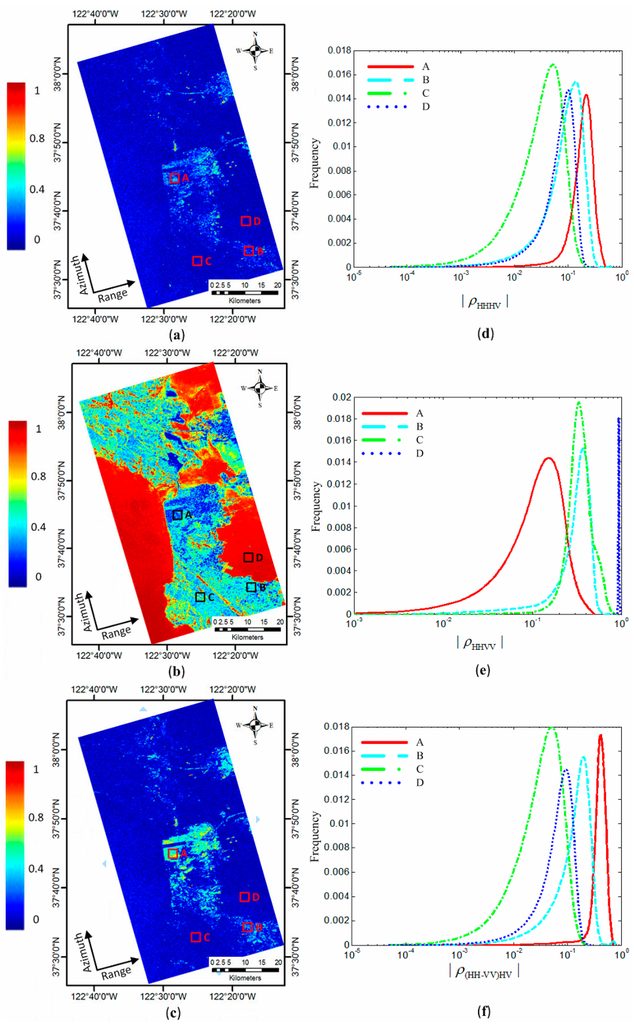
Figure 6.
Magnitudes of correlation coefficients and histograms of selected patches: (a–c) the magnitudes of , , and , respectively; and (d–f) the histograms of the four selected patches in (a–c), respectively.
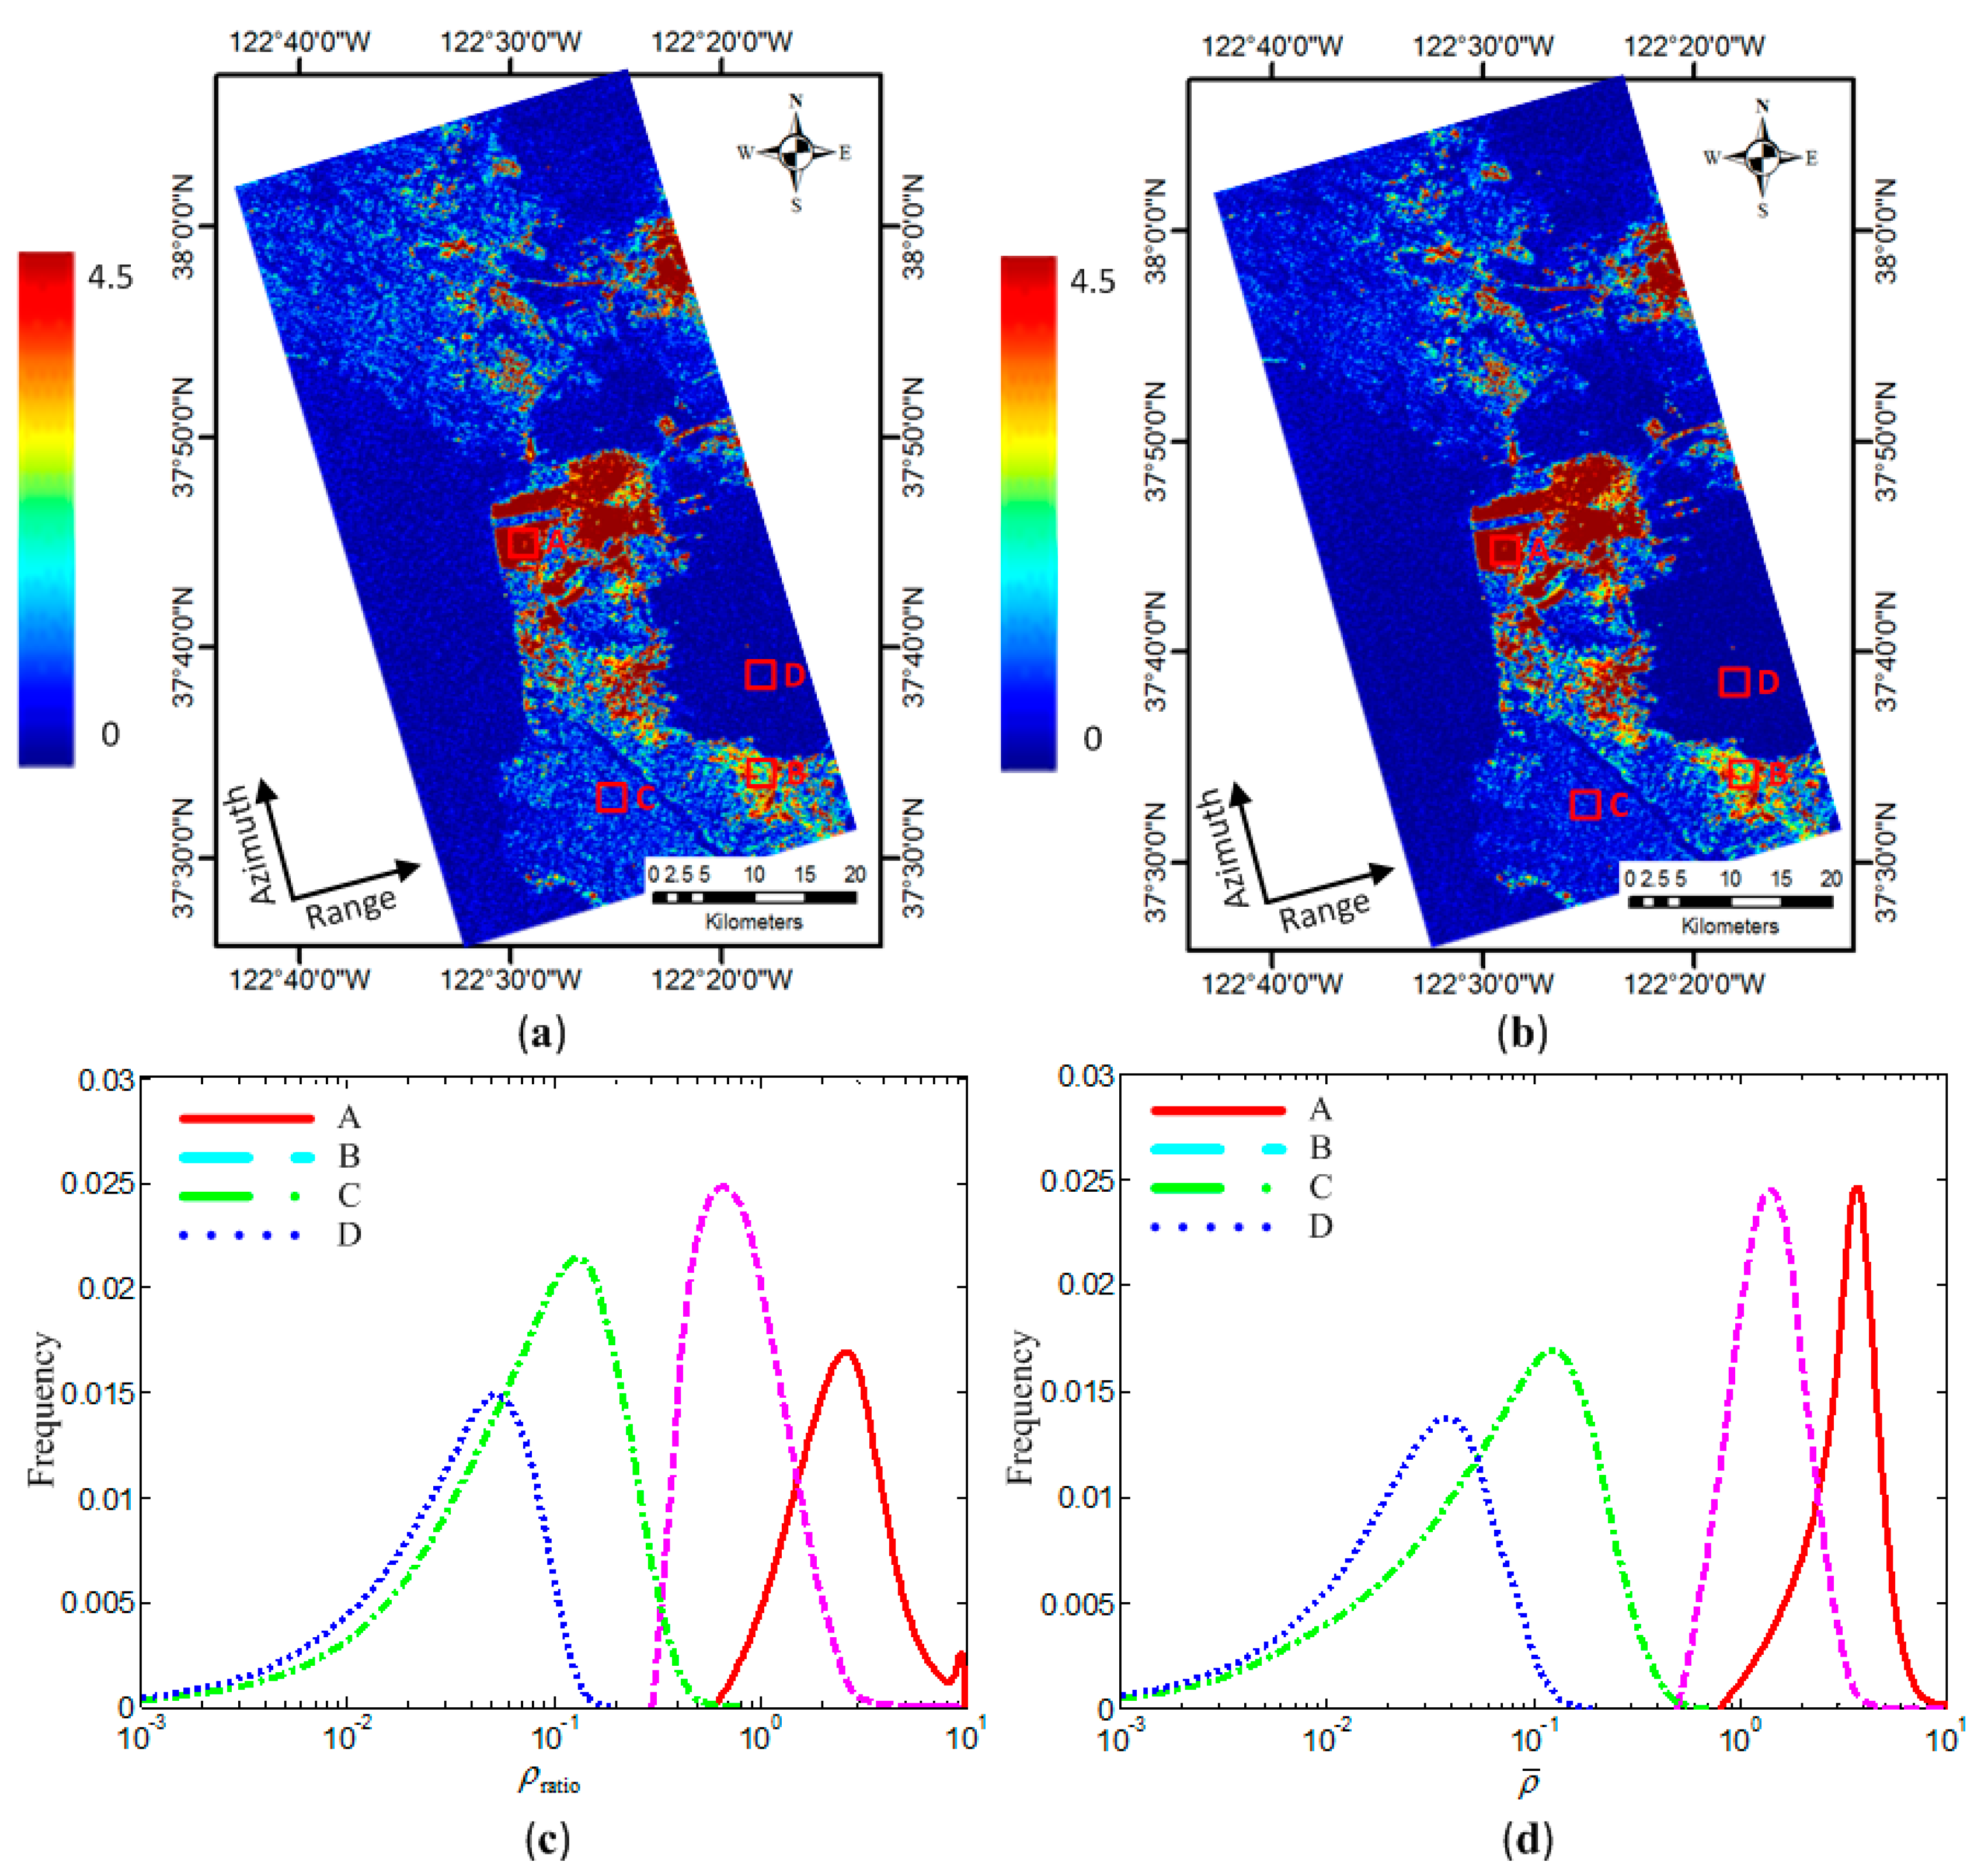
Figure 7 shows the results of our proposed coherence coefficient ratio, where Figure 7a is and Figure 7b is . To further evaluate the performance of sub-aperture decomposition, we select the same four test areas and give the corresponding histograms in Figure 7c,d, as well as the average and within each area in Table 2. What we can see from Figure 7 is that and perform much better than other coherence coefficients. Buildings that are parallel to the radar flight pass have quite high ratio values, making them very easy to be discriminated from other land covers. Compared to the results in Figure 6, the difference between oriented buildings and forests in Figure 7 becomes much larger, indicating that our method is capable of distinguishing these two kinds of targets. The reason is that our proposed coherence coefficient ratio considers not only the reflection asymmetry of buildings but also the scattering divergence between co-polarized and cross-polarized channels, which can improve the ability of built-up area extraction. The results in Figure 7a,b are similar except for the forest areas. From Figure 7c,d and Table 2, it can be found that after considering sub-aperture decomposition, the difference between built-up areas and natural areas becomes larger than before, especially for the oriented buildings and forests. This improvement benefits from the sub-aperture images, which can exploit more information than the original image since the former can acquire target scattering information with several radar look angles. Another issue should be discussed is the threshold . From Table 2 we can observe that the values of and in built-up areas are both above 1.2 whereas the values in natural areas are below 1.2. It is worth pointing out that since there are some false alarms in the detection of Section 4.1, we need to remove the forests in this detection and should set the as a high value. Therefore, we set in this study.
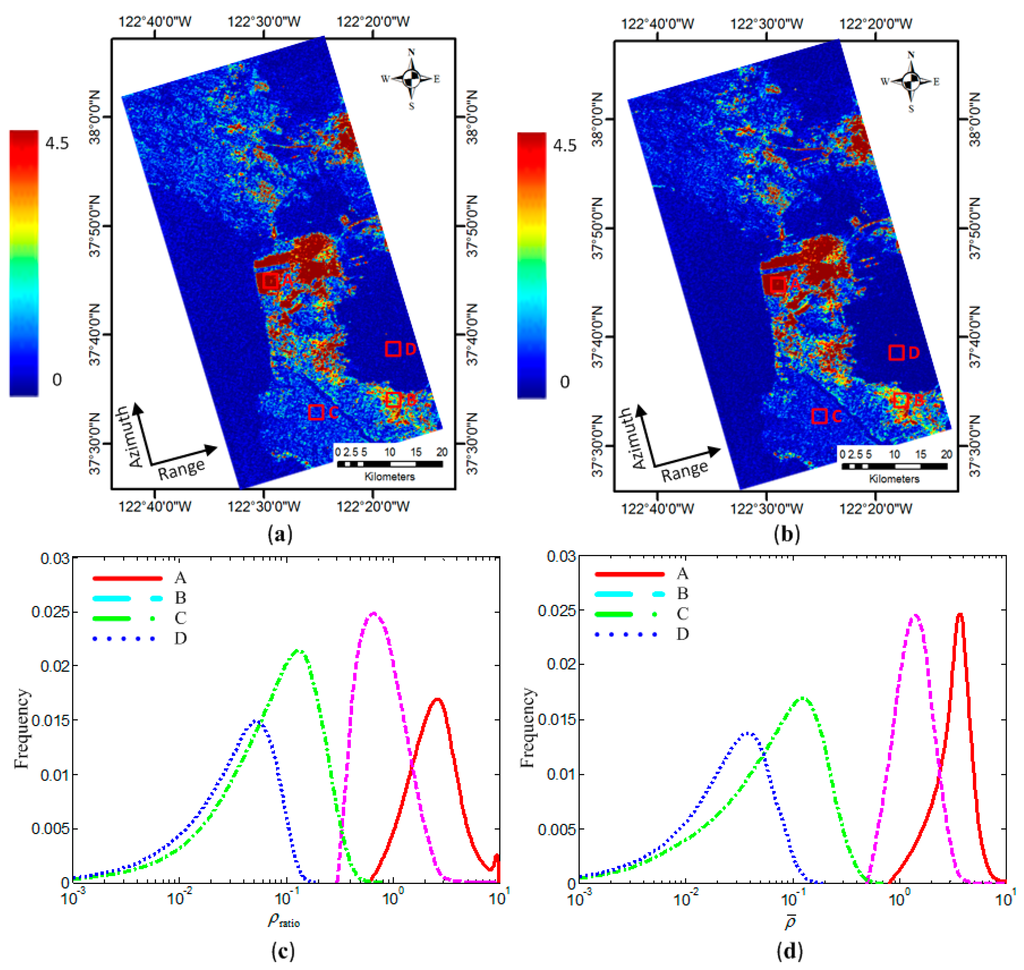
Figure 7.
The proposed coherence coefficient ratio: (a) ; (b) ; and (c,d) histograms of the four selected patches in (a,b), respectively.
Table 2.
Comparison of and in four areas. Values are averaged within each area.
4.3. Comparison of the Detection Results with and without Fusion
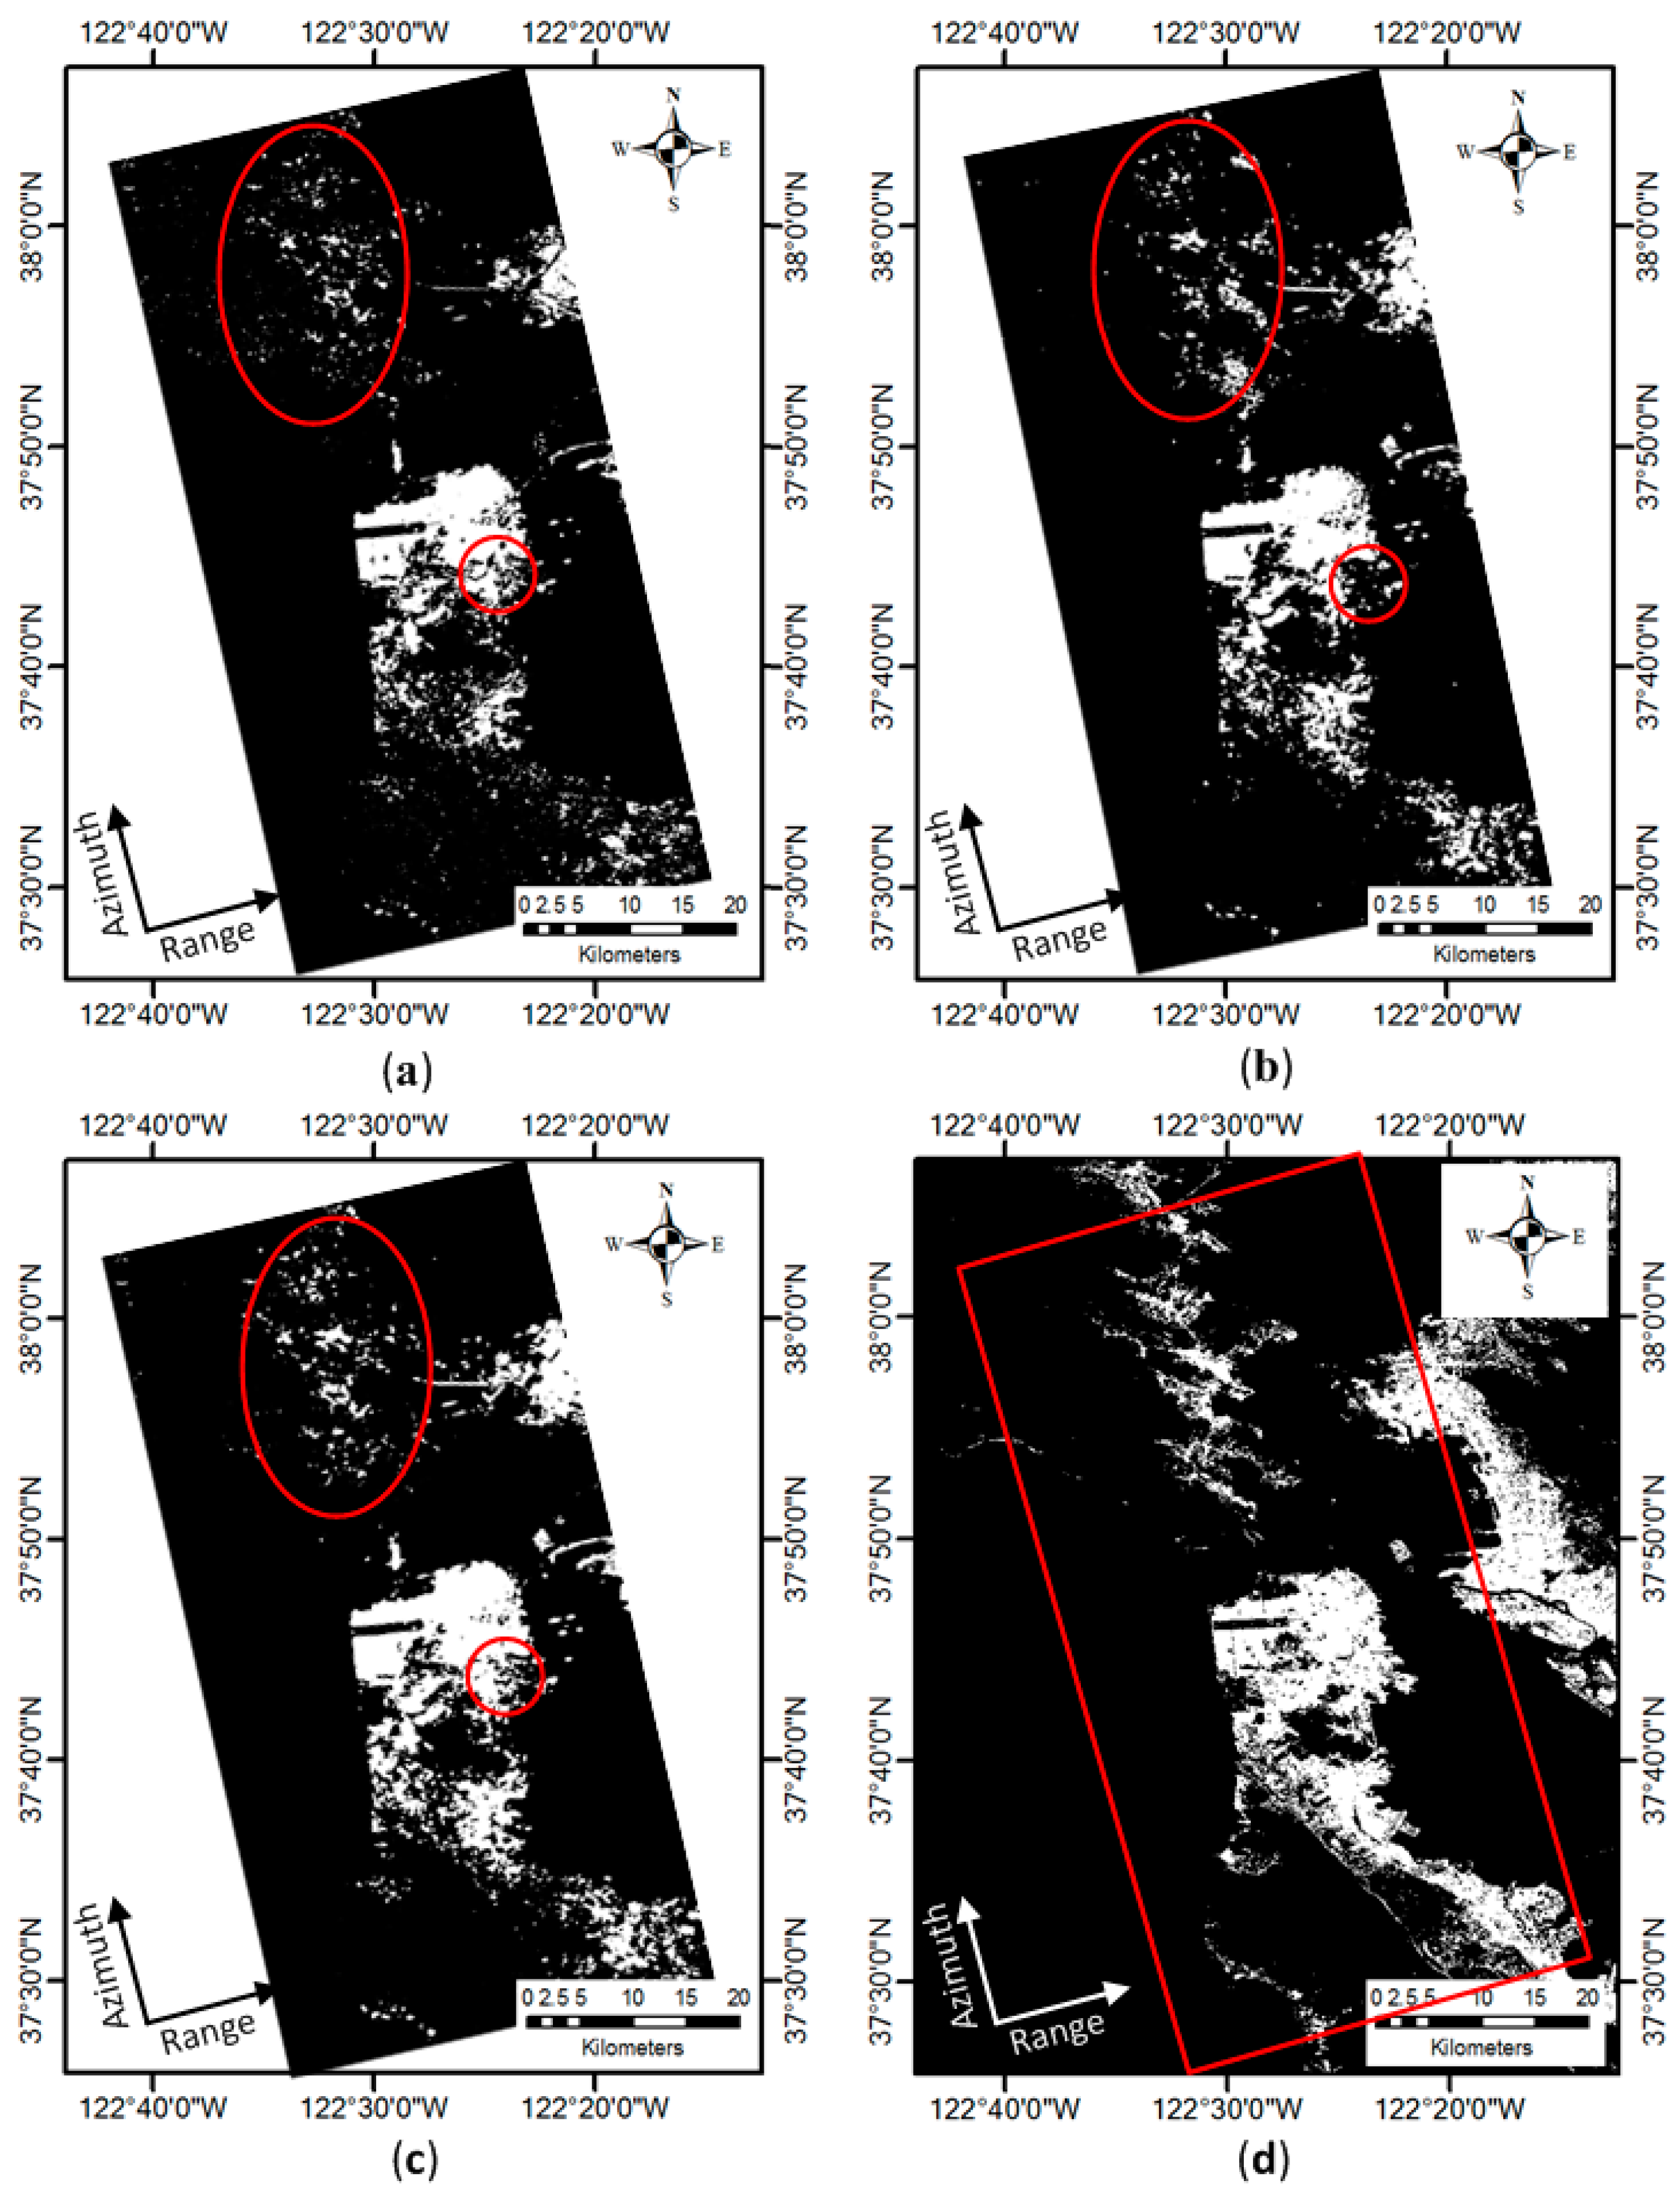
This subsection gives the individual detection results using Condition 1, Condition 2, and the final detection result using the FCP fusion method. Moreover, the urban extraction method in [9] is implemented for comparison, which fuses the polarimetric and texture information of PolSAR data. To quantitatively evaluate the detection performance, four indices, i.e., overall accuracy (OA), Kappa Coefficient (KC), user’s accuracy (UA) and producer’s accuracy (PA) are utilized for comparison. Figure 8a–c gives the built-up area detection results using the scattering powers, the average coherence ratio, and the FCP fusion method, respectively. Figure 8d is the urban ground truth from NLCD 2006 land cover data. From Figure 8a we can see that using the two decomposed scattering powers, most of the buildings can be effectively extracted. The oriented building can be identified thanks to the cross scattering power, as shown in the areas marked with red ellipse and circle. Nevertheless, some forests are incorrectly detected as buildings due to the weak cross scattering power. What we can see from Figure 8b is that most of the forests are removed from the detection result. Buildings parallel to the radar flight pass and oriented buildings are both well extracted although there are few omissions. The main problem of this result is there are some water areas detected as buildings, as shown in the area marked with red ellipse. It should be noted that these areas are in the shadows of the mountain. Since the radar illumination direction is from left to right, the scattering mechanism in these areas is not surface scattering. Therefore, these water areas exhibit high average coherence coefficient ratio values. The result in Figure 8c is satisfactory, where we can see that most of the forests in Figure 8a and the water areas in Figure 8b are removed. Note that this improvement comes from the FCP fusion method, which considers the fusion of prior probability, conditional probability, and weighting parameters to generate a reasonable posterior probability for each class. It is worth mentioning that there are some ships and bridges miss-detected as built-up areas in Figure 8. The reason is that similar to buildings, these man-made targets also exhibit strong double-bounce scattering and polarimetric coherence.
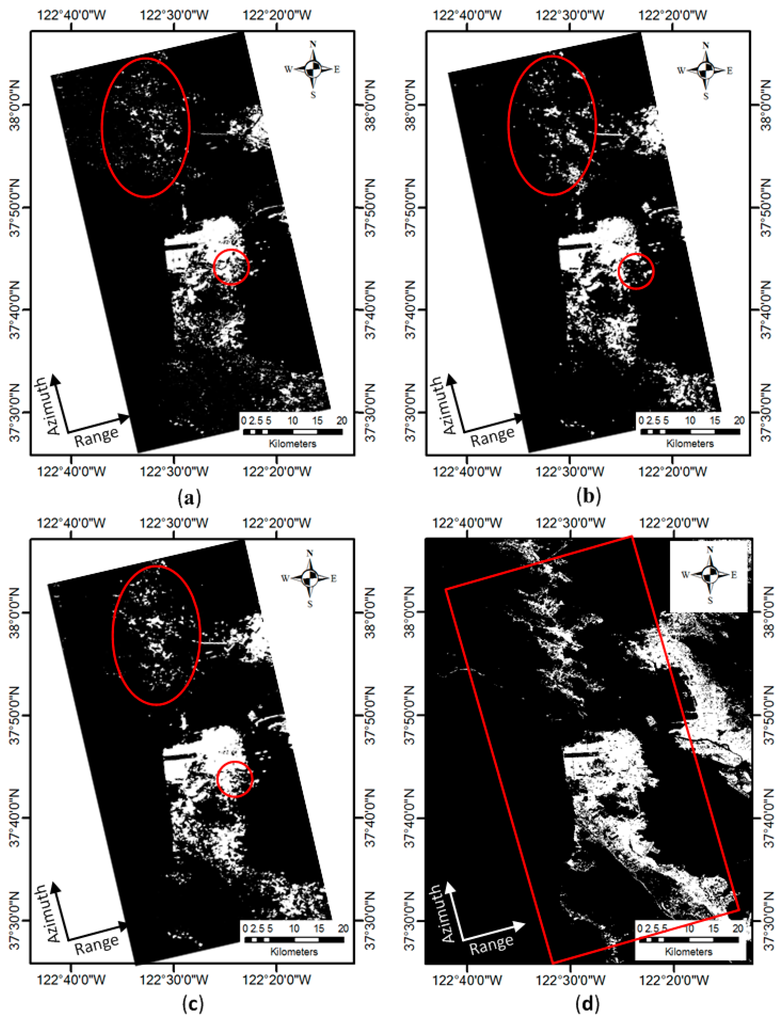
Figure 8.
Built-up area extraction using the scattering powers, the average coherence coefficient ratio and the FCP fusion, where the white represents the building areas and the black areas are the non-buildings: (a) detection results using Condition 1; (b) detection results using Condition 2; (c) fused detection results; and (d) urban ground truth from NLCD 2006 land cover data, where the red rectangle represents the study area.
Table 3 gives the accuracy assessment of three detection results in Figure 8. The whole image is employed for accuracy assessment. As reflected in Table 3, the OA, KC, UA, and PA are all improved after fusion. Compared with the detection result using scattering powers and the detection using average coherence coefficient ratio, after the FCP fusion, the OA is increased by 3.79% and 6.78%, respectively. This fact demonstrates that our previously proposed polarimetric decomposition and the newly proposed average coherence coefficient ratio can effectively identify the built-up areas and it is promising to fuse these two detection results.
Table 3.
Comparison of the different detection results in Figure 8.
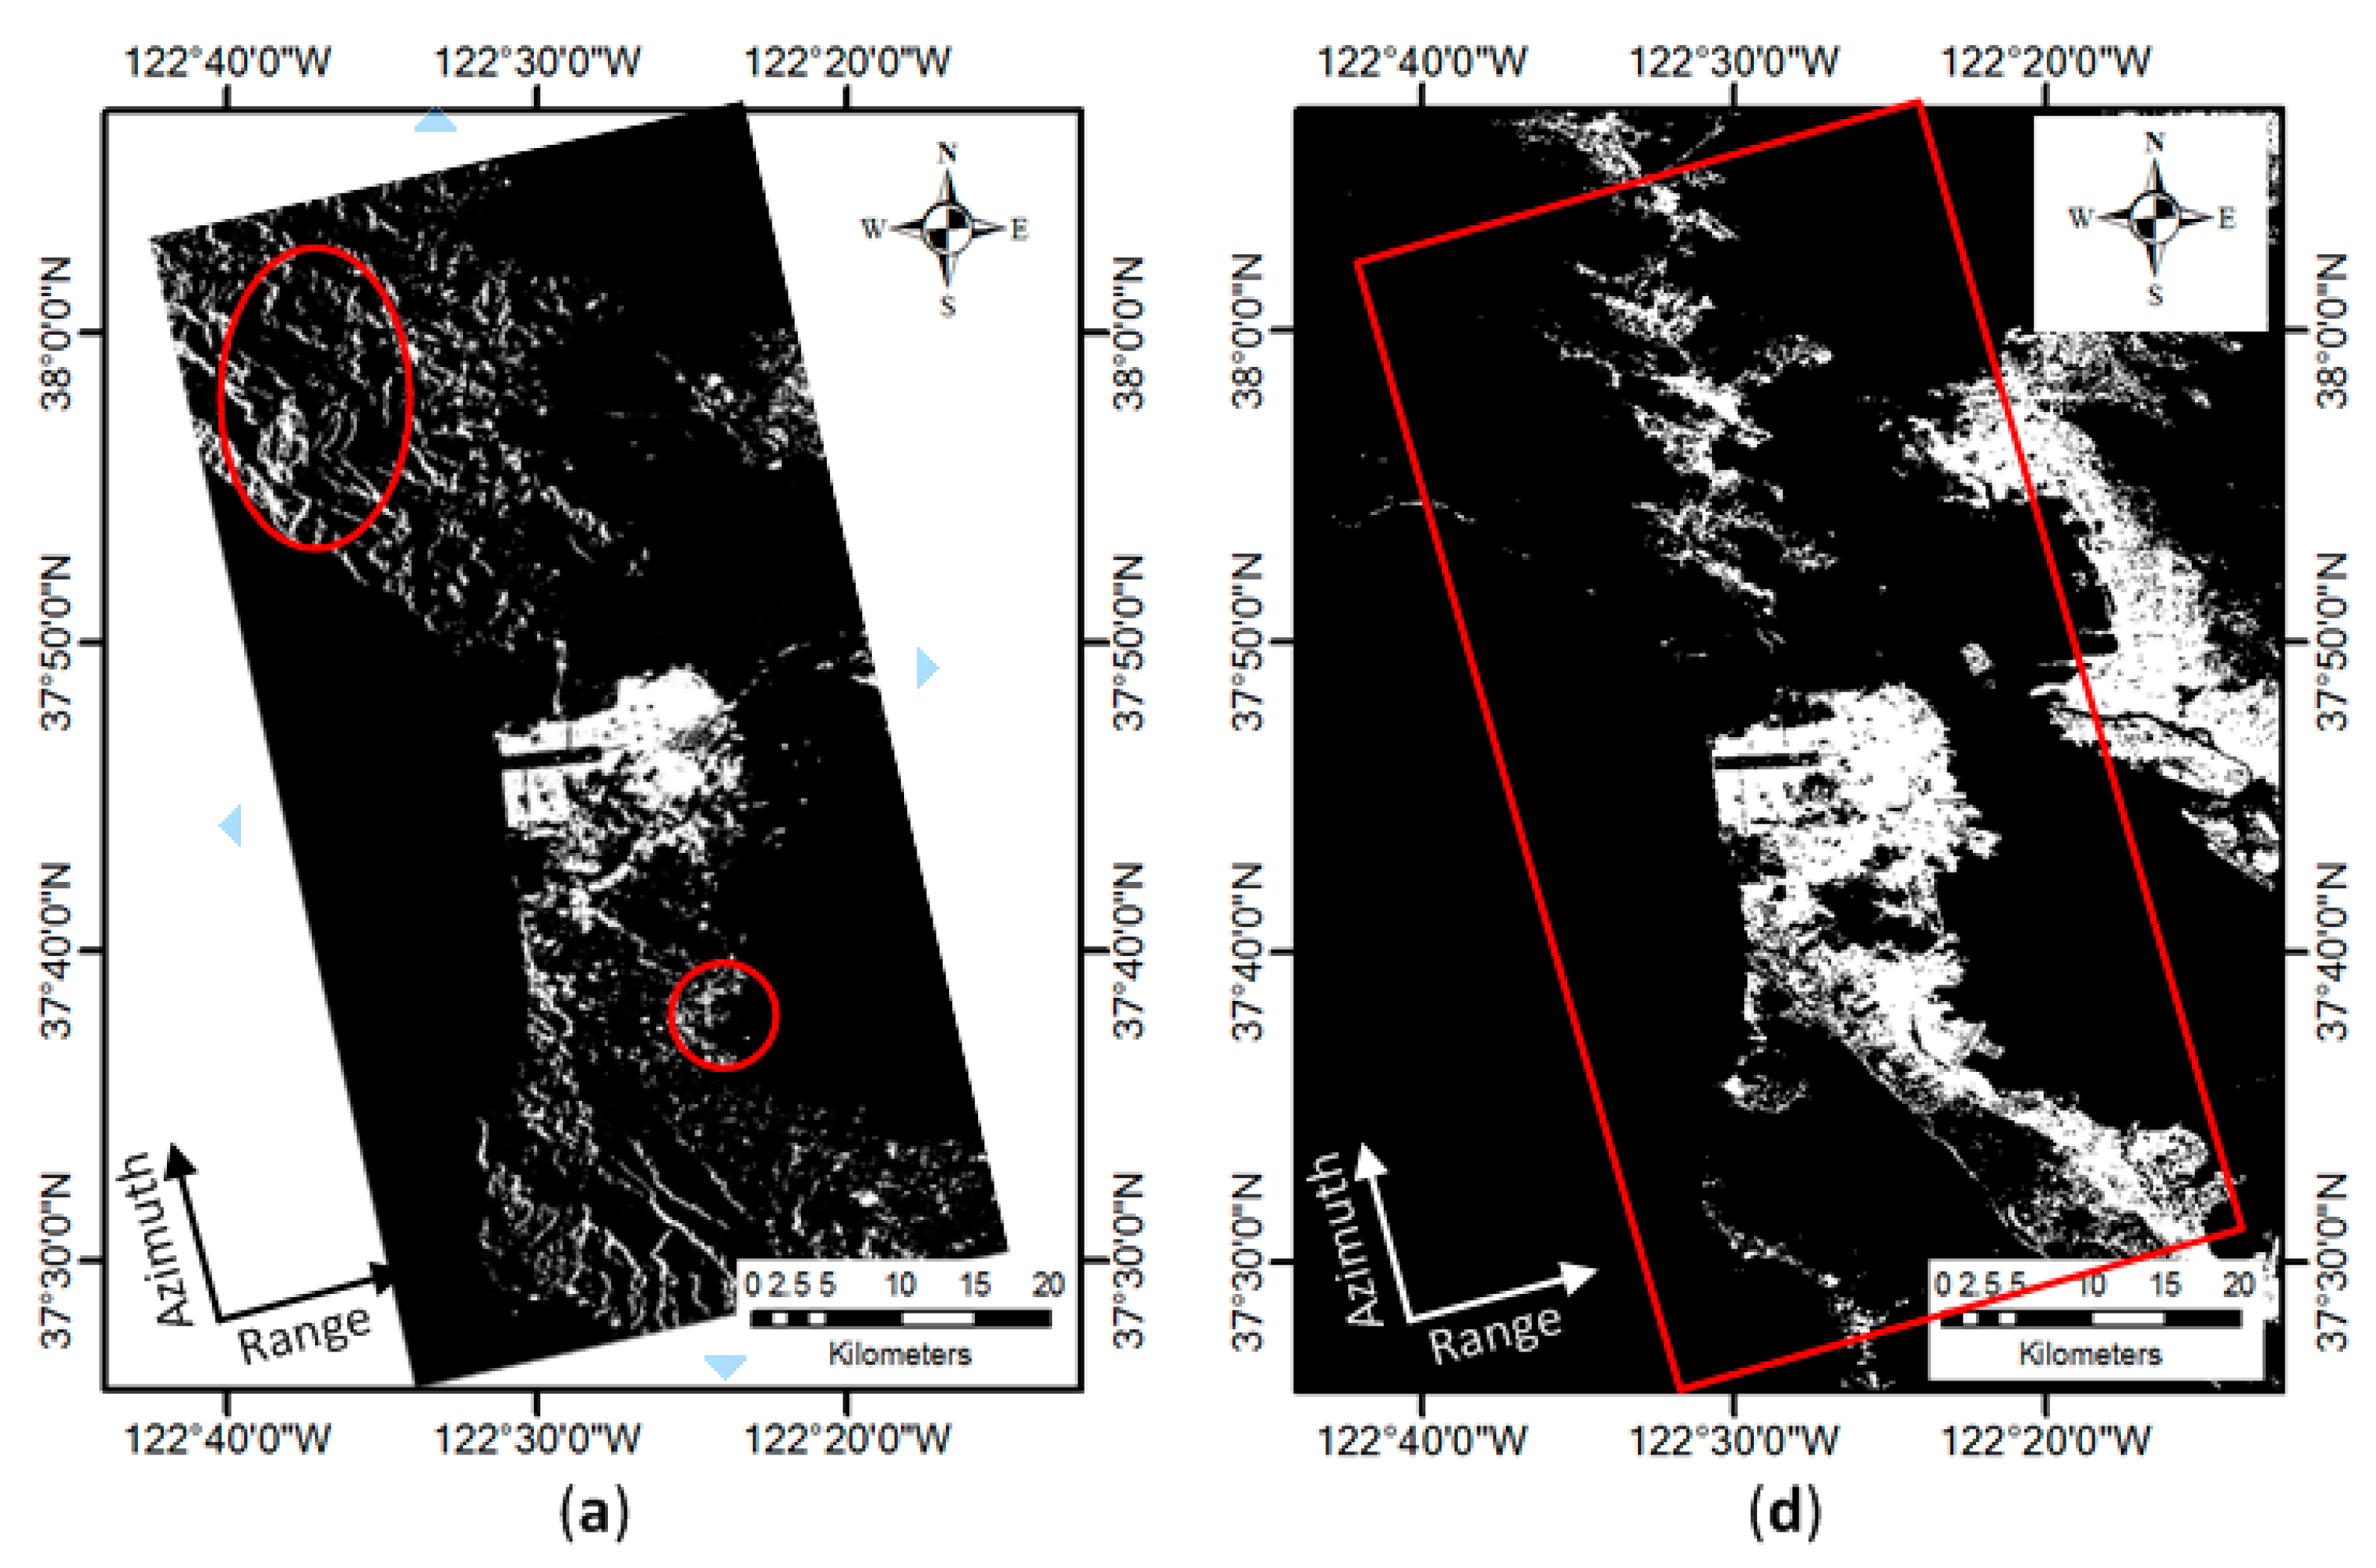
The detection result using the method in [9] is shown in Figure 9 and the accuracy assessment is given in Table 4. It can be seen from Figure 9 that a large number of mountains and forests are detected as buildings, as shown in the area marked with red ellipse, making the OA become much lower than that of the proposed method. In addition, some of the oriented buildings are not well extracted. This extraction method combines the H/α/A-Wishart unsupervised classification and the grey-level co-occurrence matrix (GLCM) texture features of the span image. Therefore the detection of oriented buildings can be improved to some extent since the polarimetric and textural information are both considered. However, it cannot handle the removal of mountains and forests because scattering ambiguity still exists. This detection method is effective for flat city areas and does not work very well in the areas with large terrain slopes. Note that the mountains can be removed with the help of digital elevation model. Therefore, only GLCM texture information is not enough for building extraction from PolSAR data.
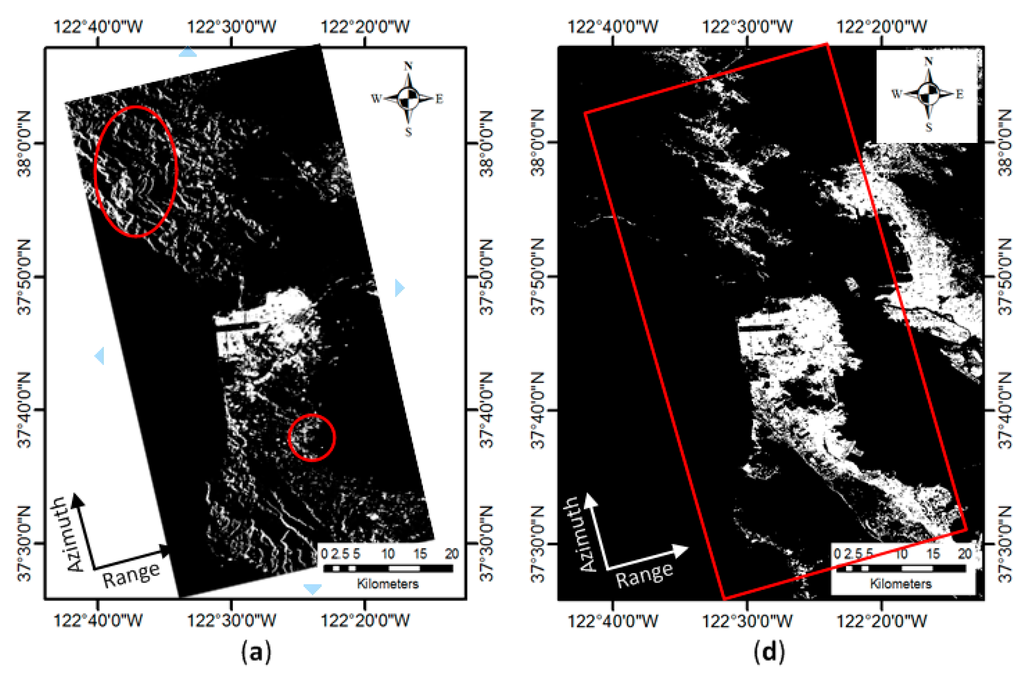
Figure 9.
Built-up area extraction using the method in [9], where the white represents the building areas and the black areas are the non-buildings: (a) detection results; and (b) urban ground truth from NLCD 2006 land cover data, where the red rectangle represents the study area.
Table 4.
Accuracy assessment of the detection result in Figure 9.
4.4. Discussion on the Detection Thresholds
There are three thresholds utilized in our proposed method, i.e., , and the threshold of cross scattering power. As we discussed in Section 2.1, the cross scattering mainly occurs in oriented buildings and usually disappears in natural areas, the threshold of cross scattering power is set to 0. This can be applicable to other PolSAR data with C band and X band since the cross scattering power in forests is weaker with shorter wavelength [30]. Regarding and , it is difficult to find a general value because the land covers exhibit quite different scattering powers in different PolSAR images. Therefore, in this paper we utilize the distributions of some training samples to determine the thresholds. It is worth mentioning that for one specified PolSAR image, these two parameters can be determined automatically from the whole corresponding histograms via the histogram thresholding method [49]. Note that the main difficulty is to avoid the local minimum.
5. Conclusions
In this paper, we evaluated the performance of double-bounce scattering power and cross scattering power generated by our previously proposed decomposition technique on built-up area detection. Buildings parallel to the radar flight pass exhibit strong double-bounce scattering power while oriented buildings have significant cross scattering power. In contrast, these two scattering powers in natural areas are quite weak, which is beneficial to the identification of buildings. Another building detection methodology was proposed using a new average coherence coefficient ratio, which considers the reflection asymmetry of buildings and the scattering divergence between co-polarized and cross-polarized channels. This method can effectively remove the false alarms of forests and also improve the detection of oriented buildings. These two preliminary results were finally fused using a correlated probabilities decision fusion method. The overall detection accuracy is increased by 3.79% and 6.78% compared to the individual detection results. Our method was also compared to another building detection method, which fused the H/α/A-Wishart unsupervised classification and the GLCM texture features. The results demonstrated that our method can effectively extract the built-up areas even with large terrain slopes. The scattering mechanism ambiguity between buildings and natural areas can be suppressed.
Although our method can effectively discriminate built-up areas from natural areas, it was only validated using the PALSAR L-band data. Future research will focus on the validation using C-band and X-band data. Moreover, our method only considers the polarimetric information, inspired by the method in [9], textural information from the span image can be incorporated into our method to further improve the overall detection accuracy.
Acknowledgments
This work was supported in part by the National Natural Science Foundation of China (61201338, 61271004, and 61471286), in part by Doctoral Innovation Project of National University of Defense Technology (B130406). The authors would like to thank the Third Radar Polarimetry Training Course held by ESA for the PALSAR dataset and U.S. Geological Survey (USGS) for the National Land Cover Database 2006 (NLCD 2006).
Author Contributions
Deliang Xiang is responsible for the design of the methodology, experimental data collection and processing, as well as preparation of the manuscript. Tao Tang, Canbin Hu, and Qinghui Fan helped analyze and discuss the results. Yi Su is responsible for the technical support of the manuscript.
Conflicts of Interest
The authors declare no conflict of interest.
References
- Zhai, W.; Shen, H.; Huang, C.; Pei, W. Building earthquake damage information extraction from a single post-earthquake PolSAR image. Remote Sens. 2016, 8. [Google Scholar] [CrossRef]
- Zhao, L.; Yang, J.; Li, P.; Zhang, L.; Shi, L.; Lang, F. Damage assessment in urban areas using post-earthquake airborne POLSAR imagery. Int. J. Remote Sens. 2013, 34, 8952–8966. [Google Scholar] [CrossRef]
- Kajimoto, M.; Susaki, J. Urban-area extraction from polarimetric SAR images using polarization orientation angle. IEEE Geosci. Remote Sens. Lett. 2013, 10, 337–341. [Google Scholar] [CrossRef]
- Yamaguchi, Y. Disaster monitoring by fully polarimetric SAR data acquired with ALOS-PALSAR. Proc. IEEE 2012, 100, 2851–2860. [Google Scholar] [CrossRef]
- Li, X.; Guo, H.; Zhang, L.; Chen, X.; Liang, L. A new approach to collapsed building extraction using Radarsat-2 polarimetric SAR imagery. IEEE Geosci. Remote Sens. Lett. 2012, 9, 677–681. [Google Scholar]
- Wang, Y.; Tupin, F.; Han, C. Building detection from high-resolution PolSAR data at the rectangle level by combining region and edge information. Pattern Recognit. Lett. 2010, 31, 1077–1088. [Google Scholar] [CrossRef]
- Soergel, U. Radar Remote Sensing of Urban Areas; Springer: Berlin, Germany, 2010; Volume 15, p. 277. [Google Scholar]
- Guo, H.; Li, X.; Zhang, L. Study of detecting method with advanced airborne and spaceborne synthetic aperture radar data for collapsed urban buildings from the Wenchuan earthquake. J. Appl. Remote Sens. 2009, 3. [Google Scholar] [CrossRef]
- Zhai, W.; Shen, H.; Huang, C.; Pei, W. Fusion of polarimetric and texture information for urban building extraction from fully polarimetric SAR imagery. Remote Sens. Lett. 2016, 7, 31–40. [Google Scholar] [CrossRef]
- Chen, S.; Sato, M. Tsunami damage investigation of built-up areas using multitemporal spaceborne full polarimetric SAR images. IEEE Trans. Geosci. Remote Sens. 2013, 51, 1985–1997. [Google Scholar] [CrossRef]
- Huynen, J.R. Phenomenological Theory of Radar Targets. Ph.D. Thesis, Delft University of Technology, Delft, The Netherlands, 1970. [Google Scholar]
- Cloude, S.R.; Pottier, E. A review of target decomposition theorems in radar polarimetry. IEEE Trans. Geosci. Remote Sens. 1996, 34, 498–518. [Google Scholar] [CrossRef]
- Holm, W.A.; Barnes, R.M. On radar polarization mixed target state decomposition techniques. In Proceedings of the 1988 IEEE National Radar Conference, Ann Arbor, MI, USA, 20–21 April 1988; pp. 249–254.
- Van Zyl, J.J. Application of cloude’s target decomposition theorem to polarimetric imaging radar data. Proc. SPIE Radar Polarim. 1993, 1748. [Google Scholar] [CrossRef]
- Yamaguchi, Y.; Yajima, Y.; Yamada, H. A four-component decomposition of PolSAR images based on the coherency matrix. IEEE Geosci. Remote Sens. Lett. 2005, 3, 292–296. [Google Scholar] [CrossRef]
- Yamaguchi, Y.; Moriyama, T.; Ishido, M.; Yamada, H. Four-component scattering model for polarimetric SAR image decomposition. IEEE Trans. Geosci. Remote Sens. 2005, 43, 1699–1706. [Google Scholar] [CrossRef]
- Freeman, A.; Durden, S.L. A three-component scattering model for polarimetric SAR data. IEEE Trans. Geosci. Remote Sens. 1998, 36, 963–973. [Google Scholar] [CrossRef]
- Pellizzeri, T.M. Classification of polarimetric SAR images of suburban areas using joint annealed segmentation and “H/A/α” polarimetric decomposition. ISPRS J. Photogramm. Remote Sens. 2003, 58, 55–70. [Google Scholar] [CrossRef]
- Deng, L.; Yan, Y.-N.; Sun, C. Use of sub-aperture decomposition for supervised PolSAR classification in urban area. Remote Sens. 2015, 7, 1380–1396. [Google Scholar] [CrossRef]
- Deng, L.; Wang, C. Improved building extraction with integrated decomposition of time-frequency and entropy-alpha using polarimetric SAR data. IEEE J. Sel. Top. Appl. Earth Obs. 2014, 7, 4058–4068. [Google Scholar] [CrossRef]
- Ainsworth, T.L.; Schuler, D.L.; Lee, J.S. Polarimetric SAR characterization of man-made structures in urban areas using normalized circular-pol correlation coefficients. Remote Sens. Environ. 2008, 112, 2876–2885. [Google Scholar] [CrossRef]
- Lee, K.-Y.; Oh, Y.; Kim, Y. Phase-difference of urban area in polarimetric SAR images. Electron. Lett. 2012, 48, 1367–1368. [Google Scholar] [CrossRef]
- Ferro-Famil, L.; Lavalle, M. In detection and analysis of urban areas using ALOS PALSAR polarimetric data. In Proceedings of the 2009 IEEE International Geoscience and Remote Sensing Symposium, Cape Town, South Africa, 12–17 July 2009; pp. V-142–V-145.
- Reigber, A.; Jager, M.; He, W.; Ferro-Famil, L.; Hellwish, O. Detection and classification of urban structures based on high-resolution SAR. In Proceedings of the Urban Remote Sensing Joint Event 2007 (JURSE’07), Paris, France, 11–13 April 2007; Volume 1, pp. 1–6.
- Azmedroub, B.; Ouarzeddine, M.; Souissi, B. Extraction of urban areas from polarimetric SAR imagery. IEEE J. Sel. Top. Appl. Earth Obs. 2016, 9, 2583–2591. [Google Scholar] [CrossRef]
- Zou, B.; Lu, D.; Wu, Z.; Qiao, Z. Urban-area extraction from polarimetric SAR image using combination of target decomposition and orientation angle. Proc. SPIE Radar Sens. Technol. 2016, 9829. [Google Scholar] [CrossRef]
- Chen, S.-W.; Ohki, M.; Shimada, M.; Sato, M. Deorientation effect investigation for model-based decomposition over oriented built-up areas. IEEE Geosci. Remote Sens. Lett. 2013, 10, 273–277. [Google Scholar] [CrossRef]
- Zou, B.; Lu, D.; Zhang, L.; Moon, W.M. Eigen-decomposition-based four-component decomposition for PolSAR data. IEEE J. Sel. Top. Appl. Earth Obs. 2016, 9, 1286–1296. [Google Scholar] [CrossRef]
- Zou, B.; Zhang, Y.; Cao, N.; Minh, N.P. A four-component decomposition model for PolSAR data using asymmetric scattering component. IEEE J. Sel. Top. Appl. Earth Obs. 2015, 8, 1051–1061. [Google Scholar] [CrossRef]
- Xiang, D.; Ban, Y.; Su, Y. Model-based decomposition with cross scattering for polarimetric SAR urban areas. IEEE Geosci. Remote Sens. Lett. 2015, 12, 2496–2500. [Google Scholar] [CrossRef]
- Kusano, S.; Takahashi, K.; Sato, M. A new decomposition of a PolSAR coherency matrix using a generalized scattering model. IEEE J. Sel. Top. Appl. Earth Observ. 2015, 8, 3933–3940. [Google Scholar] [CrossRef]
- Zhang, L.; Zou, B.; Cai, H.; Zhang, Y. Multiple-component scattering model for polarimetric SAR image decomposition. IEEE Geosci. Remote Sens. Lett. 2008, 5, 603–607. [Google Scholar] [CrossRef]
- Xiang, D.; Tang, T.; Ban, Y.; Su, Y.; Kuang, G. Unsupervised polarimetric SAR urban area classification based on model-based decomposition with cross scattering. ISPRS J. Photogramm. Remote Sens. 2016, 116, 86–100. [Google Scholar] [CrossRef]
- Lee, J.-S.; Pottier, E. Polarimetric Radar Imaging: From Basics to Applications; CRC Press: Boca Raton, FL, USA, 2009. [Google Scholar]
- Xiao, S.; Chen, S.; Chang, Y.; Li, Y. Polarimetric coherence optimization and its application for manmade target extraction in PolSAR data. IEICE Trans. Electron. 2014, 97, 566–574. [Google Scholar] [CrossRef]
- Ferro-Famil, L.; Reigber, A.; Pottier, E.; Boerner, W.M. Scene characterization using subaperture polarimetric SAR data. IEEE Trans. Geosci. Remote Sens. 2003, 41, 2264–2276. [Google Scholar] [CrossRef]
- Spigai, M.; Tison, C.; Souyris, J.-C. Time-frequency analysis in high-resolution SAR imagery. IEEE Trans. Geosci. Remote Sens. 2011, 49, 2699–2711. [Google Scholar] [CrossRef]
- Zhang, J.; Xu, J.; Peng, Y.; Wang, X. Speckle filtering of SAR images based on sub-aperture technique and principal component analysis. In Proceedings of the IEEE International Symposium on Communications and Information Technology, Beijing, China, 12–14 October 2005; pp. 1217–1222.
- Ainsworth, T.; Jansen, R.; Lee, J.; Fiedler, R. Sub-aperture analysis of high-resolution polarimetric SAR data. In Proceedings of the IEEE International Geoscience and Remote Sensing Symposium, Hamburg, Germany, 28 June–2 July 1999; pp. 41–43.
- Hu, C.; Ferro-Famil, L.; Kuang, G. Ship discrimination using polarimetric SAR data and coherent time-frequency analysis. Remote Sens. 2013, 5, 6899–6920. [Google Scholar] [CrossRef]
- Wu, W.; Guo, H.; Li, X. Urban area man-made target detection for PolSAR data based on a nonzero-mean statistical model. IEEE Geosci. Remote Sens. Lett. 2014, 11, 1782–1786. [Google Scholar] [CrossRef]
- Wu, W.; Guo, H.; Li, X. Man-made target detection in urban areas based on a new azimuth stationarity extraction method. IEEE J. Sel. Top. Appl. Earth Obs. 2013, 6, 1138–1146. [Google Scholar] [CrossRef]
- Wu, W.; Guo, H.; Li, X. Urban area SAR image man-made target extraction based on the product model and the time—Frequency analysis. IEEE J. Sel. Top. Appl. Earth Obs. 2015, 8, 943–952. [Google Scholar] [CrossRef]
- Xiang, D.; Tang, T.; Ban, Y.; Su, Y. Man-made target detection from polarimetric SAR data via nonstationarity and asymmetry. IEEE J. Sel. Top. Appl. Earth Obs. 2016, 9, 1459–1469. [Google Scholar] [CrossRef]
- O’Brien, J. An algorithm for the fusion of correlated probabilities. In Proceedings of the First International Conference on Multisource-Multisensor Information Fusion (FUSION’98), Las Vegas, NV, USA, 6–9 July 1998; pp. 565–571.
- Mazher, A.; Li, P.; Moughal, T.A.; Xu, H. A decision fusion method using an algorithm for fusion of correlated probabilities. Int. J. Remote Sens. 2016, 37, 14–25. [Google Scholar] [CrossRef]
- Fry, J.A.; Xian, G.; Jin, S.; Dewitz, J.A.; Homer, C.G.; Limin, Y.; Barnes, C.A.; Herold, N.D.; Wickham, J.D. Completion of the 2006 national land cover database for the conterminous united states. Photogramm. Eng. Remote Sens. 2011, 77, 858–864. [Google Scholar]
- Lee, J.-S.; Grunes, M.R.; De Grandi, G. Polarimetric SAR speckle filtering and its implication for classification. IEEE Trans. Geosci. Remote Sens. 1999, 37, 2363–2373. [Google Scholar]
- Otsu, N. A threshold selection method from gray-level histograms. Automatica 1975, 11, 23–27. [Google Scholar]


© 2016 by the authors; licensee MDPI, Basel, Switzerland. This article is an open access article distributed under the terms and conditions of the Creative Commons Attribution (CC-BY) license (http://creativecommons.org/licenses/by/4.0/).