Abstract
The panchromatic and multispectral (PMS) sensor is an optical imaging sensor aboard the Gao Fen-1 (GF-1) satellite. This work describes an approach to validate the calibration coefficients of the PMS sensors based on the image data of the Landsat 8 Operational Land Imager (OLI). Two image pairs, one obtained over the Dunhuang test site and the other over the Golmud test site, were used in this paper. Two spectral band adjustment factors (SBAF), given as the radiance SBAF and reflectance SBAF, were applied to correct the differences in the respective images caused by the relative spectral responses of the PMS sensor and OLI. Uncertainties in the SBAF values arising from atmospheric parameters and the absence of a measured ground spectrum were analyzed in this paper. The results show that the average relative differences of top-of-atmosphere radiance and reflectance values for each band between the PMS sensor and OLI images are 2%–5% for most bands, after SBAF correction with a measured ground spectrum or fitted spectrum. It is demonstrated that the OLI image can be used to validate the calibration coefficient of the PMS sensor, even if the image pairs are not imaged on the same day.
1. Introduction
The Gao Fen-1 (GF-1) satellite was launched on 26 April 2013 from Jiuquan Satellite Launch Center, and represents the first satellite for the civilian High-Definition Earth Observation Satellite (HDEOS) program implemented in China. The HDEOS program was proposed in 2006 and initiated in 2010, and it consists of seven optical/microwave satellites. Two panchromatic and multispectral (PMS) sensors and four wide field-of-view (WFV) sensors are aboard the GF-1 satellite, (hereafter, the PMS sensor on-board the GF-1 satellite is written as GF-1/PMS). The GF-1/PMSs employed each have one panchromatic band with a 2 m spatial resolution and four multispectral bands with 8 m spatial resolutions, while the WFV sensors each have four multispectral bands with 16 m resolutions. The swath is 30 km for a single PMS sensor and 60 km for two PMS sensors. A single WFV sensor images an area 200 km in width, such that all four WFV sensors together have a coverage range 800 km in width. The radiometric quantization of the GF-1/PMS and WFV sensor is 10 bit. Because radiometric characterization is a critical element of both GF-1/PMS and WFV sensors, vicarious calibration experiments have been conducted yearly at the Dunhuang test site by the China Centre for Resource Satellite Data and Application (CCRSDA) since GF-1 was launched [1]. The resulting calibration coefficients of the GF-1/PMS and WFV sensors are officially published after completion of the calibration experiments, using the reflectance-based vicarious calibration approach. However, the vicarious calibration frequency is limited because it requires synchronous measurements at the test site [2,3,4]. As such, it is difficult to validate the calibration coefficient obtained using vicarious calibration techniques.
Cross-calibration is a promising method to validate the calibration coefficient because it has a characteristic of high calibration frequency and low calibration cost. A sensor can be cross-calibrated based on an image pair, taking a well-calibrated sensor as reference [5,6,7,8,9,10,11,12,13]. An ideal cross-calibration is performed over a large uniform area imaged simultaneously, or nearly so, with the same observation angle (such as nadir observation) and similar sensor characteristic (such as spatial resolution and response spectrum response). However, the ideal image pair for cross-calibration is scarce, unless the two sensors are aboard the same platform or have tandem satellite orbit [5,6,7]. For the two sensors onboard different-orbit satellites, we have to make a tradeoff among ground uniform area, satellite image time, and observation angle. Therefore, the cross-calibration methods can be divided into three types. The first one is based on the image pair acquired at the same time at the nadir, but not on a large uniform area, which is named the simultaneous nadir overpass (SNO) method [8,9]. An SNO occurs when the nadir point of two satellite cross each other within a few seconds, which occurs in the polar regions (+70° to +80° and −70° to −80° latitude zones) for sun-synchronous polar-orbiting satellites. This method is not suitable for GF-1/PMS, as GF-1/PMS is just imaged over China and the surrounding countries. The second type of method is based on the image pair over a large uniform area, acquired on the same day, but not at the nadir. This method is the conventional cross-calibration method, and most sensors have been cross-calibrated using this method [10,11,12]. However, the selection of a synchronous image pair of GF-1/PMS and reference sensor for cross-calibration proved to be a challenge, as the swath of GF-1/PMS is only 30 km. An alternative method is to employ the Moderate Resolution Imaging Spectroradiometer (MODIS) as a reference sensor because the MODIS passes over the test site daily, and the calibration accuracy of the MODIS is well recognized [13,14]. However, the sensor zenith angles of the MODIS are greater than 30 degrees in most cases of cross-calibration with GF-1/PMS, which would result in a greater degree of uncertainty. Furthermore, the spatial resolution of MODIS is 250 m for bands 1 to 2, and 500 m for bands 3 to 7, which is too course relative to that of the GF-1/PMS with a 2 m resolution for a panchromatic band and 8 m resolution for multispectral bands. The third type of cross-calibration method is to select an image pair over a large uniform area observed at the nadir, but not on the same day. Chander et al. [15] proposed a method for cross-calibrating the Landsat 4 Thematic Mapper (TM) with the Landsat 5 TM using image pairs observed eight days apart by the two sensors based on alternate sites such as Yuma, Iraq, Egypt, Libya, and Algeria. This method can greatly increase the number of image pairs, which will be used to validate the calibration coefficient of GF-1/PMS published by CCRSDA.
In this paper, an approach is proposed to validate the calibration coefficients of the GF-1/PMS determined by vicarious calibration at the Dunhuang test site in 1–15 August 2014, using the image data obtained from the Landsat 8 Operational Land Imager (OLI). Two test sites were used in this paper, which were the Dunhuang test site and Golmud test site. The relative spectral responses of the OLI and GF-1/PMS, the test sites and image data are presented in Section 2. The top-of-atmosphere (TOA) radiance and TOA reflectance of the OLI images were transferred to GF-1/PMS images, and compared with the radiance and reflectance obtained from GF-1/PMS images based on the official calibration coefficient. Differences in the relative spectral responses and solar-sensor observation geometries of GF-1/PMS and OLI images were corrected by a spectral band adjustment factor (SBAF). The details of this approach are described in Section 3. Results obtained from the two test sites are presented in Section 4, and they show that the OLI image could be used in validating the calibration coefficient of a PMS sensor even if the image pairs of the two sensors were not imaged on the same day. The uncertainties caused by atmospheric parameters and the absence of a measured ground spectrum are analyzed in Section 5. Finally, some conclusions are given in Section 6.
2. Reference Sensor, Test Sites, and Data
2.1. Reference Sensor Overview
The Landsat 8 was launched on 11 February 2013, to continue Landsat’s mission of monitoring Earth systems and capturing changes at a relatively high spatial resolution. The Landsat 8 has an Operational Land Imager, which is abbreviated as OLI, and a Thermal Infrared Sensor on board [16,17]. The OLI sensor includes nine bands covering the visible, near-infrared and short-wave infrared portions of the spectrum. The OLI has spatial and spectral characteristics similar to those of the TM and Enhanced Thematic Mapper Plus (ETM+), but it also includes some enhancements. The OLI data are quantized into 12 bit, which provides 16 times the radiometric resolution of the 8-bit data from the previous Landsat instruments. In addition, the OLI uses the pushbroom instead of the whiskbroom used by TM and ETM+, which allows it to have a higher signal-to-noise ratio than previous Landsat instruments. The in-flight radiometric calibration of the Landsat 8 OLI includes regular collection from the onboard internal calibration source, periodic solar observation, and repeated viewing of standard earth scenes. The OLI has exceptional radiometric stability. The on-orbit calibration uncertainty of OLI is 3% for radiance production and 2% for reflectance production [18]. Therefore, the OLI is made as a reference sensor to validate the calibration coefficient of GF-1/PMS.
Figure 1 illustrates the relative spectral responses of GF-1/PMS and the corresponding Landsat 8 OLI band measured during prelaunch characterization. The wavelength coverage and ground sample distance (GSD) values of the corresponding bands of the two sensors are summarized in Table 1.
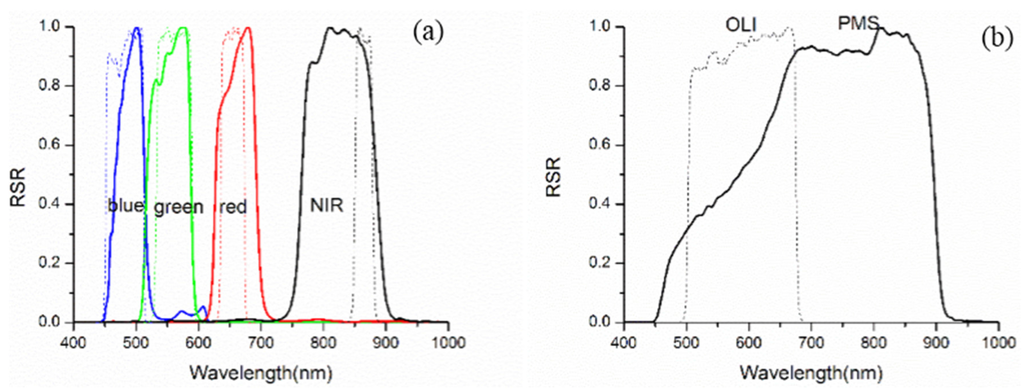
Figure 1.
Relative spectral response profiles of the GF-1/PMS and the OLI: (a) multispectral bands; (b) panchromatic bands. The thick lines represent the relative spectral response of the GF-1/PMS and the thin dash lines represent that of the OLI.

Table 1.
Spectral range and ground sample distance (GSD) of the GF-1/PMS and the OLI, where PAN is panchromatic band.
| GF-1/PMS | OLI Sensor | |||||
|---|---|---|---|---|---|---|
| Band | Spectral Range (nm) | GSD (m) | Band | Spectral Range (nm) | GSD (m) | |
| Blue | Band1 | 450–520 | 8 | Band2 | 450–515 | 30 |
| Green | Band2 | 520–590 | 8 | Band3 | 525–600 | 30 |
| Red | Band3 | 630–690 | 8 | Band4 | 630–680 | 30 |
| NIR | Band4 | 770–890 | 8 | Band5 | 845–885 | 30 |
| PAN | PAN | 450–900 | 2 | Band8 | 500–680 | 15 |
2.2. Test Site
The Dunhuang test site and the Golmud test site were used to validate the calibration coefficient of GF-1/PMS in this study.
The Dunhuang test site is China’s national radiometric calibration test site, which is located 25 km west of Dunhuang City. It was built during the late 1990s, and had been used to calibrate the sensors of most Chinese satellites such as the China-Brazil Earth Resource Satellite (CBERS) series of satellites, the Huan-Jing (HJ) series of satellites, the Beijing-1 (BJ-1) micro-satellite, the Feng-Yun (FY) series of satellites, and the Gao-Fen (GF) series of satellites [19,20,21,22,23,24]. The center of the ground experiments is located at latitude-longitude coordinates 40.093N and 112.831E, at an elevation of 1260 m. The Golmud test site is located 60 km west of Golmud City. The center of the test site is located at latitude-longitude coordinates 36.391N and 94.262E, at an elevation of 2865 m. The Landsat 8/OLI images of the Dunhuang test site and the Golmud test site are shown in Figure 2.
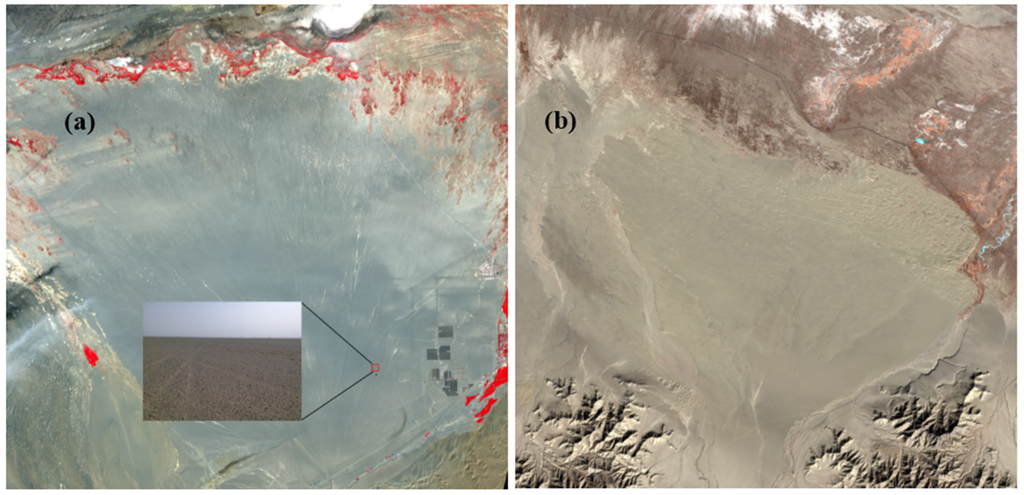
Figure 2.
Test sites of Landsat 8/OLI image. (a) The Dunhuang test site; (b) The Golmud test site.
The Dunhuang test site is a part of an alluvial fan and is covered by an amount of gravel, sand and dust. It is uniformly covered by gravel and protects the soil of the Gobi Desert from the wind erosion. The precipitation of the Dunhuang test site is low, with a yearly average of 34 mm and a relative maximum in July [25]. No vegetation is present at the Dunhaung test site, and the aerosol loading is typically low. The composition of the Golmud test site is unknown as no in situ measurement is available.
Both the Dunhuang test site and Golmud test site are large, flat and homogeneous, as shown in Figure 2, which will greatly decrease the uncertainty of mixed pixels and misregistration. The biggest difference between these two test sites is that considerable synchronous ground spectrum and historical experimental data has been collected over the Dunhuang test site, whereas no measured ground spectrum is available over the Golmud test site.
2.3. Data
Two image pairs were used in this paper, as listed in Table 2. It is noted that both image pairs were not imaged on the same day. There are five days between the image pair of the Dunhuang test site and two days between the image pair of the Golmud test site. The difference of overpassed time of the GF-1/PMS and OLI images is about half an hour, because these two sensors are in different satellite orbits.
Table 2.
Dates and times of GF-1/PMS and OLI images obtained over the Dunhuang and Golmud test sites.
| Test Site | OLI Date | OLI Time (UTC) | PMS Date | PMS Time (UTC) | Day Separation |
|---|---|---|---|---|---|
| Dunhuang | 12 August 2014 | 4:26:16 | 7 August 2014 | 4:57:29 | 5 |
| Golmud | 26 February 2014 | 4:21:56 | 24 February 2014 | 4:50:26 | 2 |
3. Methodologies
3.1. Image Registration and Region of Interest Selection
Because the spatial resolutions and swath widths of OLI and GF-1/PMS images are different, first, the image pair must be co-registered. As such, about 10 ground control points (GCPs) are selected based on GF-1/PMS and OLI images. The average image registration errors of these two images are about one pixel. As such, the common area between two images where the spatial resolutions and image sizes are equal represents a subset of the overall images. To decrease the influence of image registration error, uniform subareas are selected for validating the calibration coefficient in this paper. The size of the subarea is 600 m × 600 m, which is about 20 pixels × 20 pixels for the OLI multispectral band and 40 pixels × 40 pixels for the OLI panchromatic band.
The uniformity index δ of a subarea is calculated as
where Si is the digital number values of each pixel within the subarea of the GF-1/PMS image in the i-th band, stddev(Si) and mean(Si) are the standard deviation and average value of all pixels within the subarea in the i-th band, N is the band number, which equals four here. The regions of interest for each of these two images are selected where δ is less than 1%.
3.2. Extraction of Region of Interest Information
The average digital number of one panchromatic band and four multispectral bands of a GF-1/PMS image are calculated. For an OLI image, the average TOA radiance and average TOA reflectance are calculated according to the digital numbers of the OLI image and the calibration coefficient of the OLI. The TOA radiance of an OLI image is calculated by
where is the average digital number of the region of interest of the OLI image in the i-th band, and the and are the radiance calibration coefficient, gain and offset, of OLI in the i-th band.
The TOA reflectance of an OLI image can be calculated by
where is the TOA reflectance of OLI, is the band-specific multiplicative rescaling factor for the i-th band from the metadata (REFLECTANCE_MULT_BAND_I, where I is the band number); is the band-specific additive rescaling factor for the i-th band from the metadata (REFLECTANCE_ADD_BAND_I, where I is the band number); and is the solar zenith angle of OLI sensor.
3.3. SBAF Correction between GF-1/PMS and OLI
Because the relative spectral responses and solar-sensor observation geometries of the OLI and GF-1/PMS are different, these differences must be corrected using the SBAFs [26,27,28]. The SBAFs include the radiance SBAF and the reflectance SBAF. The radiance SBAF is defined as
Similarly, the reflectance SBAF is defined as
Here, λ1 and λ2 are the minimum and maximum wavelengths, respectively, LPMS(λ) and LOLI(λ) are the TOA radiance profile with corresponding observation angle of PMS and OLI sensor, respectively. The ρPMS(λ) and ρOLI(λ) are the TOA reflectance profiles, and and are the relative spectral responses of the GF-1/PMS and OLI, respectively.
The TOA radiance and TOA reflectance of the OLI image can be transferred to the GF-1/PMS image based on radiance SBAF and reflectance SBAF, as shown below.
Also, the TOA radiance of a GF-1/PMS image can be calculated based on its official calibration coefficient published in 2014, as follows.
Then, the TOA reflectance of a GF-1/PMS image can be computed using the TOA radiance and the solar zenith angle of GF-1/PMS, as follows.
Here, is the solar exoatmospheric irradiance of the GF-1/PMS in the i-th band.
The key component in the proposed validation method is to calculate LPMS(λ), LOLI(λ), ρPMS(λ) and ρOLI(λ), as shown in Equations (4) and (5). In this paper, the Modtran radiative transfer code was used to calculate the radiance and reflectance profiles [29]. Modtran includes a number of input parameters such as solar and sensor angles, the ground reflectance spectrum, and atmospheric parameters, which are detailed in Table 3. The ground spectrum of the Dunhuang test site was measured over the test site on 7 August 2014 with a Spectra Vista Corporation spectrometer, whereas the ground spectrum of the Golmud test site is based on the desert spectrum defined by the “SURREF” parameter in Modtran. The surface meteorological range, water vapor column, and other atmospheric parameters are the default values. It is noted that imprecise atmospheric parameters will result in some uncertainty in the validation, which will be discussed in Section 5. Another uncertainty is the absence of a measured ground spectrum, which is also analyzed in this section with respect to the Golmud test site.
Table 3.
Modtran input parameters for SBAF calculation.
| Test Site | Dunhuang | Golmud | ||
|---|---|---|---|---|
| Sensor | PMS | OLI | PMS | OLI |
| Solar zenith angle (°) | 25.9924 | 30.6794 | 48.7116 | 50.5442 |
| Solar azimuth angle (°) | 150.631 | 138.285 | 158.023 | 149.144 |
| Sensor zenith angle (°) | 2.4041 | 4.7351 | 1.0225 | 2.6322 |
| Sensor azimuth angle (°) | 273.887 | 103.234 | 273.887 | 103.234 |
| Date | 7 Auguat 2014 | 12 August 2014 | 24 February 2014 | 26 February 2014 |
| Atmosphere model | Middle latitude summer | Middle latitude winter | ||
| Aerosol extinction type | Desert extinction | Rural extinction | ||
| Ground altitude (m) | 1260 | 2865 | ||
| Ground spectrum | Dunhuang reflectance | Desert spectrum in Modtran | ||
4. Results
Figure 3 shows the GF-1/PMS and OLI image pairs after image registration and common area subset selection over the Dunhuang (first row) and Golmud (second row) test sites. The image pairs after preprocessing are of equivalent image size and spatial resolution (30 m). The regions of interest with δ < 1% were selected for validation of the calibration coefficient to decrease the effects of mixed pixels, and a total of 1377 regions of interest over the Dunhuang test site and 218 regions of interest over the Golmud test site were selected. The TOA radiance and TOA reflectance values for the GF-1/PMS and OLI were computed according to the calibration coefficients of the individual sensors.
Figure 4 shows a comparison of TOA radiance and TOA reflectance results between the GF-1/PMS and OLI images obtained over the Dunhuang test site without SBAF correction. It is readily apparent that the TOA radiance values of GF-1/PMS and OLI images are inconsistent, especially for the NIR and PAN bands, as shown in Figure 4a. Similar conditions are observed for the TOA reflectance comparison shown in Figure 4b. These conditions occur because the differences of relative spectral responses in the NIR and PAN bands are greater than those of the other three bands. Comparison results for images obtained over the Golmud test site are similar, and are not given in this paper due to limited space. These comparison results demonstrate the necessity of SBAF correction.
Both radiance SBAF and reflectance SBAF were calculated for validation of the vicarious calibration coefficient, as shown in Table 4. The radiance SBAFs in the NIR and PAN bands depart from one to a greater extent than those of the other three bands. The reflectance SBAF values have similar characteristics, but reside closer to one than the radiance SBAFs.
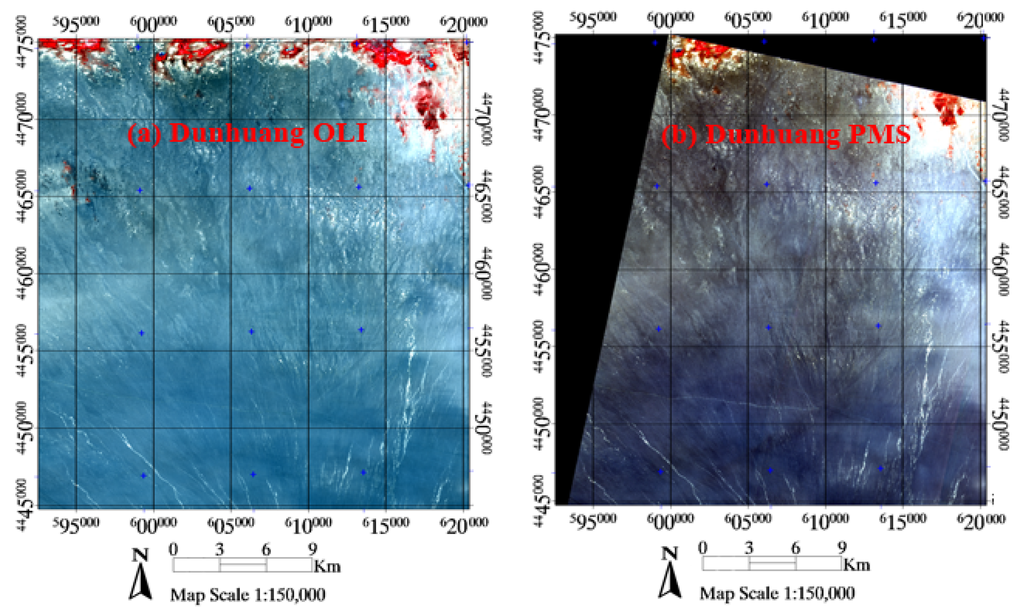
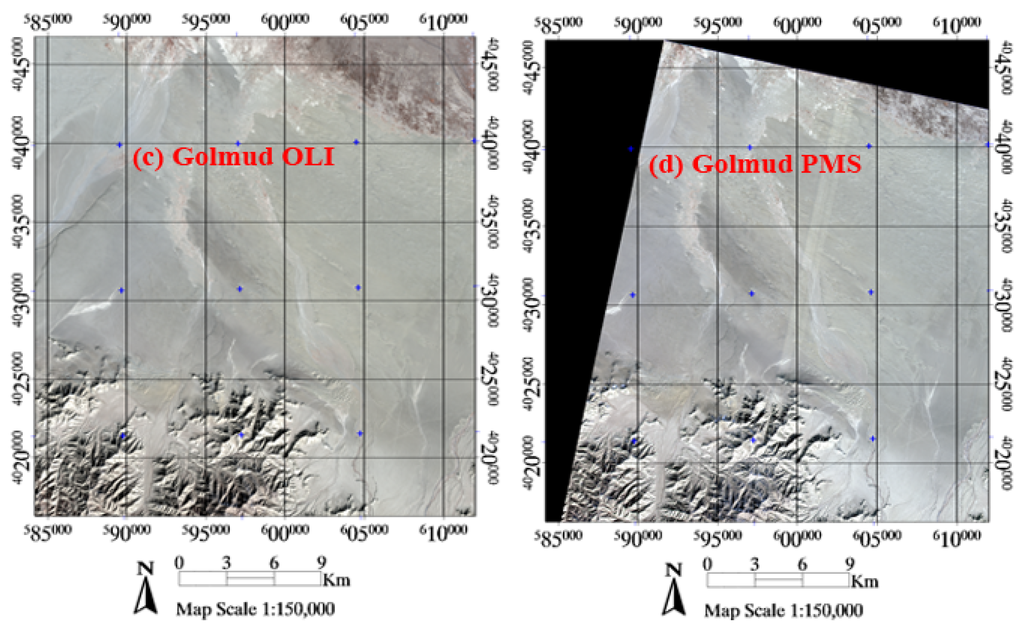
Figure 3.
Image pairs after image registration and common area subset selection over the Dunhuang (first row) and Golmud (second row) test sites: (a) OLI image over the Dunhuang test site acquired on 12 August 2014; (b) GF-1/PMS image over the Dunhuang test site acquired on 7 August 2014; (c) OLI image over the Golmud test site acquired on 26 February 2014; (d) GF-1/PMS image over the Golmud test site acquired on 24 February 2014.
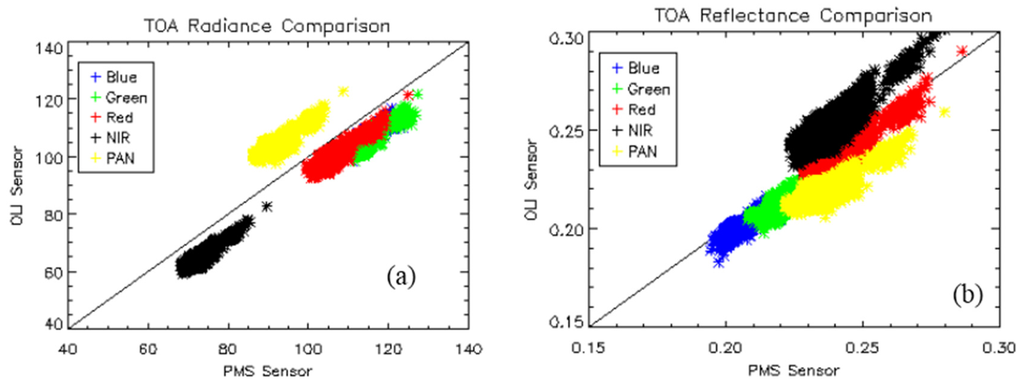
Figure 4.
Comparison results between the GF-1/PMS and OLI images obtained over the Dunhuang test site without SBAF correction for each band: (a) TOA radiance; (b) TOA reflectance.
Table 4.
Radiance and reflectance SBAFs over the two test sites.
| Blue | Green | Red | NIR | PAN | |
|---|---|---|---|---|---|
| Dunhuang radiance SBAF | 1.0428 | 1.0433 | 1.0149 | 1.1059 | 0.8432 |
| Dunhuang reflectance SBAF | 1.0142 | 1.0012 | 0.9903 | 0.9471 | 1.0380 |
| Golmud radiance SBAF | 1.0245 | 1.0493 | 1.0126 | 1.1292 | 0.8428 |
| Golmud reflectance SBAF | 0.9998 | 1.0111 | 0.9928 | 0.9714 | 1.0431 |
Figure 5 shows a comparison of TOA radiance and TOA reflectance results between the GF-1/PMS and OLI images obtained over the Dunhuang test site after SBAF correction. The TOA radiance and TOA reflectance values of GF-1/PMS and OLI images clearly coincide to a much greater extent after SBAF correction. These results show that the SBAF correction can greatly decrease the differences in the TOA radiance and TOA reflectance values of images obtained from the two sensors.
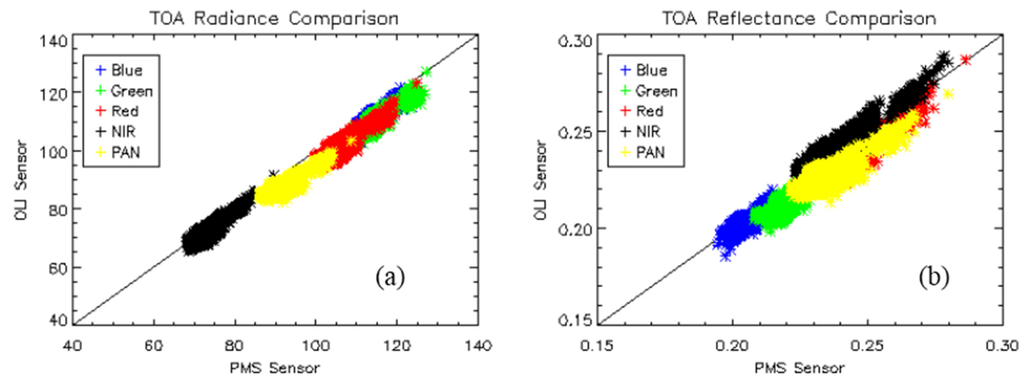
Figure 5.
Comparison results between the GF-1/PMS and OLI images obtained over the Dunhuang test site after SBAF correction for each band: (a) TOA radiance; (b) TOA reflectance.
Table 5 shows the average relative differences (ARD) of the TOA radiance and TOA reflectance values for each band between GF-1/PMS and OLI images obtained over the Dunhuang and Golmud test sites. The definition of ARD is given in Equation (9).
where the is the TOA radiance (or TOA reflectance) from the GF-1/PMS image and vicarious calibration coefficient in the i-th band, is the TOA radiance (or TOA reflectance) of the GF-1/PMS sensor derived from the Landsat 8/OLI image, mean () is the average function.
While both TOA radiance and TOA reflectance values of GF-1/PMS and OLI images obtained over the Dunhuang test site are more coincidental after SBAF correction than before, the results over the Golmud test site are different. For the Golmud test site, the ARD between GF-1/PMS and OLI images is smaller in the NIR band after SBAF correction than before. However, the ARDs in the blue, green, red, and PAN bands are greater, which indicates that these bands are overcorrected for the Golmud test site. This overcorrection might have occurred because a measured ground spectrum is unavailable for the Golmud test site, and the use of a generic sand spectrum in Modtran results in a greater degree of uncertainty. The influence of the ground spectrum will be discussed in the next section.
Table 5.
Average relative differences (ARD) of the TOA radiance and TOA reflectance values for each band between GF-1/PMS and OLI images.
| Test Site | ARD (%) | |||||
|---|---|---|---|---|---|---|
| Blue | Green | Red | NIR | PAN | ||
| Dunhuang | Before rad SBAF correction | 6.71 | 7.89 | 5.71 | 10.89 | −13.62 |
| After rad SBAF correction | 2.72 | 3.90 | 4.30 | 1.45 | 4.20 | |
| Before ref SBAF correction | 2.50 | 3.19 | 1.78 | −6.21 | 6.69 | |
| After ref SBAF correction | 1.12 | 3.08 | 2.74 | −0.60 | 3.15 | |
| Golmud | Before rad SBAF correction | −2.35 | −2.41 | −0.95 | 7.79 | −5.30 |
| After rad SBAF correction | −4.86 | −7.46 | −2.22 | −4.12 | 11.26 | |
| Before ref SBAF correction | −1.43 | −2.05 | 0.28 | −4.22 | 14.11 | |
| After ref SBAF correction | −1.41 | −3.19 | 1.00 | −1.23 | 10.41 | |
5. Discussion
The TOA radiance and TOA reflectance comparison results of GF-1/PMS and OLI images in Table 5 show that an image pair acquired at different dates can be used in the validation of the official calibration coefficient over the Dunhuang and Golmud test sites. The image coincidence is greatly improved after SBAF correction. However, a degree of uncertainty still exists because the image pair was not imaged on the same day, and the atmospheric conditions cannot be assumed to be equivalent. Moreover, uncertainty regarding an appropriate ground spectrum must also be considered. Therefore, the uncertainties in SBAFs owing to atmospheric parameters and ground spectrum are analyzed in this section.
5.1. Uncertainty in SBAFs Owing to Atmospheric Parameters
The atmospheric parameters of two separate days can be expected to exhibit variation. Taking the image pair obtained over the Dunhuang test site as an example, as discussed above, the atmospheric parameters employed for calculating the SBAFs given in Table 4 were set as default middle latitude summer parameters. However, the atmospheric parameters of 7 August 2014 and 12 August 2014 when the GF-1/PMS and OLI images were captured were obtained as actual measured data on these two days. The aerosol optical thickness was measured by CIMEL 318 sun-photometer and water vapor was measured by sounding balloon in situ. Then the surface methodological range can be computed according to the aerosol optical thickness. The surface meteorological range on 7 August 2014 was set to be 10.2 km and the water vapor column was set to be 1.982 gm/cm2. Accordingly, the surface meteorological range on 12 August was set to be 30.6 km and the water vapor column was set to be 1.243 gm/cm2. The radiance SBAFs and reflectance SBAFs were then recalculated based on the measured atmospheric parameters obtained on 7 August and 12 August, and the results compared with those obtained in Table 4 for the Dunhuang test site, as listed in Table 6.
Table 6.
SBAF corrections under different atmospheric parameters.
| Atmospheric Parameters | Blue | Green | Red | NIR | PAN | |
|---|---|---|---|---|---|---|
| Rad SBAF | Original | 1.0428 | 1.0433 | 1.0149 | 1.1059 | 0.8432 |
| New | 1.0963 | 1.0765 | 1.0245 | 1.0984 | 0.8453 | |
| Relative difference | 4.88% | 3.08% | 0.93% | −0.68% | 0.24% | |
| Ref SBAF | Original | 1.0142 | 1.0012 | 0.9903 | 0.9471 | 1.0380 |
| New | 1.0659 | 1.0329 | 0.9991 | 0.9405 | 1.0365 | |
| Relative difference | 4.85% | 3.07% | 0.88% | −0.70% | −0.15% |
As shown in Table 6, the relative difference between the SBAFs obtained under different atmospheric parameters is also calculated. The results show that the deviations of the radiance SBAFs caused by atmospheric parameters are 4.88%, 3.08%, 0.93%, −0.68%, and 0.24% for blue, green, red, NIR, and PAN bands, respectively. The deviations of reflectance SBAFs owing to different atmospheric parameters exhibit similar results. The results show that the deviations of the SBAFs owing to varying atmospheric parameters decrease with the increasing wavelength.
5.2. Uncertainty in SBAFs Owing to an Uncertain Ground Spectrum
Because the ground spectrum of the Golmud test site was not available, a generic sand spectrum in Modtran was employed for the SBAF calculations, which is defined by the parameter “SURREF”. Deviations in the SBAFs owing to uncertainty in the ground spectrum are analyzed in this section. To this end, the default Modtran sand spectrum was replaced by three new ground spectra to calculate deviations in the SBAFs owing to the use of a different ground spectrum. The first spectrum was based on the TOA reflectance spectrum of the OLI, and was obtained using a quadratic polynomial fitting function. The second spectrum was based on the ground reflectance spectrum of the OLI, using fast line-of-sight atmospheric analysis of spectral hypercubes (FLAASH) in the environment for visualizing images software (ENVI) [30], and was obtained using a quadratic polynomial fitting function. The last spectrum was the ground spectrum for the Dunhuang test site. Figure 6 shows the OLI TOA reflectance, OLI ground reflectance and three new simulated ground spectra.
The three new spectra were then used to calculate new radiance SBAFs and reflectance SBAFs. The new SBAFs were compared with the original values given in Table 4 for the Golmud test site, and their values and the resulting deviations in the SBAFs are listed in Table 7.
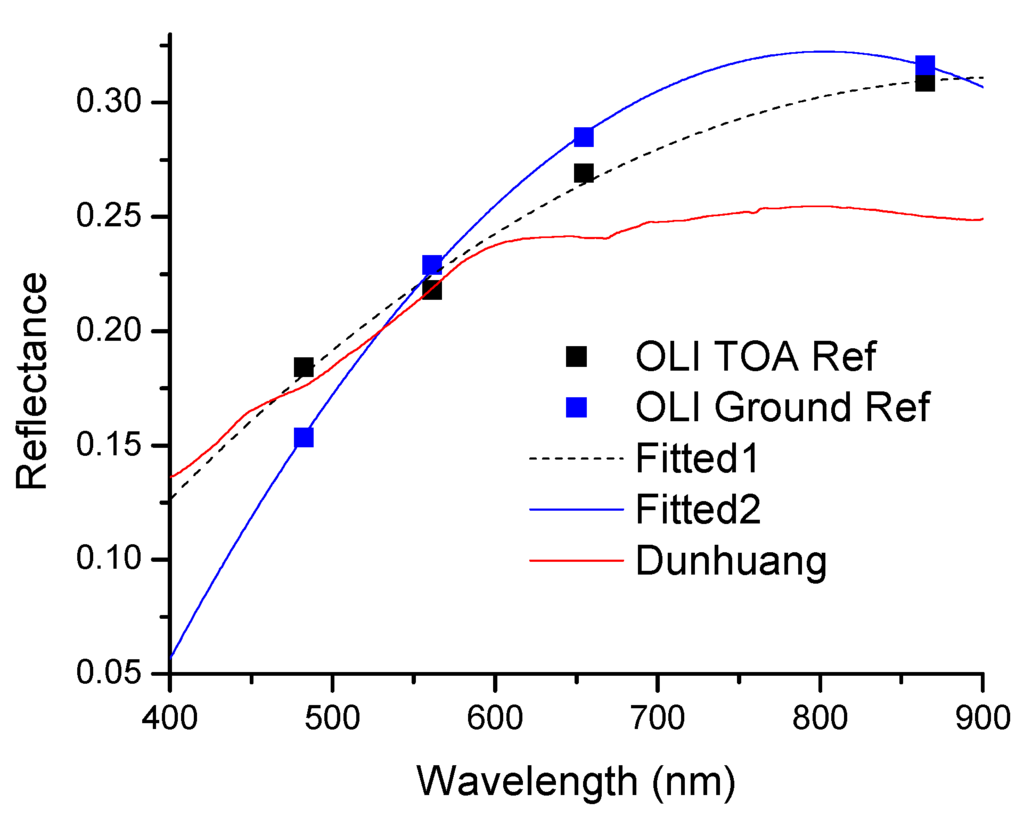
Figure 6.
OLI TOA reflectance and OLI ground reflectance spectrum and three new simulated ground spectra, where “Fitted1” is the fitted spectrum of OLI TOA reflectance, “Fitted2” is the fitted spectrum of OLI ground reflectance, “Dunhuang” is the ground spectrum of Dunhuang test site.
As shown in Table 7, the deviations in the radiance SBAF values owing to the use of different ground spectra are 3.26%, 1.87%, 0.91%, 2.57%, and 11.32% for the blue, green, red, NIR, and PAN bands, respectively. The deviations in the reflectance SBAF values exhibit similar results. The result indicates that different ground spectra have the greatest effect on the SBAFs in the PAN band, which exhibits a deviation of 11.32% for the radiance SBAF and 12.67% for the reflectance SBAF. This is caused by the significant difference of the relative spectral responses in the PAN band of the GF-1/PSM sensor and Band 8 of the OLI, as shown in Figure 1b. The second largest deviation in the reflectance SBAF occurs in the NIR band, which is about 2.5%, because the difference of relative spectral responses in the NIR bands is greater than those of the blue, green, and red bands.
Table 7.
SBAF comparison and deviations owing to the use of a different ground spectrum.
| SBAF | Type | Blue | Green | Red | NIR | PAN |
|---|---|---|---|---|---|---|
| Radiance SBAF | Original | 1.0245 | 1.0493 | 1.0126 | 1.1292 | 0.8428 |
| Fitted1 | 1.0371 | 1.0390 | 1.0211 | 1.1127 | 0.9328 | |
| Fitted2 | 1.0590 | 1.0297 | 1.0219 | 1.1421 | 0.9504 | |
| Dunhuang | 1.0321 | 1.0376 | 1.0141 | 1.1420 | 0.8682 | |
| 1-Min/Max | 3.26% | 1.87% | 0.91% | 2.57% | 11.32% | |
| Reflectance SBAF | Original | 0.9998 | 1.0111 | 0.9928 | 0.9714 | 1.0431 |
| Fitted1 | 1.0127 | 1.0011 | 1.0025 | 0.9590 | 1.1735 | |
| Fitted2 | 1.0346 | 0.9921 | 1.0032 | 0.9825 | 1.1944 | |
| Dunhuang | 1.0077 | 0.9997 | 0.9944 | 0.9819 | 1.0785 | |
| 1-Min/Max | 3.36% | 1.88% | 1.04% | 2.39% | 12.67% |
5.3. Comparison between the GF-1/PMS and OLI Images with New SBAF
The radiance SBAFs and reflectance SBAFs in Table 6 and Table 7 are used to calculate the new TOA radiance and TOA reflectance of GF-1/PMS transferred from OLI image. The ARDs of the TOA radiance and TOA reflectance values for each band between GF-1/PMS and OLI images with different SBAFs are given in Table 8 and Figure 7.
Table 8.
ARD of the TOA radiance and TOA reflectance values for each band between GF-1/PMS and OLI images with different SBAFs.
| Test Site | ARD (%) | |||||
|---|---|---|---|---|---|---|
| Blue | Green | Red | NIR | PAN | ||
| Dunhuang | With original rad SBAF correction | 2.72 | 3.90 | 4.30 | 1.45 | 4.20 |
| With new rad SBAF correction | −2.27 | 0.85 | 3.40 | 2.12 | 3.96 | |
| With original ref SBAF correction | 2.50 | 3.19 | 1.78 | −6.21 | 6.69 | |
| With new ref SBAF correction | −3.92 | 0.01 | 1.87 | 0.11 | 3.29 | |
| Golmud | With original rad SBAF correction | −4.86 | −7.46 | −2.22 | −4.12 | 11.26 |
| With fitted1 rad SBAF correction | −6.15 | −6.40 | −3.08 | −2.60 | 1.78 | |
| With fitted2 rad SBAF correction | −8.39 | −5.45 | −3.16 | −5.31 | −0.07 | |
| With Dunhuang rad SBAF correction | −5.63 | −6.26 | −2.37 | −5.30 | 8.58 | |
| With original ref SBAF correction | −1.41 | −3.19 | 1.00 | −1.23 | 10.41 | |
| With fitted1 ref SBAF correction | −2.72 | −2.17 | 0.03 | 0.06 | −0.79 | |
| With fitted2 ref SBAF correction | −4.95 | −1.25 | −0.03 | −2.40 | −2.58 | |
| With Dunhuang ref SBAF correction | −2.22 | −2.03 | 0.84 | −2.33 | 7.37 | |
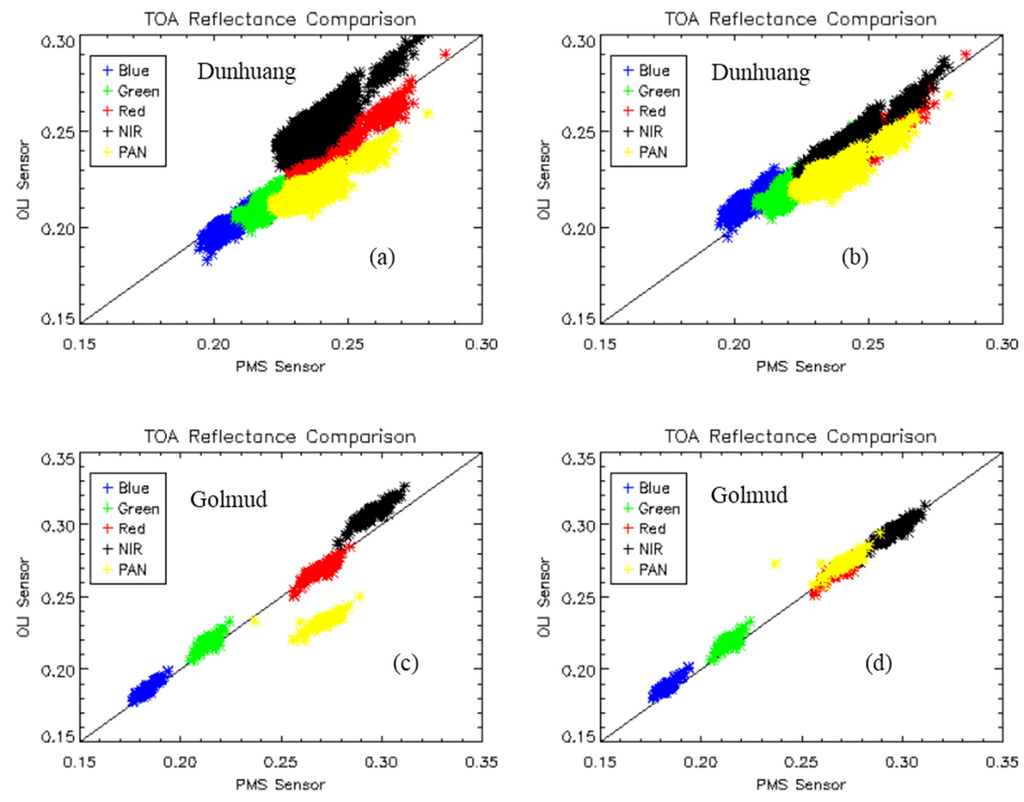
Figure 7.
TOA reflectance comparison between the GF-1/PMS image and Landsat 8/OLI images before and after SBAF correction. (a) TOA reflectance comparison before SBAF correction at the Dunhuang test site; (b) TOA reflectance comparison after SBAF correction with new SBAF coefficient in Table 6 at the Dunhuang test site; (c) TOA reflectance comparison before SBAF correction at the Golmud test site; (d) TOA reflectance comparison after SBAF correction with fitted1 reflectance SBAF coefficient in Table 7 at the Golmud test site.
As shown in Table 8 and Figure 7, the ARDs of TOA radiance and TOA reflectance over the Dunhuang test site are decreased after SBAF correction using the new radiance SBAF and reflectance SBAF in Table 5 compared with that using the original SBAF. This result indicates that the synchronous measured atmospheric parameters at the test site will improve the coincidence of the image pair to a certain extent. For the Golmud test site, the ARDs with fitted spectrum are greatly decreased, especially for PAN band. The ARD for the PAN band is greatly decreased from 11.26% to 1.78% with radiance SBAF and from 10.41% to −0.79% with reflectance SBAF, respectively. The ARDs of TOA radiance or TOA reflectance over these two test sites are smaller than 5% for most bands, as shown in Table 8, using the SBAF coefficient based on the ground reflectance spectrum of the OLI. However, the ARD for the PAN band with Dunhuang spectrum SBAF is still larger than 7%, which reveals that the Dunhuang spectrum is not fitted to the Golmud test site. This result shows that the ground spectrum has a significant impact on SBAF calculation and the validation of the calibration coefficient. This result also indicates that the fitted spectrum based on the OLI TOA reflectance using a quadratic polynomial function is proved to be an effective method that is applicable to test sites without a measured ground spectrum. It is shown that both the fitted spectrum based on the TOA reflectance and the fitted spectrum based on the ground reflectance can be used in the validation of the calibration coefficient. Theoretically, the atmospheric corrected reflectance should be better than the TOA reflectance. However, the ARD results in Table 8 show no evidence to support this. It might be that the fitted spectrum using the quadratic polynomial fitting function with OLI ground reflectance is not the best spectrum. Alternately, there are some uncertainties of the calibration coefficient of the GF-1/PMS and OLI sensors. The results in Table 8 show that the ARDs of TOA radiance and reflectance values for each band between GF-1/PMS and OLI images are 2%–5% for most bands, after SBAF correction with a measured ground spectrum or fitted spectrum.
5.4. Validation with More Image Pairs
Two more image pairs are obtained to validate this method. One was imaged over the Dunhuang test site, with the OLI image of 15 December 2013 and the GF-1/PMS image of 17 December 2013. The other image pair was imaged over the Golmud test site, with the OLI image of 11 December 2014 and the GF-1/PMS image of 12 December 2014. These two image pairs are processed with the method described in Section 3. The ARDs of TOA radiance and TOA reflectance over the Dunhuang test site and the Golmud test site are calculated in Table 9. The results show that the ARDs of TOA radiance and TOA reflectance over the Dunhuang test site are less than 5% for most bands, while the ARDs of TOA radiance and TOA reflectance over the Golmud test site are larger than 5% for most bands. The reason for this difference is unknown and should be researched in the future. One possible reason is the uncertainty of ground reflectance over the Golmud test site, and the other possible reason is that the calibration coefficient of the GF-1/PMS sensor was changed in December 2014.
Table 9.
ARDs of the TOA radiance and TOA reflectance values for each band between GF-1/PMS and OLI images with new image pairs.
| Test Site | ARD (%) | |||||
|---|---|---|---|---|---|---|
| Blue | Green | Red | NIR | PAN | ||
| Dunhuang | With rad SBAF correction | −3.54 | −0.05 | 2.25 | −9.46 | −3.84 |
| With ref SBAF correction | 0.95 | 4.99 | 6.41 | −5.24 | 0.73 | |
| Golmud | With rad SBAF correction | −9.97 | −9.98 | −7.00 | −9.64 | −11.56 |
| With ref SBAF correction | −5.84 | −4.60 | −2.74 | −7.10 | −8.95 | |
6. Conclusions
In this paper, an approach to validate the calibration coefficient of the PMS sensor onboard the GF-1 satellite was proposed based on the images obtained from the Landsat 8 OLI. Image pairs obtained over the Dunhuang and Golmud test sites were used in the paper. It is noted that both image pairs were not imaged on the same day, but were captured at intervals of two-to-five days because the swath of the GF-1/PMS is only 30 km, and it is practically impossible to obtain a GF-1/PMS and OLI image pair imaged on the same day over a given test site. Furthermore, no measured ground spectrum was available for the Golmud test site. The two-to-five-day interval between image pairs and the absence of ground spectrum data result in a greater degree of uncertainty in validation when employing the Landsat 8 OLI as the reference sensor. The radiance SBAFs and reflectance SBAFs of the GF-1/PMS and OLI images were calculated in the validation, and the results showed that the average differences between the TOA radiance and TOA reflectance values of the GF-1/PMS and OLI images were 2%–5% for most bands after SBAF correction with a measured ground spectrum or fitted spectrum. The uncertainty analysis results showed that the atmospheric parameters mainly affect the blue and green bands, and the ground spectrum mainly affects the PAN band. The validation results also showed that the radiance SBAFs and reflectance SBAFs exhibit similar deviations owing to uncertainties in the atmospheric parameters and ground spectrum. The results verify that the OLI sensor can be used to validate the calibration coefficient of the GF-1/PMS, even if the image pairs are not imaged on the same day or if ground spectrum data are unavailable. Nevertheless, it is better to select image pairs obtained at closely spaced intervals and under similar atmospheric conditions. Moreover, the use of test sites with a measured ground spectrum data will decrease uncertainty in the validation of the calibration coefficient of GF-1/PMS.
Acknowledgments
The GF-1/PMS imagery and ground experimental data at the Dunhuang test site used in this research are supported by the China Centre for Resources Satellite Data and Application (http://www.cresda.com/). The Landsat-8/OLI data were downloaded from the U.S. Geological Survey website (http://earth explorer.usgs.gov/). This work was supported by the Open Fund of the State Key Laboratory of Remote Sensing Science under Grant OFSLRSS201411, the National Natural Science Foundation of China under Grant 41201344 and the Director Foundation of Institute of Remote Sensing and Digital Earth, CAS under Grant Y5SJ0400CX. This author would like to thank the reviewers for their comments and their efforts.
Author Contributions
Hailiang Gao was responsible for the data analysis, main research ideas and writing the manuscript. Xingfa Gu contributed to the manuscript organization. Tao Yu helped design the research. Li Liu collected the field data and pre-processed the ground data. Yuan Sun and Qiyue Liu contributed to the data collection and pre-processed the remote sensing data, and Yong Xie contributed to the research ideas. All authors thoroughly reviewed and edited this paper.
Conflicts of Interest
The authors declare no conflict of interest.
References
- Han, Q.; Zhang, X.; Qiao, Z.; Yang, L.; Pan, Z.; Liu, L. Wide dynamic radiometric calibration of GF-1 PMS sensor using multi-test sites. Infrared Laser Eng. 2015, 44, 127–133. [Google Scholar]
- Teillet, P.M.; Slater, P.N.; Ding, Y.; Santer, R.P.; Jackson, R.D.; Moran, M.S. Three methods for the absolute calibration of the NOAA AVHRR sensors in-flight. Remote Sens. Environ. 1990, 31, 105–120. [Google Scholar] [CrossRef]
- Thome, K.J. Absolute radiometric calibration of Landsat-7 ETM+ using the reflectance-based method. Remote Sens. Environ. 2001, 78, 27–38. [Google Scholar] [CrossRef]
- Thome, K.J.; Helder, D.L.; Aaron, D.; Dewald, J.D. Landsat-5 TM and Landsat-7 ETM+ absolute radiometric calibration using the reflectance-based method. IEEE Trans. Geosci. Remote Sens. 2004, 42, 2777–2785. [Google Scholar] [CrossRef]
- Lyapustin, A.; Wang, Y.; Kahn, R.; Xiong, J.; Ignatov, A.; Wolfe, R.; Wu, A.; Holben, B.; Bruegge, C. Analysis of MODIS-MISR calibration differences using surface albedo around AERONET sites and cloud reflectance. Remote Sens. Environ. 2007, 107, 194–205. [Google Scholar] [CrossRef]
- Teillet, P.M.; Barker, J.L.; Markham, B.L.; Irish, R.R.; Fedosejeves, G.; Storey, J.C. Radiometric cross-calibration of the Landsat-7 ETM+ and Landsat-5 TM sensors based on tandem data sets. Remote Sens. Environ. 2001, 78, 39–54. [Google Scholar] [CrossRef]
- Teillet, P.M.; Markham, B.L.; Irish, R.R. Landsat cross-calibration based on near simultaneous imaging of common ground targets. Remote Sens. Environ. 2006, 102, 264–270. [Google Scholar] [CrossRef]
- Cao, C.; Weinreb, M.; Xu, H. Predicting simultaneous nadir overpasses among polar-orbiting meteorological satellites for the intersatellite calibration of radiometers. J. Atmos. Ocean. Technol. 2004, 21, 537–542. [Google Scholar] [CrossRef]
- Cao, C.; Xu, H.; Sullivan, J.; Mcmillin, L.; Ciren, P.; Hou, Y. Intersatellite radiance biases for the High-Resolution Infrared Radiation Sounders (HIRS) on board NOAA-15, -16, and -17 from Simultaneous Nadir Observations. J. Atmos. Ocean. Technol. 2005, 22, 381–395. [Google Scholar] [CrossRef]
- Gao, C.; Jiang, X.; Li, X.; Li, X. The cross calibration of CBERS-02B/CCD visible-near-infrared channels with Terra/MODIS channels. Int. J. Remote Sens. 2013, 34, 3688–3698. [Google Scholar] [CrossRef]
- Chander, G.; Meyer, D.J.; Helder, D.L. Cross calibration of the Landsat-7 ETM+ and EO-1 ALI sensor. IEEE Trans. Geosci. Remote Sens. 2004, 42, 2821–2831. [Google Scholar] [CrossRef]
- Thome, K.J.; Biggar, S.F.; Wisniewski, W. Cross comparison of EO-1 sensors and other Earth resources sensors to Landsat-7 ETM+ using Railroad Valley Playa. IEEE Trans. Geosci. Remote Sens. 2003, 41, 1180–1188. [Google Scholar] [CrossRef]
- Xiong, X.; Chiang, K.; Esposito, J.; Guenther, B.; Barnes, W. MODIS on-orbit calibration and characterization. Metrologia 2003, 40, 89–92. [Google Scholar] [CrossRef]
- Xiong, X.; Chiang, K.; Sun, J.; Barnes, W.L.; Guenther, B.; Salomonson, V.V. NASA EOS Terra and Aqua MODIS on-orbit performance. Adv. Space Res. 2009, 43, 413–422. [Google Scholar] [CrossRef]
- Chander, G.; Helder, D.L.; Malla, R.; Micijevic, E.; Mettler, C.J. Consistency of L4 TM absolute calibration with respect to the L5 TM sensor based on near-simultaneous image acquisition. Proc. SPIE 2007, 667. [Google Scholar] [CrossRef]
- Knight, E.J.; Kvaran, G. Landsat-8 operational land imager design, characterization and performance. Remote Sens. 2014, 6, 10286–10305. [Google Scholar] [CrossRef]
- Markham, B.; Storey, J.; Morfitt, R. Landsat-8 sensor characterization and calibration. Remote Sens. 2015, 7, 2279–2282. [Google Scholar] [CrossRef]
- Markham, B.; Barsi, J.; Kvaran, G.; Ong, L.; Kaita, E.; Biggar, S.; Czapla-Myers, J.; Mishra, N.; Helder, D. Landsat-8 Operational Land Imager Radiometric Calibration and Stability. Remote Sens. 2014, 6, 12619–12638. [Google Scholar] [CrossRef]
- Fu, Q.; Min, X.; Li, X.; Sha, C.; Li, X.; Ma, G.; Pan, Z.; Guo, Y.; Li, Q.; Liu, G. In-flight absolute calibration of the CBERS-02 CCD sensor at the Dunhuang test site. J. Remote Sens. 2006, 7, 433–439. [Google Scholar]
- Gao, H.; Gu, X.; Yu, T.; Li, X.; Cheng, T.; Gong, H.; Li, J. Radiometric calibration for HJ-1A Hyper-spectrum Imager and Uncertainty analysis. Acta Phtonica Sin. 2009, 38, 2826–2833. [Google Scholar]
- Gao, H.; Gu, X.; Yu, T.; Gong, H.; Li, J.; Li, Y. HJ-1A HSI on-orbit radiometric calibration and validation research. Sci. China Technol. Sci. 2010, 53, 3119–3128. [Google Scholar] [CrossRef]
- Chen, Z.; Zhang, B.; Zhang, X.; Zhang, H.; Li, J. Reflectance-based calibration of Beijing-1 micro-satellite. In Proceedings of the Geoscience and Remote Sensing Symposium, Cape Town, South Africa, 25–30 July 2009.
- Li, Y.; Rong, Z.; Zheng, Z.; Liu, J.; Zhang, L.; Zhang, L.; Hu, X.; Zhang, Y.; Sun, L. Post launch site calibration of visible and near-infrared channels of FY-3A visible and inferred radiometers. Opt. Precis. Eng. 2009, 17, 2926–2974. [Google Scholar]
- Han, Q.; Fu, Q.; Zhang, X; Liu, L. High-frequency radiometric calibration for wide field-of-view sensor of GF-1 satellite. Opt. Precis. Eng. 2014, 22, 1707–1714. [Google Scholar]
- Hu, X.; Zhang, Y.; Liu, Z.; Zhang, G.; Huang, Y.; Qiu, Q.; Wang, Y.; Zhang, L.; Zhu, X.; Rong, Z. Optical characteristics of China Radiometric Calibration Site for Remote Sensing Satellite Sensors(CRCSRSSS). Proc. SPIE 2001, 4151. [Google Scholar] [CrossRef]
- Teillet, P.M.; Fedosejevs, G.; Thome, K.J.; Barker, J.L. Impacts of spectral band difference effects on radiometric cross-calibration between satellite sensors in the solar-reflective spectral domain. Remote Sens. Environ. 2007, 110, 393–409. [Google Scholar] [CrossRef]
- Chander, G.; Mishra, N.; Helder, D.L.; Aaron, D.B.; Angal, A.; Choi, T.; Xiong, X.; Doelling, D.R. Applications of spectral band adjustment factors (SBAF) for cross-calibration. IEEE Trans. Geosci. Remote Sens. 2013, 51, 1267–1281. [Google Scholar] [CrossRef]
- Gao, H.; Jupp, D.; Qin, Y.; Gu, X.; Yu, T. Cross calibration of the HSI sensor Reflective solar bands using Hyperion Data. IEEE Trans. Geosci. Remote Sens. 2015, 53, 4127–4137. [Google Scholar] [CrossRef]
- Berk, A.; Anderson, G.P.; Acharya, P.K.; Chetwynd, J.H.; Bernstein, L.S.; Shettle, E.P.; Matthew, M.W.; Adler-Golden, S.M. MODTAN 4 User’s Manual; Spectral Sciences Inc.: Burlington, MA, USA, 1999. [Google Scholar]
- Anderson, G.P.; Felde, G.W.; Hoke, M.L.; Ratkowski, A.J.; Cooley, T.W. MODTRAN4-based atmospheric correction algorithm: FLAASH (fast line-of-sight atmospheric analysis of spectral hypercubes). Proc. SPIE 2002, 4725. [Google Scholar] [CrossRef]
© 2016 by the authors; licensee MDPI, Basel, Switzerland. This article is an open access article distributed under the terms and conditions of the Creative Commons by Attribution (CC-BY) license (http://creativecommons.org/licenses/by/4.0/).