Abstract
Permanent Scatterer Interferometry (PSI) has been used to detect and characterize the subsidence of the Pisa urban area, which extends for 33 km2 within the Arno coastal plain (Tuscany, Italy). Two SAR (Synthetic Aperture Radar) datasets, covering the time period from 1992 to 2010, were used to quantify the ground subsidence and its temporal evolution. A geotechnical borehole database was also used to make a correspondence with the detected displacements. Finally, the results of the SAR data analysis were contrasted with the urban development of the eastern part of the city in the time period from 1978 to 2013. ERS 1/2 (European Remote-Sensing Satellite) and Envisat SAR data, processed with the PSInSAR (Permanent Scatterer InSAR) algorithm, show that the investigated area is divided in two main sectors: the southwestern part, with null or very small subsidence rates (<2 mm/year), and the eastern portion which shows a general lowering with maximum deformation rates of 5 mm/year. This second area includes deformation rates higher than 15 mm/year, corresponding to small groups of buildings. The case studies in the eastern sector of the urban area have demonstrated the direct correlation between the age of construction of buildings and the registered subsidence rates, showing the importance of urbanization as an accelerating factor for the ground consolidation process.
1. Introduction
Ground subsidence is a phenomenon that affects coastal areas where major cities developed sometimes without proper urban planning. The natural compaction processes of normally consolidated fine-grained sediments are strongly accelerated in the case of building load, especially if soft clay, peat or reclamation are present.
Considerable ground displacements and building stability problems related to the presence of compressible layers have been reported for several cities around the world, such as Rome [1,2], Venice [3,4], Shanghai [5,6], Beijing [7], Hong Kong [8], Hanoi [9], Jakarta [10], New Orleans [11]. The urbanization, which includes the magnitude of imposed load and the construction age of the buildings, has been demonstrated as another factor which is involved in developing a consolidation process with high displacement rates [5,12,13].
In the last decades, satellite DInSAR (Differential Interferometric Synthetic Aperture Radar) has been successfully demonstrated to be highly valuable in measuring land motion in a wide range of application fields, including ground movements related to various geohazard phenomena such as floods, landslides and subsidence [14,15]. This EO (Earth Observation) technique is ideally suited to measuring the spatial distribution and magnitude of surface deformation associated with ground subsidence. The millimeter accuracy, associated with a few meters of spatial resolution at the ground, has given the opportunity to detect this natural hazard with high precision and with a relation of cost/measurement density not affordable using leveling or other field monitoring techniques [16,17,18,19,20,21,22,23,24,25].
This study exploits the high precision of satellite PSInSAR (Permanent Scatterer Interferometry) data (ERS 1/2 (European Remote-Sensing Satellite) and Envisat satellites) to quantify the subsidence phenomenon and its temporal evolution and spatial distribution in the Arno coastal plain (Tuscany region, Italy), particularly in the city of Pisa. The time series analysis, which is demonstrated as a powerful tool to highlight acceleration or slowdown in the temporal trend of ground motion [26,27,28,29], has been used to characterize the registered subsidence rates at building scale. The local-scale deformations have been examined in order to demonstrate the existing relations between subsidence rates, local stratigraphy and urban development.
2. Geological and Hydrogeological Setting
The study area is located in the northwestern part of the Tuscany region within the Arno coastal plain (Figure 1); it is bounded by the Pisani Mountains to the northeast, by the “Livorno–Sillaro” tectonic line to the south and approximately by Massaciucoli lake to the north [30,31]. The northern boundary of the plain is not well defined due to the complex superposition of several paleo-channels of the Arno and the Serchio rivers [32]. The plain is ca. 450 km2 wide and represents the southern inshore portion of the subsiding half-graben Viareggio basin, with a characteristic triangular shape wedging out northwards [33,34]. The depositional evolution of the youngest portion of the basin is essentially related to the late Quaternary glacioeustatic sea level fluctuations [35,36,37]. In fact, the sea level decrease after the Last Glacial Maximum (LGM) caused the development of an incised valley 5–7 km wide and 40 m thick, perpendicular to the present shoreline [35,36,37]. This valley was rapidly filled by estuarine and coastal plain deposits between ca. 13,000–8000 cal year BP, thanks to the eustatic sea level rise post LGM [37,38]. Over this succession lies a 20–25 m thick transgressive deposit, developed during the last 8000 cal year BP after the phase of decelerated sea level rise [39]. At the base of this Holocene succession, a continuous level of clays and silty clays locally known as “pancone” is clearly defined and it is widespread from the Pisa Mountains to the beach ridges of the coastal plain [35]. This clayey deposit records the existence of a 6-km-wide lagoon in the time period from 8000 to 6000 cal. year BP [40]; at that time the shoreline was more than 7 km landward from its present position. The lagoonal “pancone” deposit is overlaid by a 10–15 m thick fluvio-deltaic succession, composed of clays and silts with occasional sand and silty sand bodies which reflect the repeated phases of coastal progradation and the resulting development of modern Arno delta [34].
During the Pre-Roman and Roman age (ca. 6000–1600 year BP), one of the old branches of the Serchio River, called “Auser” (Figure 1), was connected to the paleo-Arno. Despite several engineering works developed to protect the city from floods and wetland formation, this network persisted throughout all the Middle Ages [41,42]. The “Auser” was diverted outside city walls during the 11th to 12th centuries, leaving only one channel to flow through the city (the modern Arno river [43]).
The stratigraphy and architecture of the Holocene succession, with highly compressible layers as the “pancone” layer, represent a geotechnical weak point that may influence the ground subsidence in the urban area of the city [32].
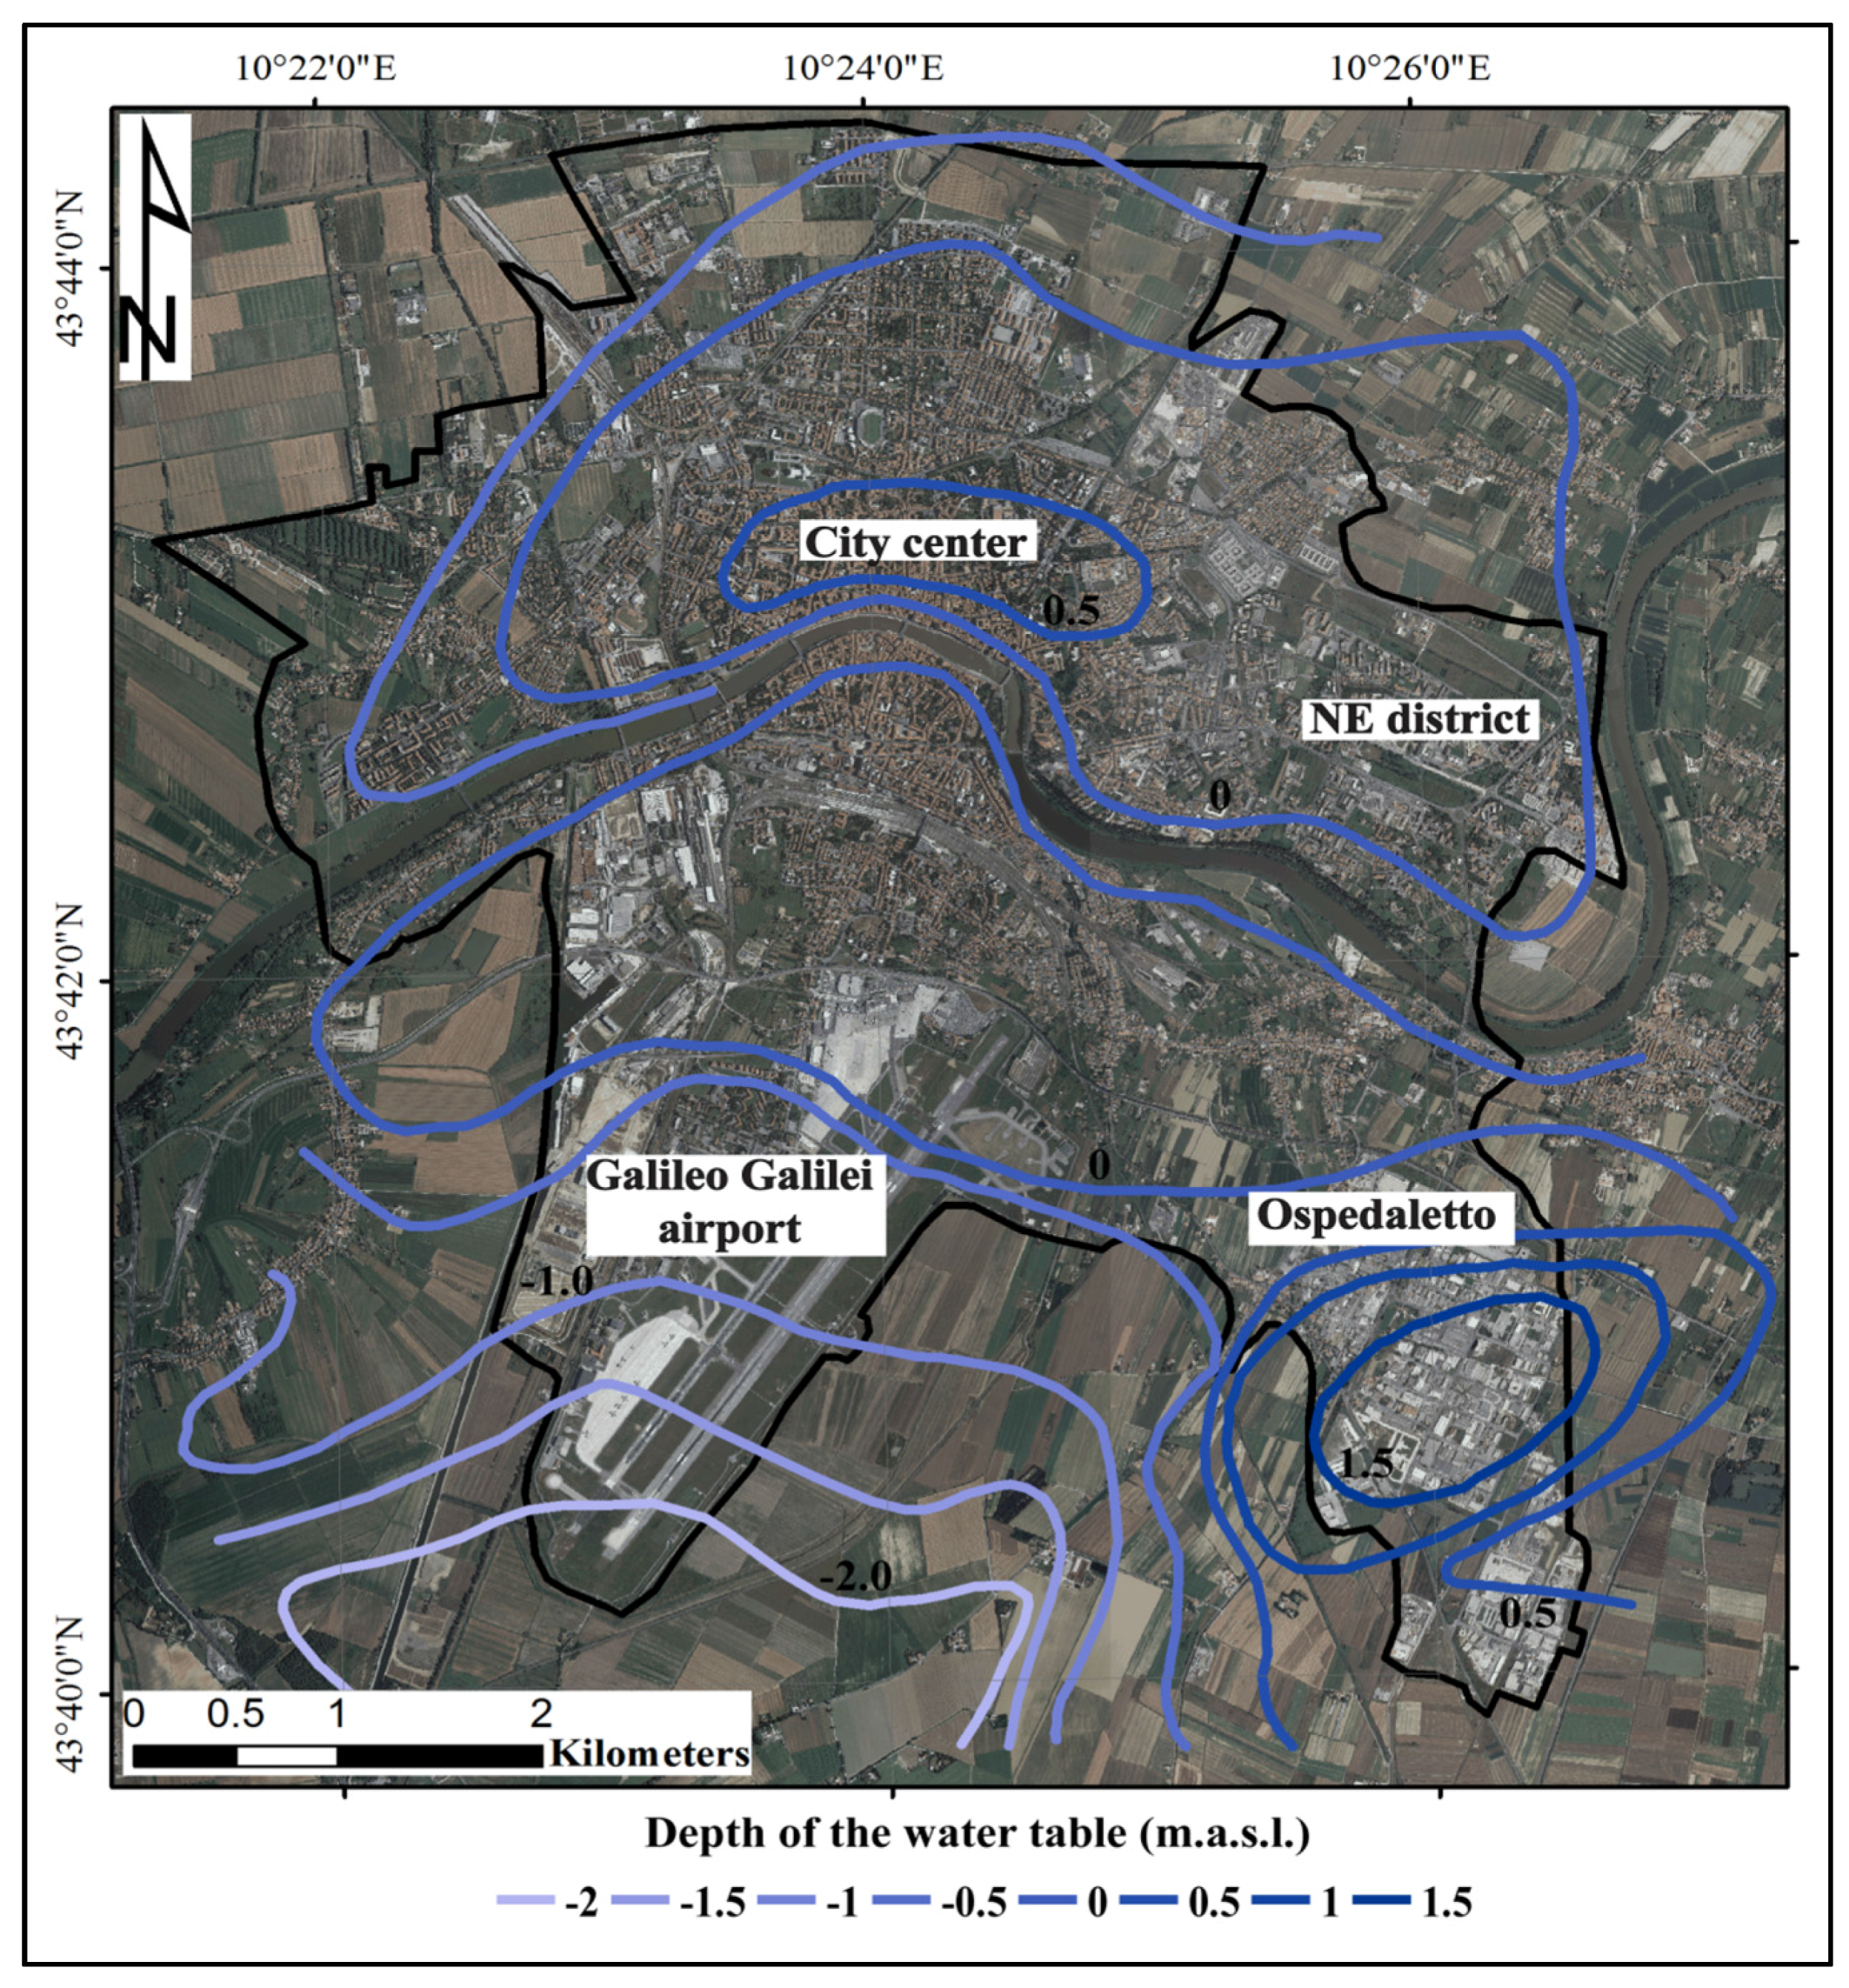
In the investigated area, a phreatic aquifer, a few meters thick, composed by sandy and silty layers within the clayey sequence, is present. This water reservoir is not usually used for water extraction because of its low quality and variable specific storage and transmissivity [44]. This aquifer (Figure 2) shows a maximum water level in the area of Ospedaletto (1.5 m above sea level) and a minimum (2 m below sea level) in the southern boundary of the Galileo Galilei International Airport; in the northern part of the city the surface does not show any significant variation.
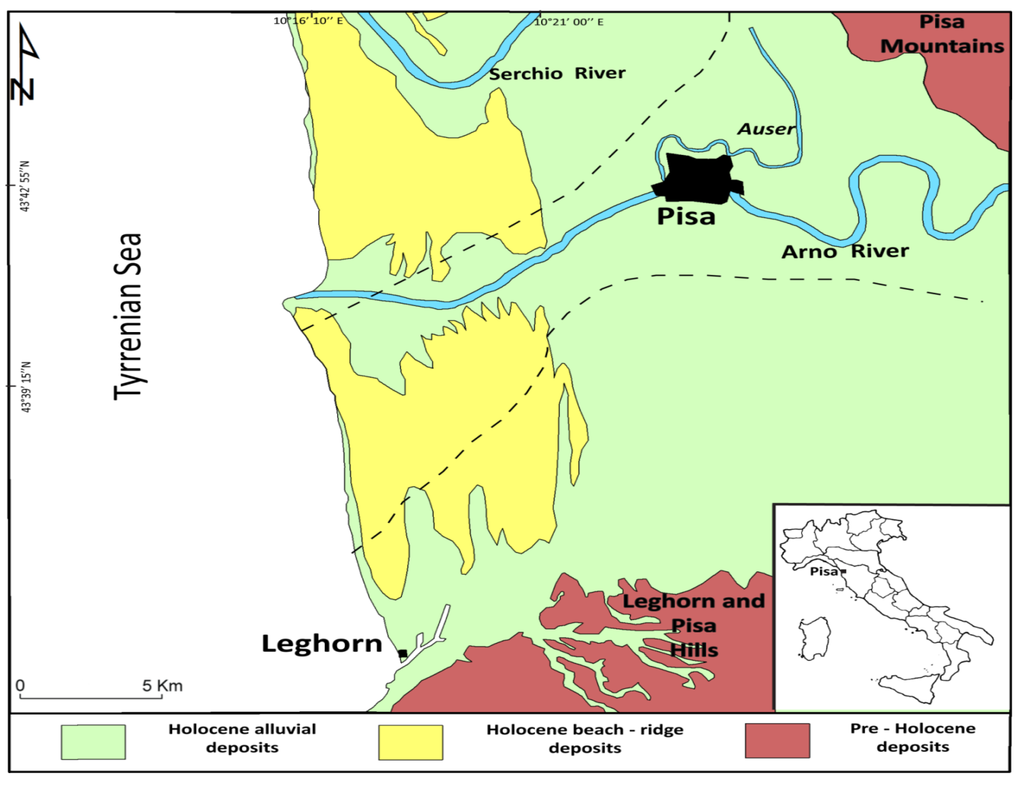
Figure 1.
Geological and geomorphological sketch map of the Arno coastal plain, modified after [32]. Hypothesized paleo-valley boundaries are shown as black dashed lines. Actual river paths and “Auser” abandoned branch are shown in light blue.
Figure 1.
Geological and geomorphological sketch map of the Arno coastal plain, modified after [32]. Hypothesized paleo-valley boundaries are shown as black dashed lines. Actual river paths and “Auser” abandoned branch are shown in light blue.


Figure 2.
Phreatic surface in the urban area of Pisa (from [44]). The black line represents the investigated area. The contour map is overlaid on a 2013 digital orthophoto.
Figure 2.
Phreatic surface in the urban area of Pisa (from [44]). The black line represents the investigated area. The contour map is overlaid on a 2013 digital orthophoto.
3. Available Dataset
3.1. PSInSAR Products
Differential SAR interferometry (DInSAR) exploits phase information of SAR images to retrieve ground displacement which occurred between two different acquisitions of the same area [45]. Conventional DInSAR is affected and limited by two major sources of errors: temporal and geometric decorrelation [46] and phase distortion due to atmospheric effects [47].
Fifteen years ago, a new algorithm for InSAR data analysis was developed: the PSInSAR (Permanent Scatterer InSAR) technique [48,49]. This technique analyzes long stacks of co-registered SAR images to identify point-wise targets (PS, Permanent Scatterers) within the ground resolution cell which can be natural or man-made and have stable radiometric characteristics during the entire acquisition interval. Phase information backscattered from these coherent points is used to derive the ground displacement and the temporal evolution of the movement. The main limitation of this technique is the almost-absence of coherent PS points in rural or wooded areas, where changes in vegetation geometry or wetness cause phase decorrelation and make the selection of coherent points difficult.
The resultant ground displacements are recorded along the line of sight of the satellite (LOS), which is the sensor for target direction, tilted at about 23° for ERS 1/2 and Envisat satellites. The displacement values are then influenced by the vertical and horizontal components of the movement and have to be corrected for the slope direction of the displacement. In the case of subsidence phenomenon, this correction is not required due to the vertical direction of the movement. The displacement value for each PS is expressed as a velocity in millimeters for a year and have a negative sign if the target moves away from the sensor (ground subsidence) or a positive sign if the target approaches the sensor (ground uplifting).
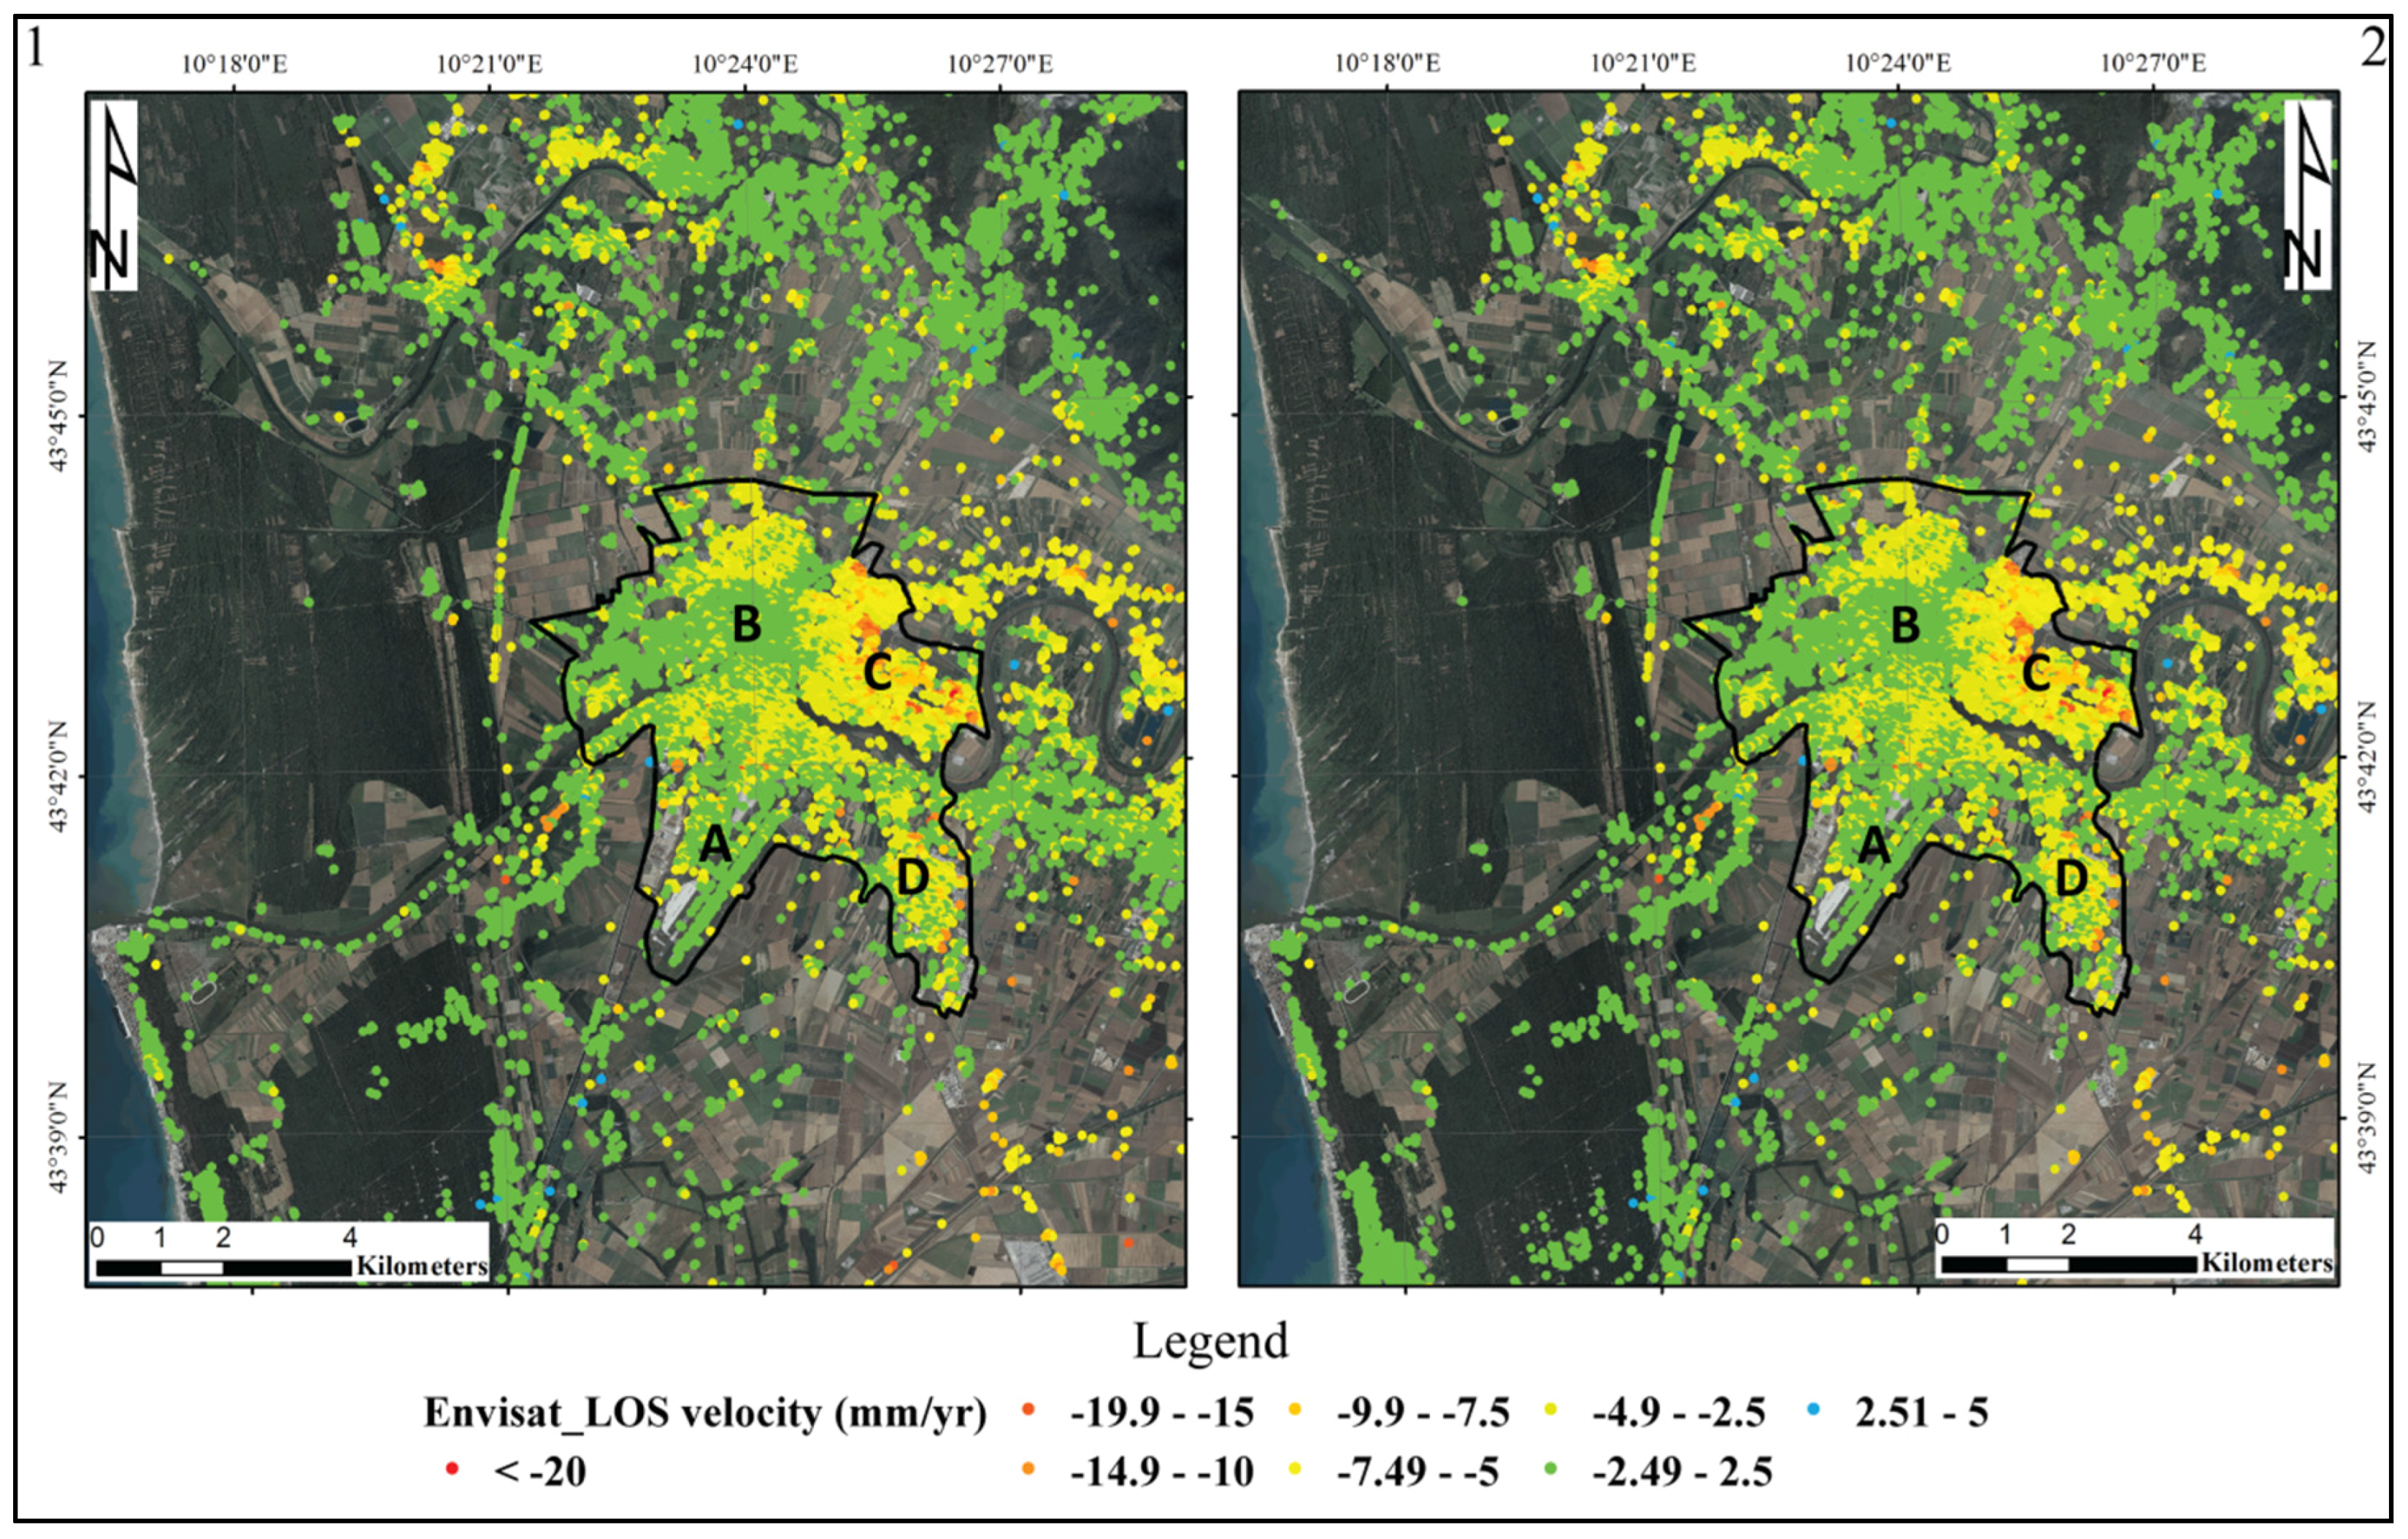
For subsidence detection in the Pisa plain area, ERS 1/2 and Envisat interferometric data have been used (Figure 3); these data were obtained from the National Cartographic Portal (PCN) of the Pst-A Project (Piano Straordinario di Telerilevamento, [50,51]). The reliability of these interferometric data has successfully been proven by other authors in other Italian study cases [52,53,54,55]. For the purpose of this study, 68 ERS 1/2 and 37 Envisat images, seamlessly covering the time period from 1992 to 2010 with the exception of a gap in 2002, have been processed with the PSInSAR algorithm. ERS 1/2 and Envisat satellites both operate in C-band (5.6 cm wavelength; 5.3 GHz frequency) with a ground resolution of about 20 × 5 m and a revisit time of 35 days. Both datasets show a high density of points (maximum value of 700 PS/Km2) where the highest density of buildings and man-made structures can be found (Figure 3), i.e., in the city center and in the southern industrial area of Ospedaletto (Table 1). In the agricultural areas with sparse houses, the PS density abruptly decreases to less than 50 PS/km2.

Table 1.
Details of the SAR datasets used in this study.
| Satellite | Covered Time Period | Number of Images | Minimum PS Density (PS/km2) | Maximum PS Density (PS/km2) | Standard Deviation | Coherence Threshold | Maximum Subsidence Rate (mm/year) | Maximum Uplift Rate (mm/year) |
|---|---|---|---|---|---|---|---|---|
| ERS 1/2 | 13 May 1992 | 68 | 15 | 350 | ± 0.8 | 0.58 | 22.0 | 2.5 |
| 16 December 2000 | ||||||||
| Envisat | 25 January 2003 | 37 | 50 | 700 | ± 1.2 | 0.68 | 21.1 | 2.8 |
| 12 June 2010 |

Figure 3.
Registered LOS velocities in the Pisa plain between 1992 and 2001. (1) ERS 1/2 data; (2) Envisat data. PSI maps are overlaid on a 2010 digital orthophoto. The black line represents the investigated area inside the Pisa municipality. (A) Galileo Galilei International Airport; (B) inner city area; (C) Cisanello–San Cataldo–La Fontina district; (D) Ospedaletto district.
3.2. Borehole Classification and Geotechnical Interpretation
For the geological reconstruction of the investigated area, subsoil data from the Pisa Province borehole database were used. This database includes more than 10,000 various types of geological and geotechnical data (from classical borehole to dynamic and static penetration tests or nucleus destruction boreholes). Within this database, 92 geotechnical boreholes with a depth of investigation greater than 10–15 m (Figure 4) were selected in order to intercept the upper limit of the “pancone” deposit. The original stratigraphical information was modified with a lithostratigraphical-geotechnical classification of five facies associations, proposed for the city of Pisa by Sarti et al. [32].
The classification takes into account not only the stratigraphical changes but also the geotechnical characteristics of the different layers; these latest parameters are obtained from undisturbed/minimally disturbed samples retrieved with Osterberg or Shelby samplers. These samples were used to obtain index parameters for each class: Atterberg limits (liquid limit—WL and plastic limit—WP), state parameters as natural water content (WN), plasticity index (IP) and consistency index (Ic) and mechanical parameters derived from the oedometric compression test (compression index—Cc) or direct shear test (drained cohesion c′ and drained friction angle φ′). Below are described the stratigraphical and geotechnical characteristics definitions and interpretations of the five facies associations; for the state and mechanical values see Table 2.
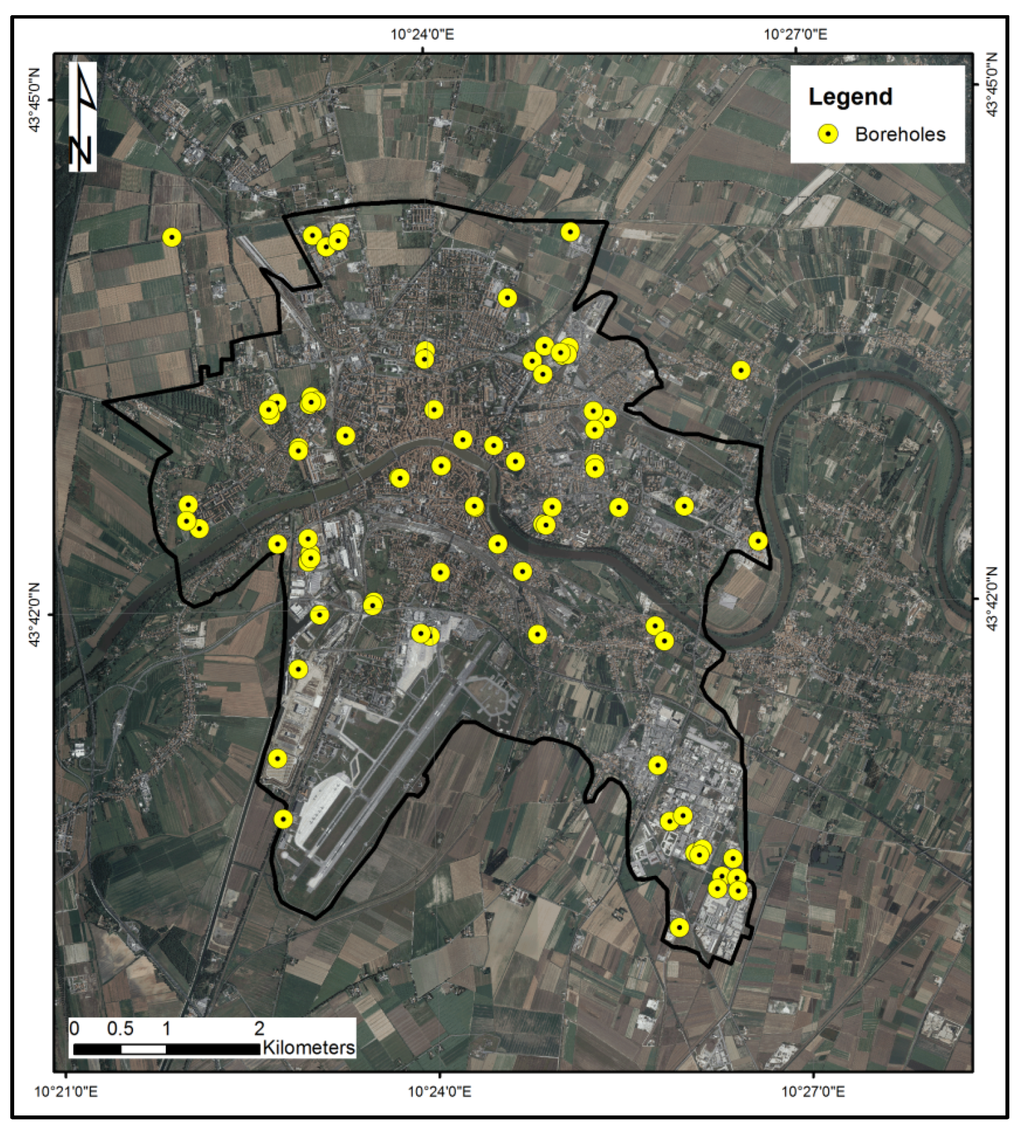
Figure 4.
Selected boreholes for the investigated area (represented as a black line).
Figure 4.
Selected boreholes for the investigated area (represented as a black line).

Table 2.
Lithological and geotechnical characteristics of the five lithology classes. Parameters, obtained from 105 undisturbed/minimally disturbed samples, are shown as mean values with standard deviation for each unit.
| Class | Facies Association | WN (%) | WL (%) | WP (%) | c′ (kPa) | φ′(°) | Cc | IP | Ic |
|---|---|---|---|---|---|---|---|---|---|
| Unit 1 | Very soft clay | 53.4 ± 12.7 | 69.0 ± 14.1 | 31.3 ± 7.1 | 21.4 ± 12.0 | 4.3 ± 2.3 | 0.5 ± 0.1 | 37.7 ± 8.8 | 0.2 ± 0.1 |
| Unit 2 | Soft clay and silty clay | 44.1 ± 17.0 | 58.6 ± 6.4 | 28.4 ± 5.4 | 22.3 ± 14.1 | 8.1 ± 3.1 | 0.4 ± 0.1 | 28.9 ± 5.2 | 0.4 ± 0.1 |
| Unit 3 | Alternation of clayey silt and sandy silt | 28.5 ± 4.0 | 36.0 ± 6.0 | 22.7 ± 2.1 | 16.4 ± 9.1 | 17.0 ± 8.5 | 0.2 ± 0.1 | 13.3 ± 5.9 | - |
| Unit 4 | Stiff clay and silty clay | 26.7 ± 4.4 | 43.0 ± 14.9 | 25.0 ± 2.9 | 38.3 ± 17.5 | 9.8 ± 3.7 | 0.3 ± 0.2 | 18.5 ± 12.3 | 1.0 ± 0.1 |
| Unit 5 | Silty fine to coarse sand | 22.4 ± 5.0 | - | - | 10.0 ± 8.1 | 28.5 ± 4.2 | - | - | - |
Unit 1 consists of “pancone”, a homogenous succession of very soft gray-blue clay and silt clay with sporadic, thin, fine, sandy layers, mainly appearing in the upper part of the layer. Abundant shells, wood fragments and organic matter characterize the unit. This sequence reflects the depositional brackish environment of a lagoonal basin [40]. The unit is 3–12 m thick and its upper boundary ranges from 8 to 20 m below the surface. According to the Casagrande plasticity chart [56], the unit is classified as inorganic or organic clay of elevated plasticity (CH-MH/OH). It is also characterized by an high natural water content (WN) that is near or sometimes higher than the liquid limit (WL), and a low consistency index (Ic) with a high compression index (Cc). By the geotechnical point of view Unit 1 is the weakest level in the Holocene sequence, as previously shown by Rampello and Callisto [57] in the case of Leaning Tower settlements. The depositional environment (lagoonal basin) leads to the high compressibility of the level and the high water content (53.4% ± 12.7%), which sometimes is close to or even greater than liquid limit (69.0% ± 14.1%). These parameters are strongly dependent on the organic matter content of this facies; in fact, variations in shear strength and physical parameters can be related to organic matter content variations or to the presence of fine sand intercalations that form a stiff layer in the sequence.
Unit 2 consists of dark soft clay and silty clay with high organic matter content with occasional peat layers, typical of swampland environment [32]. Abundant wood fragments and scattered shells are present. This unit is recorded between 6 and 10 m below surface with a variable thickness of 2–6 m. According to the Casagrande plasticity chart the unit is classified as inorganic or organic clay of elevated plasticity (CH-MH/OH). Unit 2 is another level with low strength and high compressibility which is characterized by water content and Atterberg limits (WL, WP) similar to the values of Unit 1 while the consistency index (Ic) and shear strength values are higher than Unit 1; this fact is probably related to a lower organic matter content of some samples.
Unit 3 is generally represented by a rhythmical alternation of clayey silt and sandy silt or silty sand of yellow-brownish color. No fossils are recorded. This succession is related to an alluvial environment close to the principal rivers and frequently subjected to flood events [32]. This unit has a discontinuous distribution in the plain at 2–6 m below surface, with a thickness smaller than 4 m. According to the Casagrande plasticity chart the unit is classified as inorganic or organic silt and silty clay of low to medium plasticity (ML/OL-CL). This level shows a high variability of state and mechanic parameters depending on the fine sand percentage in the succession (an example is given by the value of the drained friction angle, φ′). Unit 3 shows a decrease in water content, plasticity index and compression index as well as an increase in mechanical parameters compared to the two previous units. However, it must be considered a potentially compressible layer because of its degree of saturation; in fact, if these fine-grained layers are in saturated conditions, great loss of volume and compaction processes can occur due to the high load of a building [58].
Unit 4 consists of stiff clay and silty clay with low organic matter content and high consistency, pedogenetic calcareous nodules and yellow-brown mottles due to the presence of iron and manganese oxides [32]. This feature reflects a subaerial exposure of clay in a depositional setting of a floodplain far from the river channel, which is rarely affected by floods. The unit widely crops out in the plain, reaching a maximum depth of 5–6 m. According to the Casagrande plasticity chart the unit is classified as high consistency and low plasticity silt and clay (ML-OL) and it is characterized by a low compression index (Cc), high consistency index (Ic) and the highest shear strength resistance among the clayey layers.
Unit 5 consists of silty fine to coarse sand, occasionally rich in wood fragments and bioclasts, locally with founded pebbles and mud clasts. The unit has a distinctive fining-upwards trend and it is interpreted as fluvial channel fills [36,37,40]. The level has a strongly variable thickness (from 1 to 10 m) and can be found at various depths in a typical lenticular shape, sometimes overlaying Unit 1 deposits. Unit 5 shows low values for water content (WN) and drained cohesion (c′) associated with a high drained friction angle (φ′); the variability of these parameters could be correlated to a greater or lesser percentage of silts and fine sands. Unit 5 shows high shear resistance and low water content, making this level the one with the lowest settlement potential.
The worst geotechnical properties and high deformability potential are shown by Units 1 and 2, whereas Units 4 and 5 have the lowest compressibility values; Unit 3 displays intermediate characteristics. The presence of a highly compressible level (Unit 1) at a depth of 10–15 m below the sea level cannot explain itself in the settlements registered; in fact, only major buildings can transfer load at such depth. The subsidence must be related to the entire stratigraphy under a building, not only to a single layer. The worst scenario will be the simultaneous presence of Units 1 and 2, overlapped by variable thicknesses of Unit 4 with the local presence of saturated Unit 3 layers and the partial or total absence of Unit 5. With this context, major settlements must be expected. An improvement in the general resistance of this type of stratigraphic succession is the presence of a thick Unit 5 layer that, as reported by Sarti et al. [32], sometimes overlays directly on Unit 1, giving an increase of stability to the sequence, especially if the transmitted load does not reach the deepest compressible levels. Moreover, the depth of the most compressible sequences’ (Units 1 and 2) upper limit plays an important role in the consolidation process duration; in fact, a deeper limit implies a lower overpressure induced by a building’s load, producing a primary consolidation process that develops in less time.
4. Results and Discussion
The city of Pisa shows two areas with different deformation rates: the southwestern part, with null or very small subsidence rates, and the eastern portion, with a general lowering with maximum subsidence rates of 5–7 mm/year. This subsidence is associated with localized high deformations corresponding to single buildings or groups of buildings (Figure 3). Subsidence related to water overexploitation was excluded for two reasons: the phreatic surface does not show seasonal significant variations (Figure 2) and the extent of the subsiding areas with the highest displacement rates shows distribution and widening not coherent with the water exploitation.
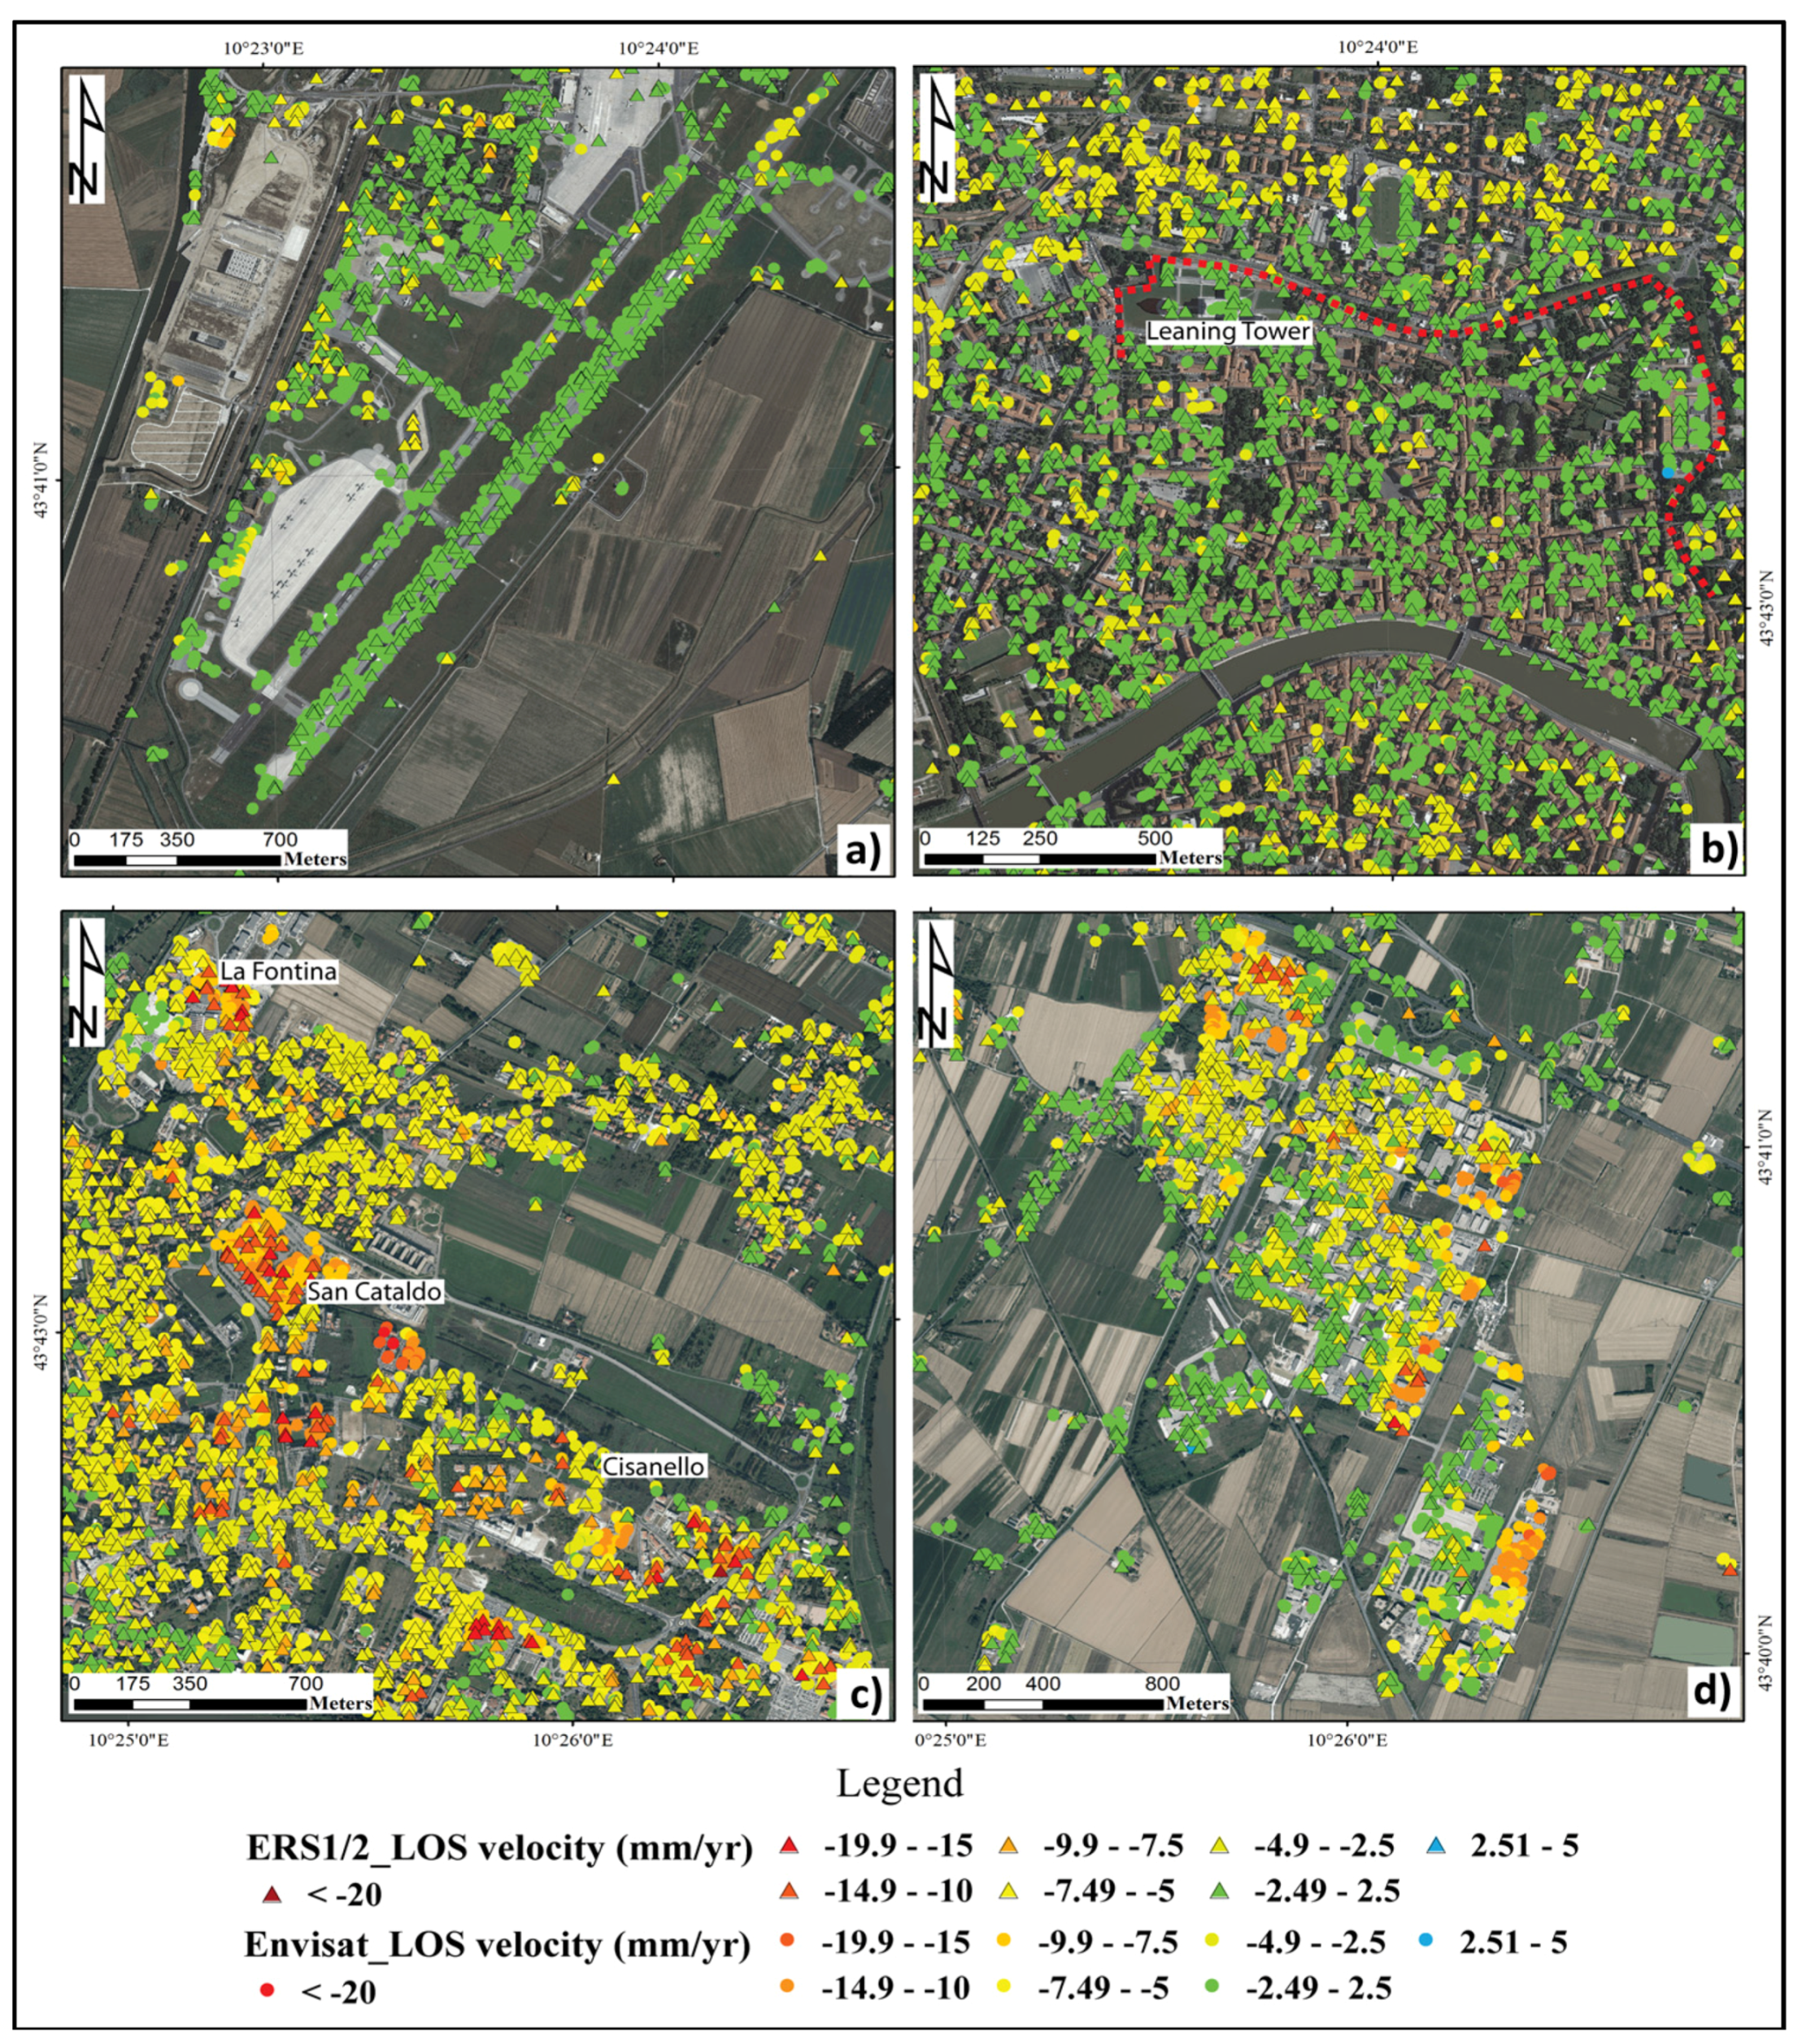
The two main areas that show small deformation rates are the Galileo Galilei airport and the old town center (Figure 5a,b). The two areas with the highest localized deformation values are the Cisanello—San Cataldo—La Fontina and Ospedaletto districts (Figure 5c,d). The Galileo Galilei airport structures and the runway area appear to be stable for the whole investigated time period. The mean LOS velocity values are 1.7 mm/year for ERS 1/2 and 1.1 mm/year for Envisat (Figure 5A). Different velocities are only found in the structures of the western part of the airport, with peaks of 6 mm/year and 5 mm/year for ERS 1/2 and Envisat, respectively. The inner city shows a general stability for the period from 1992 to 2010; the most important historical monuments such as the Leaning Tower show a displacement lower than 1 mm/year for both investigated periods. The average LOS velocity for the area inside of the city wall perimeter (Figure 5b) is 1.4 mm/year for ERS 1/2 and 1.2 mm/year for Envisat. The northeastern part of Pisa shows a general subsidence rate from 6 to 4 mm/year in both studied periods, with local peaks of velocity in proximity of some buildings (Figure 5C). In the La Fontina district, subsidence rates are higher than 15 mm/year for ERS 1/2 and 9 mm/year for Envisat. In the San Cataldo area, three groups of buildings show the highest LOS velocity in the area, more than 18 mm/year for ERS 1/2 and 20 mm/year for Envisat. The Cisanello district also reveals local deformation with maximum values on the order of 13 mm/year for ERS 1/2 and 11 mm/year for Envisat. The southeastern portion of Pisa, which hosts the industrial district of Ospedaletto, shows a particular pattern with LOS velocities increasing eastward from 1 mm/year to a maximum of 10 mm/year for ERS 1/2 and −16 mm/year for Envisat (Figure 5d).

Figure 5.
PSI maps of LOS deformation velocities in Pisa city districts between 1992 and 2010 showing stable areas ((a) Galileo Galilei airport, (b) city center) and high deformation districts ((c) La Fontina—San Cataldo—Cisanello districts, (d) Ospedaletto district). PSI maps are overlaid on a 2013 digital orthophoto.
4.1. Land Subsidence in the San Cataldo District
The most evident example of local deformations is the San Cataldo district where two groups of buildings recorded subsidence rates higher than 13 mm/year (Figure 6a). The highest mean LOS velocity is registered in the proximity of building B, a residential structure of five floors with a plain area of ca. 1000 m2; in the same complex of buildings (black square in Figure 6a) a deformation increase occurs from 20 mm/year of the subsidence rate at the northwestern building to 8.5 mm/year at the northeastern building (point A in Figure 6a). The four structures seem to be of the same constructive type with almost equal plain areas.
Time series of displacements show a linear increasing negative trend for buildings A and B; only Envisat data are available because the age of the construction of these structures is almost simultaneous with the end of the ERS 1/2 acquisition period. Building C shows mean LOS velocities lower than buildings A and B, but that is higher than those of the nearby buildings: 13.4 mm/year for ERS data and −9 mm/year for Envisat data. The time series of displacement shows a linear negative trend for the whole acquisition period, with a decrease in the LOS velocity value from ERS 1/2 to Envisat data (Figure 7c). Only three boreholes localized within building C’s perimeter are available (Figure 6a), with a mean distance of 300 m between the boreholes and buildings A and B; it is reasonable, considering that no important variation can occur in this distance thanks to the almost homogeneous distribution of Units 1, 2 and 4 (only local variations of Units 3 and 5 are possible). In particular, the upper limit of the most compressible succession (Units 1 and 2) lies at a depth variable from 4 (borehole 1642) to 5 m (borehole 1640) below the surface. This sequence, which has a total thickness of 25–30 m, is overlaid by a Unit 4 layer in boreholes 1641 and 1642, while in the borehole 1640 Unit 4 is partially replaced by a silty Unit 3 level (Figure 6b). As previously mentioned, this type of sequence is the most susceptible to settlement. With the exception of the presence of Units 3 and 5 in local intercalations, the same stratigraphy for the three buildings can be assumed; in this case, differences in the cumulate displacement and time series trend must be related to a further factor of anthropogenic origin. This external factor is the age of the construction of the buildings.
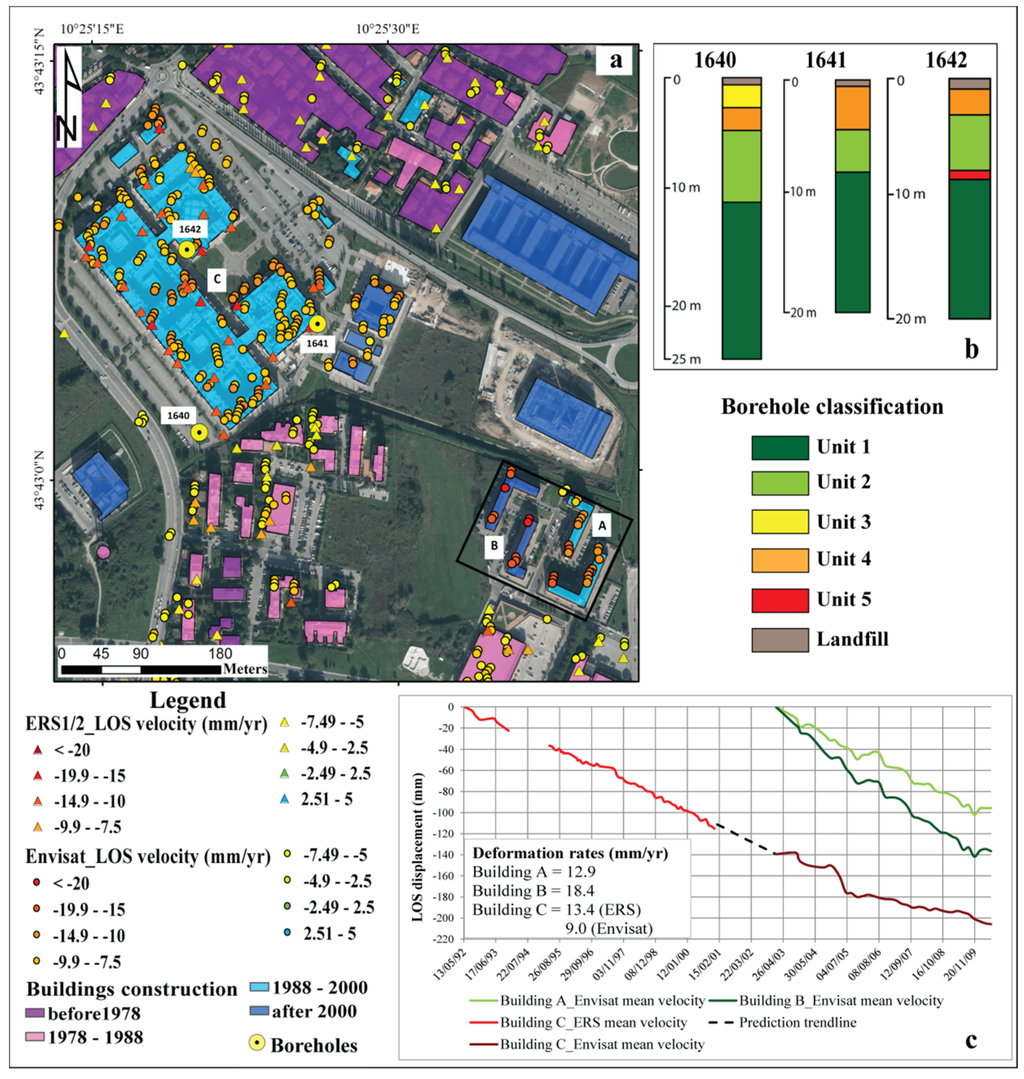
Figure 6.
(a) LOS displacements in the San Cataldo district (points A, B and C). PSI map is overlaid on a 2013 digital orthophoto; (b) Borehole selected for the analyzed area, the classification is the one proposed by Sarti et al. [32]; (c) ERS 1/2 and Envisat time series for building A, B and C. The gap between 2001 and 2003 was filled by a prediction trendline (black dashed line in panel c).

In the San Cataldo district the direct correlation between the anthropogenic factor and registered LOS velocities is clear; highest subsidence rates are shown by building B which has the most recent age of construction (time interval of 2000 to 2003, based on orthophotographic interpretation) while building C, which is the oldest, shows lower velocities. Considering buildings with an age of construction previous to 1988, subsidence rates decrease to the values of 3.5–5 mm/year, which are the lowest recorded in this area.
The consolidation process is divided in two phases [59]: primary consolidation, in which the greatest settlements are recorded, and secondary consolidation, where only cohesive and organic soils can produce a smaller amount of compression. The end of the process is highly time-dependent and is modified by the cohesive layers’ thickness, hydraulic conductivity, and drainage conditions, as well as by time and magnitude of the load imposition. An example of this process is represented by building C, where the mean deformation time series show a decrease in the velocity value in the Envisat acquisition period (2003 to 2010), which is symptomatic of a slowdown in the consolidation process typical of the transition from primary to secondary phase. The subsidence rate is still higher than 9 mm/year in some PS for two main reasons: the geotechnical characteristics of Units 1 and 2 (high compressibility, low hydraulic conductivity and high organic percentage) and the dimensions of the structure (occupied an area of around 30,000 m2 by the three floors of main building) that transfer a high load to the ground. On the other hand, building B shows a linear increasing negative trend between 2003 and 2010 with values coherent with a primary consolidation process which involves compressible organic-clayey layers as in Units 1 and 2. Building A shows lower LOS velocities than building B which is considered as a result of a consolidation process which began few years before building B was built (age of construction between 1996 and 2000 and after 2000 for building A and B, respectively).
4.2. Land Subsidence in the Ospedaletto District
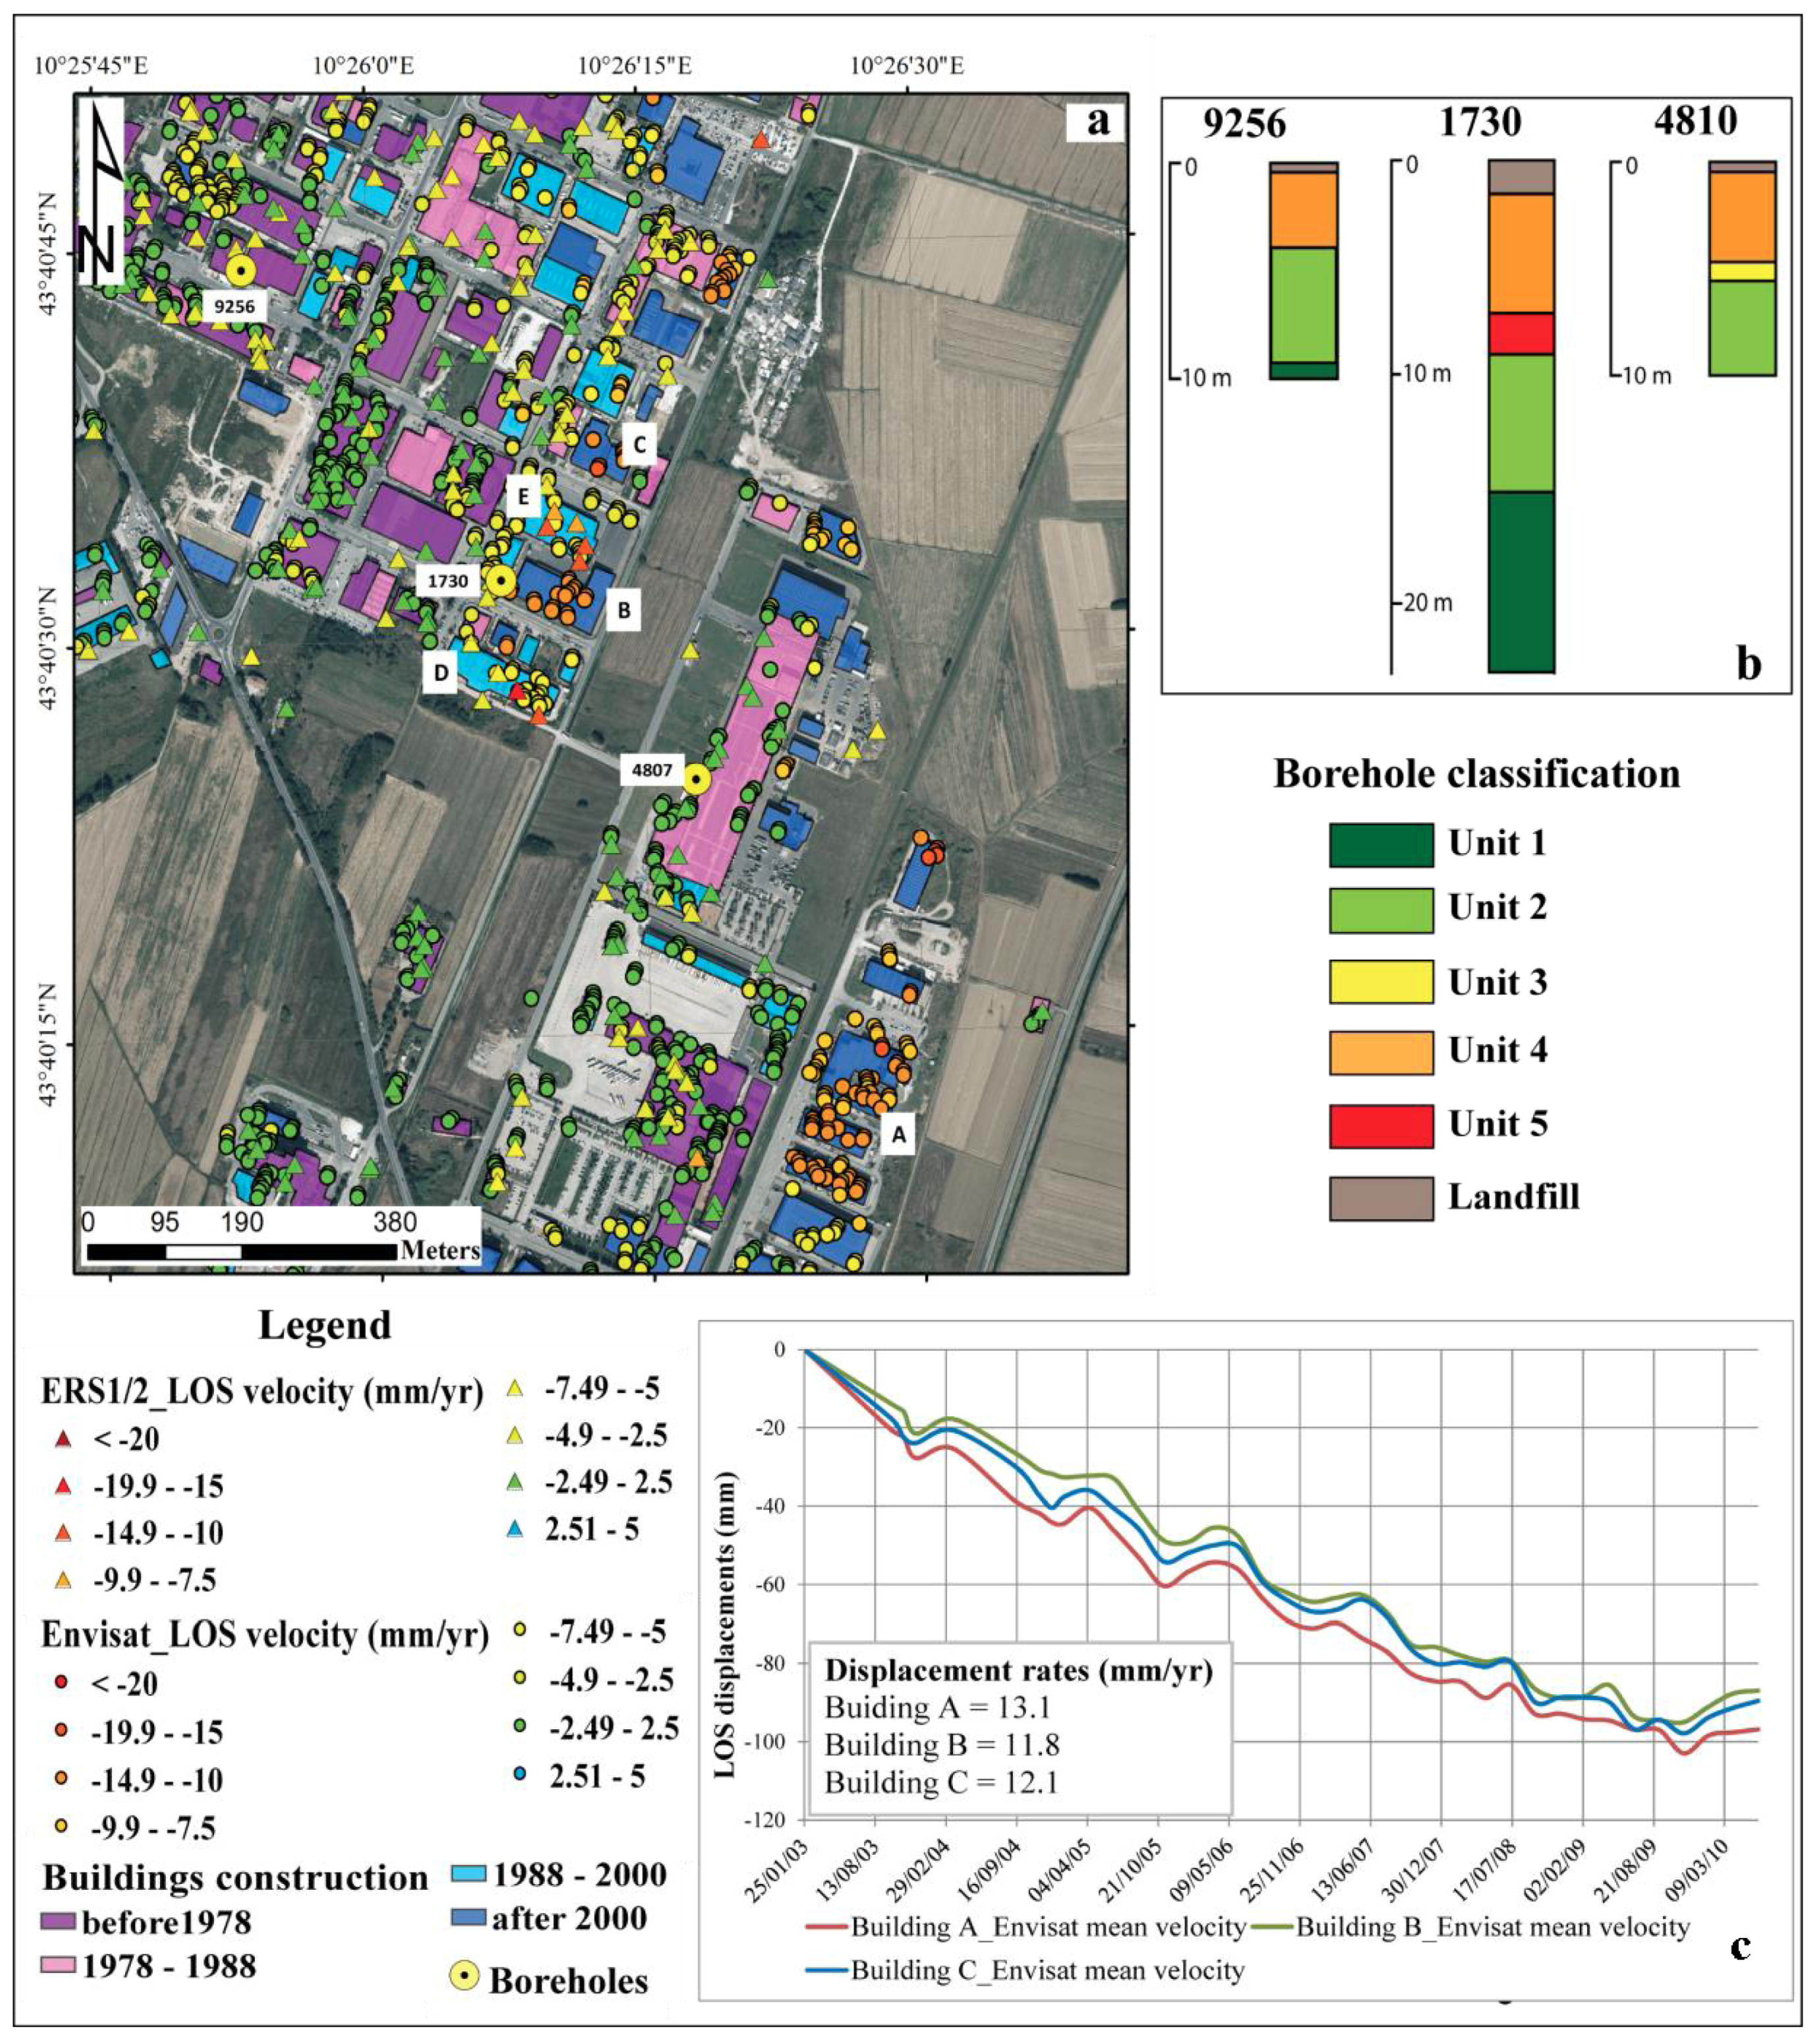
The Ospedaletto industrial district is another case study which shows the relationship between local high subsidence rates and urbanization (Figure 7a). Three structures show the highest subsidence rates in this area: group of buildings A (13.1 mm/year), building B (11.8 mm/year) and building C (12.1 mm/year). These structures are composed by commercial and light industry facilities with a maximum height of two floors and a plain area variable from 2500 m2 (southern building of group A structures) to 5400 m2 (building B).
Three of the 10 boreholes drilled in this area are shown in Figure 7a. The stratigraphic asset is again characterized by the presence of a deeper “pancone” layer (Unit 1) that is overlaid by a Unit 2 layer with a maximum thickness of 5 m. The upper limit of this highly compressible sequence lies at a depth variable from the minimum value of 5 m below the surface (borehole 9256) to the maximum of 9 m below the surface in borehole 1730; in borehole 4810, the drill did not reach the Unit 1 upper limit. The sequence is overlaid by a continuous Unit 4 layer with an almost unvaried thickness equal to 4 m. As in the previous example, this type of sequence is the most susceptible to settlements. Only one low compressibility level is found in borehole 1730, where a Unit 5 layer, 2 m thick, is recorded; the presence of this little break in the compressible sequence cannot represent an important factor in the settlement reduction. The small differences of registered subsidence rates between building B and the other two analyzed buildings are explained by the variation in the depth of the upper limit of the most compressible sequence (Units 1 and 2); in fact, in borehole 1730, which is the closest to building B, the Unit 2 upper limit is found at 9 m below the surface. In this case, the compressible sequence can be less influenced by the stress increment produced by the building load.
The age of construction factor once again plays a crucial role in the settlement evolution of the Ospedaletto industrial district: subsidence rates higher than 11 mm/year are recorded in proximity of buildings A, B and C (Figure 6a) which have been built in the time period from 2000 to 2003. Time series analysis has shown a slight decrease of LOS velocities for all three buildings at the end of the acquisition period (approximately from the 17 July 2008 acquisition, Figure 7c). This trend is in part due to an oscillation in the last four acquisitions of the satellite, but also can be related to the beginning of the slowdown phase in the consolidation process. Considering buildings with an age of construction ranging from 1978 to 1988, a clear decrease in the Envisat LOS mean velocities is noticeable. Two examples of this behavior are represented by buildings D and E which show ERS 1/2 subsidence rates (11.0 and 10.0 mm/year, respectively) almost double the Envisat rates (6 and 6.5 mm/year, respectively); this type of decreasing trend was already shown by building C in the San Cataldo district (Figure 6c). If we consider buildings with an older age of construction (before to 1978), registered LOS velocities vary within the range of 4.0 to 0.5 mm/year. This is observable especially in the western part of the analyzed area, where the oldest buildings and lowest subsidence rates are recorded (Figure 7a).

Figure 7.
(a) LOS displacements in the Ospedaletto industrial district (points A, B and C). PSI map is overlaid on a 2013 digital orthophoto; (b) Boreholes selected for the analyzed area, the classification is the one proposed by Sarti et al. [32]; (c) Envisat time series for building A, B and C.
Figure 7.
(a) LOS displacements in the Ospedaletto industrial district (points A, B and C). PSI map is overlaid on a 2013 digital orthophoto; (b) Boreholes selected for the analyzed area, the classification is the one proposed by Sarti et al. [32]; (c) Envisat time series for building A, B and C.
4.3. Comparison between Urbanization and Subsidence Rates
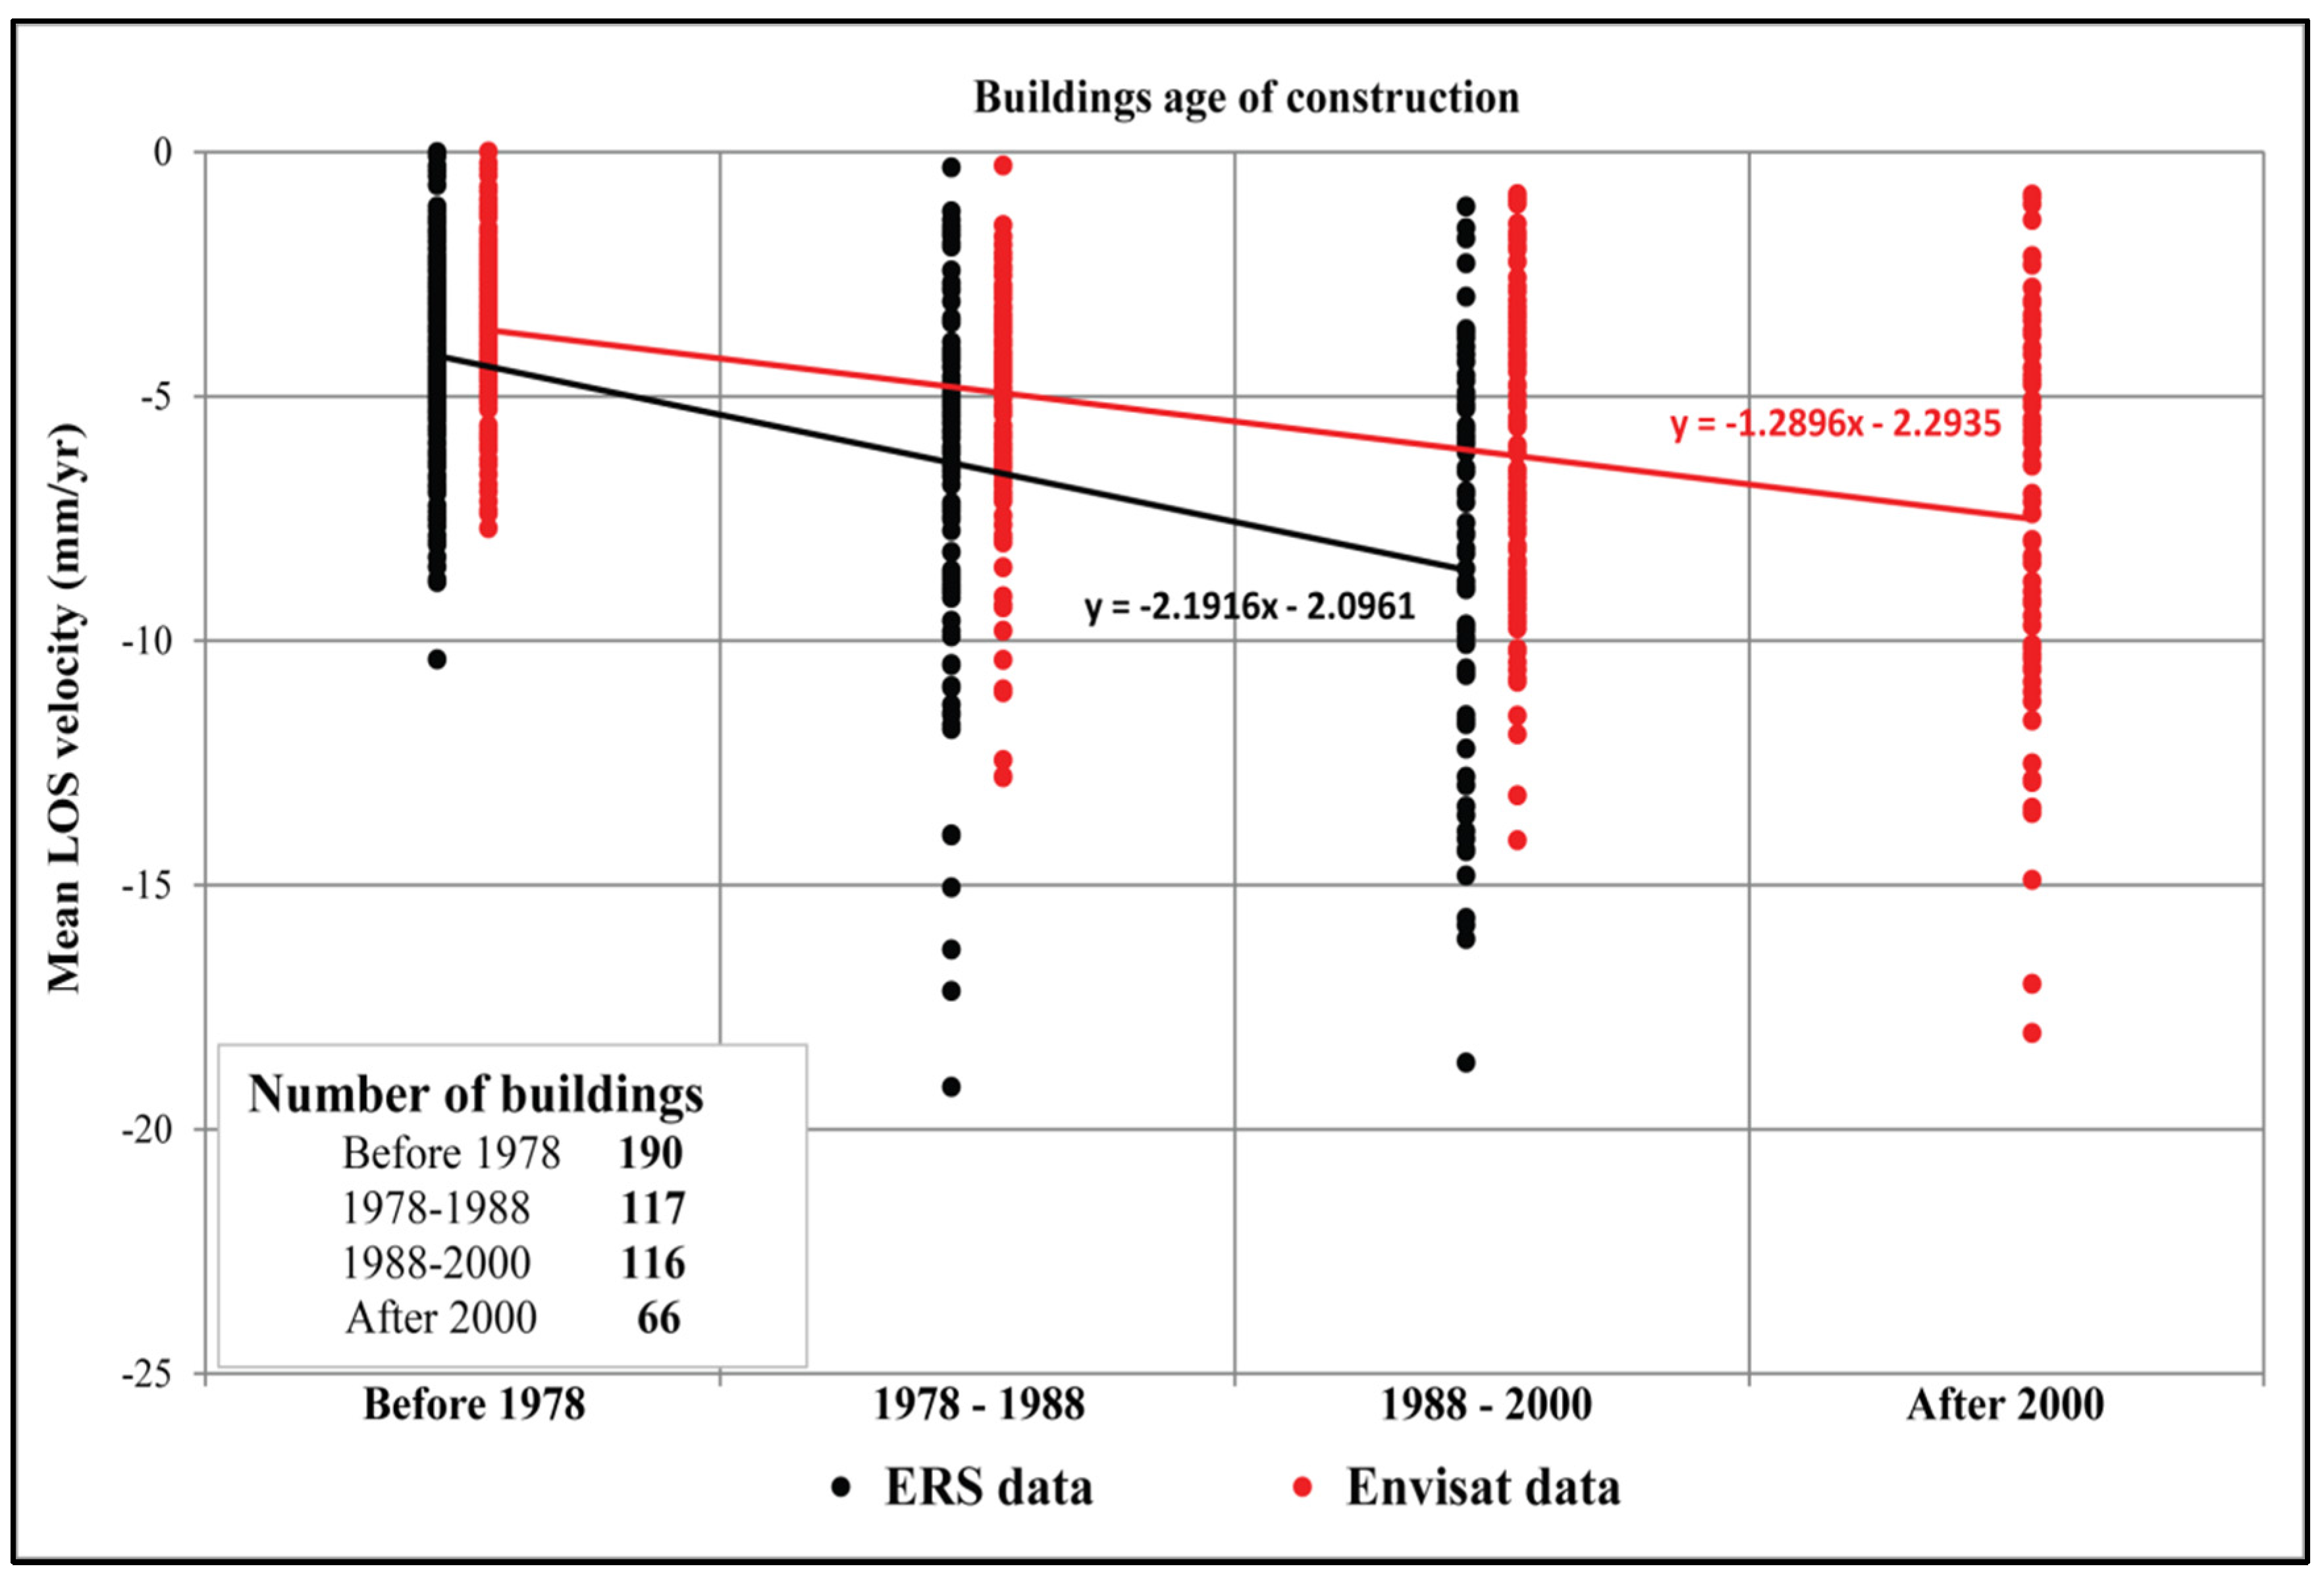
The importance of buildings’ age of construction is confirmed by LOS deformation velocities averaged in the area occupied by 489 buildings in the analyzed districts of the eastern part of the city of Pisa (Figure 5c,d).
In Figure 8, the ERS 1/2 and Envisat mean LOS velocity values for each selected building in the four ages of construction classes are plotted. ERS 1/2 data (black line and dots in Figure 8) shows a linear trend of subsidence which increases from the first class (a construction period that is previous to 1978) to the third class (a construction period from 1988 to 2000); this trend was already observed in the two examples of San Cataldo and Ospedaletto (Figure 6 and Figure 7). Buildings that fall into the after 2000 construction class are not considered within the ERS 1/2 analysis because of the acquisition period of the satellite (May 1992–December 2000). Envisat data (red line and dots in Figure 8) shows an equivalent subsidence trend with a lower slope coefficient value; in this case, the highest subsidence rates are recorded by buildings that fall into the fourth age of construction classes (the after 2000 construction period). The outliers with LOS velocity values higher than 10–15 mm/year represent buildings with high consolidation rates that are related to the geotechnical characteristics of Units 1 and 2, associated with a shallow upper limit of the compressible sequence. On the other hand, outliers with LOS velocities lower than −2 mm/year represent structures that are less affected by the accelerated consolidation process thanks to the presence of Units 1 and 2 layers with low organic matter content, which leads to a lower compressibility of the two units. Moreover, another explanation can be given by the depth of the upper limit of the compressible sequence; a deeper limit implies that the entire succession is less influenced by the stress increment produced by the building’s load.
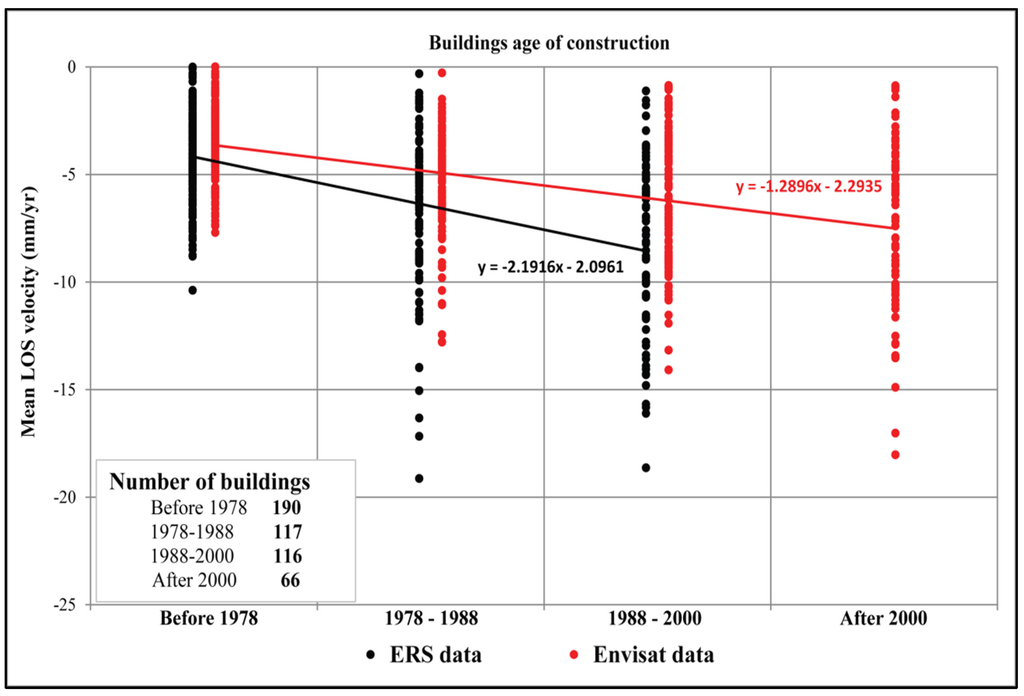
Figure 8.
Mean LOS velocities for analyzed buildings compared with the age of construction classification in the city of Pisa.
Figure 8.
Mean LOS velocities for analyzed buildings compared with the age of construction classification in the city of Pisa.
5. Conclusions
In this work, the spatial and temporal evolution of the ground subsidence in the Pisa plain has been described by combining geological and geotechnical data with PSInSAR data. The land subsidence in the study area is mainly due to two principal factors: high compressibility of clayey layers and recent urbanization of the eastern part of the city.
Subsidence deformation rates have been quantified through the use of ERS 1/2 and Envisat data analyzed using the PSInSAR technique, covering the time interval 1992–2010. PSInSAR results showed that the highest deformations only affect buildings with maximum subsidence rates higher than 20 mm/year for both satellites. For the single-building scale analysis, two main areas have been chosen: the San Cataldo and Ospedaletto districts. In these study areas, a widespread compressible sequence was detected at a depth of ca. 10–15 m below the surface; it is mainly composed of organic rich clays and silty clays that have been classified in two different litho-geotechnical units (Unit 1—“pancone” and Unit 2). This type of sequence clearly supported the development of a consolidation process with a high deformation rate for a long period thanks to the characteristics of the compressible layers (very low hydraulic conductivity and high organic content).
The geological factor cannot explain itself with the high subsidence rates detected by the satellite PSInSAR data with respect to certain buildings. Another factor had to be taken into account: the age of construction of the buildings. Using several buildings in the eastern part of the city, the direct correlation between the age of construction of the buildings and the registered LOS mean velocities has been demonstrated. This type of analysis has shown the importance of urbanization as an accelerating factor for the consolidation process.
Acknowledgments
This research is founded by PRIN PROJECT 2010–2011 “Time-space prediction of high impact landslides under changing precipitation regimes”. The authors want to thank Tele—Rilevamento Europa for having processed SAR data within the Piano Straordinario di Telerilevamento Ambientale project, funded by the Minister of the Environment and aimed at the generation of a nationwide ground motion product for Italy.
Author Contributions
Lorenzo Solari wrote the paper and analyzed the data. Andrea Ciampalini developed the project and helped in the geological and interferometric data interpretation. Federico Raspini, Silvia Bianchini and Sandro Moretti contributed to improve the quality of the manuscript and reviewed the paper.
Conflicts of Interest
The authors declare no conflict of interest.
References
- Stramondo, S.; Bozzano, F.; Marra, F.; Wegmuller, U.; Cinti, F.R.; Moro, M.; Saroli, M. Subsidence induced by urbanisation in the city of Rome detected by advanced InSAR technique and geotechnical investigations. Remote Sens. Environ. 2008, 112, 3160–3172. [Google Scholar] [CrossRef]
- Del Ventisette, C.; Solari, L.; Raspini, F.; Ciampalini, A.; Di Traglia, F.; Moscatelli, M.; Pagliaroli, A.; Moretti, S. Use of PSInSAR data to map highly compressible soil layers. Geol. Acta 2015, 13, 309–323. [Google Scholar]
- Teatini, P.; Tosi, L.; Strozzi, T.; Carbognin, L.; Cecconi, G.; Rosselli, R.; Libardo, S. Resolving land subsidence within the Venice Lagoon by persistent scatterer SAR interferometry. Phys. Chem. Earth 2012, 40, 72–79. [Google Scholar] [CrossRef]
- Tosi, L.; Teatini, P.; Strozzi, T. Natural versus anthropogenic subsidence of Venice. Sci. Rep. 2013, 3, 2710. [Google Scholar] [CrossRef] [PubMed]
- Xu, Y.S.; Ma, L.; Du, Y.J.; Shen, S.L. Analysis of urbanisation-induced land subsidence in Shanghai. Nat. Hazards 2012, 63, 1255–1267. [Google Scholar] [CrossRef]
- Dong, S.; Samsonov, S.; Yin, H.; Ye, S.; Cao, Y. Time-series analysis of subsidence associated with rapid urbanization in Shanghai, China measured with SBAS InSAR method. Environ. Earth Sci. 2014, 72, 677–691. [Google Scholar] [CrossRef]
- Chen, B.; Gong, H.; Li, X.; Lei, K.; Ke, Y.; Duan, G.; Zhou, C. Spatial correlation between land subsidence and urbanization in Beijing, China. Nat. Hazards 2015, 75, 2637–2652. [Google Scholar] [CrossRef]
- Qin, Y.; Perissin, D. Monitoring ground subsidence in Hong Kong via Spaceborne Radar: Experiments and validation. Remote Sens. 2015, 7, 10715–10736. [Google Scholar] [CrossRef]
- Dang, V.K.; Doubre, C.; Weber, C.; Gourmelen, N.; Masson, F. Recent land subsidence caused by the rapid urban development in the Hanoi region (Vietnam) using ALOS InSAR data. Nat. Hazards Earth Syst. Sci. 2014, 14, 657–674. [Google Scholar] [CrossRef]
- Abidin, H.Z.; Andreas, H.; Gumilar, I.; Fukuda, Y.; Pohan, Y.E.; Deguchi, T. Land subsidence of Jakarta (Indonesia) and its relation with urban development. Nat. Hazards 2011, 59, 1753–1771. [Google Scholar] [CrossRef]
- Dixon, T.H.; Amelung, F.; Ferretti, A.; Novali, F.; Rocca, F.; Dokka, R.; Sella, G.; Kim, S.W.; Wdowinski, S.; Withman, D. Space geodesy: Subsidence and flooding in New Orleans. Nature 2006, 441, 587–588. [Google Scholar] [CrossRef] [PubMed]
- Polcari, M.; Albano, M.; Saroli, M.; Tolomei, C.; Lancia, M.; Moro, M.; Stramondo, S. Subsidence detected by multi-pass differential SAR interferometry in the Cassino Plain (Central Italy): Joint effect of geological and anthropogenic factors? Remote Sens. 2014, 6, 9676–9690. [Google Scholar] [CrossRef]
- Tang, Y.Q.; Cui, Z.D.; Wang, J.X.; Lu, C.; Yan, X.X. Model test study of land subsidence caused by high-rise building group in Shanghai. Bull. Eng. Geol. Environ. 2008, 67, 173–179. [Google Scholar] [CrossRef]
- Tralli, D.M.; Blom, R.G.; Zlotnicki, V.; Donnellan, A.; Evans, D.L. Satellite remote sensing of earthquake, volcano, flood, landslide and coastal inundation hazards. ISPRS J. Photogram. Remote Sens. 2005, 59, 185–198. [Google Scholar] [CrossRef]
- Joyce, K.E.; Belliss, S.E.; Samsonov, S.V.; McNeill, S.J.; Glassey, P.J. A review of the status of satellite remote sensing and image processing techniques for mapping natural hazards and disasters. Prog. Phys. Geogr. 2009, 33, 183–207. [Google Scholar] [CrossRef]
- Amelung, F.; Galloway, D.L.; Bell, J.W.; Zebker, H.A.; Laczniak, R.J. Sensing the ups and downs of Las Vegas: InSAR reveals structural control of land subsidence and aquifer-system deformation. Geology 1999, 27, 483–486. [Google Scholar] [CrossRef]
- Fruneau, B.; Sarti, F. Detection of ground subsidence in the city of Paris using radar interferometry: Isolation of deformation from atmospheric artifacts using correlation. Geophys. Res. Lett. 2000, 27, 3981–3984. [Google Scholar] [CrossRef]
- Lu, Z.; Danskin, W.R. InSAR analysis of natural recharge to define structure of a ground-water basin, San Bernardino, California. Geophys. Res. Lett. 2001, 28, 2661–2664. [Google Scholar] [CrossRef]
- Farina, P.; Moretti, S.; Colombo, D.; Fumagalli, A.; Manunta, P. Landslide risk analysis by means of remote sensing techniques: Results from the ESA/SLAM project. In Proceedings of the IEEE International Geoscience and Remote Sensing Symposium IGARSS′04, Anchorage, AK, USA, 20–24 September 2004; Volume 1.
- Ferretti, A.; Novali, F.; Bürgmann, R.; Hilley, G.; Prati, C. InSAR permanent scatterer analysis reveals ups and downs in San Francisco Bay area. Eos Trans. Am. Geophys. Union 2004, 85, 317–324. [Google Scholar] [CrossRef]
- Bell, J.W.; Amelung, F.; Ferretti, A.; Bianchi, M.; Novali, F. Permanent scatterer InSAR reveals seasonal and long-term aquifer-system response to groundwater pumping and artificial recharge. Water Resour. Res. 2008, 44. [Google Scholar] [CrossRef]
- Osmanoğlu, B.; Dixon, T.H.; Wdowinski, S.; Cabral-Cano, E.; Jiang, Y. Mexico City subsidence observed with persistent scatterer InSAR. Int. J. Appl. Earth Obs. Geoinf. 2011, 13, 1–12. [Google Scholar] [CrossRef]
- Raspini, F.; Cigna, F.; Moretti, S. Multi-temporal mapping of land subsidence at basin scale exploiting Persistent Scatterer Interferometry: Case study of Gioia Tauro plain (Italy). J. Maps 2012, 8, 514–524. [Google Scholar] [CrossRef]
- Rosi, A.; Agostini, A.; Tofani, V.; Casagli, N. A Procedure to Map Subsidence at the Regional Scale Using the Persistent Scatterer Interferometry (PSI) Technique. Remote Sens. 2014, 6, 10510–10522. [Google Scholar] [CrossRef]
- Kim, J.W.; Lu, Z.; Jia, Y.; Shum, C.K. Ground subsidence in Tucson, Arizona, monitored by time-series analysis using multi-sensor InSAR datasets from 1993 to 2011. ISPRS J. Photogramm. Remote Sens. 2015, 107, 126–141. [Google Scholar] [CrossRef]
- Meisina, C.; Zucca, F.; Notti, D.; Colombo, A.; Cucchi, A.; Savio, G.; Giannico, C.; Bianchi, M. Geological interpretation of PSInSAR data at regional scale. Sensors 2008, 8, 7469–7492. [Google Scholar] [CrossRef]
- Cigna, F.; Del Ventisette, C.; Liguori, V.; Casagli, N. Advanced radar-interpretation of InSAR time series for mapping and characterization of geological processes. Nat. Hazards Earth Syst. Sci. 2011, 11, 865–881. [Google Scholar] [CrossRef]
- Berti, M.; Corsini, A.; Franceschini, S.; Iannacone, J.P. Automated classification of Persistent Scatterers Interferometry time series. Nat. Hazards Earth Syst. Sci. 2013, 13, 1945–1958. [Google Scholar] [CrossRef]
- Bianchini, S.; Moretti, S. Analysis of recent ground subsidence in the Sibari plain (Italy) by means of satellite SAR interferometry-based methods. Int. J. Remote Sens. 2015, 36, 4550–4569. [Google Scholar] [CrossRef]
- Martini, I.P.; Sagri, M. Tectono-sedimentary characteristics of Late Miocene-Quaternary extensional basins of the Northern Apennines, Italy. Earth-Sci. Rev. 1993, 34, 197–233. [Google Scholar] [CrossRef]
- Cantini, P.; Testa, G.; Zanchetta, G.; Cavallini, R. The Plio-Pleistocene evolution of extensional tectonics in northern Tuscany, as constrained by new gravimetric data from the Montecarlo Basin (lower Arno Valley, Italy). Tectonophysics 2001, 330, 25–43. [Google Scholar] [CrossRef]
- Sarti, G.; Rossi, V.; Amorosi, A. Influence of Holocene stratigraphic architecture on ground surface settlements: A case study from the City of Pisa (Tuscany, Italy). Sediment. Geol. 2012, 281, 75–87. [Google Scholar] [CrossRef]
- Pascucci, V. Neogene evolution of the Viareggio basin, Northern Tuscany (Italy). GeoActa 2005, 4, 123–138. [Google Scholar]
- Amorosi, A.; Rossi, V.; Sarti, G.; Mattei, R. Coalescent valley fills from the late Quaternary record of Tuscany (Italy). Quat. Int. 2013, 288, 129–138. [Google Scholar] [CrossRef]
- Aguzzi, M.; Amorosi, A.; Colalongo, M.L.; Ricci Lucchi, M.; Rossi, V.; Sarti, G.; Vaiani, S.C. Late Quaternary climatic evolution of the Arno coastal plain (Western Tuscany, Italy) from subsurface data. Sediment. Geol. 2007, 202, 211–229. [Google Scholar] [CrossRef]
- Amorosi, A.; Pavesi, M.; Ricci Lucchi, M.; Sarti, G.; Piccin, A. Climatic signature of cyclic fluvial architecture from the Quaternary of the central Po Plain, Italy. Sediment. Geol. 2008, 209, 58–68. [Google Scholar] [CrossRef]
- Amorosi, A.; Sarti, G.; Rossi, V.; Fontana, V. Anatomy and sequence stratigraphy of the late Quaternary Arno valley fill (Tuscany, Italy). Adv. Appl. Seq. Stratigr. Italy 2008, 1, 55–66. [Google Scholar]
- Amorosi, A.; Ricci Lucchi, M.; Rossi, V.; Sarti, G. Climate change signature of small-scale parasequences from Lateglacial–Holocene transgressive deposits of the Arno valley fill. Palaeogeogr. Palaeoclimatol. Palaeoecol. 2009, 273, 142–152. [Google Scholar] [CrossRef]
- Lambeck, K.; Antonioli, F.; Anzidei, M.; Ferranti, L.; Leoni, G.; Scicchitano, G.; Silenzi, S. Sea level change along the Italian coast during the Holocene and projections for the future. Quat. Int. 2011, 232, 250–257. [Google Scholar] [CrossRef]
- Rossi, V.; Amorosi, A.; Sarti, G.; Potenza, M. Influence of inherited topography on the Holocene sedimentary evolution of coastal systems: An example from Arno coastal plain (Tuscany, Italy). Geomorphology 2011, 135, 117–128. [Google Scholar] [CrossRef]
- Sarti, G.; Bini, M.; Giacomelli, S. The growth and the decline of Pisa (Tuscany, Italy) up to the Middle ages: Correlations with landscape and geology. Geological setting and urban development of selected Italian towns up to the Middle ages and legacies of ancient problems throughout the ages. II Quaternario Ital. J. Quat. Sci. 2010, 23, 311–322. [Google Scholar]
- Rossi, V.; Amorosi, A.; Sarti, G.; Romagnoli, R. New stratigraphic evidence for the mid-late Holocene fluvial evolution of the Arno coastal plain (Tuscany, Italy). Géomorphologie 2012, 2, 201–214. [Google Scholar] [CrossRef]
- Bruni, S.; Cosci, M. Alpheae veterem contemptlor originis urbem, quam cingunt geminis Arnus et Ausur aquis. Il paesaggio di Pisa etrusca e romana: Materiali e problemi. In Il Porto Urbano di Pisa Antica. La Fase Etrusca. Il Contesto e il Relitto Ellenistico; Bruni, S., Ed.; Silvana Editoriale: Milan, Italy, 2003; pp. 29–43. [Google Scholar]
- Relazione Generale e Allegati Tecnici del Piano Strutturale del Comune di Pisa. Available online: http://www.comune.pisa.it/doc/sit-pisa/nuovo_prg/relaz.htm (accessed on 7 December 2015).
- Massonnet, D.; Feigl, K.L. Radar interferometry and its application to changes in the Earth’s surface. Rev. Geophys. 1998, 36, 441–500. [Google Scholar] [CrossRef]
- Zebker, H.; Villasenor, J. Decorrelation in interferometric radar echoes. IEEE Trans. Geosci. Remote Sens. 1992, 30, 950–959. [Google Scholar] [CrossRef]
- Massonnet, D.; Feigl, K.L. Discrimination of geophysical phenomena in satellite radar interferograms. Geophys. Res. Lett. 1995, 22, 1537–1540. [Google Scholar] [CrossRef]
- Ferretti, A.; Prati, C.; Rocca, F. Nonlinear subsidence rate estimation using permanent scatterers in differential SAR interferometry. IEEE Trans. Geosci. Remote Sens. 2000, 38, 2202–2212. [Google Scholar] [CrossRef]
- Ferretti, A.; Prati, C.; Rocca, F. Permanent scatterers in SAR interferometry. IEEE Trans. Geosci. Remote Sens. 2001, 39, 8–20. [Google Scholar] [CrossRef]
- Italian Ministry of the Environment and Protection of Land and Sea (MATTM). Piano Straordinario di Telerilevamento Ambientale (PSTA); Linee guida per l’analisi dei dati intereferometrici satellitari in aree soggette a dissesti idrogeologici; MATTM: Rome, Italy, 2010; p. 108. [Google Scholar]
- National Cartographic Portal. Available online: http://www.pcn.minambiente.it (accessed on 29 March 2015).
- Tapete, D.; Cigna, F. Satellite-based preventive diagnosis: Use of Persistent Scatterer Interferometry on cultural heritage sites in Italy. In Changing How We View the World, In Proceedings of the Remote Sensing and Photogrammetry Society Conference, University of Greenwich, London, UK, 12–14 September 2012.
- Bellotti, F.; Bianchi, M.; Colombo, D.; Ferretti, A.; Tamburini, A. Advanced InSAR techniques to support landslide monitoring. Math. Planet Earth 2014, 287–290. [Google Scholar] [CrossRef]
- Peduto, D.; Cascini, L.; Arena, L.; Ferlisi, S.; Fornaro, G.; Reale, D. A general framework and related procedures for multiscale analyses of DInSAR data in subsiding urban areas. ISPRS J. Photogramm. Remote Sens. 2015, 105, 186–210. [Google Scholar] [CrossRef]
- Pratesi, F.; Tapete, D.; Terenzi, G.; Del Ventisette, C.; Moretti, S. Rating health and stability of engineering structures via classification indexes of InSAR Persistent Scatterers. Int. J. Appl. Earth Obs. Geoinf. 2015, 40, 81–90. [Google Scholar] [CrossRef]
- Casagrande, A. Classification and identification of soils. Trans. Am. Soc. Civ. Eng. 1948, 113, 901–930. [Google Scholar]
- Rampello, S.; Callisto, L. A study on the subsoil of the Tower of Pisa based on results from standard and high-quality samples. Can. Geotech. J. 1998, 35, 1074–1092. [Google Scholar] [CrossRef]
- Rogers, C.D.F. Types and distribution of collapsible soils. In Genesis and Properties of Collapsible Soils; Derbyshire, E., Dijkstra, T., Smalley, I.J., Eds.; Springer Netherlands: Amsterdam, The Netherland, 1995; pp. 1–17. [Google Scholar]
- Terzaghi, K.; Peck, R.B. Soil Mechanics in Engineering Practice; John Wiley & Sons: Hoboken, NJ, USA, 1967. [Google Scholar]
© 2016 by the authors; licensee MDPI, Basel, Switzerland. This article is an open access article distributed under the terms and conditions of the Creative Commons by Attribution (CC-BY) license (http://creativecommons.org/licenses/by/4.0/).