After publication of the research paper [1], an error was discovered in the extraction of the timestamps of the TCCON (Total Carbon Column Observing Network) measurements from the TCCON data files. This induced sporadic shifts of the calculated TCCON dates, by one full day before of after the real measurement date (or no shift in some cases). These shifts led to an incorrect estimation of the time differences between the measurements of the TANSO-FTS (Thermal And Near-Infrared Sensor Fourier Transform Spectrometer) instrument on GOSAT (Greenhouse Gases Observing Satellite) and the TCCON soundings. Therefore, the set of coincidences was partially incorrect, causing errors in the bias estimates, standard deviations of the differences, linear regression and correlation coefficients.
A new set of coincident measurements was selected based on corrected TCCON time information. The statistics of the comparison: bias estimates and standard deviation of the differences, linear regression and correlation coefficients, sensitivity to geophysical and retrieval parameters, were re-calculated based on the correct correlative ensemble. The corresponding tables and figures of Sections 5.1, 5.2 and 5.3 were updated accordingly. Note that the comparison methodology and algorithms were not in question; thus, they have been used, unaltered, for the re-computation. Therefore, the main findings and conclusions of the research paper remain essentially the same.
The updated numerical results (Abstract; Section 5.1 paragraphs 2, 5 and 6; Section 5.2 paragraph 3, Section 5.3 paragraphs 4 and 5, and Conclusions) can be inferred from the corrected tables and figures presented here, except for the following elements only mentioned in the initial text [1]:
- Section 5.3, middle of paragraph 2:`The ensemble time series yield monthly mean differences globally equal to zero within their standard deviation: values between about −450 ppm to +120 ppm with an average of −100 ppm, standard deviations within 30 to 700 ppm. This shows that the seasonal variations in the Northern and Southern hemispheres, previously illustrated by the single-site XHO time series, tend to cancel out. The fact that the monthly mean values are mostly negative is likely explained by the increasingly low bias of TANSO-FTS XHO for larger TCCON mole fractions.’
- Section 5.3, end of paragraph 3:‘For example, target-mode observations around Park Falls, Lamont and Tsukuba respectively account for 62%, 99% and 100% of the coincidences found at each site using the nominal criteria (±1 in latitude/longitude, ±30 min in time). The exceptions are Sodankylä (0%), Darwin (8%), the JPL (31%) and Lauder (39%), which are sufficiently close to the standard GOSAT scanning pattern footprints to be observed routinely without requiring target-mode observations.’
- Section 5.3, end of paragraph 5:‘There also seems to be a slight bias with respect to the SZA values for both datasets, with differences becoming larger and negative for SZAs smaller than 25 and a corresponding global correlation of ∼0.16 for both GOSAT and TCCON (0.35 and 0.41 for TANSO-FTS and TCCON, respectively, for SZA values smaller than 25).’
The corrected tables (initially Table 2 and Table 3) and figures (initially Figure 3, Figure 4, Figure 6, Figure 7, Figure 8, Figure 9 and Figure 10) of Section 5 are presented in the same order as in the initial research paper [1] as: Table 2, Figure 3, Table 3 and Figure 4, Figure 6, Figure 7, Figure 8, Figure 9 and Figure 10. The reader should disregard the numerical values of the published text and consider those of the corrected Table 2 and Table 3 instead.

Table 2.
Correction of Table 2 in [1]. Results of the comparison between TANSO-FTS scans acquired within ±1 in latitude and in longitude of the TCCON sites and the average of TCCON measurements within ±30 min of the corresponding GOSAT overpasses. The number of matched scans is given. The absolute and relative values of the mean bias and standard deviation (SD) are indicated for each station. The ensemble and site-by-site results are also given.
Table 3.
Correction of Table 3 in [1]. Linear regression parameters (slope and intercept) and correlation coefficient (R) for TANSO-FTS scans acquired over land within ±1 in latitude and in longitude of the TCCON sites and the average of TCCON measurements within ±30 min of the corresponding GOSAT overpasses.
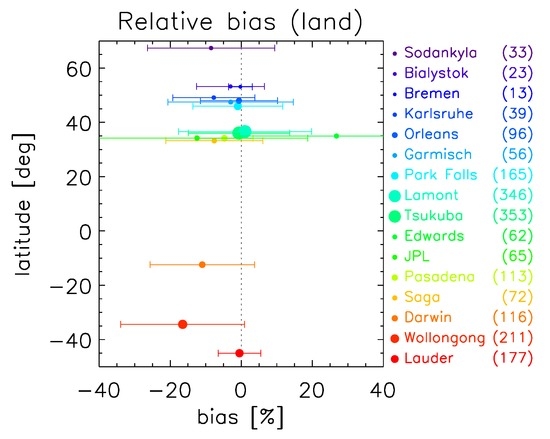
Figure 3.
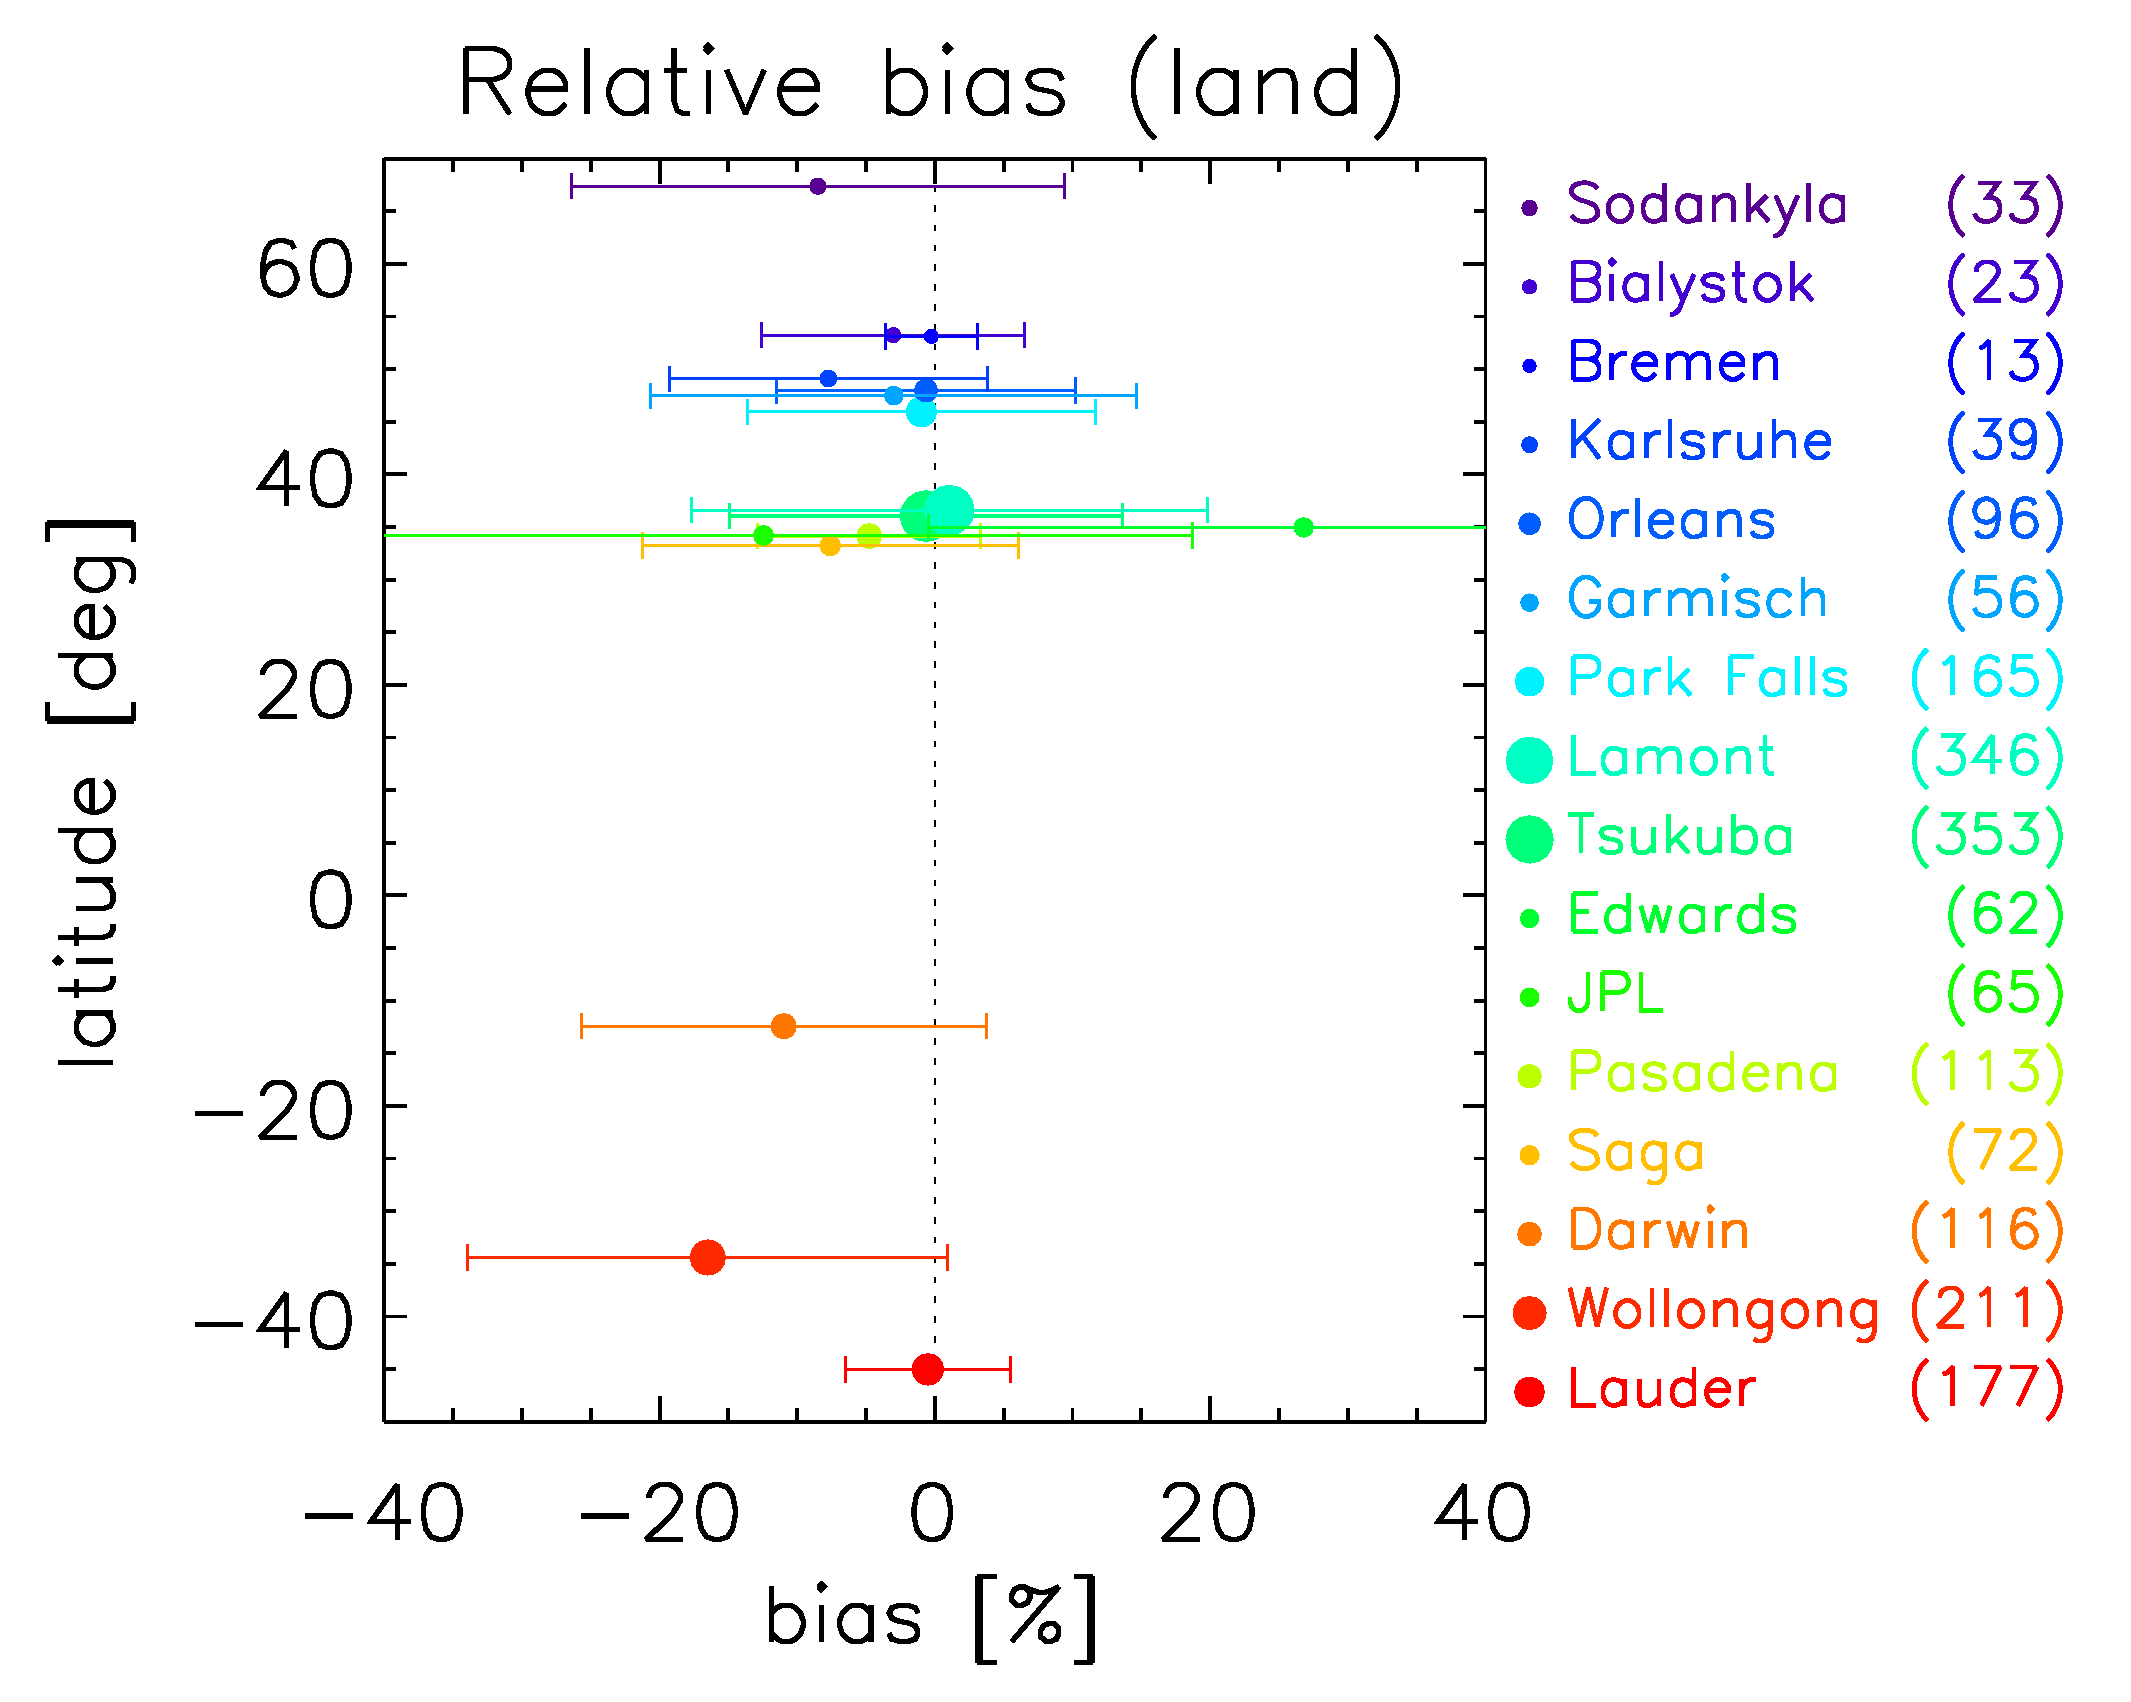
Correction of Figure 3 in [1]. Mean relative bias (filled circles) and associated standard deviation (“error bars” representing ) as a function of the latitude of the TCCON sites, for coincidence criteria of ±30 min and ±1 in latitude and longitude. The dataset names and corresponding number of coincidences are shown on the right-hand side, color-coded from purple to red in order of decreasing latitude from the northernmost site (Sodankylä, 67.4N) to the southernmost station (Lauder, 45.0S). The size of the symbols is proportional to the number of coincidences at each site.
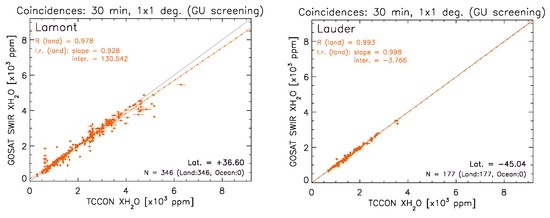
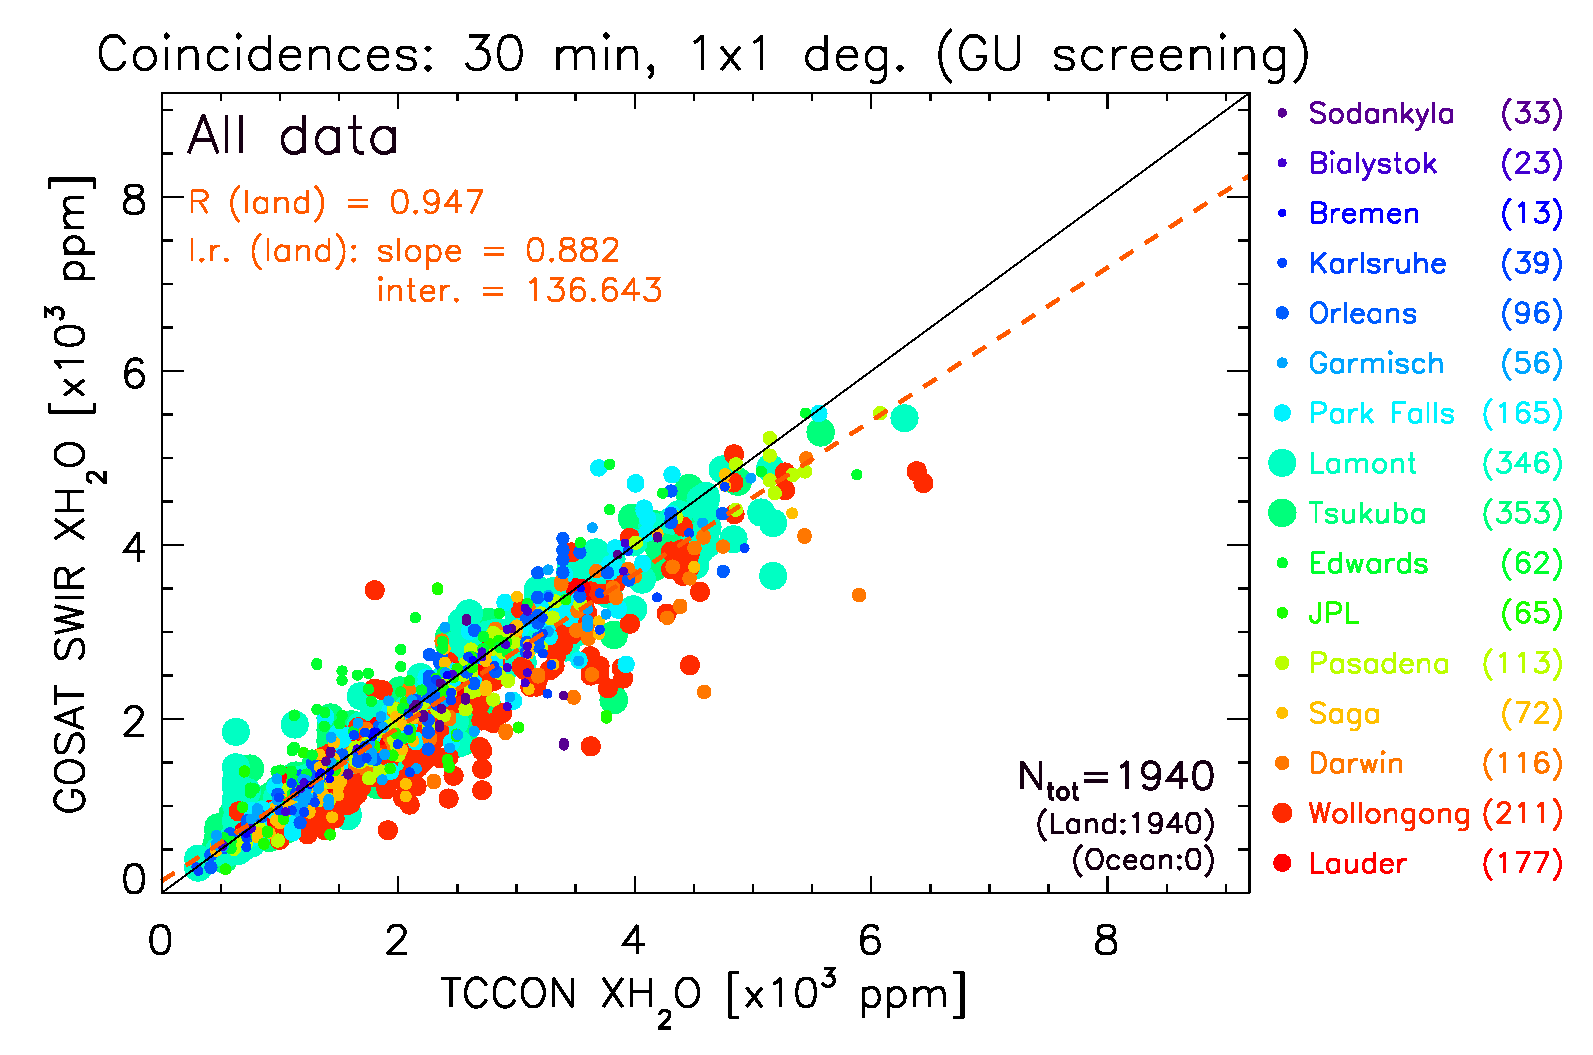
Figure 6.
Correction of Figure 6 in [1]. Scatter plot of the GOSAT TANSO-FTS XHO and coincident TCCON soundings (criteria of ±30 min and ±1 in latitude/longitude) at the Lamont (left) and Lauder (right) TCCON sites. All coincidences were found for TANSO-FTS land scans.
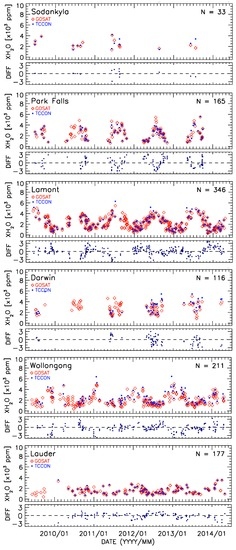
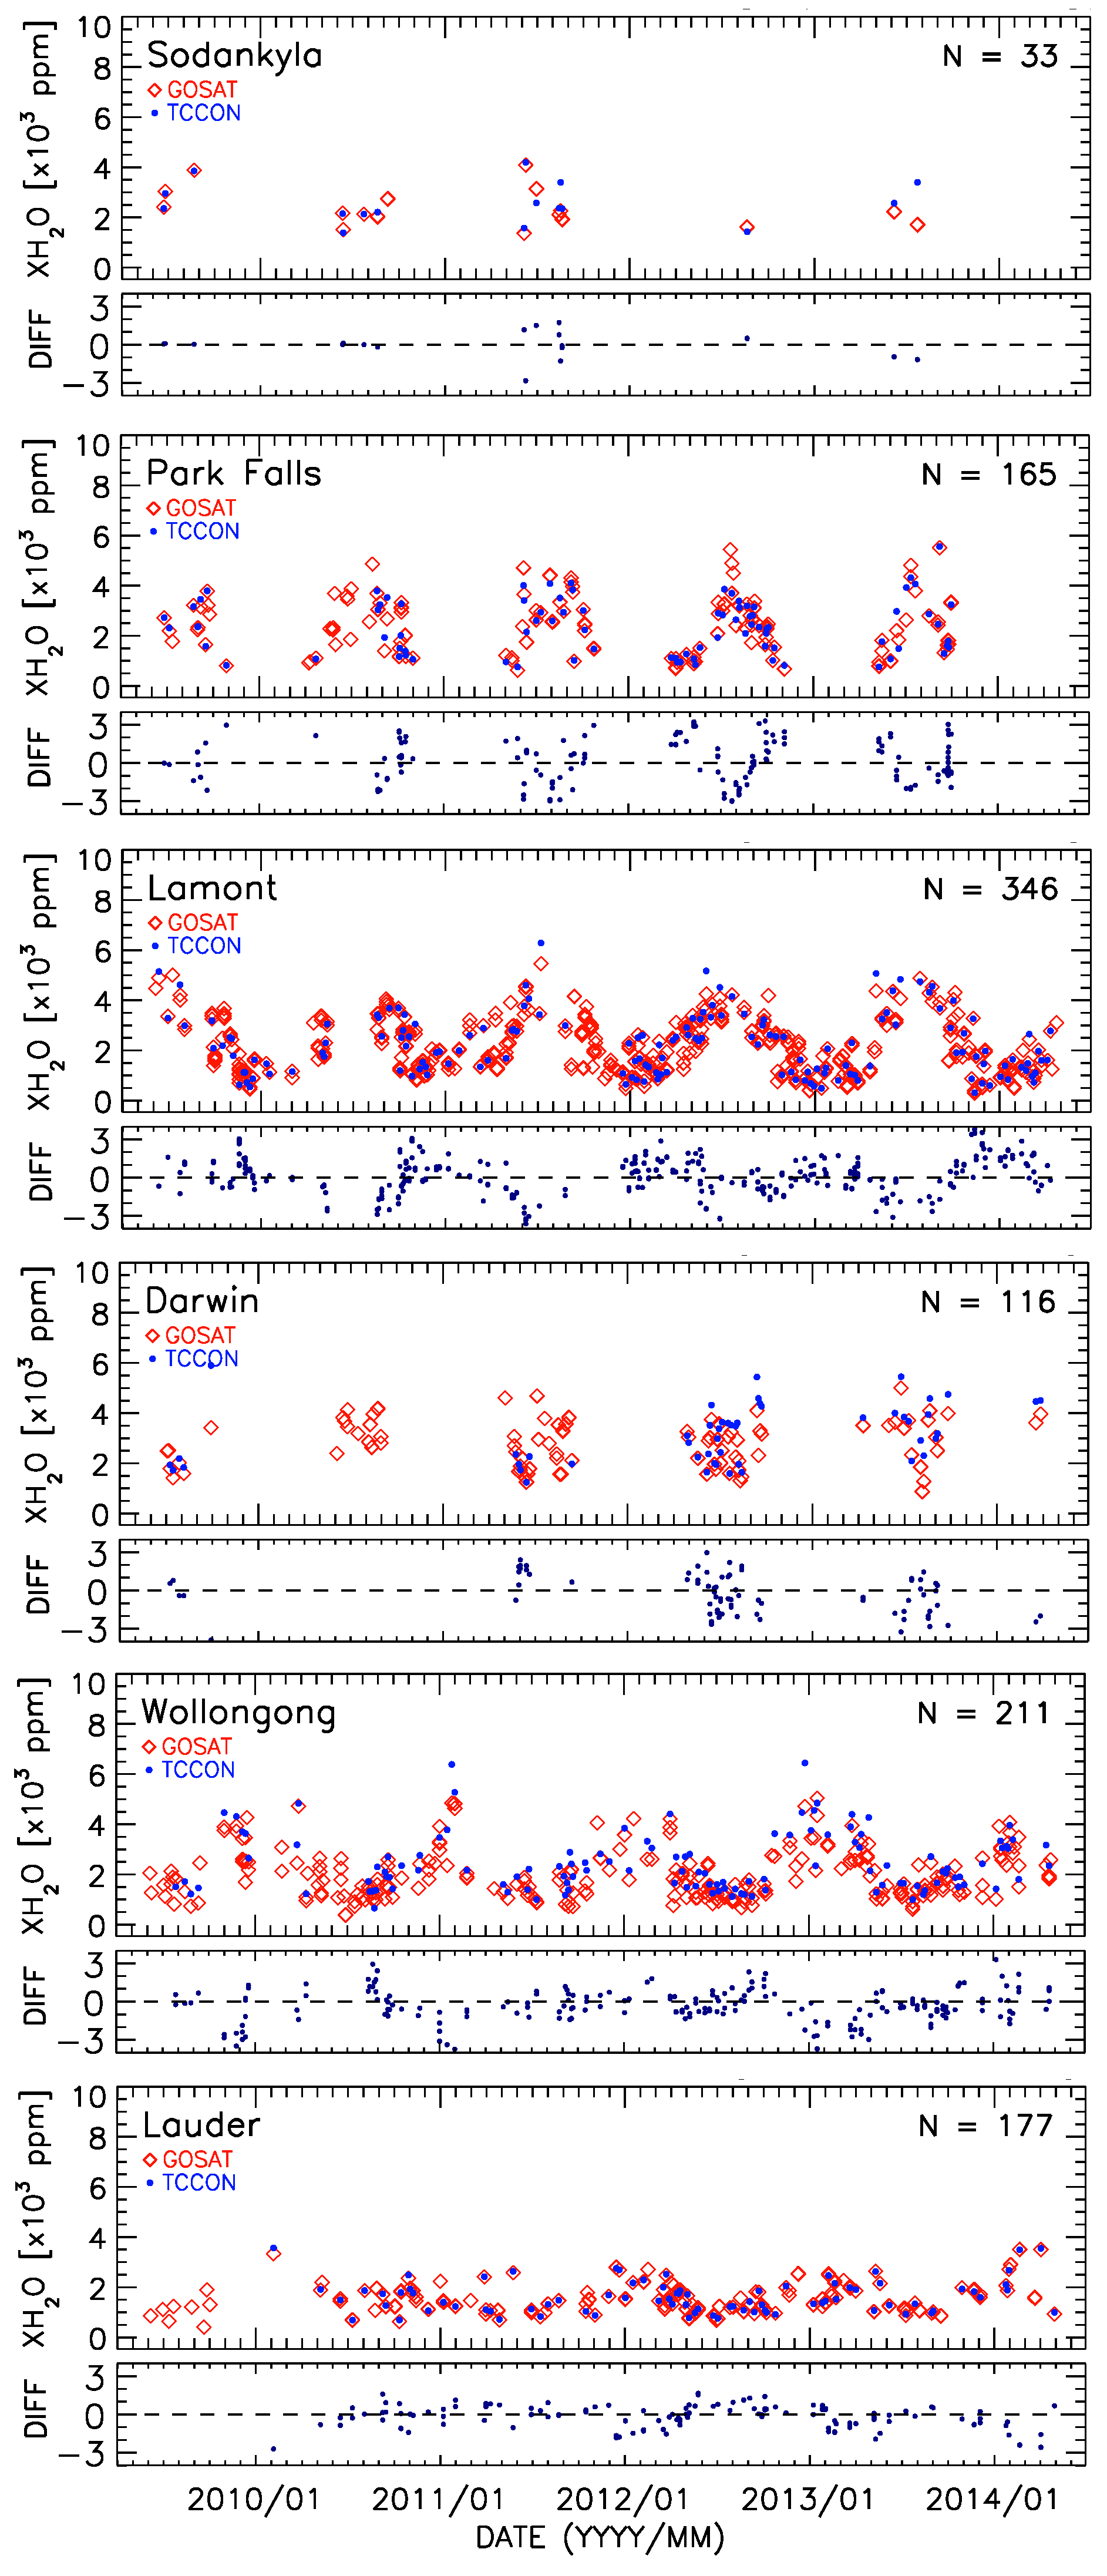
Figure 7.
Correction of Figure 7 in [1]. Time series of XHO at six TCCON sites for collocated TANSO-FTS data (±1 latitude/longitude, no time constraint) and for the average of TCCON measurements acquired within ±30 min of a GOSAT overpass. TCCON sites are ordered from top to bottom by decreasing latitude. For each site, the top panel shows the XHO time series of GOSAT (red diamonds) and TCCON (blue circles). Bottom panel: absolute differences (GOSAT−TCCON) for spatially- and temporally-coincident pairs.
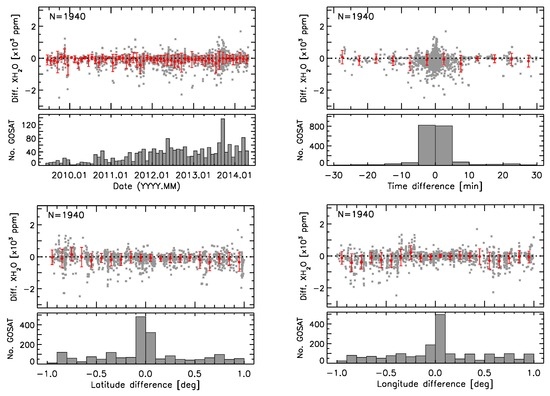
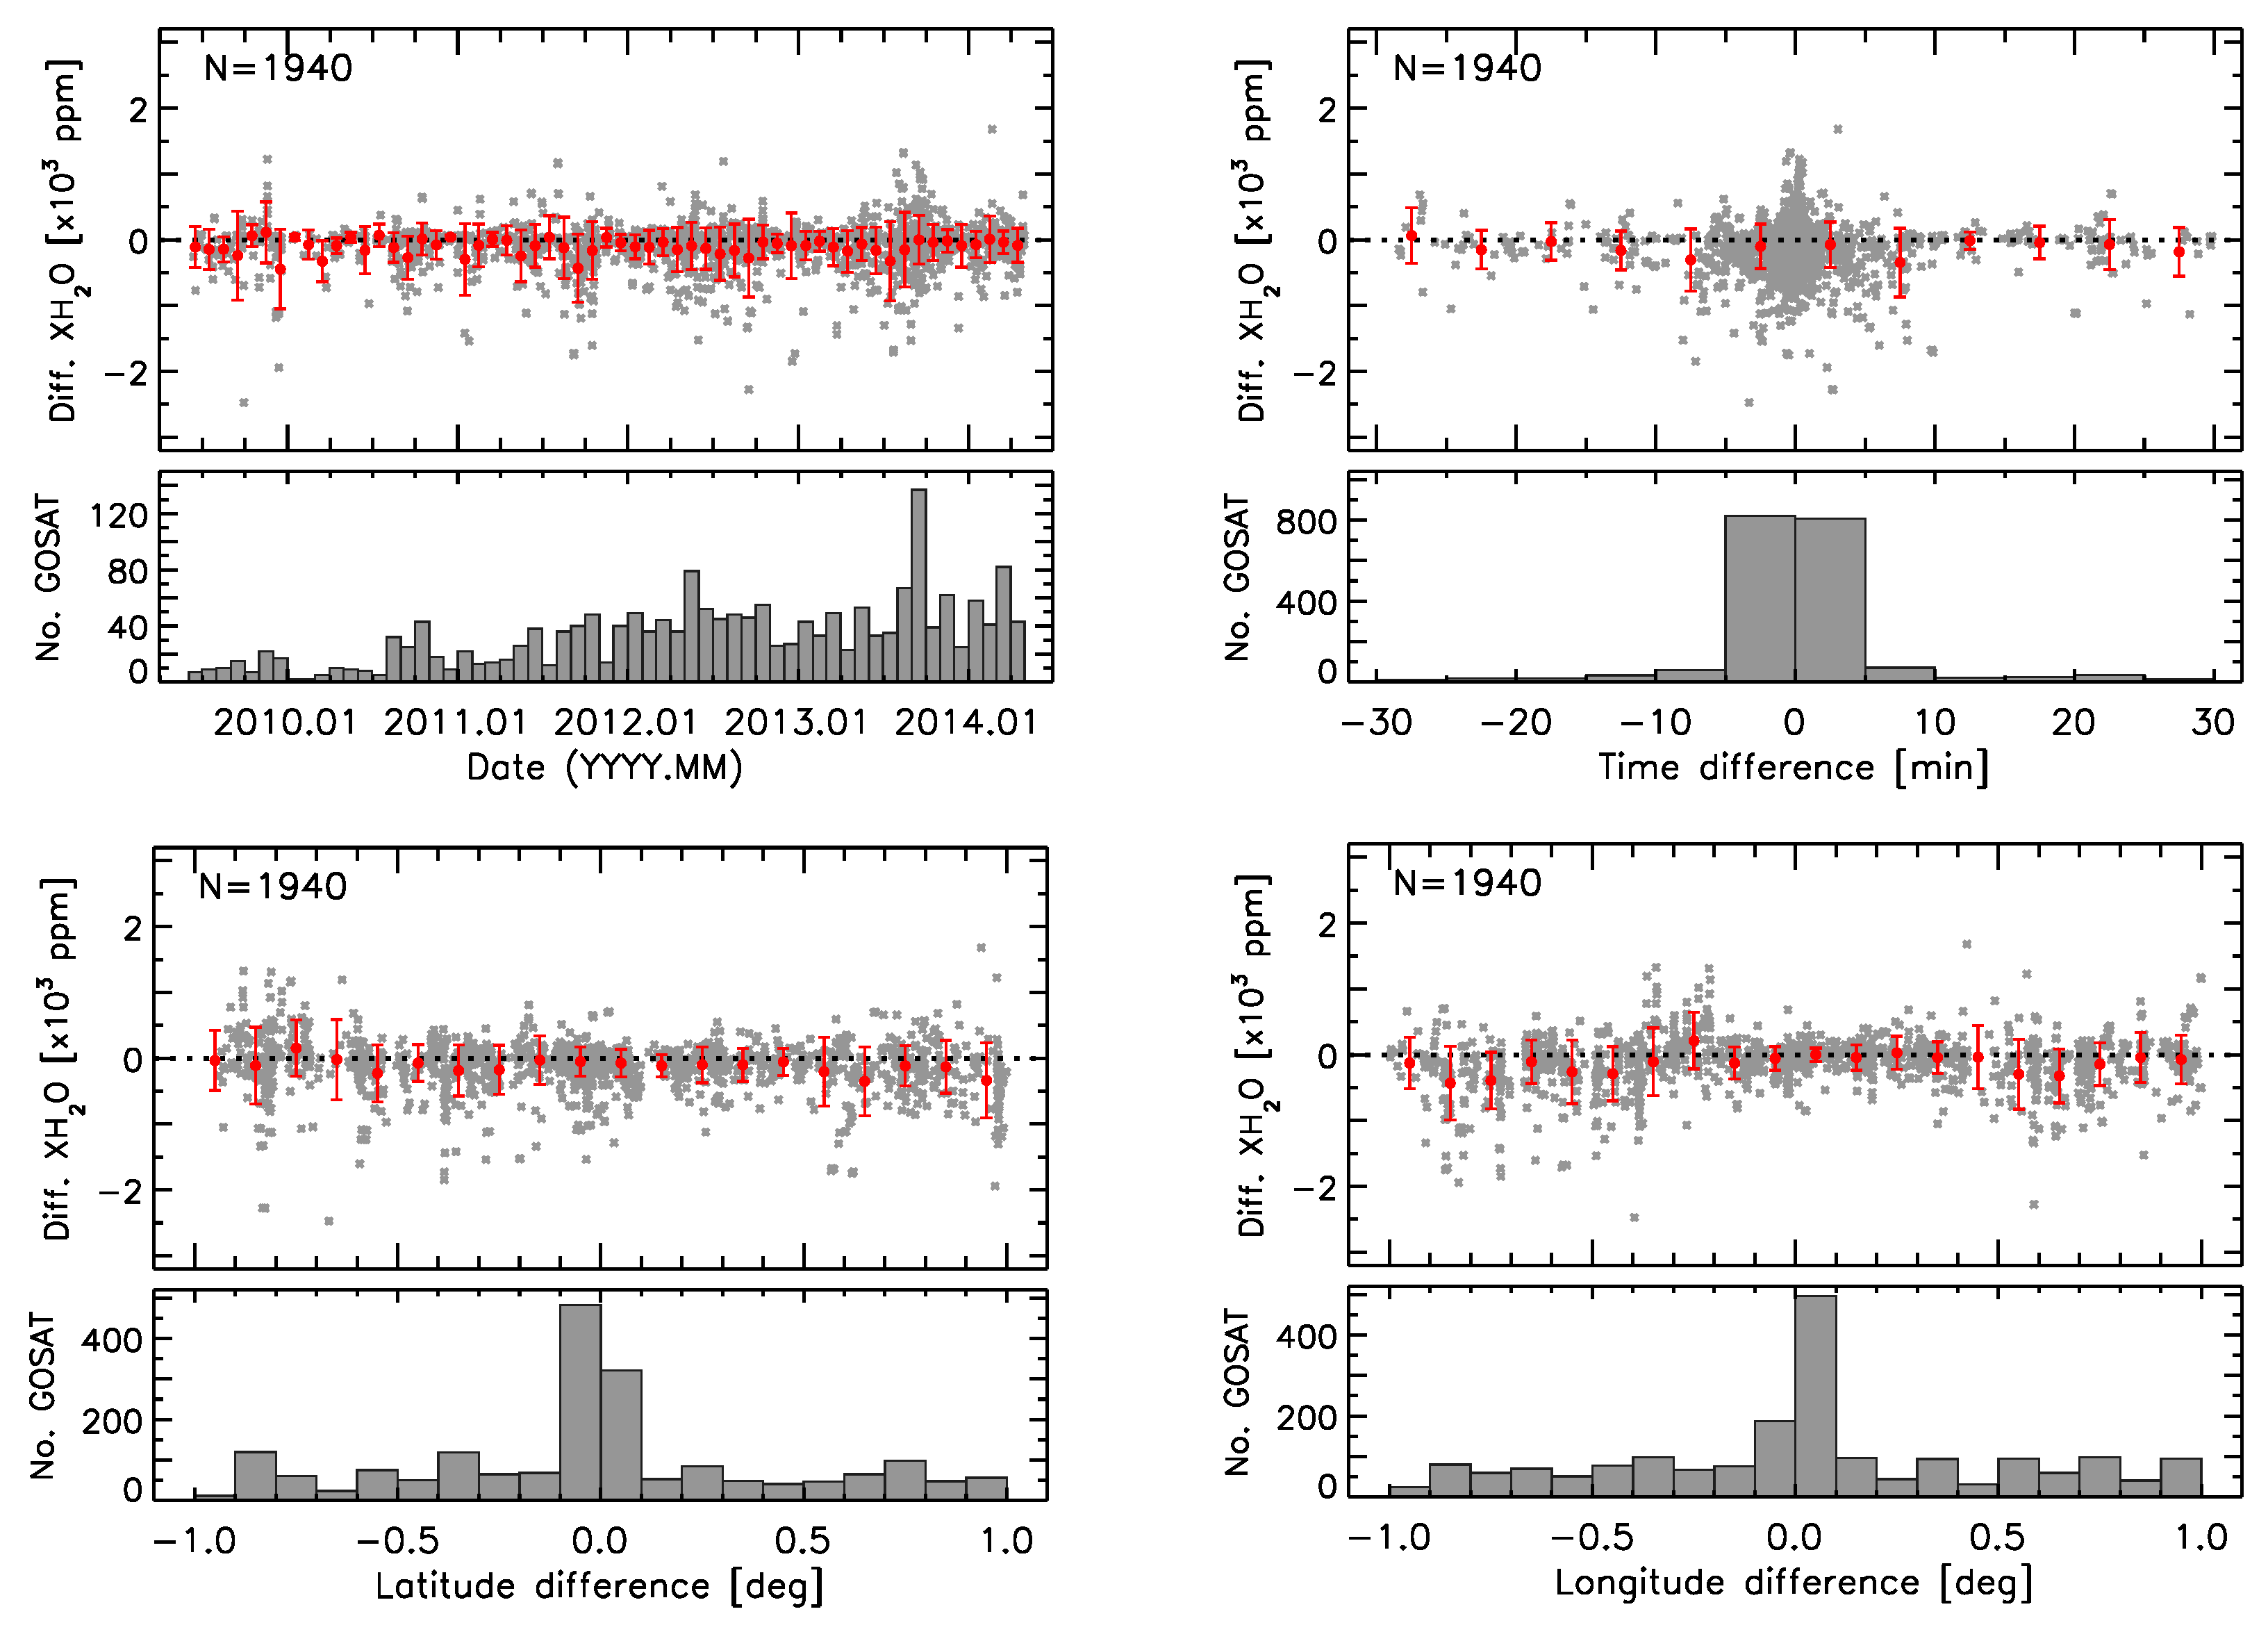
Figure 8.
Correction of Figure 8 in [1]. Evolution of the XHO absolute differences (GOSAT−TCCON) for the nominal coincidence criteria (±1 latitude/longitude and ±30 min) as a function of the measurement date (time series, top left panel) and of the collocation characteristics: time, latitude and longitude differences (top right, bottom left and bottom right panels, respectively). The corresponding histograms of the number of TANSO-FTS scans are plotted below each panel. The grey dots represent the single-scan differences; the red symbols with “error bars” show the average value and associated standard deviation within each histogram bin.
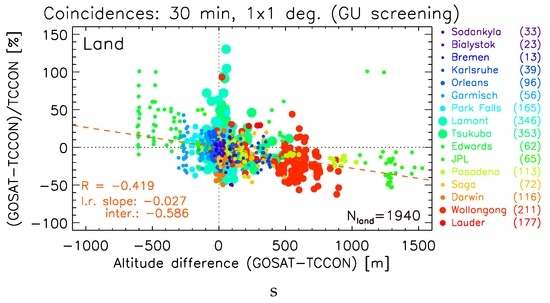
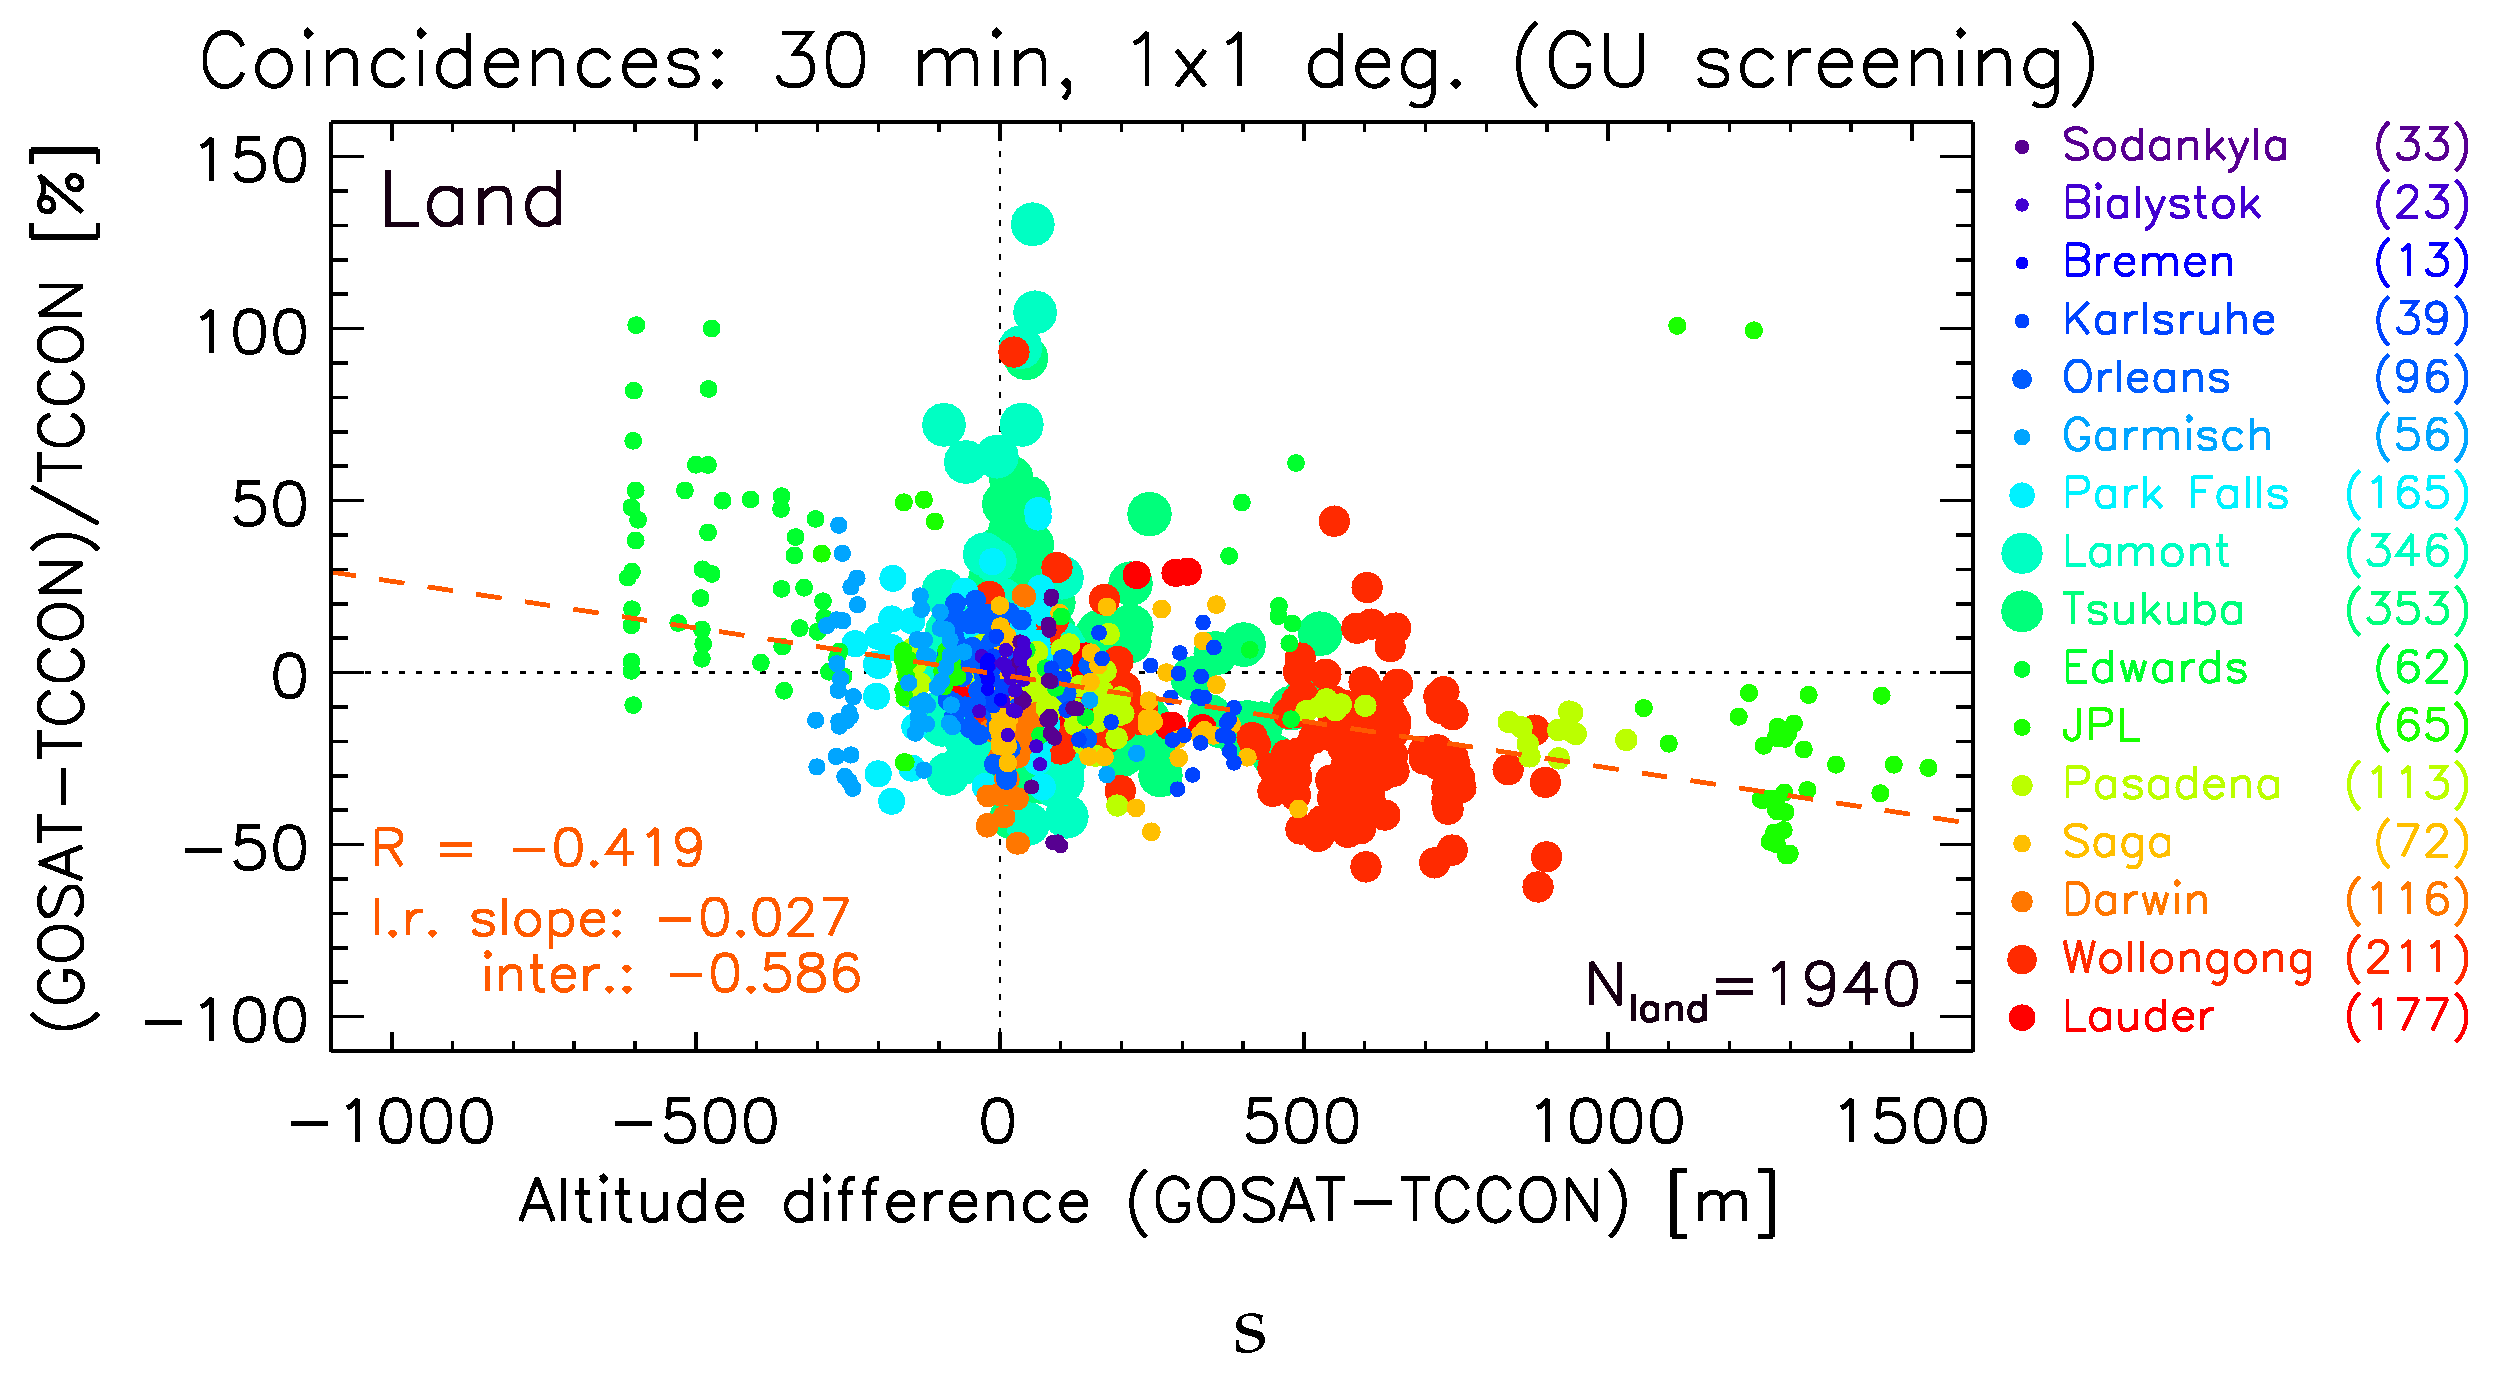
Figure 9.
Correction of Figure 9 in [1]. Relative differences (GOSAT−TCCON)/TCCON as a function of the difference, in meters, between the retrieved altitude of the GOSAT footprints and the altitude of the TCCON sites, for GOSAT land scans only. The caption and color-coding are identical to those of Figure 3.
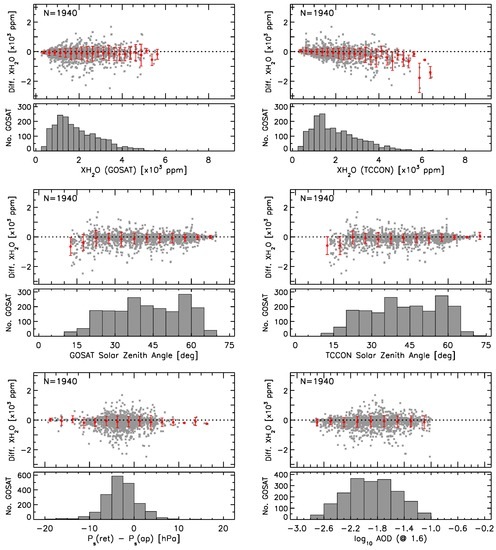
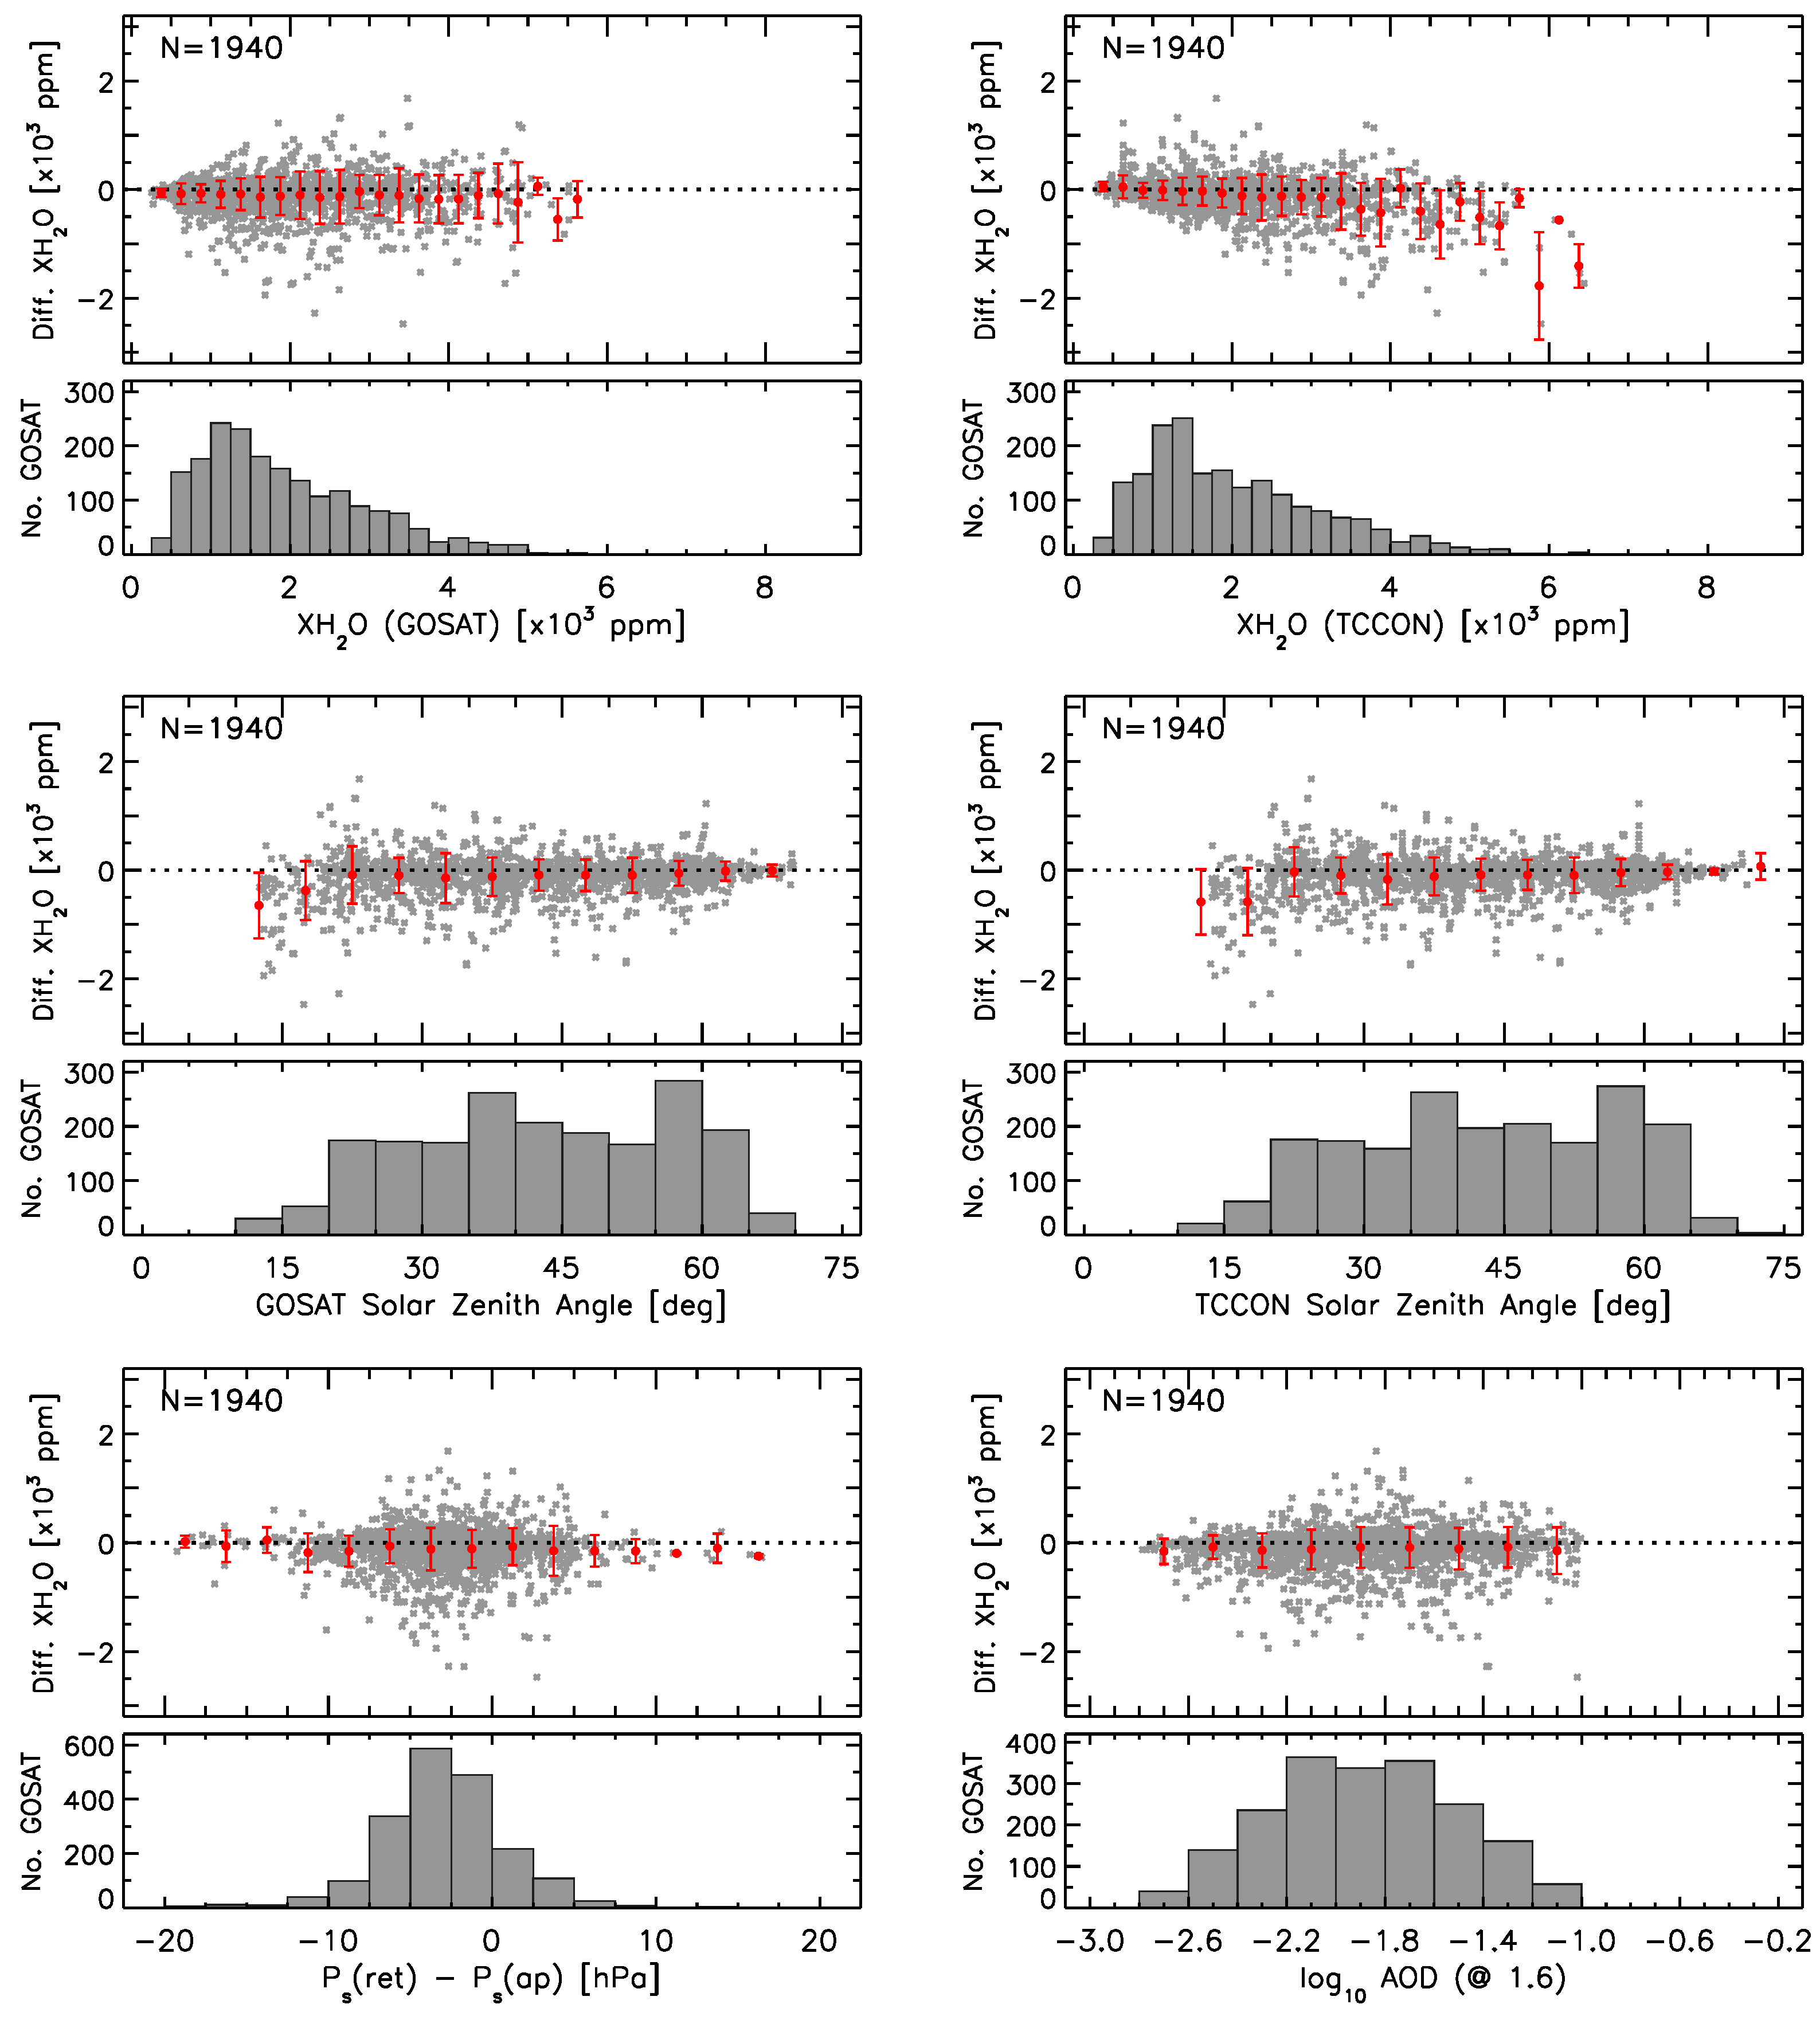
Figure 10.
Correction of Figure 10 in [1]. Evolution of the XHO absolute differences (GOSAT−TCCON) for the nominal coincidence criteria (±1 latitude/longitude and ±30 min), as a function of geophysical and retrieval parameters: the TANSO-FTS and TCCON XHO (top row), the solar zenith angle values for GOSAT and TCCON (middle row), the difference between the retrieved and the a priori values for the surface pressure (bottom left) and the aerosol optical depth at 1.6 m retrieved from the TANSO-FTS spectra (bottom right). The corresponding histograms of the number of TANSO-FTS scans are plotted below each panel. The grey dots represent the single-scan differences; the red symbols with “error bars” show the average value and associated standard deviation within each histogram bin.
We sincerely apologize to the journal and to the readers for any inconvenience this error has caused.
Reference
- Dupuy, E.; Morino, I.; Deutscher, N.M.; Yoshida, Y.; Uchino, O.; Connor, B.J.; De Mazière, M.; Griffith, D.W.T.; Hase, F.; Heikkinen, P.; et al. Comparison of XH2O Retrieved from GOSAT Short-Wavelength Infrared Spectra with Observations from the TCCON Network. Remote Sens. 2016, 8, 414. [Google Scholar] [CrossRef]

© 2016 by the authors; licensee MDPI, Basel, Switzerland. This article is an open access article distributed under the terms and conditions of the Creative Commons Attribution (CC-BY) license (http://creativecommons.org/licenses/by/4.0/).