Article

Remotely Sensed Nightlights to Map Societal Exposure to Hydrometeorological Hazards

by
Agnes Jane Soto Gómez
*,
Giuliano Di Baldassarre
,
Allan Rodhe
and
Veijo A. Pohjola
Department of Earth Sciences, Uppsala University, Villavägen 16, SE-75236 Uppsala, Sweden
*
Author to whom correspondence should be addressed.
Remote Sens. 2015, 7(9), 12380-12399; https://doi.org/10.3390/rs70912380
Submission received: 8 May 2015 / Revised: 3 August 2015 / Accepted: 8 September 2015 / Published: 22 September 2015
(This article belongs to the Special Issue Remote Sensing in Flood Monitoring and Management)

Abstract

:
This study used remotely sensed maps of nightlights to investigate the etiology of increasing disaster losses from hydrometeorological hazards in a data-scarce area. We explored trends in the probability of occurrence of hazardous events (extreme rainfall) and exposure of the local population as components of risk. The temporal variation of the spatial distribution of exposure to hydrometeorological hazards was studied using nightlight satellite imagery as a proxy. Temporal (yearly) and spatial (1 km) resolution make them more useful than official census data. Additionally, satellite nightlights can track informal (unofficial) human settlements. The study focused on the Samala River catchment in Guatemala. The analyses of disasters, using DesInventar Disaster Information Management System data, showed that fatalities caused by hydrometeorological events have increased. Such an increase in disaster losses can be explained by trends in both: (i) catchment conditions that tend to lead to more frequent hydrometeorological extremes (more frequent occurrence of days with wet conditions); and (ii) increasing human exposure to hazardous events (as observed by amount and intensity of nightlights in areas close to rivers). Our study shows the value of remote sensing data and provides a framework to explore the dynamics of disaster risk when ground data are spatially and temporally limited.

Graphical Abstract

1. Introduction

Floods, droughts, earthquakes and volcano eruptions are natural (extreme) events that potentially can lead to disasters if they coincide with vulnerable societies (e.g., [1,2,3]). Natural hazards have significantly affected the development of societies over history. In some instances, disasters triggered by extreme events may have contributed to the collapse of civilizations, e.g., the ancient Maya [2]. While being impacted by natural hazards, societies have also responded to them placing structural and non-structural measures to manage and mitigate risk [3].
Disaster risk is often formalized as a combination of two components: a natural component, which is the probability of natural extreme events (i.e., hazard), and a social component, which is the potential adverse consequences (i.e., vulnerability, which is highly related and analyzed in terms of exposure) [1,4]. The scientific literature (e.g., [5,6]) has analyzed the global trends of disasters and found that the number of disasters in the world has increased, especially in the second half of the twentieth century. Property damage and the number of people affected have also significantly increased. Interestingly, the number of people killed by each event has decreased in the recent years.
The disasters caused by hydrometeorological events have been found to be the most recurrent type of disasters and, globally, have the strongest impact on people. Among them, the damage due to floods and windstorms has increased the most. An increasing number of affected people and damage has been partly attributed to increasing vulnerabilities due to urbanization in marginalized areas and population growth in informal settlements exposed to flooding [7]. Global trends provide important background for disaster studies, but research on local scale is vital to identify the particular dynamics of disasters.
In this context, Guatemala is one of the countries that continuously face disasters caused by both extreme, high-magnitude events and more frequent, low-magnitude events as documented by international databases [8,9]. Guatemala has been ranked among the ten countries most affected by extreme weather events in the world between 1993 and 2012 and presents one of the highest disaster counts during this period [10].
Assessing changes in the social side of disaster risk is typically very complex as the dynamics of the spatial distribution of exposure and vulnerability are often difficult to map. Population dynamics, for instance, is one of the most relevant social indicators to study [7]. However, using traditional data, such as census data, to assess human exposure to natural hazards does not allow tracking the spatial distribution of human populations as the geographical units are too large. Additionally, census data are available only about every 10 years. The spatio-temporal population dynamics are, nowadays, recognized as an important aspect to consider in disaster risk reduction due to the potential contribution to the human exposure to natural hazards and, therefore, to the actual impact of the disasters [7,11]. How and where people live, work, and move create variations that census and administrative geographical units are unable to depict. Recent studies have shown the benefit of finding ways to model the spatio-temporal dynamics of population for disaster risk reduction in European case studies [11,12]. However, many places in the world still require more work to fill the knowledge gaps in this field.
A study of the temporal and spatial variability of human exposure to natural hazards can be performed by using remote sensing data as a proxy of the spatial distribution of the population. Satellite imagery of nightlights, for instance, can enable the assessment of the spatial distribution of the population based on the assumption that the brighter the nightlights, the denser the population is.
Remotely sensed nighttime lights (nightlights, from now on) imagery has been used as a proxy for population and economic dynamics [13,14,15,16]. More recently, Ceola et al. [4] have used this kind of satellite imagery specifically in the field of disaster risk to analyze the relationship between nightlights and exposure to floods, overlapping information on nightlights and the river network at a national level. They found that it is possible to use nightlights to study population dynamics in the field of disaster research. We have adopted this approach to explore its usability on the local scale to determine if the spatial distribution of population in the Samala River catchment in Guatemala shows temporal trends similar to those shown by disasters impacts. The assumption is that similar trends between a consequence (e.g., the impact of disasters) and a potential causal factor (e.g., population dynamics) would indicate that a relationship of causality exists.
The goal of this work is, thus, to explore the etiology of trends in disasters caused by natural events (“natural disasters” from now on) in Guatemala, particularly those caused by hydrometeorological hazards. The etiology was studied through analyses of both components of risk: the natural component in terms of the probability of occurrence of hazardous events (e.g., extreme rainfall) and the social component, here in terms of the potential adverse consequences (exposure and/or vulnerability). We focused especially on the human exposure to hydrometeorological hazards as a main driving factor of vulnerability. For an improved readability, the term “exposure” in this work will refer to “vulnerability in terms of exposure”.
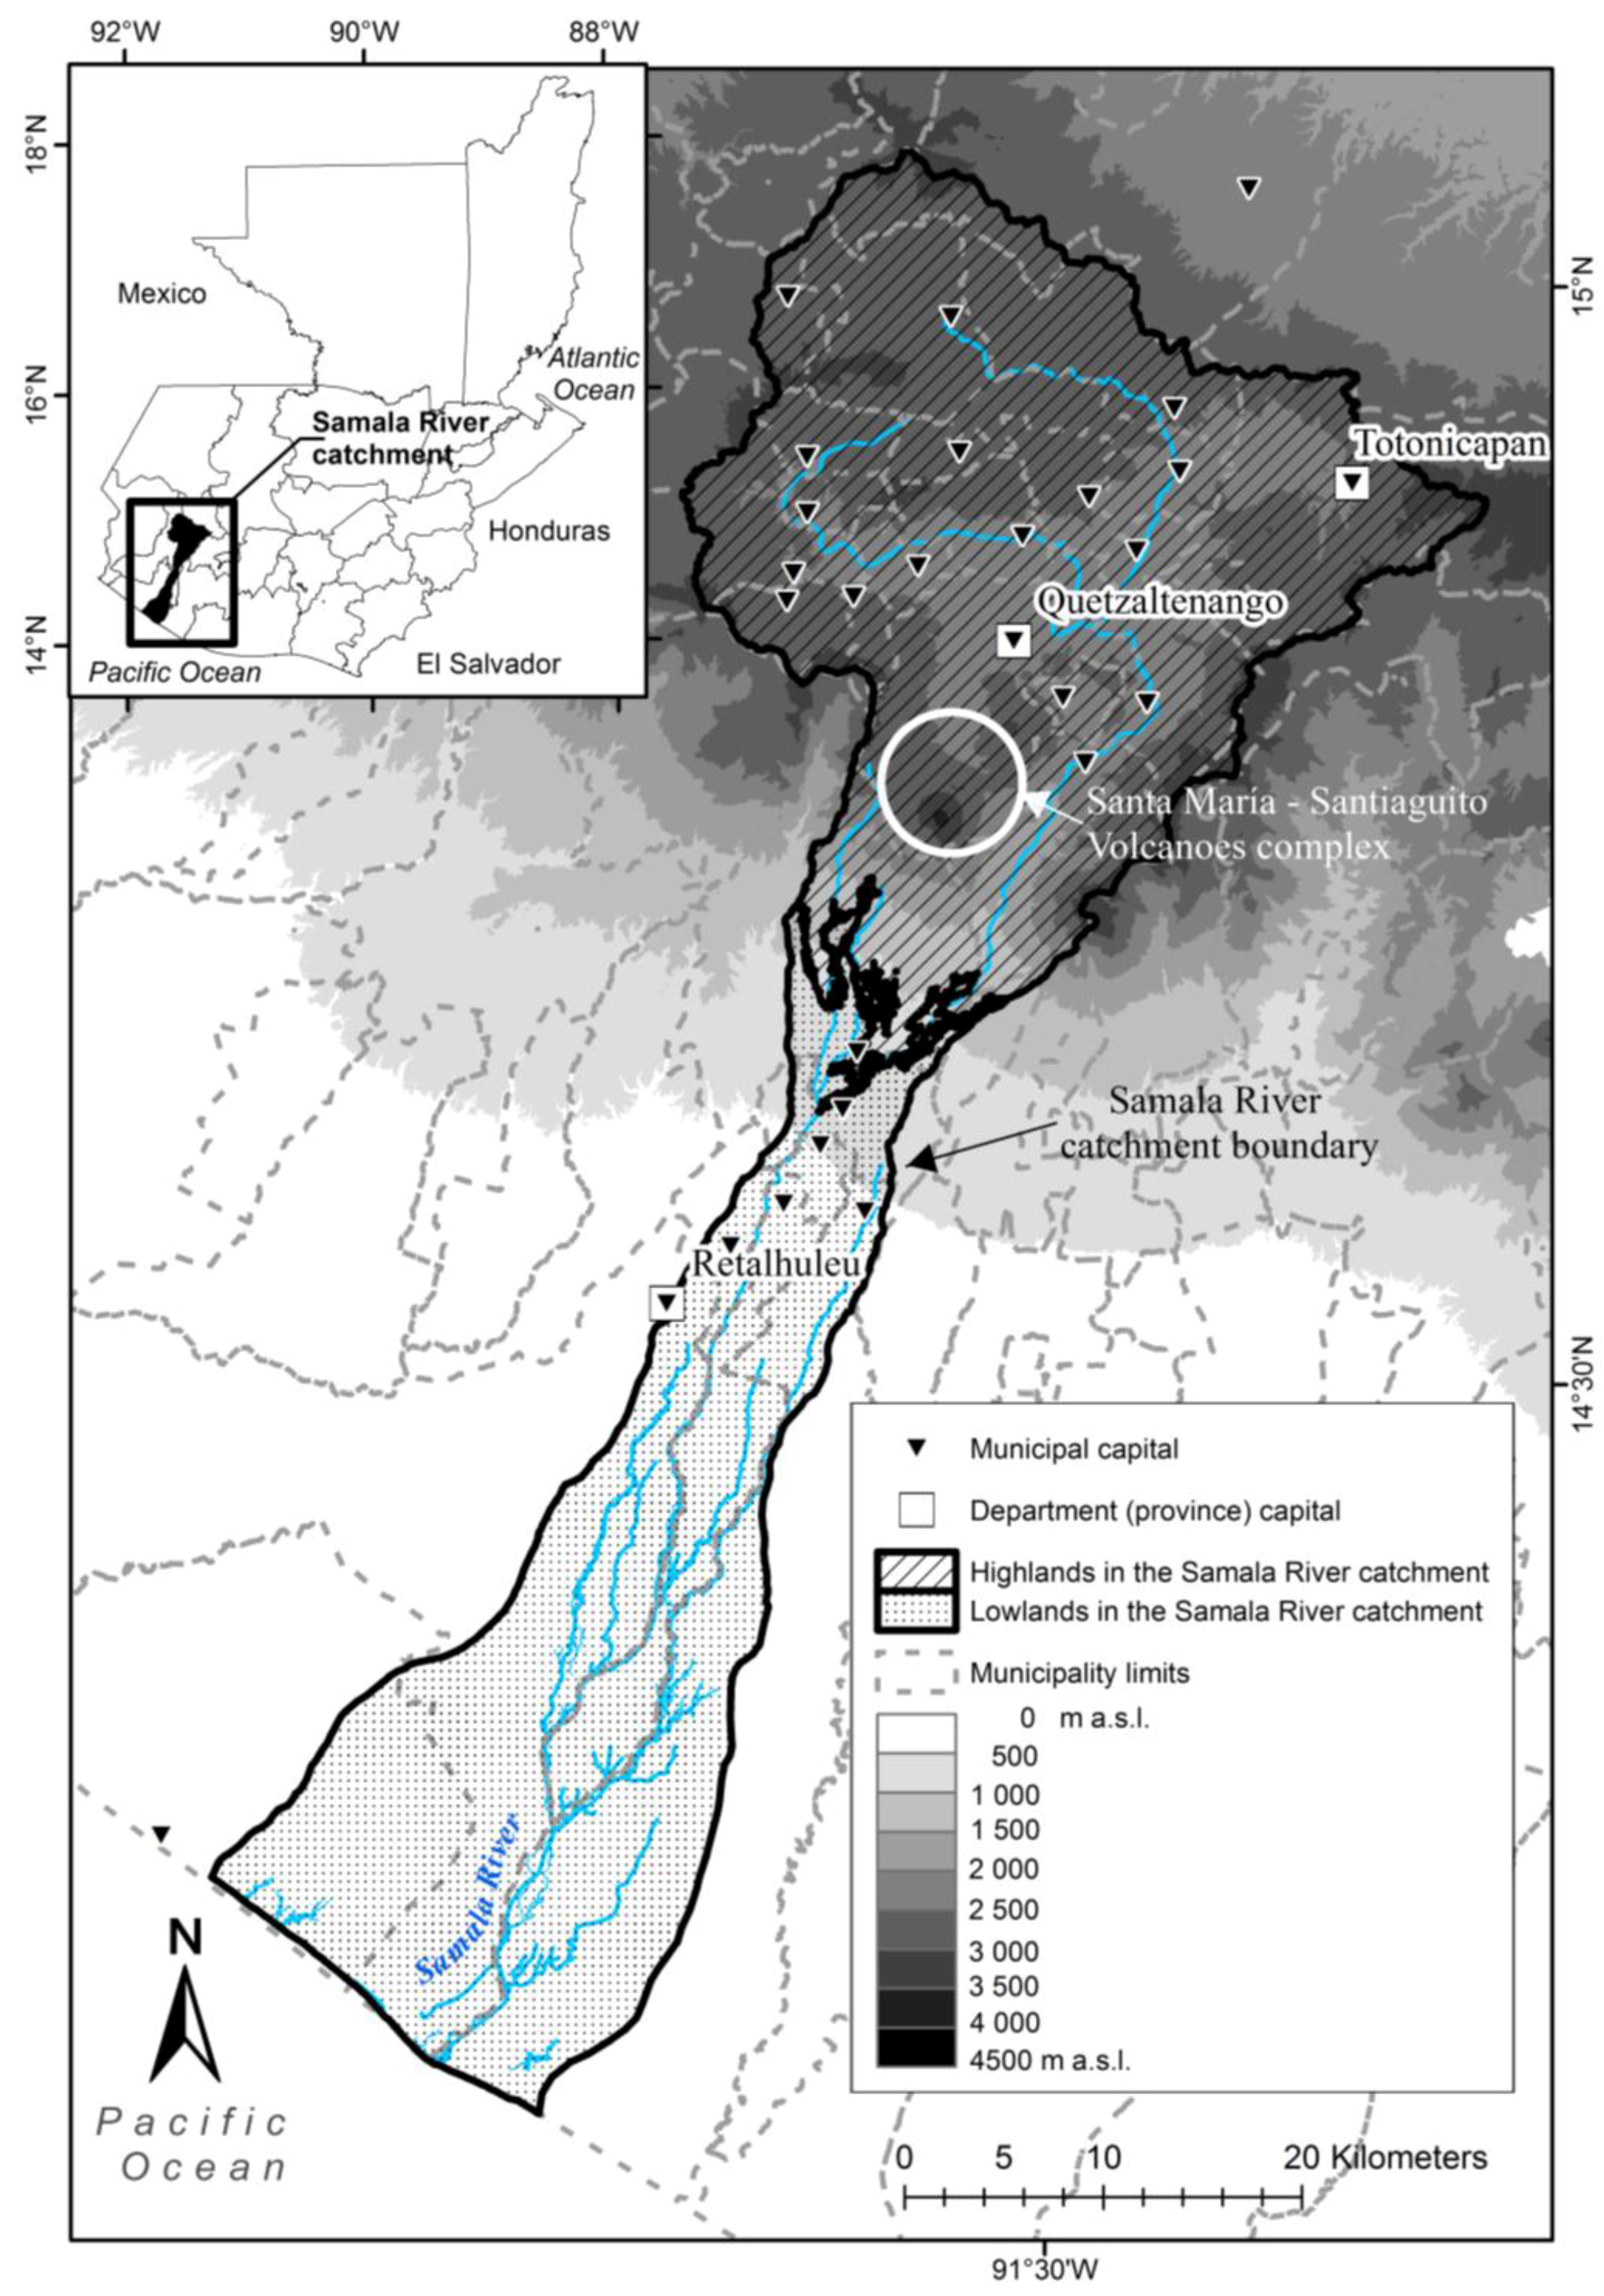
The work presented here focused on the Samala River catchment as an example test site of an area whose location and geography make it vulnerable to multiple hazards [17,18]. This region has a long record of disasters [8] and is consequently an ideal case study for research on natural disasters. Water related disasters are the most frequent type in the Samala River catchment [19] and therefore we focused on the disaster caused by hydrometeorological hazards.
The selected case study provides an example of an area where alternative data, such as nightlight images, can be used as proxies to understand disasters in the local context despite existing data limitations [19]. This is important because there are many areas in the world that, as the Samala River catchment, require comprehensive disaster research but do not have enough available data for such studies [20,21,22]. In such cases, satellite imagery can provide tools to investigate the dynamics of disasters. This enables further progress in terms of disaster knowledge and, more importantly, in disaster risk minimization.

2. Materials and Methods

2.1. Case Study

The catchment of the Samala River (Figure 1) in Guatemala has a surface area of around 1500 km2 in an elongated shape and elevations between sea level and approximately 3770 m a.s.l. The catchment is located in the geographical area where the North American, the Caribbean, and the Cocos plates converge. The tectonic processes in the area gave origin to the Central American isthmus, of which Guatemala is a part, and the volcanic and mountain ranges that run along its geography. The study area comprises highlands of volcanic origin and alluvial lowlands. The Santiaguito volcano lies in the catchment between the highlands and the lowlands and is a dome complex that has been active since its formation in 1922 [23]. The volcanic activity in the catchment is highly dynamic. These dynamics have shown changes after 1988, providing more material to be dragged into the hydrological network [24]. The Samala River originates at around 3000 m a.s.l. and drains southwards to the Pacific Ocean, first through steep slopes and then through a flat plain. The climate of Guatemala is determined by its tropical location but a number of varied local climates are created by the relief and the wide elevation span. The annual mean temperatures in the Samala River catchment range from 15 °C in the highlands to 28 °C at the coast. The mean annual precipitation ranges from 1500 to 4000 mm, with the highest values in the middle part of the catchment [25], with a wet season spanning from May to October.
The Samala River catchment is important in the Guatemalan context. In 2011, approximately 1,100,000 people were estimated to live in the 28 municipalities that lie totally or partially within the catchment [26]. The catchment area includes important cities and towns in the areas known as the Western Highlands and Southern Coast in Guatemala. For instance, the city of Quetzaltenango and its developing suburban area, which functions as a second center for the Guatemalan economy, trade, and the provision of education and health services in the country, lies within the Samala River catchment. The most important roads in the country traverse the catchment serving national and international traffic east-westwards over the country. Agriculture and livestock [27] are the most extensive economic activities in the study area but trade is the main economic activity.
Tectonics, topography, geographical location, and climate may cause multiple hazards affecting the population in the Samala River catchment, including earthquakes, volcanic eruptions, and high precipitation. These combined could also lead to landslides, lahars, floods, and flash flows. The number of people living in this territory and their activities make the Samala River catchment an interesting case study for disasters associated with natural hazards and their potential causes. The importance of such research is evident with the selection of this area as the Guatemalan prioritized catchment by the National Consultative Committee during the Central American Regional Program for Reduction of Vulnerability and Environmental Degradation (PREVDA) 2006–2011. The Samala River catchment was selected because of the risks faced by its population and the importance that the area has at the national level [28]. Over time the people living in this area have suffered from extreme events as well as smaller but more frequent events that have killed and injured people, destroyed crops and infrastructure, and given place to relocation processes [23,24,29,30,31].
This work used data on disasters registered by Disasters Inventory (DesInventar) [9] for the municipalities located totally or partially within the catchment for the period from January 1988 to December 2011, which were quality controlled in a previous study of this catchment [19]. Although uncertainties exist due to the nature of the main data source (local media), this dataset is useful because it comprises the longest available record of disasters in Guatemala on a local scale and often includes information of the outcomes of disasters, even if sometimes it is limited to qualitative information.
Figure 1. Samala River catchment location, topography and administrative divisions. The physical boundary of the catchment (black line) does not coincide with municipal boundaries (grey dotted lines).
Remotesensing 07 12380 g001

2.2. Data and Data Processing

Disasters are conceptualized as the coincidence in time and space of a vulnerable population with one or more natural hazards [1]. We deconstruct this concept of disasters into two parts: a natural component (hazard) and a human component (vulnerability and exposure); disasters exist only if both components exist while risks increase if there are increases in any or both components. Consequently, we analyzed possible trends in hazard and exposure to identify potential causal relationships for increasing disasters in the study area.

2.2.1. Data

Most disasters in the Samala River catchment are related to extreme precipitation events [19] and the majority of them are reported during the rainy season in Guatemala [32]. Thus, extreme rainfall can be considered the main hazard leading to disasters in this area. To analyze the trends in the study area we used the impact of water related disasters as proxy data for disaster risk. We used extreme precipitation as proxy data for the hazards in the study area. Although there are three precipitation stations in the area, we only used precipitation data from the one station with the longest daily records (i.e., Retalhuleu station, since 1978). For the analysis of trends in hazard exposure we used population data of censuses reports [26,33,34,35] and nightlights [36] as proxy data that have the additional advantage of being more spatially accurate. Data on disasters correspond to the DesInventar database [9] for the municipalities of the Samala River catchment from 1988 to 2011 (356 reports). This database was selected over Em-DAT (the International disasters database) and the existing national database because the first only takes into account the major disasters recorded in the area (25 in 100 years) and the second has been recently established and comprises data only from 2008 [19]. Population data correspond to the censuses of 1981, 1994, 2002 and the population projection for 2011 on a municipal scale [26,33,35]. For the analysis of nightlights we used the series of global Nighttime Lights Composites freely available from the US National Oceanic and Atmospheric Administration (NOAA) [36]. The series comprises global images that are composites of the images taken by different satellites (F10 to F18) during a year starting from 1992 and until 2013 (this study used the 1992 to 2011 images). Each image is a raster image with a resolution of 30 arcseconds (approximately 0.9 × 0.9 km). The values of the recorded cells correspond to the brightness on the Earth’s surface. Brightness is a dimensionless numerical integer value ranging from zero to 63 without unit. The river path has been taken, as in Ceola et al. [4], from the global hydrological map by World Wildlife Fund and U.S. Geological Survey Hydrological data and maps based on Shuttle Elevation Derivatives at multiple Scales (HydroSHEDS) [37]. This is a global river network derived from SRTM elevation data that has the same resolution as the nightlights imagery (30 arcseconds).
Since the time spans of the datasets used in this study are different and the purpose of the study was to compare the trends in the data, comprehensive analysis periods were required. Three different analysis periods were then defined based on the census years and the population projection for 2011. The corresponding periods are thus 1981–1994, 1995–2002, and 2003–2011. Although the number of years comprised in each period is different, the use of census years meant that actual data could be used for population dynamics analysis. The differences between the time spans of the three periods were resolved by computing yearly quantities for each type of data and period to make them comparable over time.

2.2.2. Trend Analysis on Disasters

We assessed the disaster trends in terms of number of fatalities because this is the indicator that has been most consistently quantitatively recorded in the DesInventar database. We calculated the impact of disasters (DI) over time by aggregating the results in three sub-periods that took census years as temporal limits to facilitate further comparisons. The sub-periods in which the disasters data were aggregated were 1988–1994, 1995–2002 and 2003–2011. The DI was calculated by dividing the number of fatalities by municipality by the average population of the municipality during each intercensus period. We calculated the relative impact of disasters (DIRel) by dividing the DI of each municipality by the number of years comprised in the intercensus periods. The DIRel made the impact of disasters comparable among different municipalities and intercensus periods. The same analysis was made aggregating the data separately for the municipalities in the highlands and those in the lowlands.

2.2.3. Trend Analysis on Hazards

We explored the trends on hazards through three extreme precipitation maxima: (a) the yearly maxima of daily precipitation, (b) the yearly maxima of accumulated wetness, and (c) the yearly number of days when the accumulated wetness surpassed a previously identified threshold of increased likelihood of triggering disasters [32].
The time series of maximum daily precipitation per year from 1978 to 2011 was extracted from the daily rainfall data for every calendar year. The daily values of accumulated wetness for the same period were calculated. Wetness is an empirical index that represents the effect that the local rainfall pattern of continuous daily rains would have in the soil [32]. The Wetness index (Iwet) is an aggregation of the weighted daily rainfall values in a 10-day period. We calculated Iwet for the 1978–2011 period according to Soto et al. [32] by adding the weighted rainfall of the preceding nine days (95% the day before and 10% less each previous day) to the rainfall of the day. The number of days when the Iwet was equal or higher than 300 mm was calculated for each year. This value corresponds to a threshold identified by Soto et al. [32] at which the number of disasters increases noticeably in the study area. The values were based on precipitation data of the Retalhuleu station specifically and therefore apply exclusively to our case study.
The three series of precipitation maxima were graphed. Linear regressions and 5-year running average were calculated using embedded functions in Golden Software Grapher to identify trends in each of the maxima observed.

2.2.4. Trend Analysis on Exposure

Nightlights imagery was used as proxy data for population dynamics in spatial terms (i.e., population distribution, population growth, and population densification) to analyze the trends in the exposure to hydrometeorological hazards. NOAA recommends applying an intercalibration process to the imagery in order to use the images for comparisons over time. The widely used intercalibration method for nightlights [4,13] proposed by Elvidge et al. [14] was applied in this case study. The coefficients calculated in 2009 by Elvidge et al. were used to intercalibrate the brightness values of the Samala River catchment and the sum of lights (SOL) were calculated; however, the SOL values in years when two satellites were available did not converge as would be expected in a successful intercalibration process [14]. The method proposed by Elvidge was then applied for a rectangular section of the yearly images that enclosed Guatemala. As Elvidge [14,38] proposed, the year with the most complete range of brightness values was taken as reference (satellite F14 for 2002) and linear regressions were made for the values of each image and those of the reference image. The coefficients resulting from each equation were applied to the cell values to calibrate them into new intercalibrated values. The resulting new values provide fine-tuned images over time. For the years when two different composites were available, the intercalibrated values of each image were averaged pixel by pixel in order to take into account all the existing images of the area as previously proposed by Ceola et al. [4]. The intercalibrated images showed a better convergence in the years when two satellites were available and therefore were used for the analysis. A section corresponding to the Samala River catchment was taken from the intercalibrated images; selected images from the series are shown in Figure 2 (the rest are not included in the figure for better readability). For this analysis, the images that correspond to census years and the last year of the disasters dataset (1994, 2002, and 2011) were selected among the available images to evaluate the changes of cell values over time and obtain any noticeable trends in nightlights. The purpose of selecting those three years is to make the results of the nightlights trend analysis comparable with the population analysis performed in this study. The methodological approach of Ceola et al. [4] was applied to select a subset of data that corresponds to the cells that lie on the path of the Samala River. This subset of data corresponds to the close proximity of the river, which is assumed to be directly exposed to floods and lahars, the main types of disasters in the study area [19].
Figure 2. Temporal evolution of nighttime lights in the Samala River catchment. Images show the intercalibrated values of nightlights in different years to expose how the brightness has increased over the years. Images for 1994, 1998, 2002, and 2004 show the averaged intercalibrated values of the two available satellites (the boundary of the catchment corresponds to Figure 1). Original image and data processing by NOAA’s National Geophysical Data Center. DMSP data collected by US Air Force Weather Agency. Intercalibrated images: the authors.
Remotesensing 07 12380 g002
The trends in nightlights were studied in the selected subset of cells (close proximities of the river) as well as in the cells of the catchment that do not correspond with the river path (non-river area). The nightlights analysis was made first in terms of the distribution of cells per brightness values. Cell values were aggregated in histograms and classified in empirical ranges of no brightness (0), low brightness (1–30), medium-high brightness (31–55), and high brightness (56–63). The distribution of nightlight values was compared to identify any potential temporal trends. Secondly, we studied the changes of lit areas over time in terms of area. For this study we calculated the ratio of lit cells (cells that present a positive brightness value) divided by total number of cells. Finally, we studied the trend of the general brightness. We calculated the characteristic average brightness (CBavg) for the Samala River catchment in the selected years. The CBavg was calculated by adding the brightness values of all the cells and dividing the sum by the total number of cells [4]. The changes of CBavg over time were analyzed to determine if any noticeable trend could be identified. After the results of the analyses of the close proximities of the river and of the entire catchment were obtained, a second round of analyses was carried out separately for the highlands and the lowlands to observe differences between the two main parts of the Samala River catchment.

3. Results and Discussion

3.1. Disasters in the Samala River Catchment

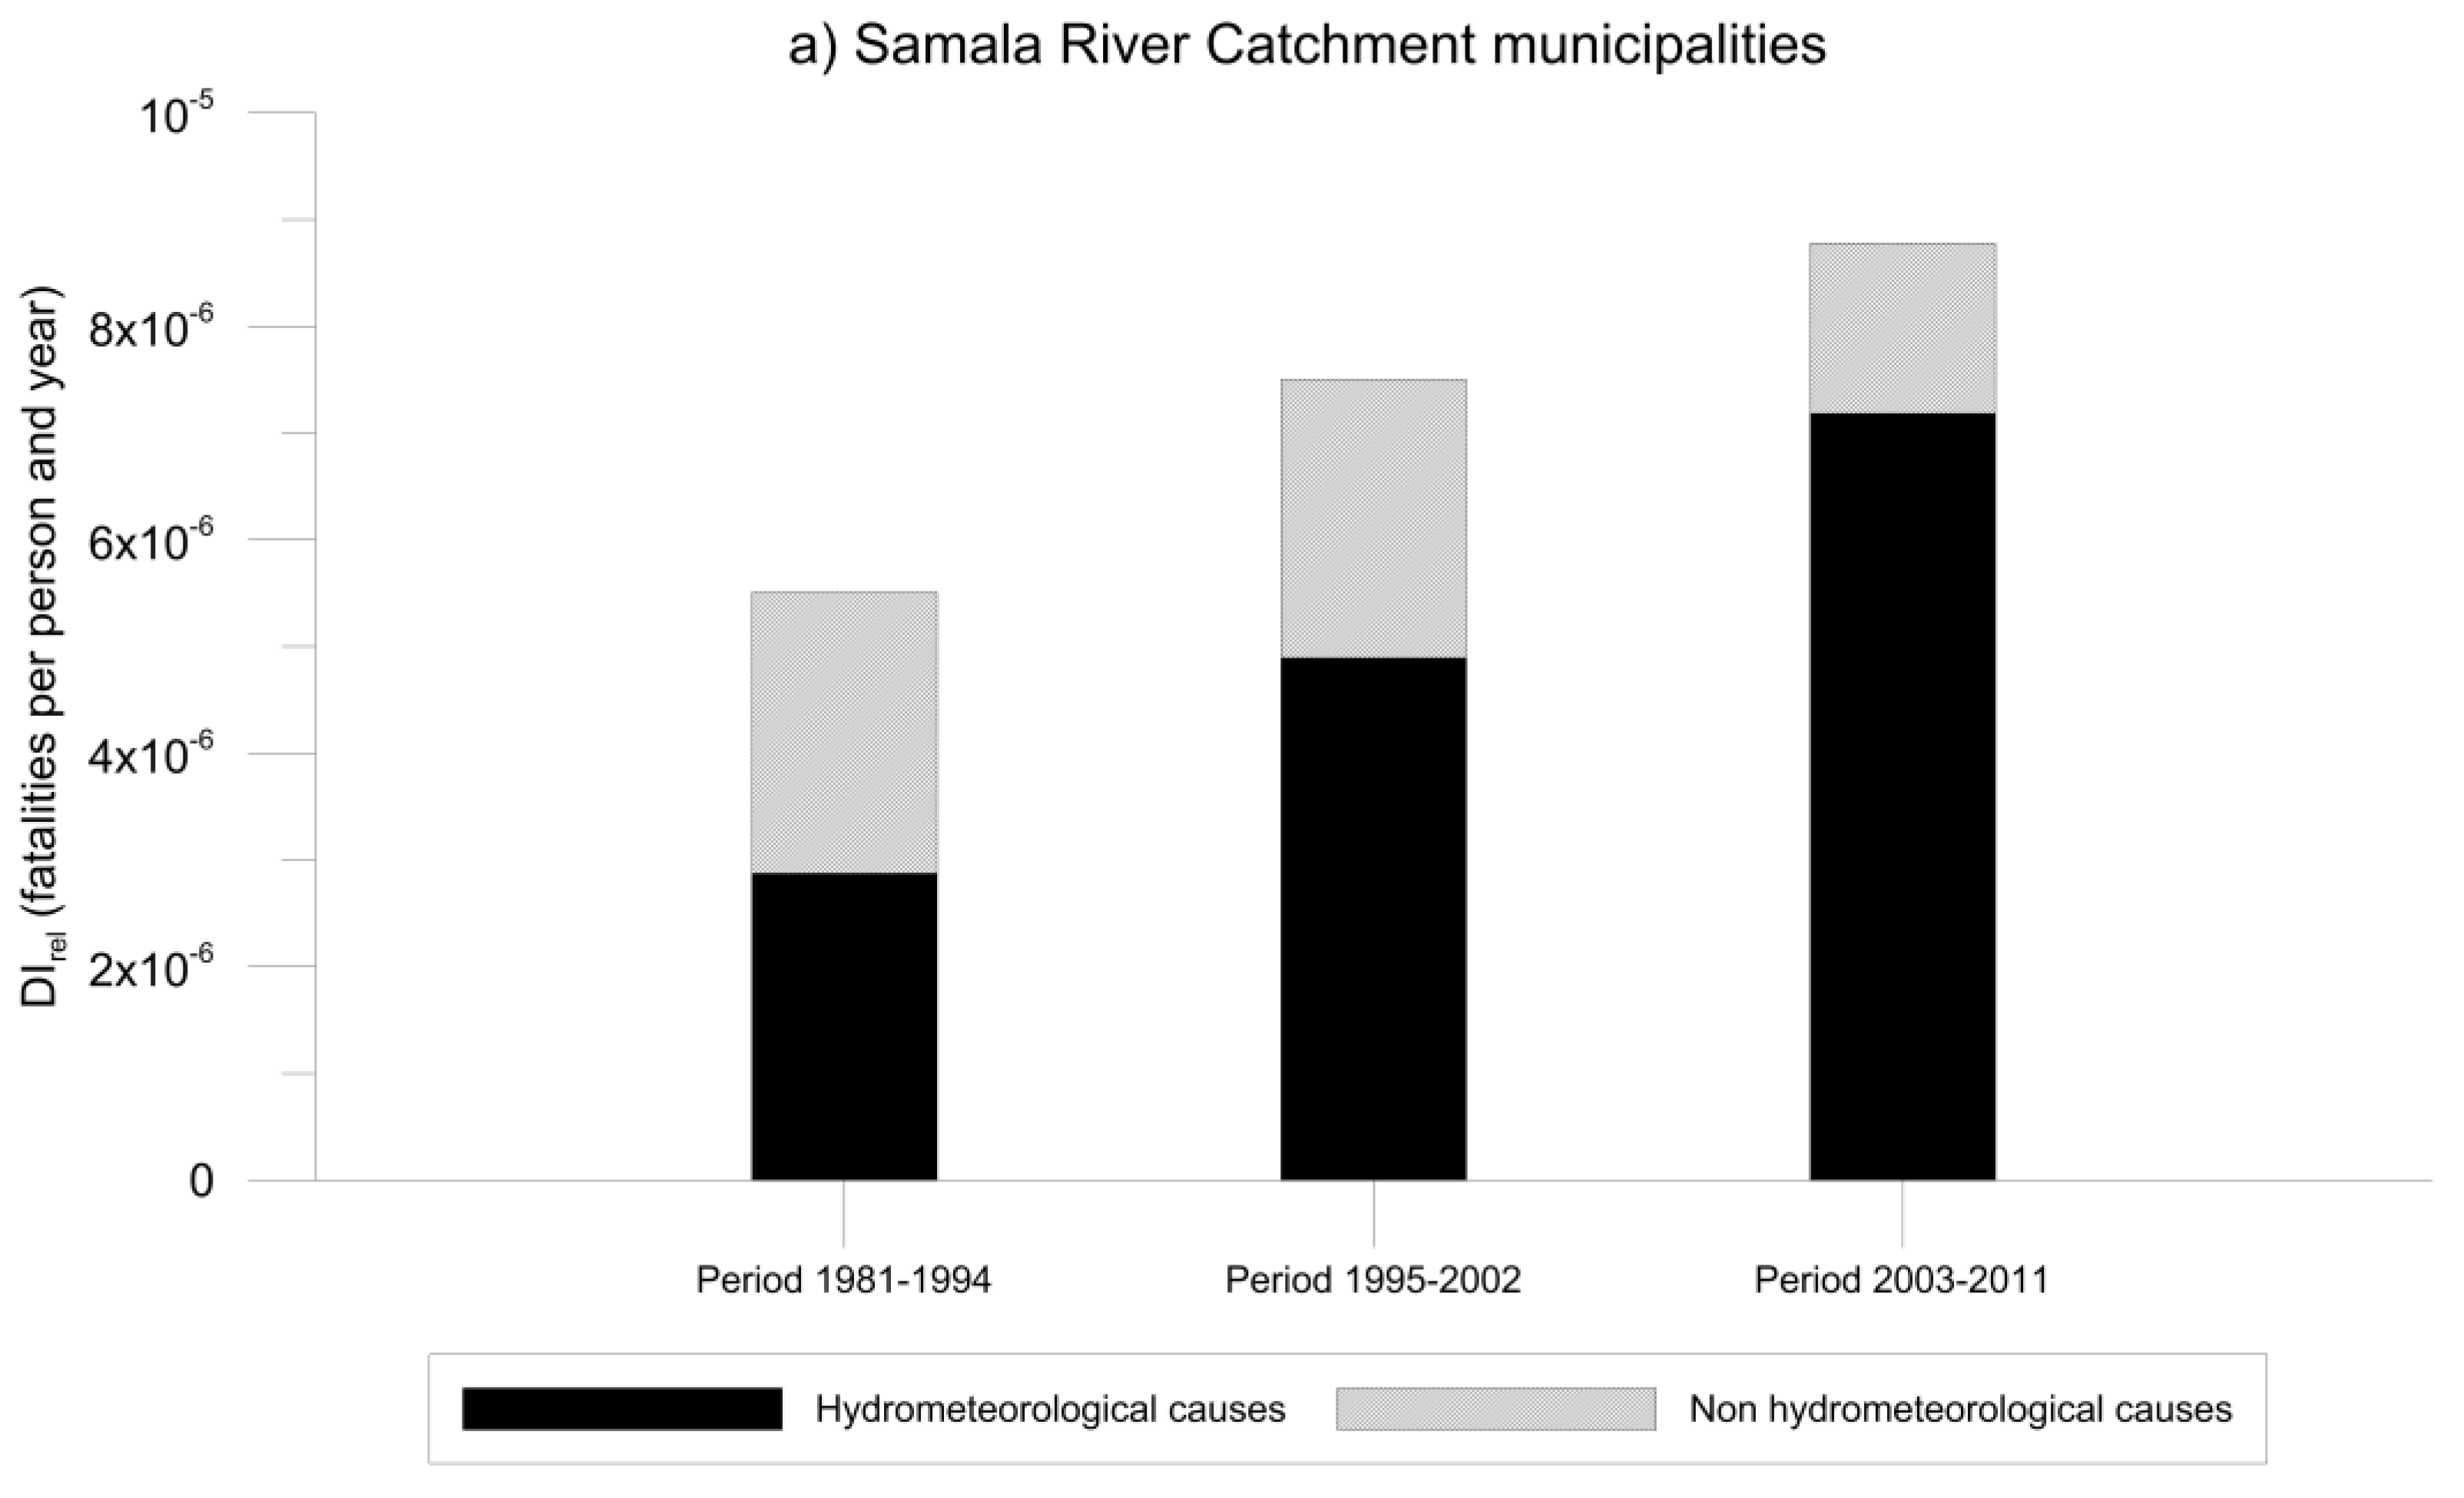
Our analysis indicates that the relative impact of disasters (DIRel) in the Samala River catchment has increased consistently over time. This increase is mainly because the DIRel of the disasters caused by hydrometeorological causes has triplicated in the 30-years period of our analysis (
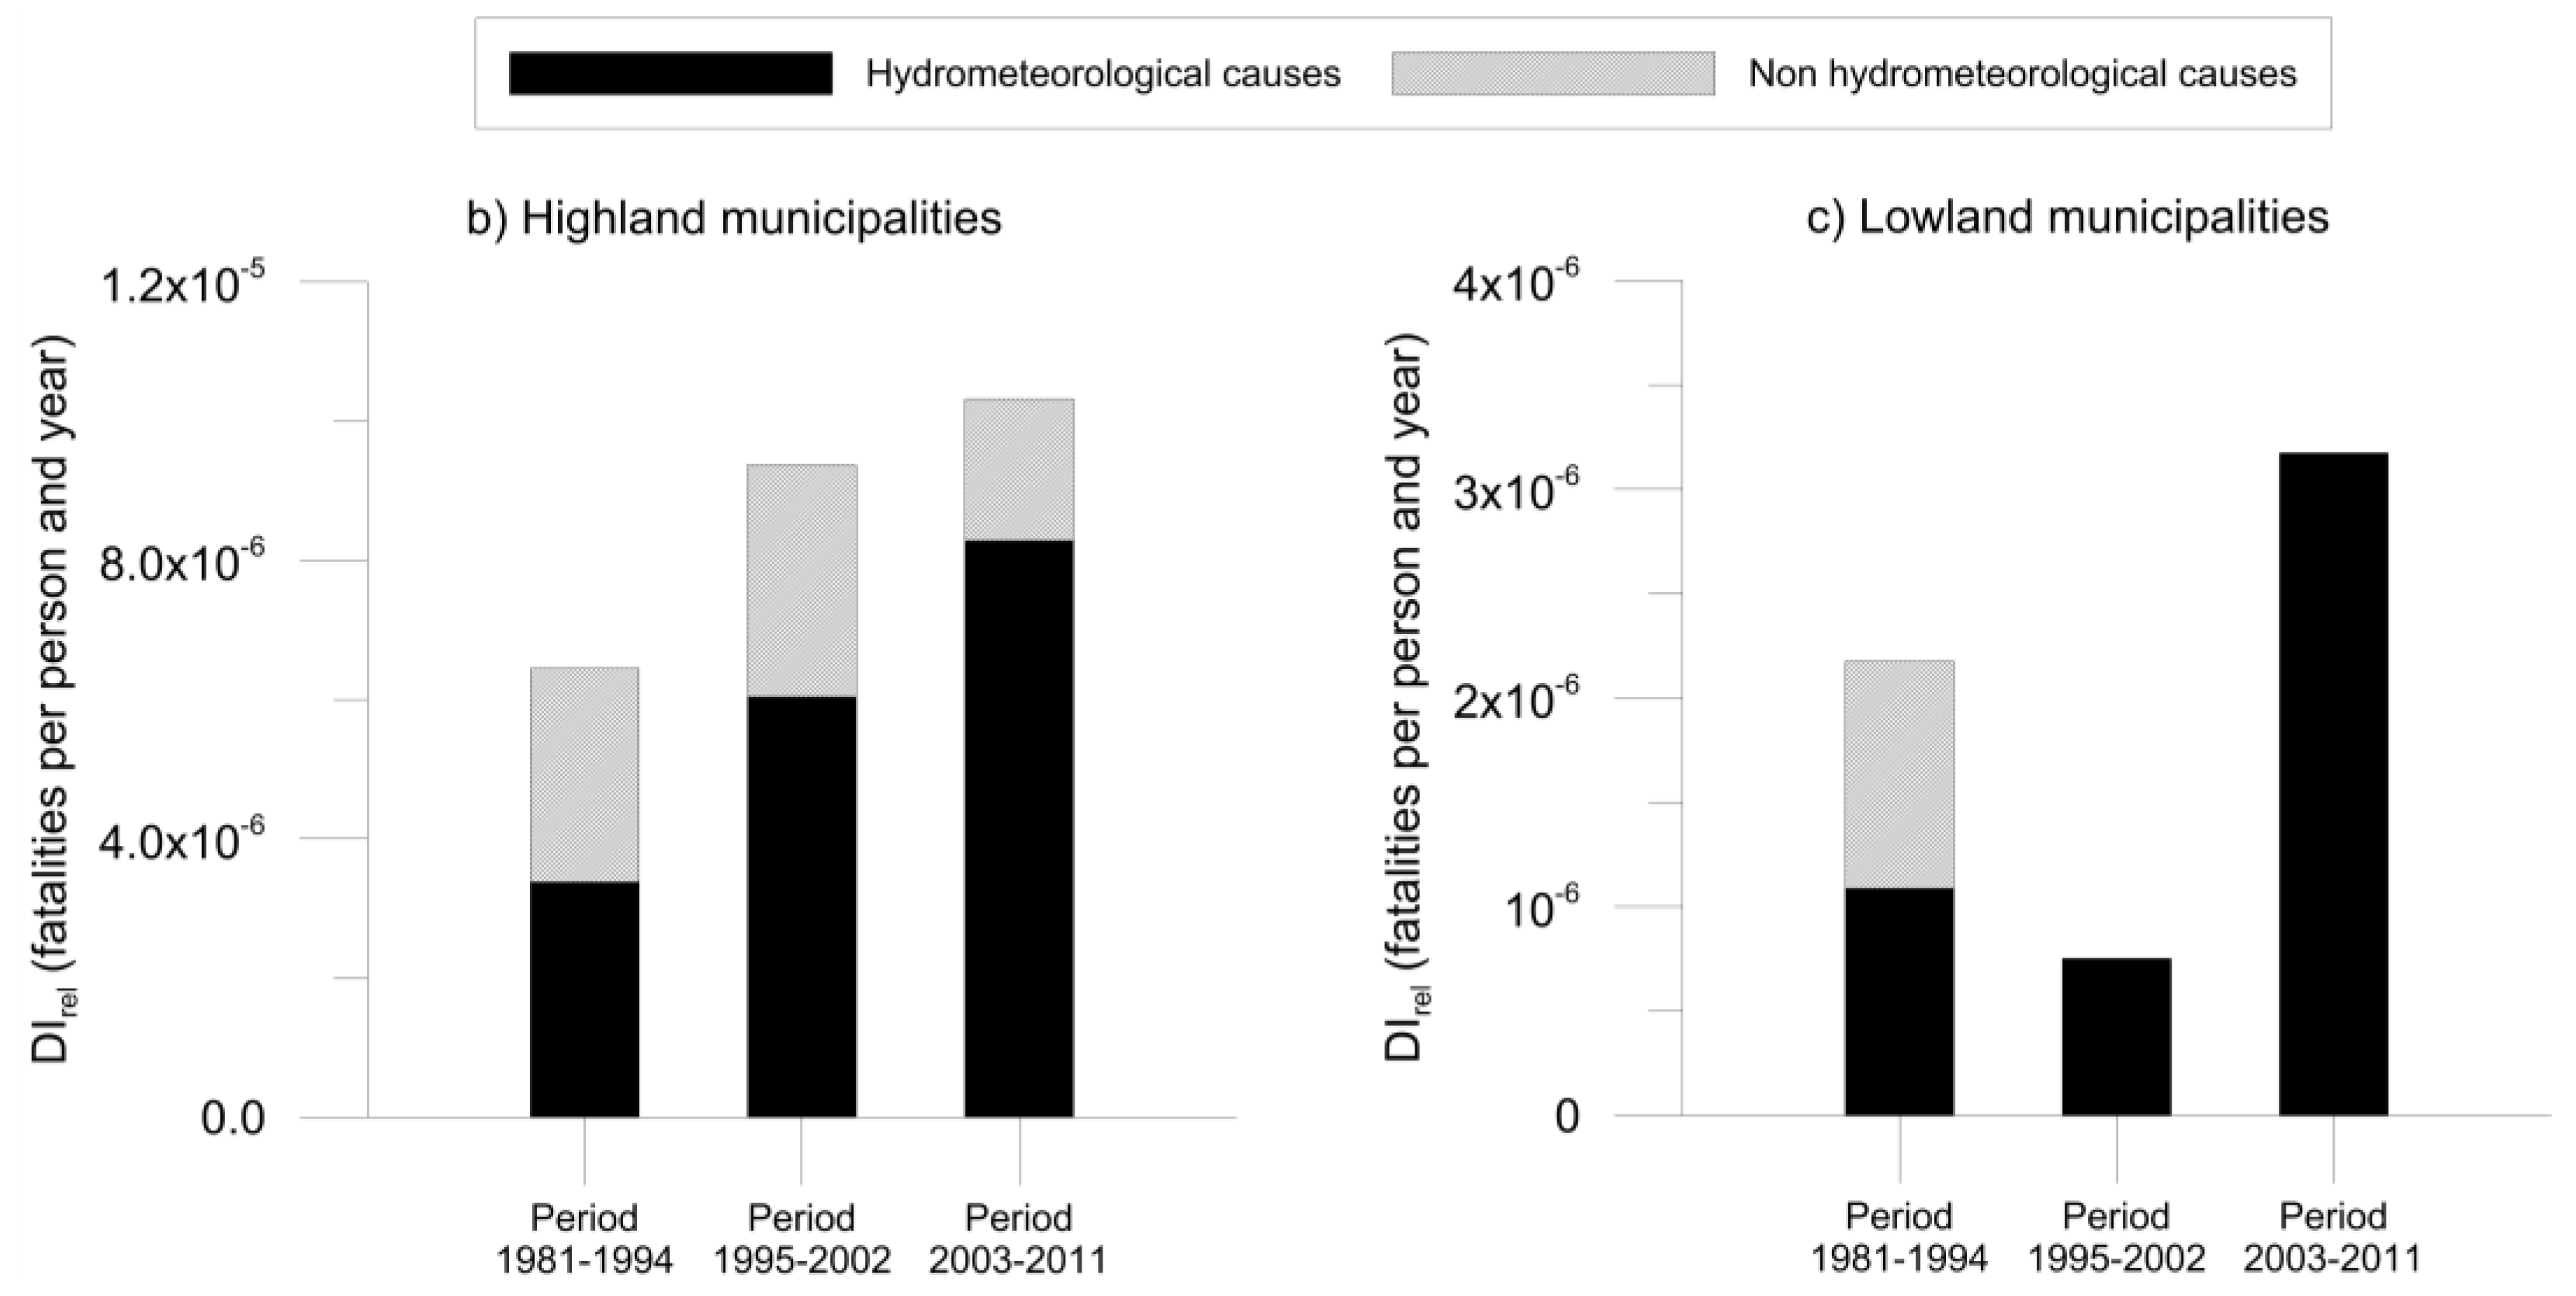
Figure 3a). The highland-lowlands differentiated analysis of DIRel showed that the increase in the entire catchment corresponds quite well with the increase of DIRel in the highlands (Figure 3b). The DIRel in the lowlands (Figure 3c) showed a different behavior than the ones in the highlands and the entire catchment even if the total increase was similar.
Figure 3. Relative impact of disasters over time. The relative impact of disasters (DIRel) is measured by the number of fatalities caused by all the disasters (classified by hydrometeorological and non hydrometeorological causes) during each period, divided by the number of years in the period and the yearly average population in that period (a) in the Samala River catchment, (b) in the highlands and (c) in the lowlands of the catchment. The fatalities resulting from non hydrometeorological causes for disasters correspond to earthquakes and have been included in the graph to show the importance of the hydrometeorological causes in the occurrences of disasters in the case study.
Remotesensing 07 12380 g003aRemotesensing 07 12380 g003b

3.2. Extreme Rainfall, Key Hazard in the Samala River Catchment

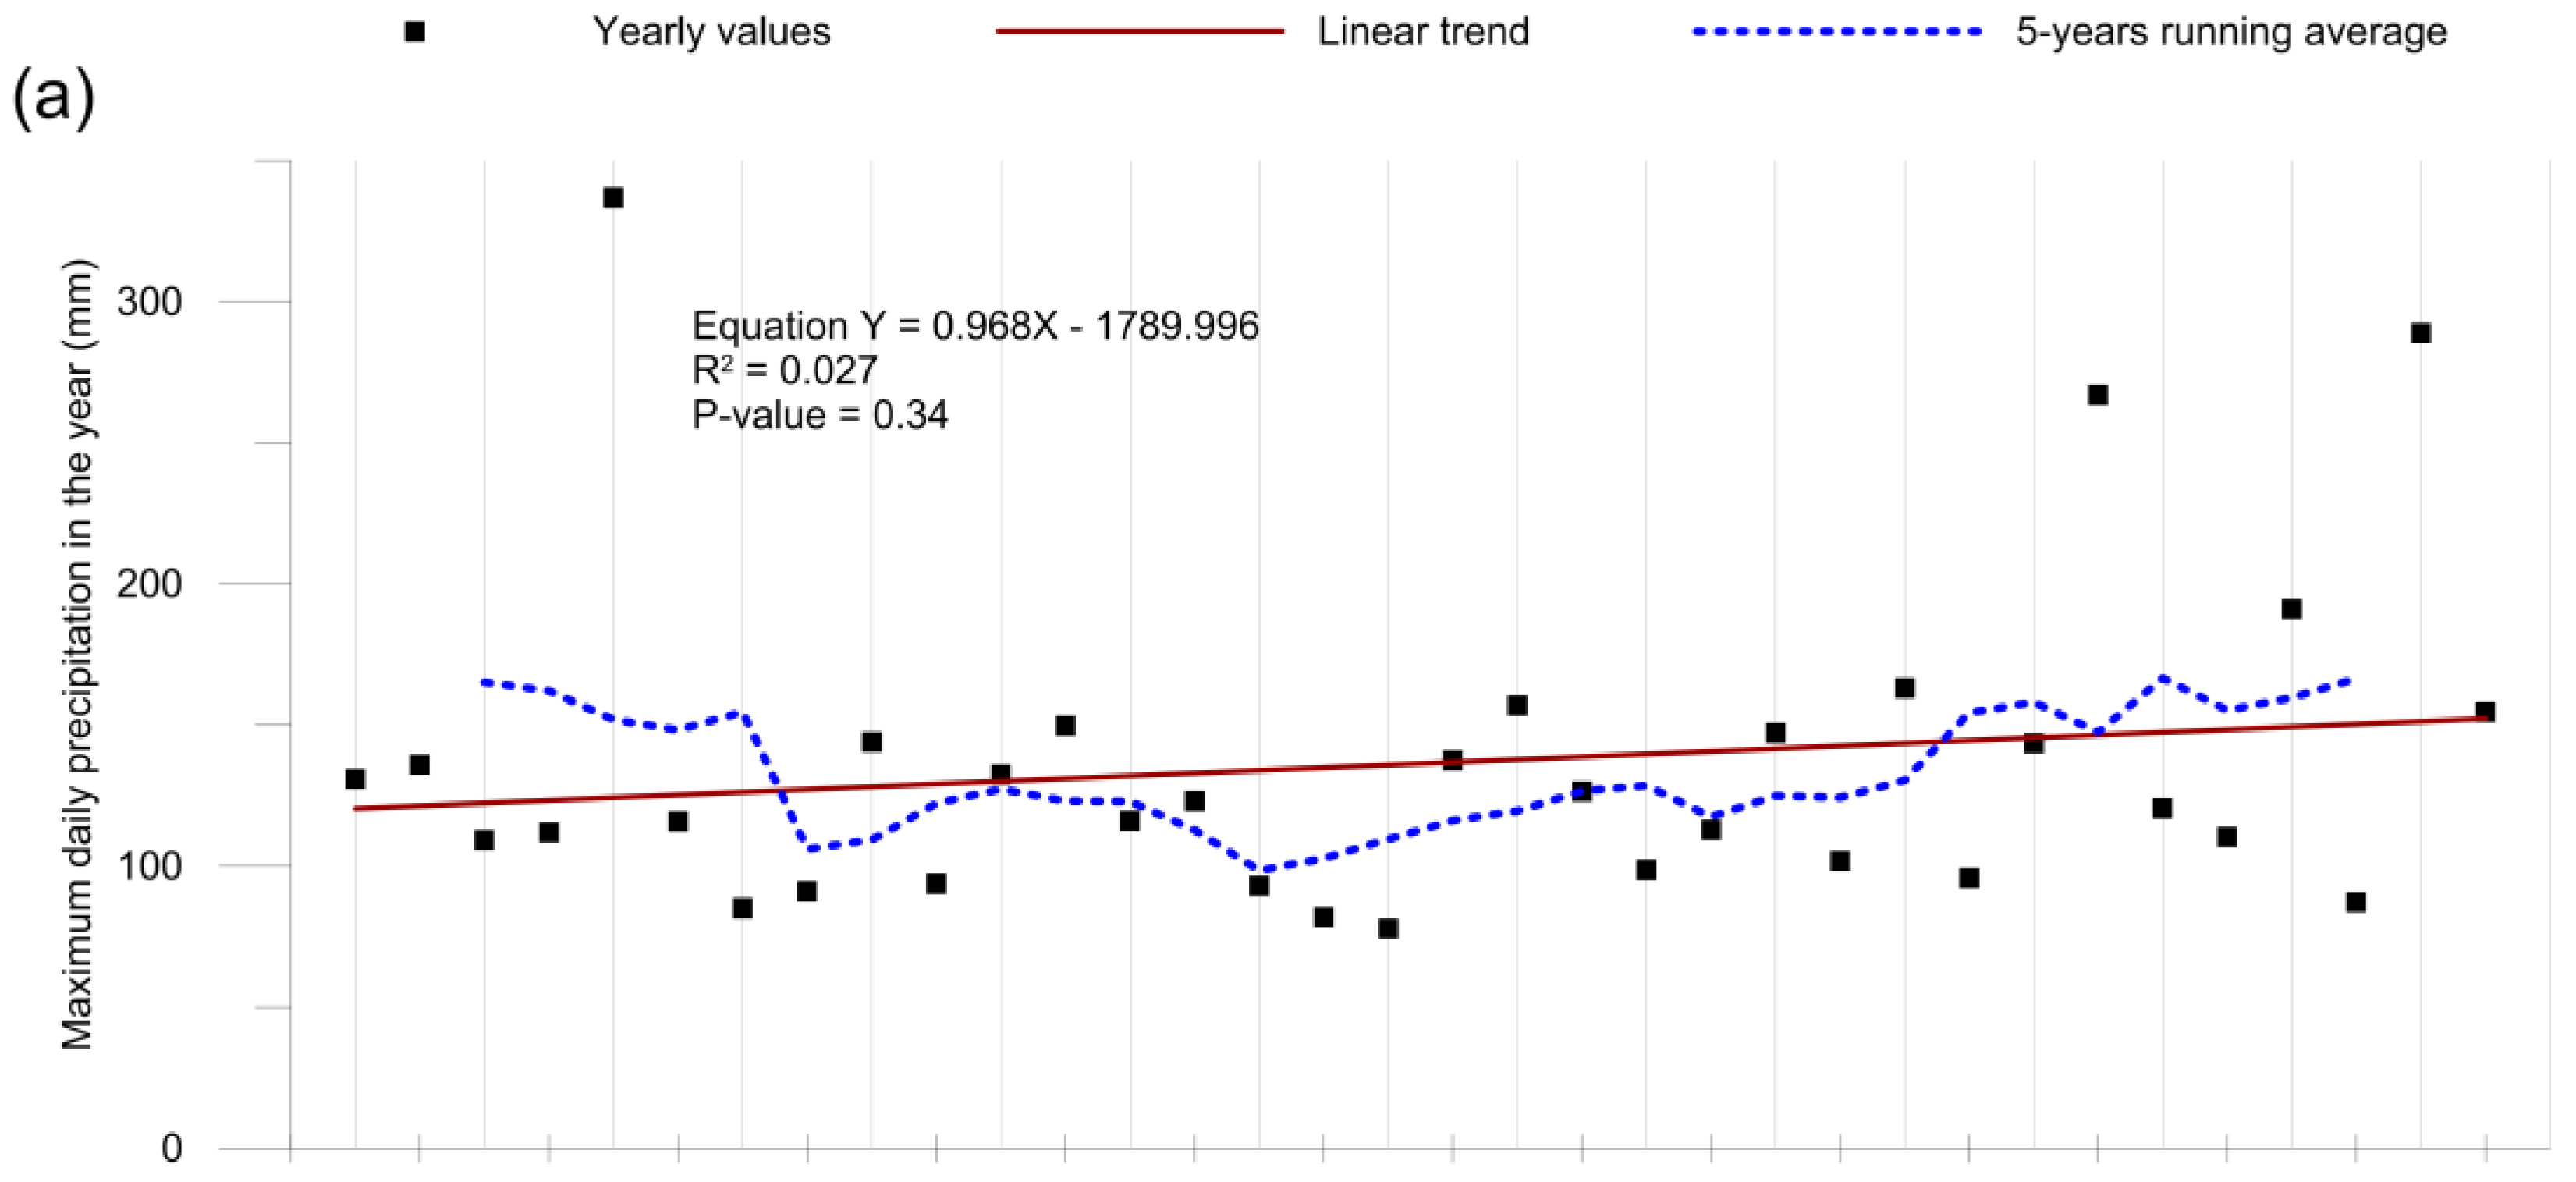
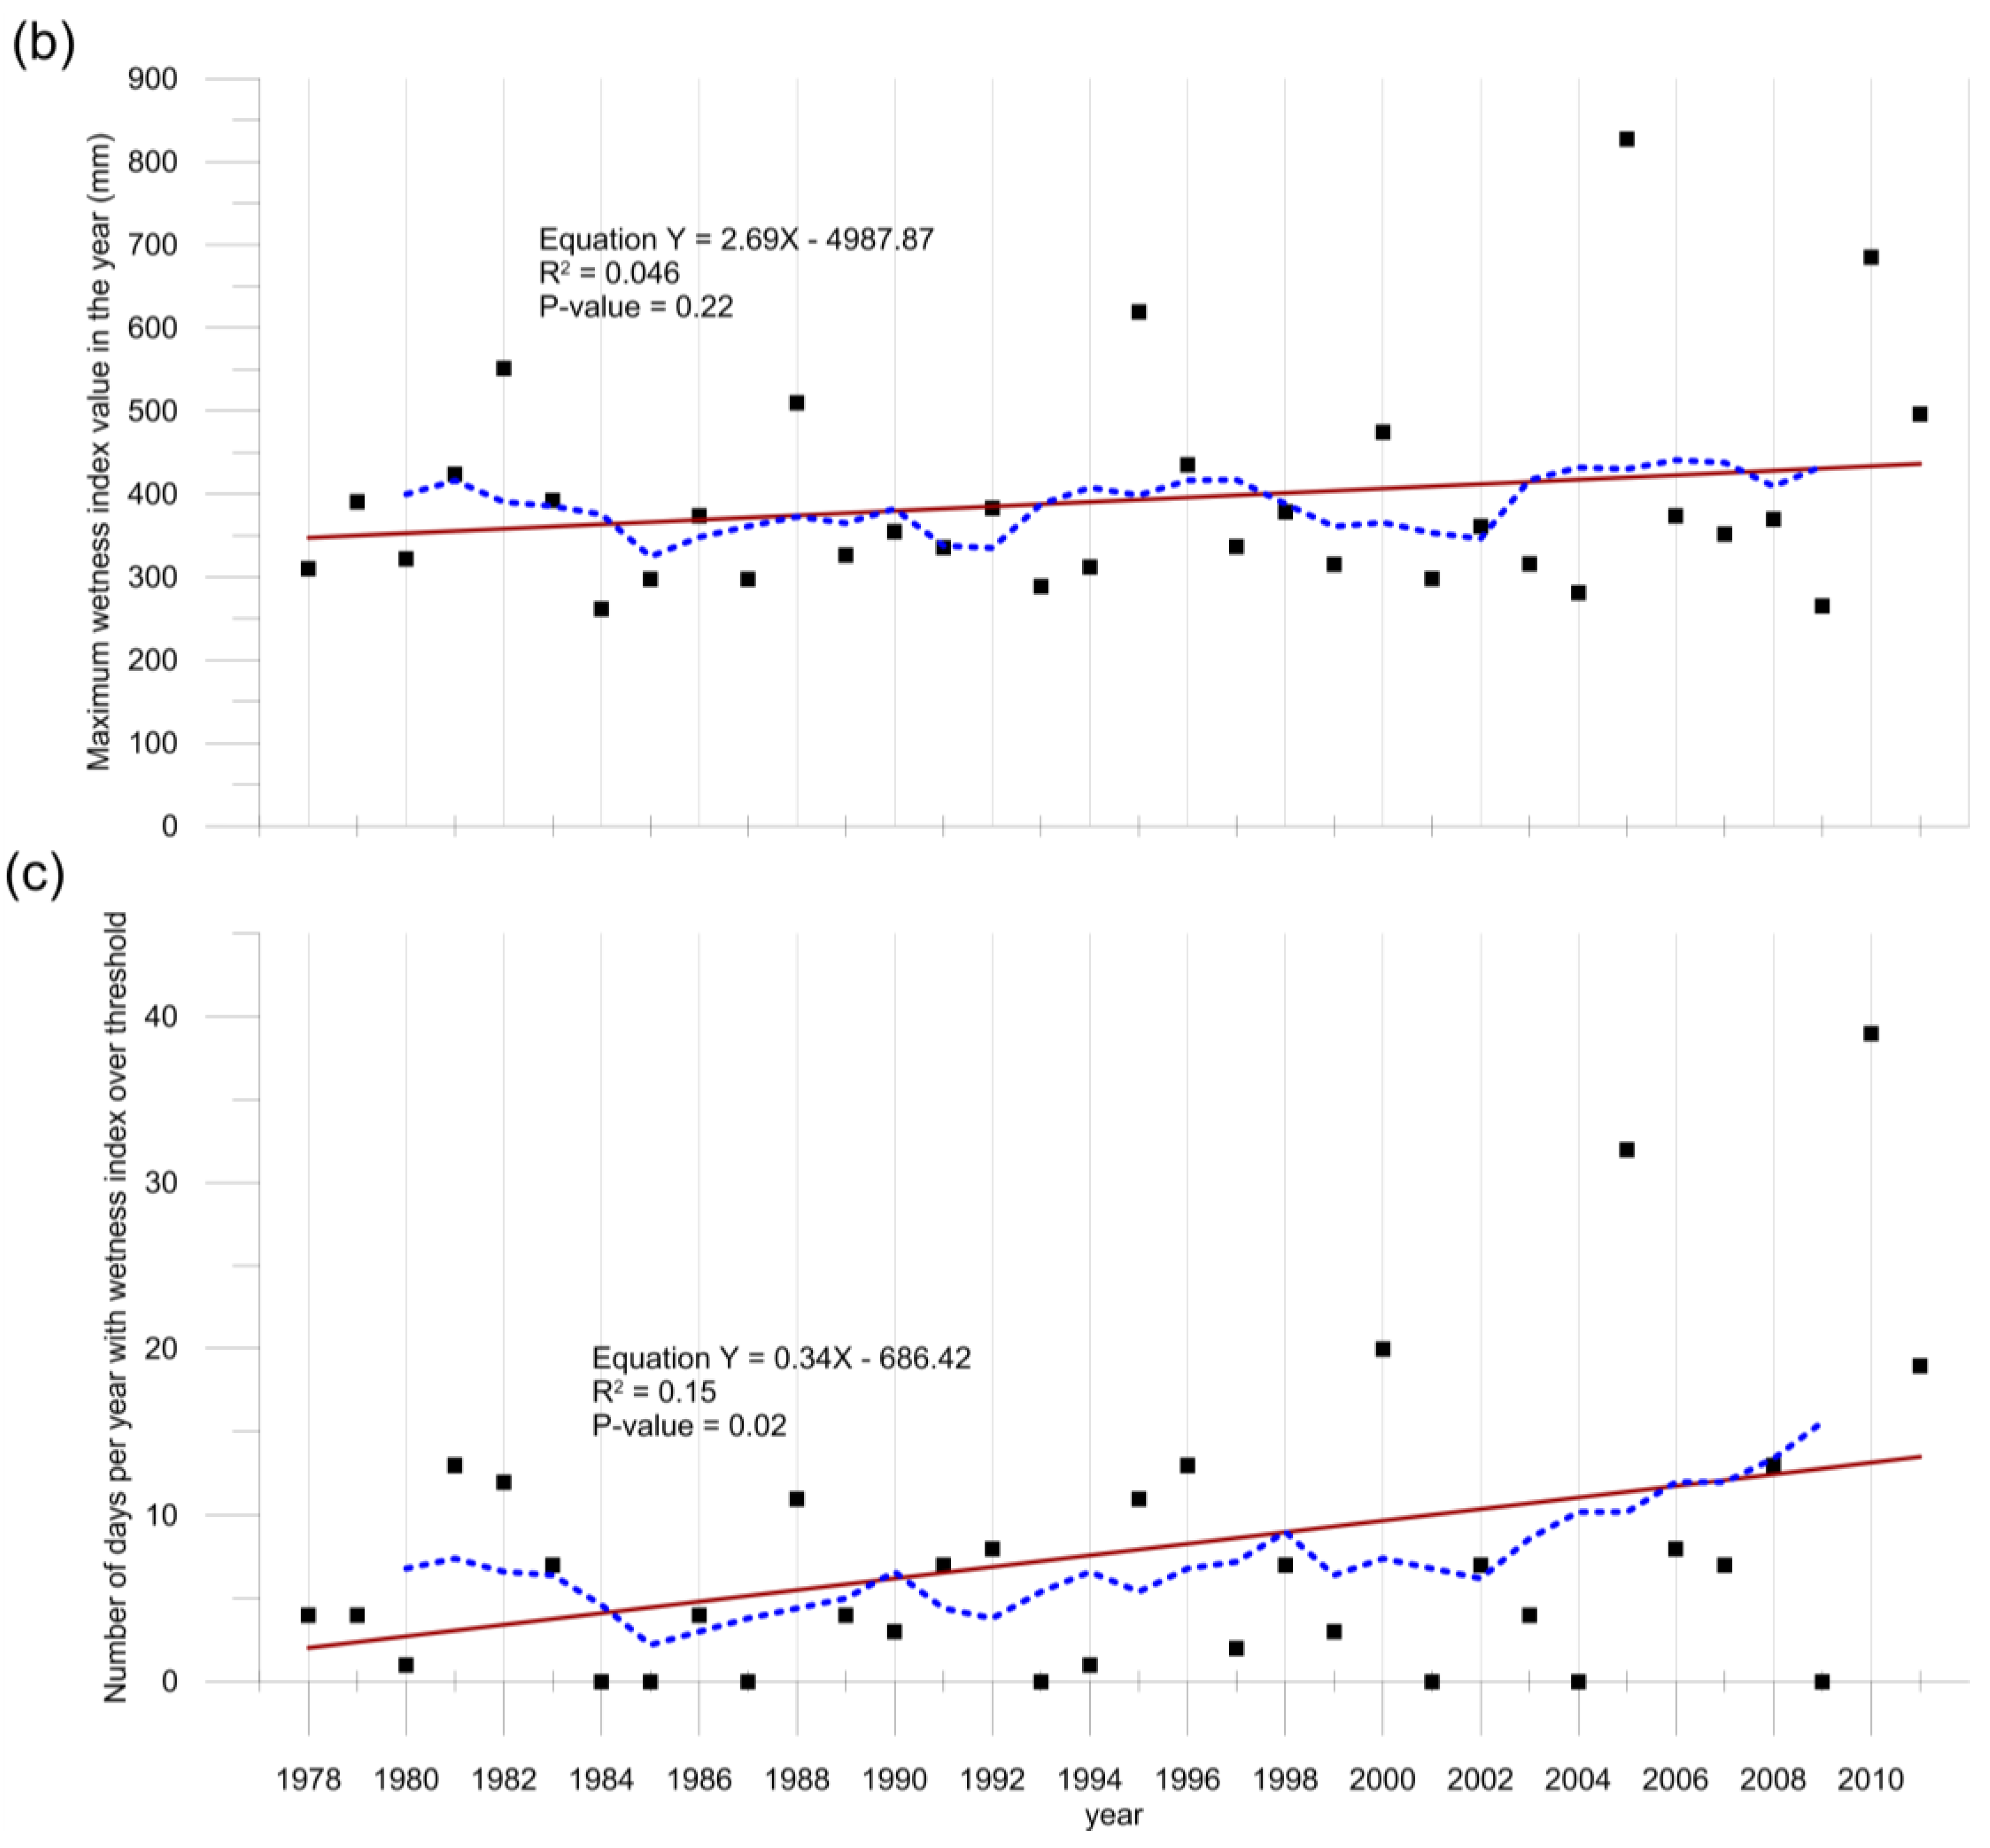
The results of the trend analyses on extreme precipitation maxima (Figure 4) showed no significant trends in either of the time series of extreme rainfall using maximum daily precipitation values (Figure 4a) and maximum Iwet (wetness index) in each year (Figure 4b). However, an increasing trend with a significance of 95% (Figure 4c) was identified in the number of days per year when the Iwet was equal to or larger than 300 mm, corresponding to the empirical threshold above which disasters are more likely to occur, which was identified by Soto et al. [32] for the same study area.
Figure 4. Precipitation trends 1978–2011, Retalhuleu station, Guatemala. Three approaches identifying trends in extreme precipitation: (a) yearly maxima of daily precipitation, (b) yearly maxima of 10-day period wetness index according to Soto et al. [32], (c) and yearly frequency of days when the 10-day period wetness index was equal to or higher than the aforementioned threshold. Data source: INSIVUMEH.
Remotesensing 07 12380 g004aRemotesensing 07 12380 g004b

3.3. Population Dynamics, Key Vulnerability in the Samala River Catchment

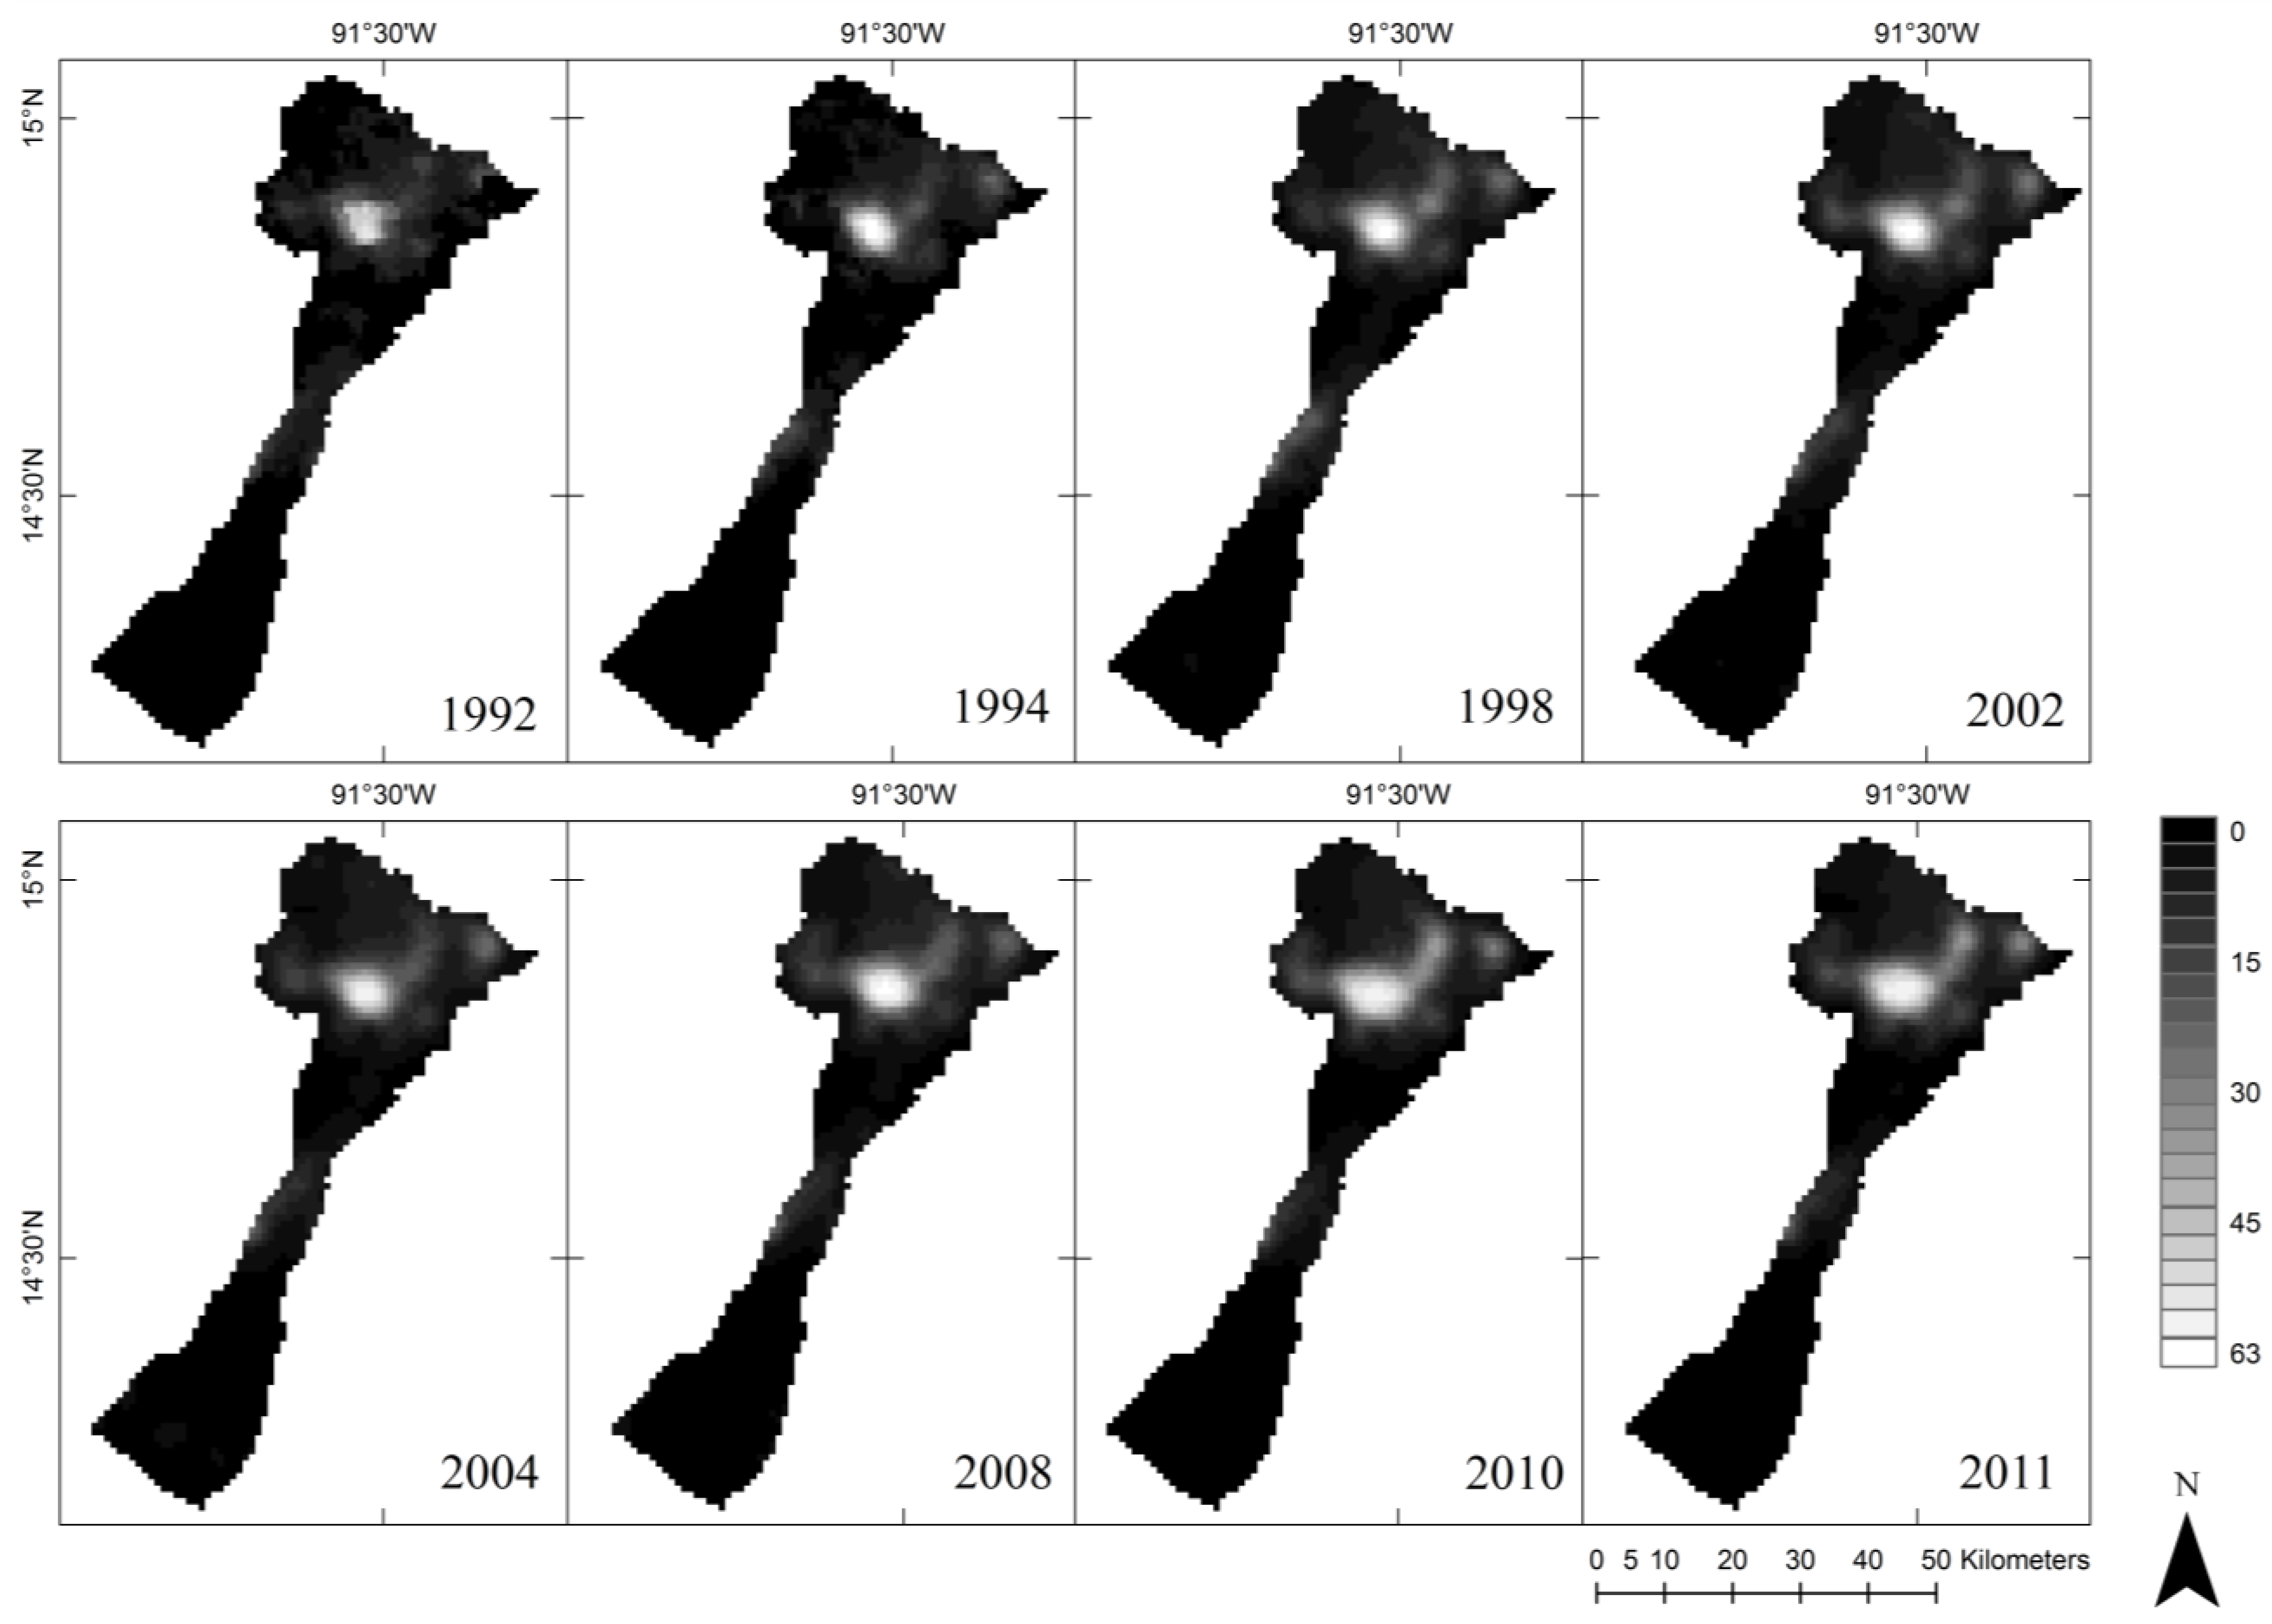
The assessment of exposure to natural hazards in the Samala River catchment through satellite imagery of nightlights showed that the population increased in the territories that have experienced increasing impact of disasters (
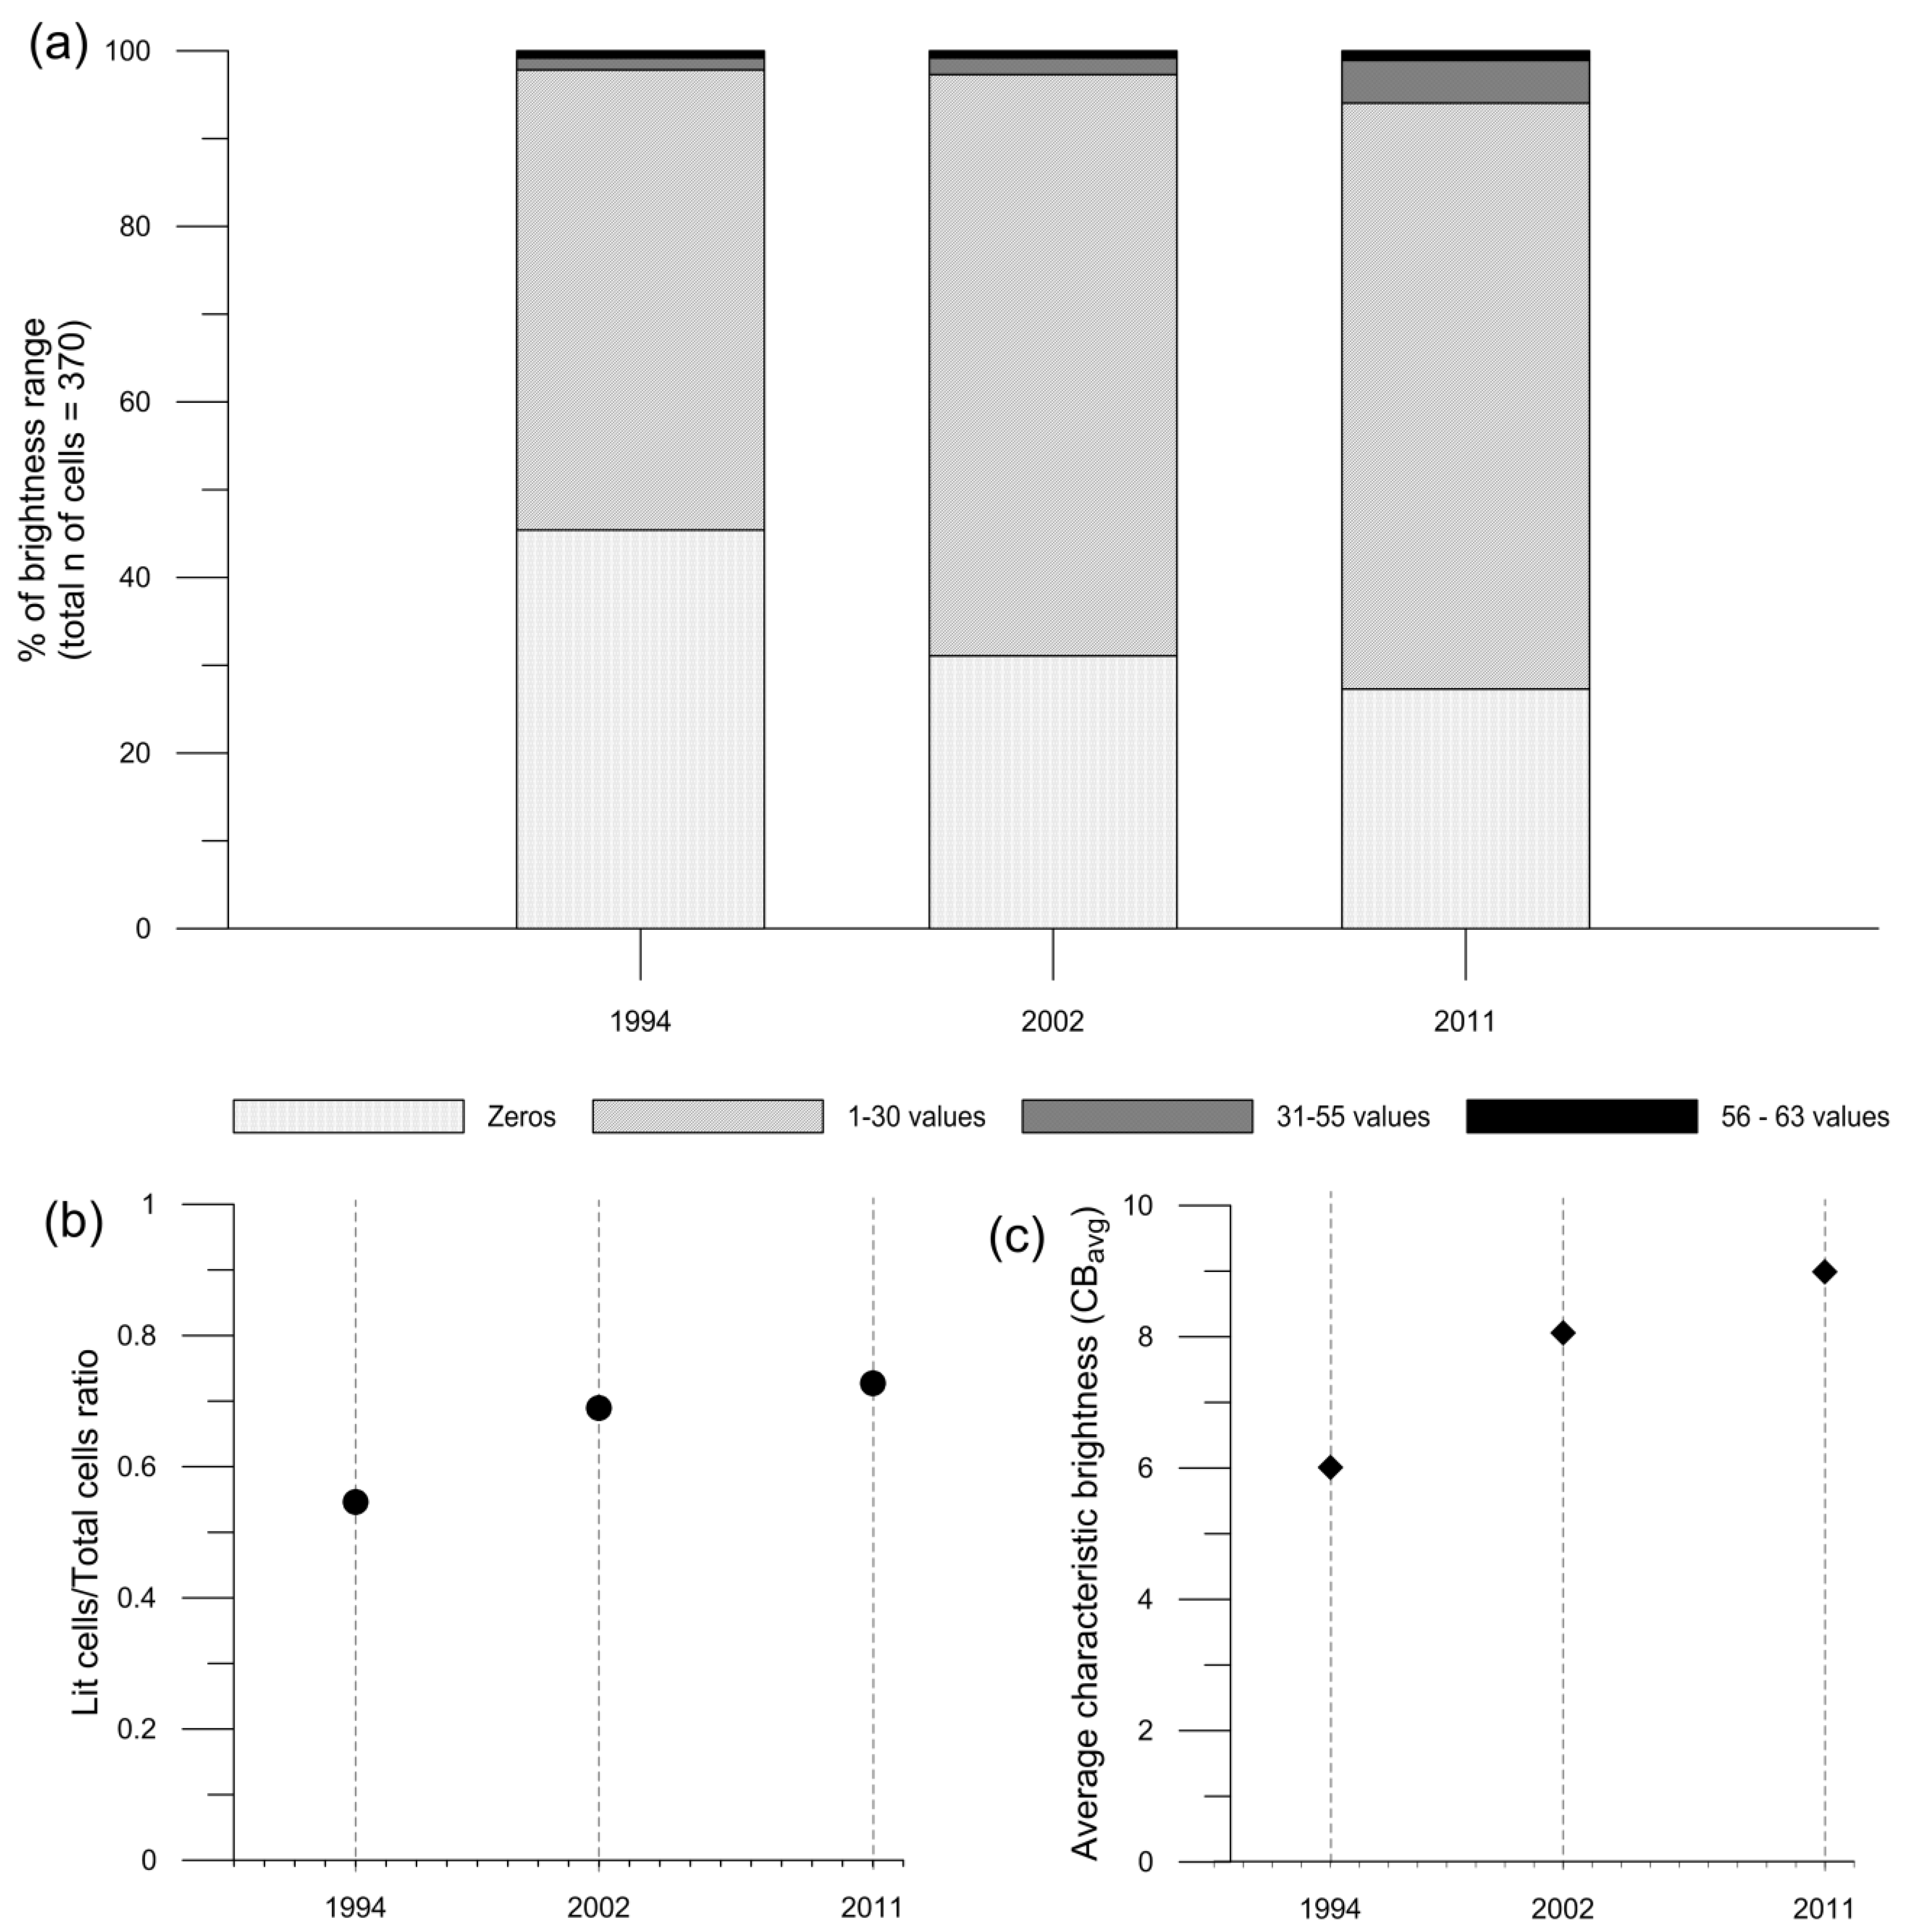
Figure 5). The analysis of the nightlights in close proximities of the Samala River in terms of the distribution of cells by brightness values showed that cells with a value of zero decreased over time (Figure 5a). The number of lit cells increased for all the value ranges. The cells with low brightness values (1–30) were the ones that increased the most. We found that the ratio of lit cells to the total number of cells increased over time. The general brightness in terms of the characteristic average brightness (CB
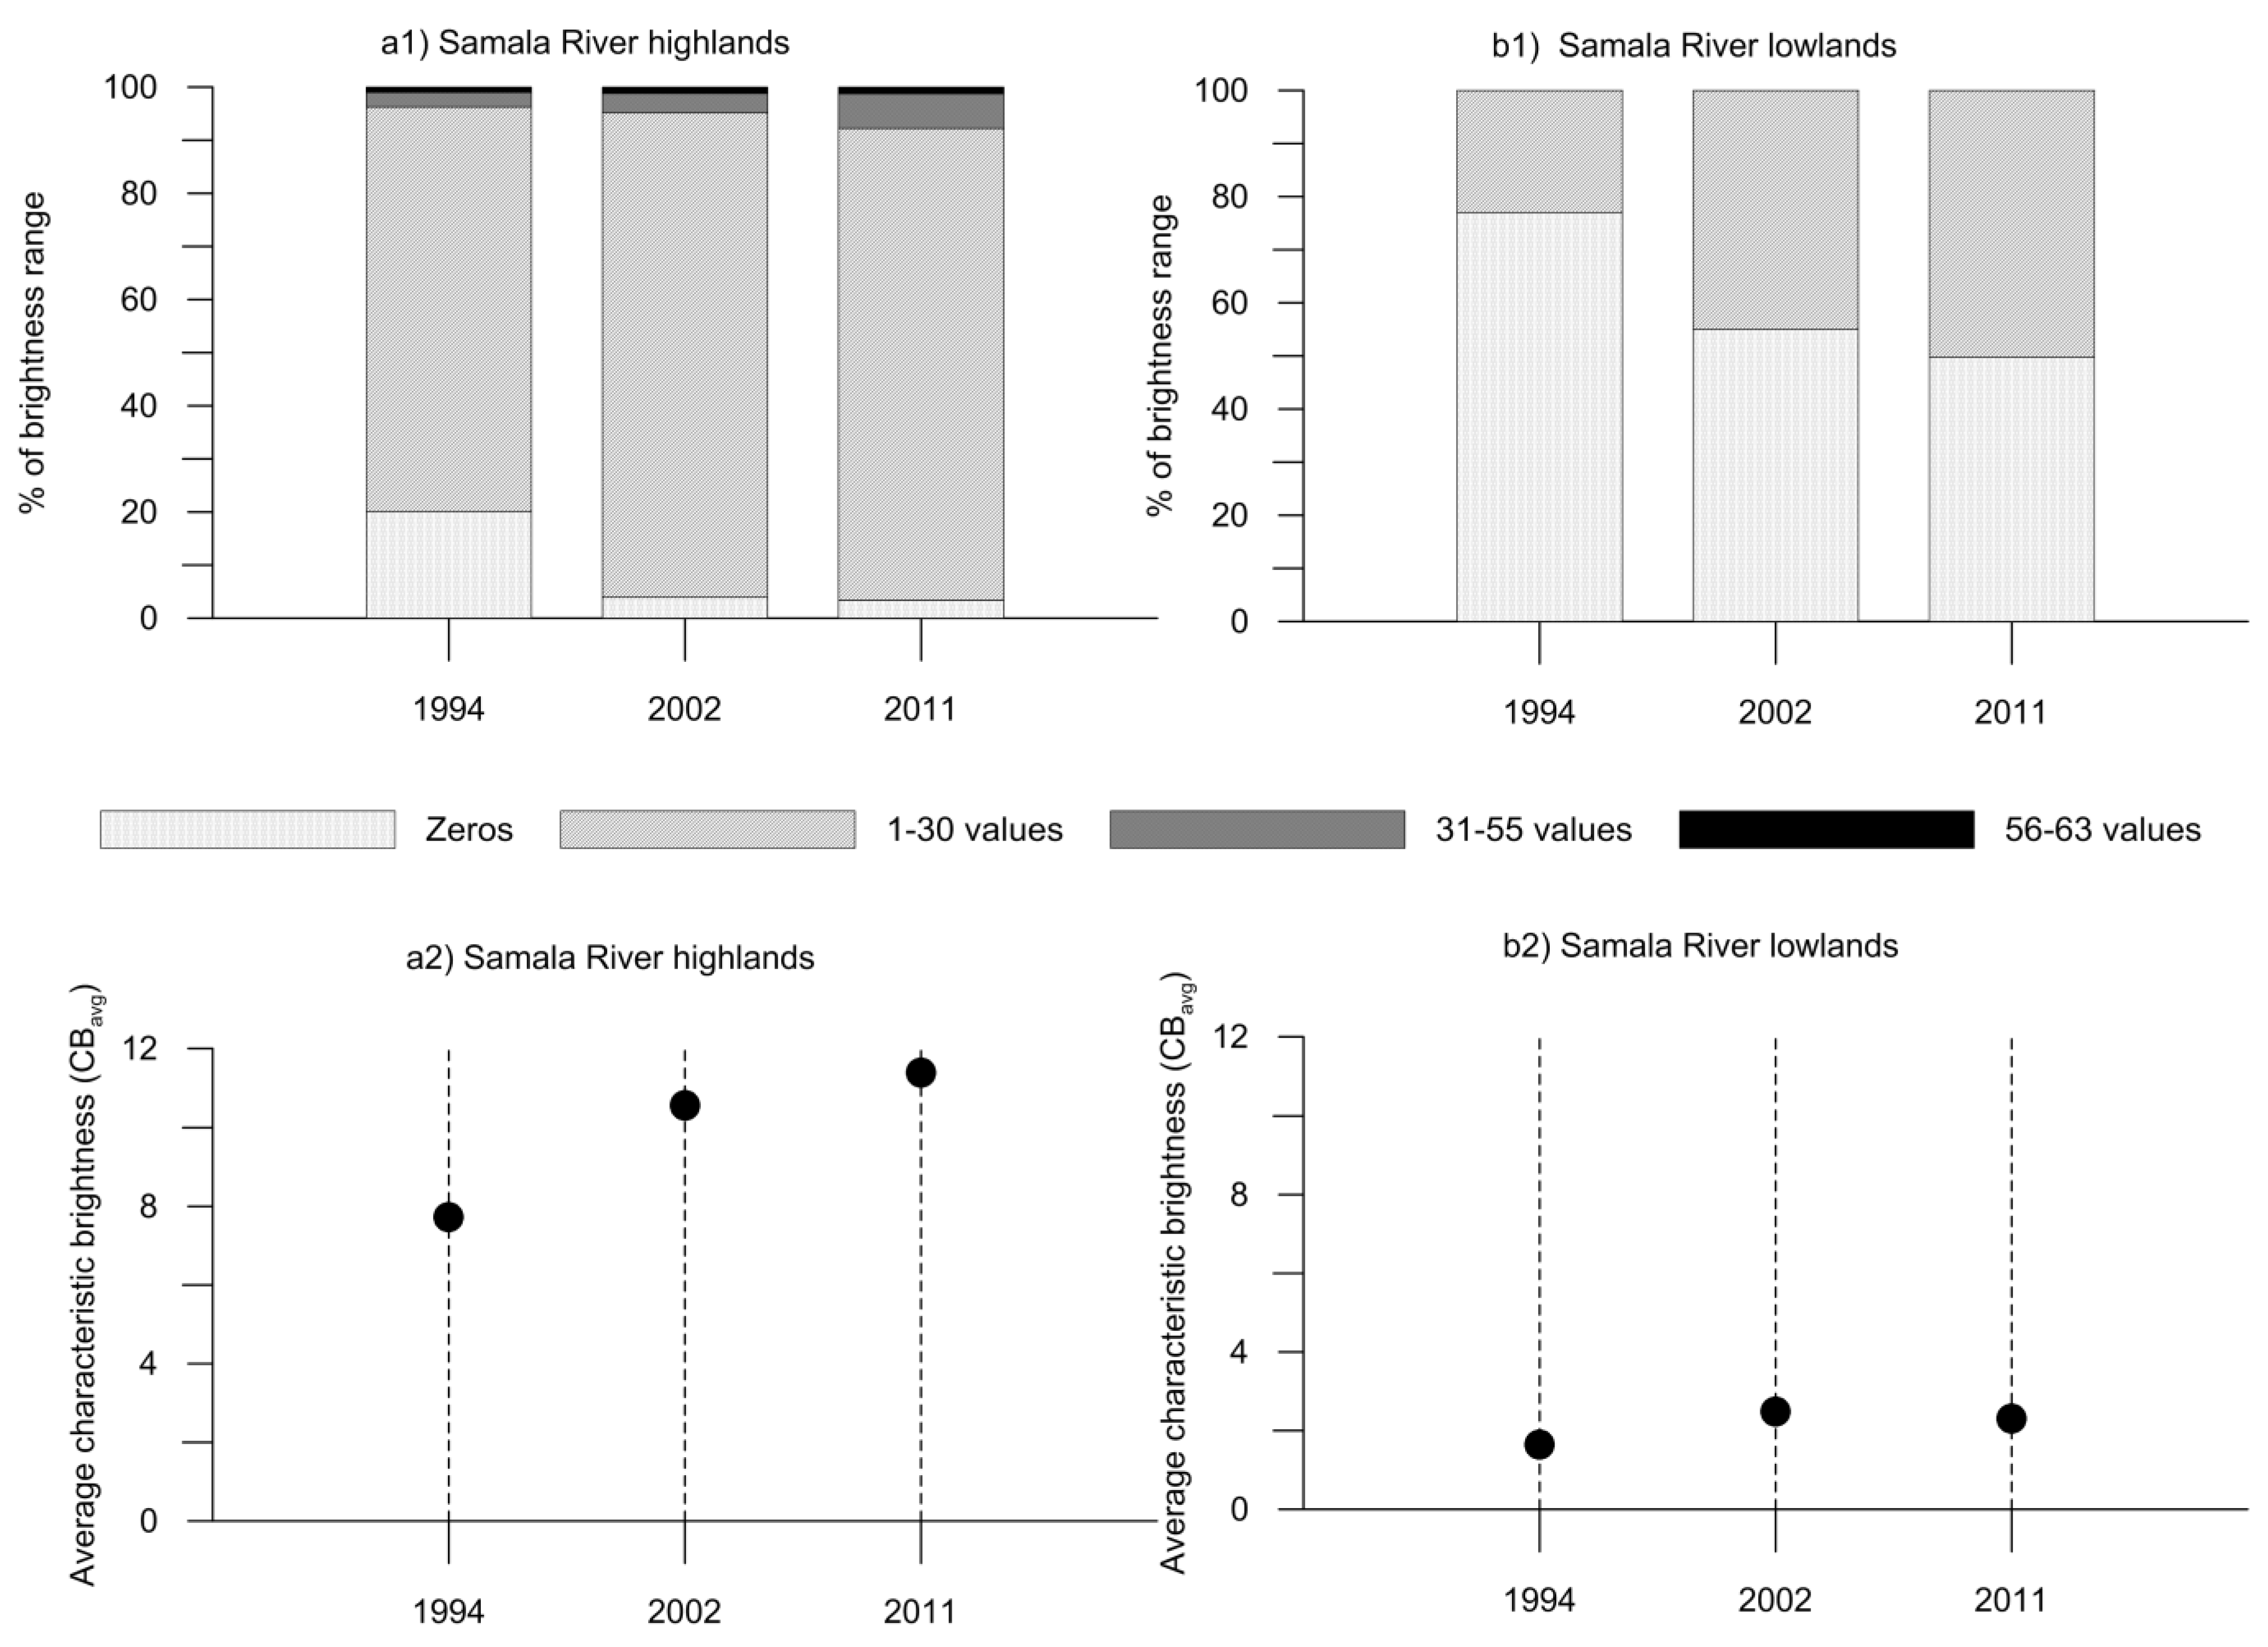
avg) also increased continuously. The increases in all the parameters analyzed were larger for the period between 1994 and 2002 than for the one between 2002 and 2011. The results of the analyses performed separately for the highlands and the lowlands (Figure 6) indicated that the population dynamics in the highlands play a more important role in the overall dynamics of the study area than that of the lowlands. The lowlands, for example, do not comprise any bright cells (values over 30) in any of the images, but they do show that the dark cells (value of zero) are constantly decreasing over time. An important result in our assessment is that population dynamics in the proximity of the river path are very much like the overall dynamics of the catchment. Similar outcomes were observed in the analyses of the close proximities of the river and the entire catchment.
Figure 5. Nightlights in the close proximity of the Samala River over time. The evolution in time of nightlight cells corresponding with the river path (close proximity) is shown in terms of (a) distribution of cells per brightness ranges, (b) ratio of lit cells (cells that have recorded some light) to total cells, and (c) characteristic average digital number (CBavg).
Remotesensing 07 12380 g005
Figure 6. Nightlights in the highlands and lowlands of the Samala River catchment over time. The evolution in time of nightlight cells is shown separately for the highlands and the lowlands in terms of (a1,b1) distribution of cells per brightness ranges and (a2,b2) characteristic average digital number (CBavg).
Remotesensing 07 12380 g006

3.4. Disasters, Hazards and Vulnerability Trends Brought Together

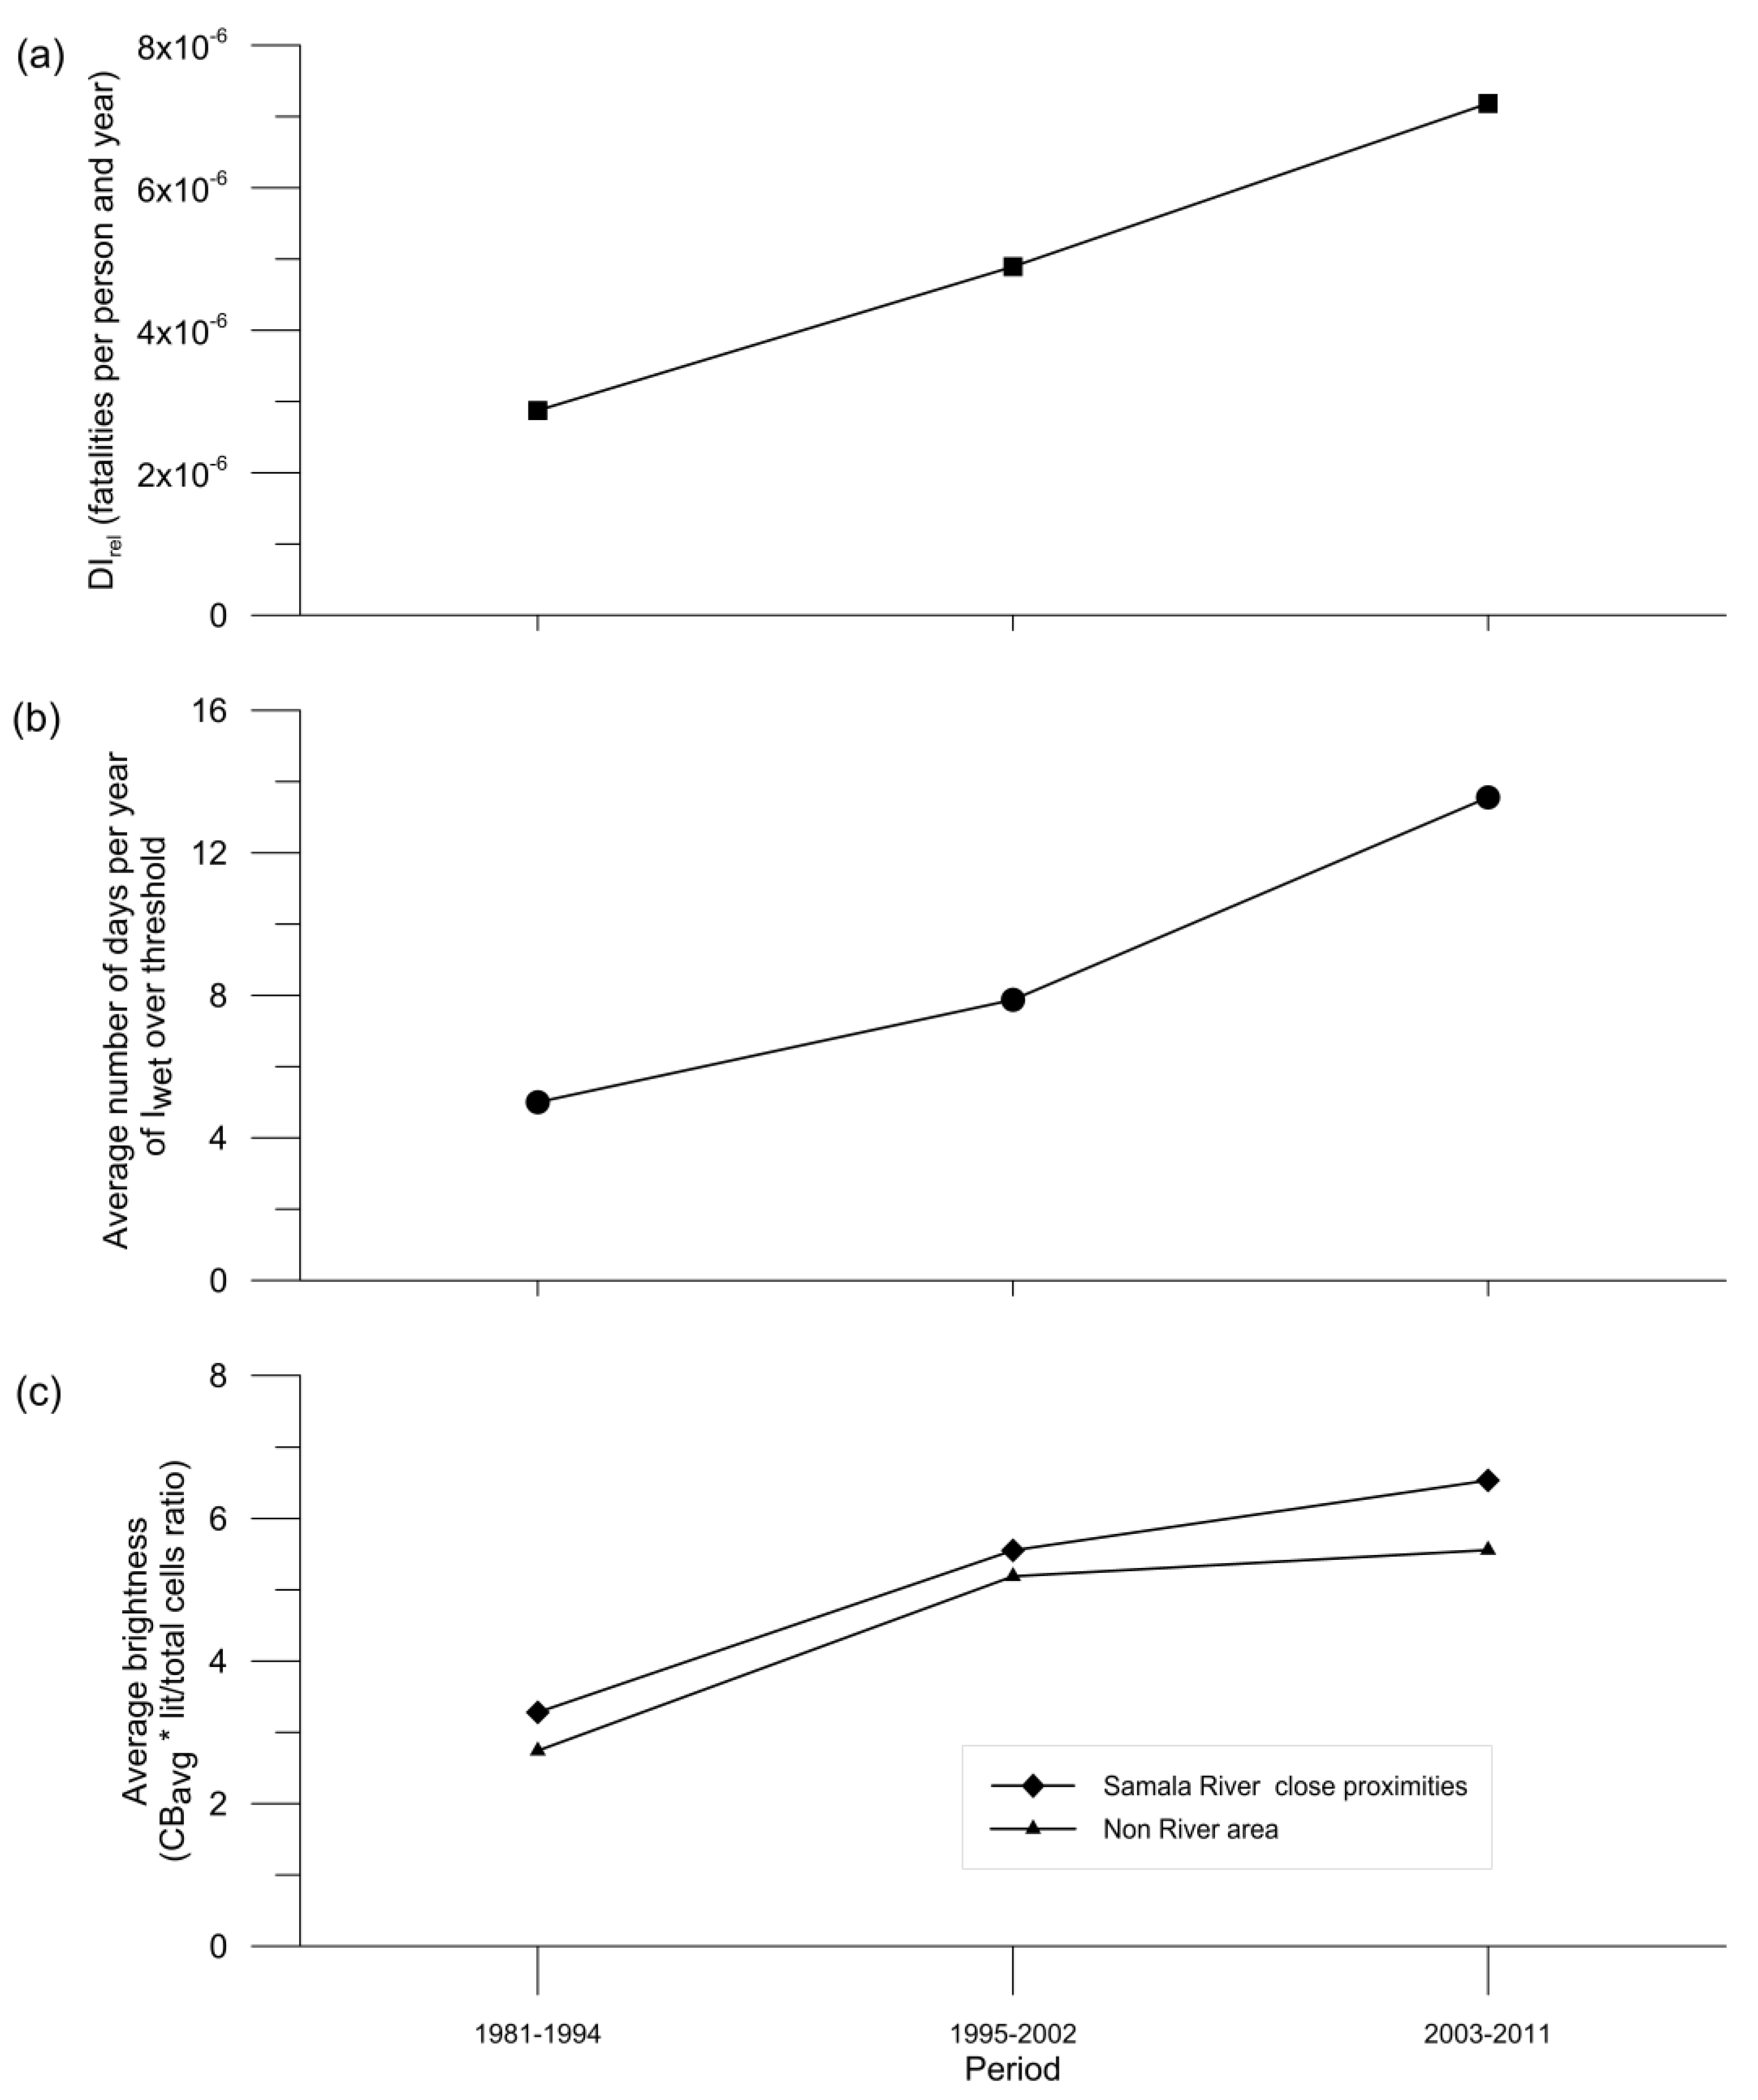
The results of the different analyses were brought together to compare the changes in disasters, hazards and exposure in the Samala River catchment over time using the assumed proxies of this study and contrast the different trends (Figure 7). Increases were identified for all the variables analyzed during the entire temporal span of the study. Human exposure to hazards was presented separately for the close proximities of the river and the rest of the catchment to evaluate the differences in magnitude and the trends over time.
The rates of increase of the linear trends of the factors included as proxy data in our analyses of the etiology of disasters were estimated, using the middle year of each period for the calculations. The relative impact of disasters (DIrel) of hydrometeorological causes in the Samala River basin increased at a rate of about 0.2 × 10⁻⁶ fatalities per person∙yr−2. The average number of days per year with wetness index (Iwet) over the identified threshold increased at a rate of about 0.4 days∙yr−2. The average brightness in the catchment increased at a rate of about 0.2 brightness units∙yr−1 for both the close proximities of the river and the non-river area. The three linear trends calculated had a R2 > 0.90 but our analysis could only include three periods due to the time spans of the available data, so the statistical significance could not be tested.
Figure 7. Changes in the Samala River catchment regarding (a) relative disaster impact DIrel associated with hydrometeorological causes (a proxy for disaster risk), (b) average number of days in the year of Iwet over the identified threshold ([32] (a proxy for natural hazards), and (c) average brightness (a proxy for vulnerability in terms of exposure). Average brightness (c) corresponds to the values of the final year of each period (1994, 2002, and 2011) and is shown separately for the close proximities of the river and the rest of the catchment (non river area).
Remotesensing 07 12380 g007

3.5. Discussion

Frequent disasters are reported in the Samala River catchment. Natural hazards are part of the local setting and therefore stakeholders, especially the local population, need guidelines that allow them to reduce the risk of disasters while continuing to live and develop in the area. Although research on the particular hazards in this area has been carried out [23,24,29,30,39] there is still a lot more to do in disaster research to give sound fundaments for disaster risk minimization and planning. Much-needed research is constrained because enough comprehensive data on disasters are not yet available. Both quality and quantity of available data are problematic [19]. Although data limitations were identified, the dynamics behind disasters could be investigated using satellite imagery as a proxy for human dynamics.
We explored the reasons why the disasters that occur in the Samala River catchment are causing more impacts over time by analyzing the trends on the two main potential driving forces of such changes: hazards and human exposure to those hazards. Our analysis showed that in the Samala River catchment the fatalities caused by hydrometeorological hazards have steadily increased from 1988 to 2011. This result contrasts with the identified global trends, which show decreased fatalities. The question then was what has caused the increasing fatalities from natural disasters in this particular area? Was the increasing disaster trend the result of increasing hydrometeorological hazards? Or was it the result of increasing human exposure and vulnerability to those hazards? Our study indicates that the risk of disasters in the case study of the Samala River catchment is determined by both factors: the natural hazards and the social dynamics.
The increases shown both in the average number of days when the wetness index surpassed the previously identified empirical threshold and in the average brightness indicate that natural and social factors determine the disaster risk in the area (Figure 7a,b). We could see that, although the results in the entire catchment are similar to those in the close proximities of the river, the increase in exposure is higher in the areas more exposed to floods and lahars (Figure 7c).
Human exposure in the Samala River catchment was clearly identified as a driving factor for the increased disaster risk. The distribution of cells per brightness values indicates that human settlements are in general spreading horizontally in the territory. The increase of cells with brightness values above 30 suggests that a part of the human settlements are densifying, but this occurs only in the highlands. Satellite imagery of nightlights showed to be very useful to analyze the spatial and temporal changes of human settlements in the study area. Nightlights provided an alternative way to overcome the lack of spatial-temporal resolution of census data, which are aggregated at municipality level. Municipal population data would not allow, for instance, to properly account for the spatial distribution of people in relation to sources of hydrometeorological hazards, such as rivers.
Our analysis of causal factors showed that extreme rainfall alone cannot explain the increasing temporal trends of fatalities caused by hydrometeorological hazards. The trends of the values analyzed did not show a steep slope and they were not statistically significant. In the three maxima analyzed, the values of two years stood out in the data series, 2005 and 2010, with values noticeably higher than the rest. In these years, two important hurricanes (Stan and Agatha) strongly affected Guatemala. This result shows that strong tropical storms increase the risk of disasters in the study area by increasing one of the main natural hazards in the area. Climatic change could therefore play an important role on the impact of disasters caused by hydrometeorological hazards in the Samala River catchment in the future. The increasing trend of the number of days in a year when the threshold of the empirical 10-day wetness index [32] was surpassed indicates that the effect of the water storage in the soil could be a key factor influencing the risk of disasters.
Regarding the results of our analyses in spatial terms, we found that the trends in the Samala River catchment seem to be driven mainly by the highlands. When the analyses were carried out separately for the highlands and lowlands, the general patterns followed the patterns identified in the highlands. Census data showed that most people live in the highland and therefore social dynamics could be more important than hazards in that part of the study area. In-depth research of the social dynamics of this particular area would be desirable to identify priorities for disaster risk reduction in this geographical area.
Spatial and temporal analyses rely on the availability of good quality data. However, in many parts of the world, such data are either not available or very limited. This is the case of many disaster-prone areas and it is especially problematic on the local scale. Assessing the impact of disasters is complex: on the one hand it is related to the damage in terms of geographical extension and costs while on the other hand the dimension of disasters is also related to the number of people that are affected, injured or killed as a result. Data on the effects of disasters in people and damage are still not widely available and data uncertainty remains high. The main sources for the database used for this case study, for instance, are newspaper news and reports, which have an intrinsic level of uncertainty, as official data are often not available. It is thus important to improve and sustain data collection systems over time in order to create databases that are more informative for disaster research. However, the need of knowledge exists now and therefore ways to tackle the problem should be put on the table.

4. Conclusions

The goal of this work was to explore the etiology of trends in disasters caused by natural events in Guatemala, particularly those caused by hydrometeorological hazards. We found that disaster losses and fatalities in the study area have been steadily increasing since 1981, as shown by the relative impact of disasters (DIrel) of hydrometeorological causes in the Samala River that increased at rate of about 0.2 × 10⁶ fatalities per person and year−2. Our study showed that both components of risk also have increased during the same period. On the one hand, there has been an increase of hazardous conditions in the catchment that potentially leads to more frequent hydrometeorological disasters. This is shown by the analyzed proxy, the average number of days per year of wetness index (Iwet) over the identified threshold, which increased at a rate of 0.4 days∙yr−2. On the other hand, we also observed an increasing trend in human exposure to hydrometeorological hazards as indicated by the amount and intensity of nightlights in areas close to rivers. The average brightness in the Samala River basin increased at a rate of 0.2 brightness units∙yr−1 both in the close proximities of the river and in the non-river area. The results indicate a geographically differentiated progression of the components of risk in the study area, which seems to be mainly occurring in the highlands. Important to mention that the three linear trends calculated had a R2 > 0.90 but the available data only permitted three periods of analysis which are insufficient to make the trend statistically significant.
Our work successfully established potential relationships of causality between the occurrences of disasters and key natural and social conditions in spatial terms with a higher resolution than what is feasible with traditional data (census). We used nightlights imagery as a proxy of the social context at the local scale in an area where hydrometeorological disasters are frequently reported. The approximately 1 × 1 km geographical unit of nightlights enhances the spatial resolution of census which, even if it is only provided in municipal units, is often the only widely available data source to study social dynamics. The results demonstrated the potential of remotely sensed maps of nightlights to capture the spatial distribution of the social component of risk (i.e., vulnerability and exposure to flooding and lahars) on the local scale, improving the coarser resolution of the input data.
While many papers have highlighted the usefulness of remote sensing data in characterizing the physical component of risk (i.e., hazard) via flood extent maps and inundation water heights [40,41,42] some others have started to use remotely sensed maps of nightlights to study the exposure to floods on the global scale [4]. This study has explored the suitability of using the nightlights imagery in combination with census data and public available data on disasters (DesInventar) to investigate causal relationships of the risk of disasters at a fine resolution in an area where data on social factors are limited and available only at the municipal level, taking a step forward on the use of nighttime lights imagery for natural disaster research.
This study confirmed that remotely sensed nightlights can be a useful tool to analyze population dynamics in spatial terms on a local scale over time. Their general usefulness is given by the high spatial and temporal resolution covered by the yearly composite images. These images are freely available for almost the entire planet and they are therefore accessible for those areas that lack good spatial data. The series of images have an enhanced usefulness for areas where population data are given only down to the municipal scale, which limits the possibilities of identifying the specific places where people settle and grow. Although the effects of particular variation issues have to be considered when using nightlights as proxy data for population dynamics, e.g., light pollution, gas flaring, the value of such data to enhance the spatio-temporal resolution of census data is worth it, particularly in the conditions of the case study, where no such anomalies are documented.
On the basis of a successful application of remotely sensed imagery for the analysis of social phenomena to a local scale, future research can make use of the temporal and spatial advantages of such open-access data to further investigate the role of social dynamics over space and time in the occurrences of disasters and provide sound knowledge to support disaster risk reduction plans and actions.

Acknowledgments

We would like to thank SEGEPLAN for providing geographical information of Guatemala and DesInventar for providing disasters data for Guatemala. This research was carried out within the Centre for Natural Disasters Science (CNDS) research school, supported by the Swedish International Development Cooperation Agency (SIDA) through their contract with the International Science Programme (ISP) at Uppsala University (contract number: 54100006).

Author Contributions

All the authors have substantially contributed to this work. Giuliano Di Baldassarre and Agnes Soto conceived the methodology; Allan Rodhe conceived and contributed to the trend analysis on hazards. Veijo A. Pohjola supervised the results’ statistics and its critical discussion. Agnes Soto performed the analyses and led the paper writing process. Giuliano Di Baldassarre, Allan Rodhe and Veijo A. Pohjola supervised the data processing and contributed to paper writing.

Conflicts of Interest

The authors declare no conflict of interest.

References

  1. United Nations Office for Disaster Risk Reduction (UNISDR). Terminology on Disaster Risk Reduction; UNISDR: Geneva, Switzerland, 2009. [Google Scholar]
  2. Me-Bar, Y.; Valdez, F. Recovery time after a disaster and the ancient Maya. J. Archaeol. Sci. 2004, 31, 1311–1324. [Google Scholar] [CrossRef]
  3. Gerrard, C.M.; Petley, D.N. A risk society? Environmental hazards, risk and resilience in the later Middle Ages in Europe. Nat. Hazards 2013, 69, 1051–1079. [Google Scholar] [CrossRef] [Green Version]
  4. Ceola, S.; Laio, F.; Montanari, A. Satellite nighttime lights reveal increasing human exposure to floods worldwide. Geophys. Res. Lett. 2014, 41, 7184–7190. [Google Scholar] [CrossRef]
  5. Adikari, Y.; Yoshitani, J. Global Trends in Water-Related Disasters: An Insight for Policymakers; UNESCO: Paris, France, 2009. [Google Scholar]
  6. Guha-Sapir, D.; Below, R.; Hoyois, P. EM-DAT: The OFDA/CRED International Disaster Database. Available online: www.emdat.be/natural-disasters-trends (accessed on 3 June 2015).
  7. Di Baldassarre, G.; Montanari, A.; Lins, H.; Koutsoyiannis, D.; Brandimarte, L.; Blöschl, G. Flood fatalities in Africa: From diagnosis to mitigation. Geophys. Res. Lett. 2010, 37, L22402. [Google Scholar] [CrossRef]
  8. Guha-Sapir, D.; Below, R.; Hoyois, P. EM-DAT: The OFDA/CRED International Disaster Database. Available online: www.emdat.be/database (accessed on 12 November 2014).
  9. UNISDR/UNDP. DesInventar Disaster Information Management System. Available online: http://www.desinventar.net (accessed on 4 May 2012).
  10. Kreft, S.; Eckstein, D. Global Climate Risk Index 2014; Germanwatch: Berlin, Germany, 2013. [Google Scholar]
  11. Smith, A.; Martin, D.; Cockings, S. Spatio-temporal population modelling for enhanced assessment of urban exposure to flood risk. Appl. Spat. Anal. Policy 2014, 7, 1–19. [Google Scholar] [CrossRef]
  12. Aubrecht, C.; Steinnocher, K.; Huber, H. DynaPop—Population distribution dynamics as basis for social impact evaluation in crisis management. In Proceedings of the 11th International ISCRAM Conference, University Park, PA, USA, 18–21 May 2014.
  13. Elvidge, C.D.; Sutton, P.C.; Ghosh, T.; Tuttle, B.T.; Baugh, K.E.; Bhaduri, B.; Bright, E. A global poverty map derived from satellite data. Comput. Geosci. 2009, 35, 1652–1660. [Google Scholar] [CrossRef]
  14. Elvidge, C.D.; Ziskin, D.; Baugh, K.E.; Tuttle, B.T.; Ghosh, T.; Pack, D.W.; Erwin, E.H.; Zhizhin, M. A fifteen year record of global natural gas flaring derived from satellite data. Energies 2009, 2, 595–622. [Google Scholar] [CrossRef]
  15. Imhoff, M.L.; Lawerence, W.T.; Stutzer, D.; Elvidge, C. Assessing the impact of urban sprawl on soil resources in the united states using nighttime “city lights” satellite images and digital soils maps. In Perspectives on the Land Use History of North America: A Context for Understanding Our Changing Environment; US Geological Survey: Washington, DC, USA, 1998; pp. 13–22. [Google Scholar]
  16. Sutton, P.; Elvidge, C.; Ghosh, T. Estimation of gross domestic product at sub-national scales using nighttime satellite imagery. Int. J. Ecol. Econ. Stat. 2007, 8, 5–21. [Google Scholar]
  17. Global Facility for Disaster Reduction and Recovery (GFDRR); United Nations Office for Disaster Risk Reduction (UNISDR); World Bank. Disaster Risk Management Programs for Priority Countries; GFDRR: Washington, DC, USA, 2011. [Google Scholar]
  18. Alcántara-Ayala, I. Geomorphology, natural hazards, vulnerability and prevention of natural disasters in developing countries. Geomorphology 2002, 47, 107–124. [Google Scholar] [CrossRef]
  19. Soto, A. Deriving information on disasters caused by natural hazards from limited data: A Guatemalan case study. Nat. Hazards 2015, 75, 71–94. [Google Scholar] [CrossRef]
  20. Dilley, M.; Chen, R.S.; Deichmann, U.; Lerner-Lam, A.L.; Arnold, M. Natural Disaster Hotspots: A Global Risk Analysis; World Bank Publications: Washington, DC, USA, 2005. [Google Scholar]
  21. Guha-Sapir, D.; Below, R. The Quality and Accuracy of Disaster Data: A Comparative Analyses of Three Global Data Sets; World Bank, Disaster Management Facility, ProVention Consortium: Brussels, Belgium, 2002. [Google Scholar]
  22. Amin, S.; Cox, M.; Goldstein, M. Using data against disasters: Overview and synthesis of lessons learned. In Data Against Natural Disasters: Establishing Effective Systems for Relief, Recovery and Reconstruction; Amin, S., Goldstein, M., Eds.; The World Bank: Washington, DC, USA, 2008; pp. 1–22. [Google Scholar]
  23. Kuenzi, D.; Horst, O.H.; McGehee, R.V.; Kuenzi, W.D. Effect of volcanic activity on fluvial-deltaic sedimentation in a modern arc-trench gap, southwestern Guatemala. Geol. Soc. Am. Bull. 1979, 90, 827–838. [Google Scholar] [CrossRef]
  24. Sanchez Bennett, E.H.; Rose, W.I.I.; Conway, F.M.M. Santa María, Guatemala: A decade volcano. Eos Trans. Am. Geophys. Union 1992, 73, 521–522. [Google Scholar] [CrossRef]
  25. Instituto Nacional de Sismología, Vulcanología, Meteorología e Hidrología (INSIVUMEH). Atlas Climatológico Guatemala; INSIVUMEH: Guatemala City, Guatemala, 2003. [Google Scholar]
  26. Instituto Nacional de Estadística (INE). Proyecciones de Población; INE: Guatemala City, Guatemala, 2004.
  27. Ministerio de Agricultura, Ganadería y Alimentación (MAGA). Atlas Temático de la República de Guatemala; MAGA: Guatemala City, Guatemala, 2002. [Google Scholar]
  28. PREVDA. PREVDA en Guatemala; PREVDA UGN: Guatemala City, Guatemala, 2011; Available online: http://www.sica.int/busqueda/secciones.aspx?IdItem=45686&IdCat=48&IdEnt=630 (accessed on 27 January 2015).
  29. Vallance, J.W.; Siebert, L.; Rose, W.I.; Girón, J.R.; Banks, N.G. Edifice collapse and related hazards in Guatemala. J. Volcanol. Geotherm. Res. 1995, 66, 337–355. [Google Scholar] [CrossRef]
  30. Viera Cepero, F.C. Geomorphology and Natural Hazards of the Samala River Basin, Guatemala; International Institute for Geo-information Science and Earth Observation: Amsterdam, The Netherlands, 2003. [Google Scholar]
  31. Chigna, G.; León, X. Informe Erupción del Volcán Santiaguito (1402–03) 26 Abril 2010; INSIVUMEH: Guatemala City, Guatemala, 2010. [Google Scholar]
  32. Soto, A.J.; Rodhe, A.; Pohjola, V.; Boelhouwers, J. Spatial distribution of disasters caused by natural hazards in the Samala River catchment, Guatemala. Geogr. Ann. Ser. A-Phys. Geogr. 2015, 97, 181–196. [Google Scholar] [CrossRef]
  33. Instituto Nacional de Estadística (INE). Censos Nacionales XI de Población y VI de Habitación 2002 (XI Population and VI Housing National Census 2002); INE: Guatemala City, Guatemala, 2002.
  34. Instituto Nacional de Estadística (INE). Censos Nacionales IX de Población y IV de Habitación 1981 (IX Population and IV Housing National Census 1981); INE: Guatemala City, Guatemala, 1981.
  35. Instituto Nacional de Estadística (INE). Censos Nacionales X de Población y V de Habitación 1994 (X Population and V Housing National Census 1994); INE: Guatemala City, Guatemala, 1994.
  36. NOAA. National Geophysical Data Center, Earth Observation Group. Available online: http://www.ngdc.noaa.gov/eog/dmsp/downloadV4composites.html (accessed on 10 December 2014).
  37. USGS/WWF. HydroSHEDS 2006. Available online: http://hydrosheds.cr.usgs.gov/index.php (accessed on 15 December 2014).
  38. Liu, Q. A Case Study on the Extraction of the Natural Cities from Nightlight Image of the United States of America. Master’s Thesis, University of Gävle, Gävle, Sweden, 2013. [Google Scholar]
  39. UNESCO. Zonificación de Amenazas Naturales en la cuenca del río Samalá y Análisis de vulnerabilidad y riesgo en la población de San Sebastián Retalhuleu, Guatemala. Centro América; UNESCO RAPCA: Guatemala City, Guatemala, 2003. Available online: http://www.itc.nl/external/unesco-rapca/Publicationes%20RAPCA%5CGuatemala%5CZonificacion%20amenaza%20San%20Sebastian%20Guatemala.PDF (accessed on 14 March 2011).
  40. Schumann, G.; Di Baldassarre, G.; Bates, P.D. The utility of spaceborne radar to render flood inundation maps based on multialgorithm ensembles. IEEE Trans. Geosci. Remote Sens. 2009, 47, 2801–2807. [Google Scholar] [CrossRef]
  41. Di Baldassarre, G.; Schumann, G.; Brandimarte, L.; Bates, P. Timely low resolution SAR imagery to support floodplain modelling: A case study review. Surv. Geophys. 2011, 32, 255–269. [Google Scholar] [CrossRef]
  42. Yan, K.; Di Baldassarre, G.; Solomatine, D.P.; Schumann, G.J.-P. A review of low-cost space-borne data for flood modelling: Topography, flood extent and water level. Hydrol. Process. 2015, 29, 3368–3387. [Google Scholar] [CrossRef]

