Abstract
Accurate mapping of land cover on a regional scale is useful for climate and environmental modeling. In this study, we present a novel land cover classification product based on spectral and phenological information for the Xinjiang Uygur Autonomous Region (XUAR) in China. The product is derived at a 500 m spatial resolution using an innovative approach employing moderate resolution imaging spectroradiometer (MODIS) surface reflectance and the enhanced vegetation index (EVI) time series. The classification results capture regional scale land cover patterns and small-scale phenomena. By applying a regionally specified classification scheme, an extensive collection of training data, and regionally tuned data processing, the quality and consistency of the phenological maps are significantly improved. With the ability to provide an updated land cover product considering the heterogenic environmental and climatic conditions, the novel land cover map is valuable for research related to environmental change in this region.
1. Introduction
Land cover (LC) information provides thematic characterizations of the Earth’s surface that indirectly represent the biotic and abiotic properties, which are closely related to the ecological condition of land areas [1]. As surface properties affect the biosphere–atmosphere interaction, accurate LC information is required to evaluate the effect of LC changes on the environment [2]. Additionally, land cover changes are among the most important agents of environmental change at the local to global scales, and have significant implications on the health of the ecosystem and on sustainable land management [3,4]. Land cover products are available at different spatial resolutions, ranging from 300 m to 1 km at the global scale. Since the 1990s, large-scale land cover mapping based on satellite data has become possible using datasets derived from the Advanced Very High Resolution Radiometer (AVHRR) [5,6]. With the emergence of newer medium resolution remote sensing data sources (e.g., moderate resolution imaging spectroradiometer (MODIS), SPOT VEGETATION, and MERIS), global land cover data with a higher level of detail have been developed. The current generation of global land cover products includes the GLC2000 product generated from SPOT VEGETATION [7], the MODIS Collection 5 Land Cover Product [8], and the GlobCover product produced using data from MERIS [9]. Despite the availability of these various global land cover products, the problem of uncertainty and comparability of these products remains [10]. For example, comparisons have been undertaken between global land cover datasets [11–13] or between global and specific regional products [14,15] based on the prior harmonization of different products. Agreements can be achieved for very clearly defined classes and, typically, for homogenous areas [11], whereas heterogeneous landscapes and transition zones have been reported to be major challenges when utilizing medium resolution land cover data [12,16–18]. For many regions, the overall relative quality of the existing products is not well known and has not been investigated in depth.
The Xinjiang Uygur Autonomous Region (XUAR) covers an extensive area of 1,660,000 km2, which is more than one sixth of China’s territory. As the largest autonomous region in China, the XUAR contains a large proportion of the country’s arid area. Since 1978, an unprecedented combination of economic reforms, exploration of natural resources, and population growth have led to a dramatic transformation of land cover across the XUAR [19]. As mass data (more than one hundred Landsat scenes) processing is required to produce a land cover product for the entire XUAR, previous studies have focused primarily on subsets of the overall area. For example, land cover and land-use dynamics have been mapped using satellite images for selected oases in the XUAR [20–22]. Studies on land cover mapping throughout the XUAR are still lacking.
To satisfy the requirement of accurate land cover mapping in the XUAR, the primary objective of this study was to develop a product covering the entire region. Before processing novel data for the XUAR, we compared seven existing land cover maps of the XUAR extracted from existing regional and global products. Therefore, we harmonized these datasets, based on the well-known Land Cover Classification System (LCCS) [11]. We then developed a classification scheme to generate a novel land cover map at a 500 m resolution, covering the entire XUAR for the year 2010. Using the scheme and reference data, the classification was performed using the TWOPAC (Twinned Object- and Pixel-based Automated classification Chain) classification software [23], employing a C5.0 decision tree algorithm built on a time series featuring phenological metrics derived from annual enhanced vegetation index (EVI) data. Finally, the quality of the product was quantitatively and qualitatively evaluated and elucidated.
2. Study Area
The topography and climate of the XUAR are presented in Figure 1. Located in the northwestern part of China, the XUAR is situated far from oceans and other large water bodies and has a variable arid to semi-arid continental climate with a mean annual precipitation of 100–200 mm [19]. The mean July temperature is 27.1 °C, and the mean January temperature is −17.1 °C [19]. Areas within high mountain ranges have a typical mountain climate, which is characterized by long, cold winters and short, hot summers. The northern part of the province is influenced by the Siberian climate. The mountain ranges extend in an east–west direction with most elevations exceeding 3000 m. The Junggar Basin and the Gurbantunggut Desert lies between the Altay and Tianshan Mountains. The Tarim Basin and the Taklamakan Desert are situated between the Tianshan and Kunlun Mountains. The XUAR is primarily covered by grassland and sandy desert [21]. Forest areas are sparsely scattered within the high mountains and along the rivers. Oasis landscapes ranging from small to moderate in size (0.01∼15,000 km2) have developed within inland river deltas, alluvial–diluvial plains, and along the edges of diluvial–alluvial fans. Agricultural land and human settlements are distributed around these oases.
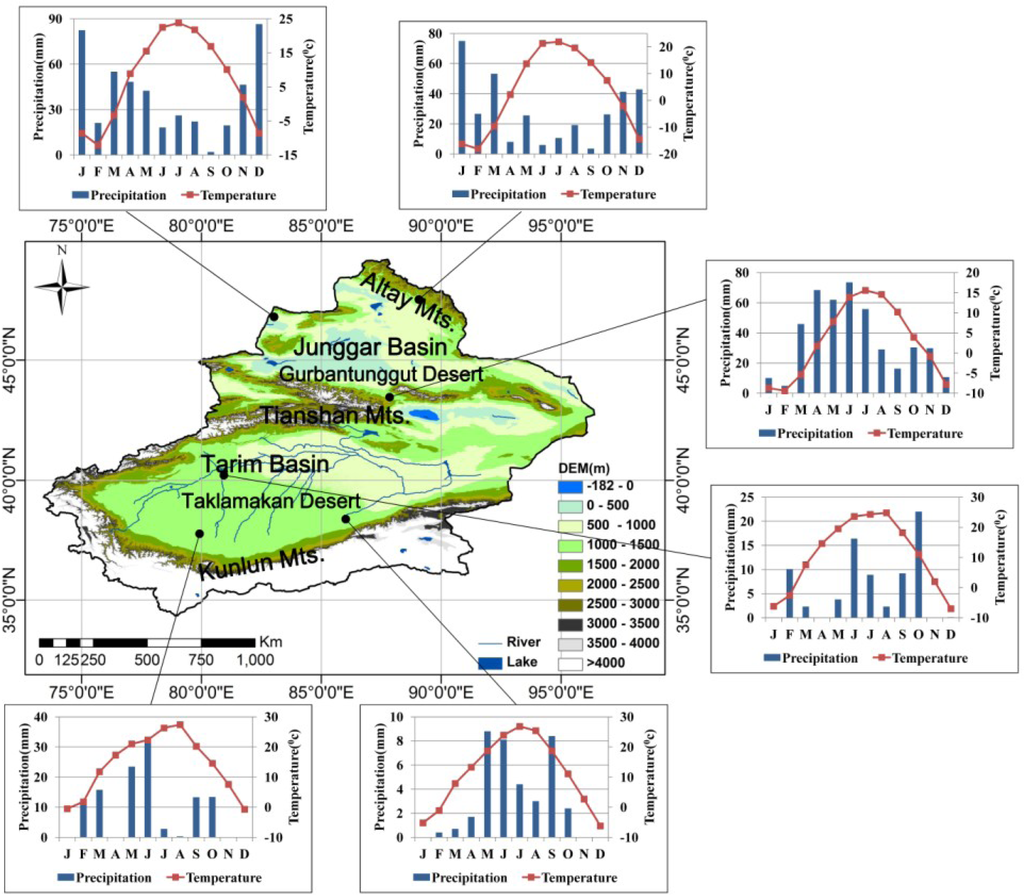
Figure 1.
The Xinjiang Uygur Autonomous Region (XUAR) with its geographic units, elevation zones, and typical climatic regimes. The monthly mean temperature and the monthly mean precipitation records at each metrological site from January to December, 2010, were obtained from the National Meteorological Information Center (NMIC) of China, and are shown for the climate charts.
3. The Requirement for a Novel Land Cover Product over the XUAR
In our study, seven land cover maps from existing regional and global products for the XUAR were compared. These maps are as follows:
- UMD 1992/93—University of Maryland Global Land Cover Product [24]
- GLC 2000—Global Land Cover [25,26]
- Landuse2000 [27]
- MODIS Land Cover MCD12Q1 2001 [8]
- GlobCover 2004/2006 [9]
- GlobCover 2009 [28]
- MODIS Land Cover MCD12Q1 2009 [8]
The product characteristics of these datasets are presented in Table 1. The products at differing spatial resolutions varying from 300 m to 1 km were derived from different sensors, such as AVHRR, SPOT-4, MERIS, MODIS, and Landsat TM. The products are characterized by a varying number of land cover classes and represent the land cover at different points in time. We re-projected these datasets to a geographic projection (lat/long) as the common reference.

Table 1.
Characteristics of the land cover datasets covering the Xinjiang Uygur Autonomous Region (XUAR).
To compare the products, the land cover classes of the individual products were translated to a harmonized legend, which was performed following Herold et al. [11] and the GOFC-GOLD Report No. 43. According to Table 1 [29–33], the selected products are characterized by 14 to 25 land cover classes, which must be translated into 13 classes, as determined by the LCCS. This scheme is based on a general agreement of the UN Land Cover Classification System [1], which provides a common land cover language for building land cover legends and translating and comparing existing legends. The LCCS defines classifiers rather than categories, thus, standardizing the terminology and the attributes used to define the thematic classes in the maps [34]. Table 2 lists the generalized global land cover legend with the LCCS definitions and the corresponding classes from the individual global legends.
Table 2.
Generalized global land cover legend with the Land Cover Classification System (LCCS) definitions.
Figure 2 presents a visual comparison of the seven harmonized land cover maps for the XUAR. Discrepancies among the harmonized products are clear, based solely on a visual comparison. Barren lands dominate the study area for all of the datasets. Large water bodies can be consistently identified in the seven products. Most disagreements occur in the class assignments of the vegetation types. For example, the UMD product has an obvious overestimation of shrub lands where barren lands are distributed [21]. Although within these products vast areas of herbaceous vegetation were detected in the middle of the XUAR, only a small part was classified, for example, within the GlobCover data set. In addition, the area of forest coverage shows a large discrepancy among the seven products.
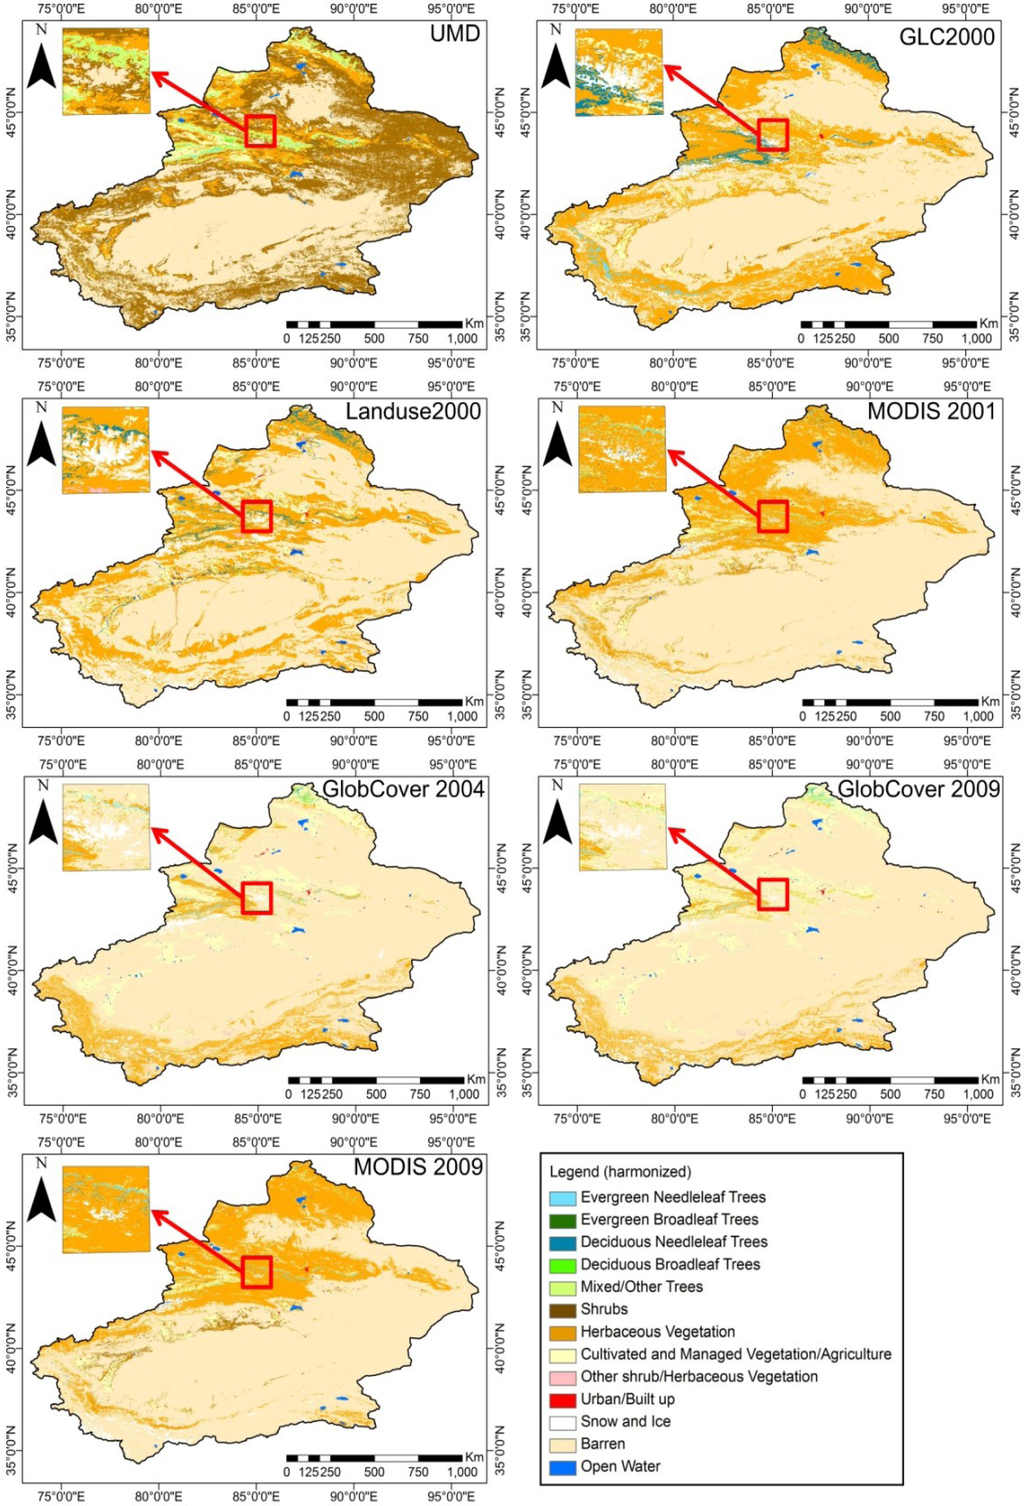
Figure 2.
Comparison of seven of the available land cover products covering the XUAR (LCCS harmonized).
A comparison was performed to identify the level of agreement between each 1 km2 pixel in the seven datasets using the LCCS. Seven levels of agreement were calculated as follows:
- No agreement—pixels containing different LCCS classes in each dataset;
- Level 2 to level 6 agreement—pixels in which two to six of the seven datasets are in agreement, respectively;
- Full agreement—pixels in which all of the seven datasets were in agreement.
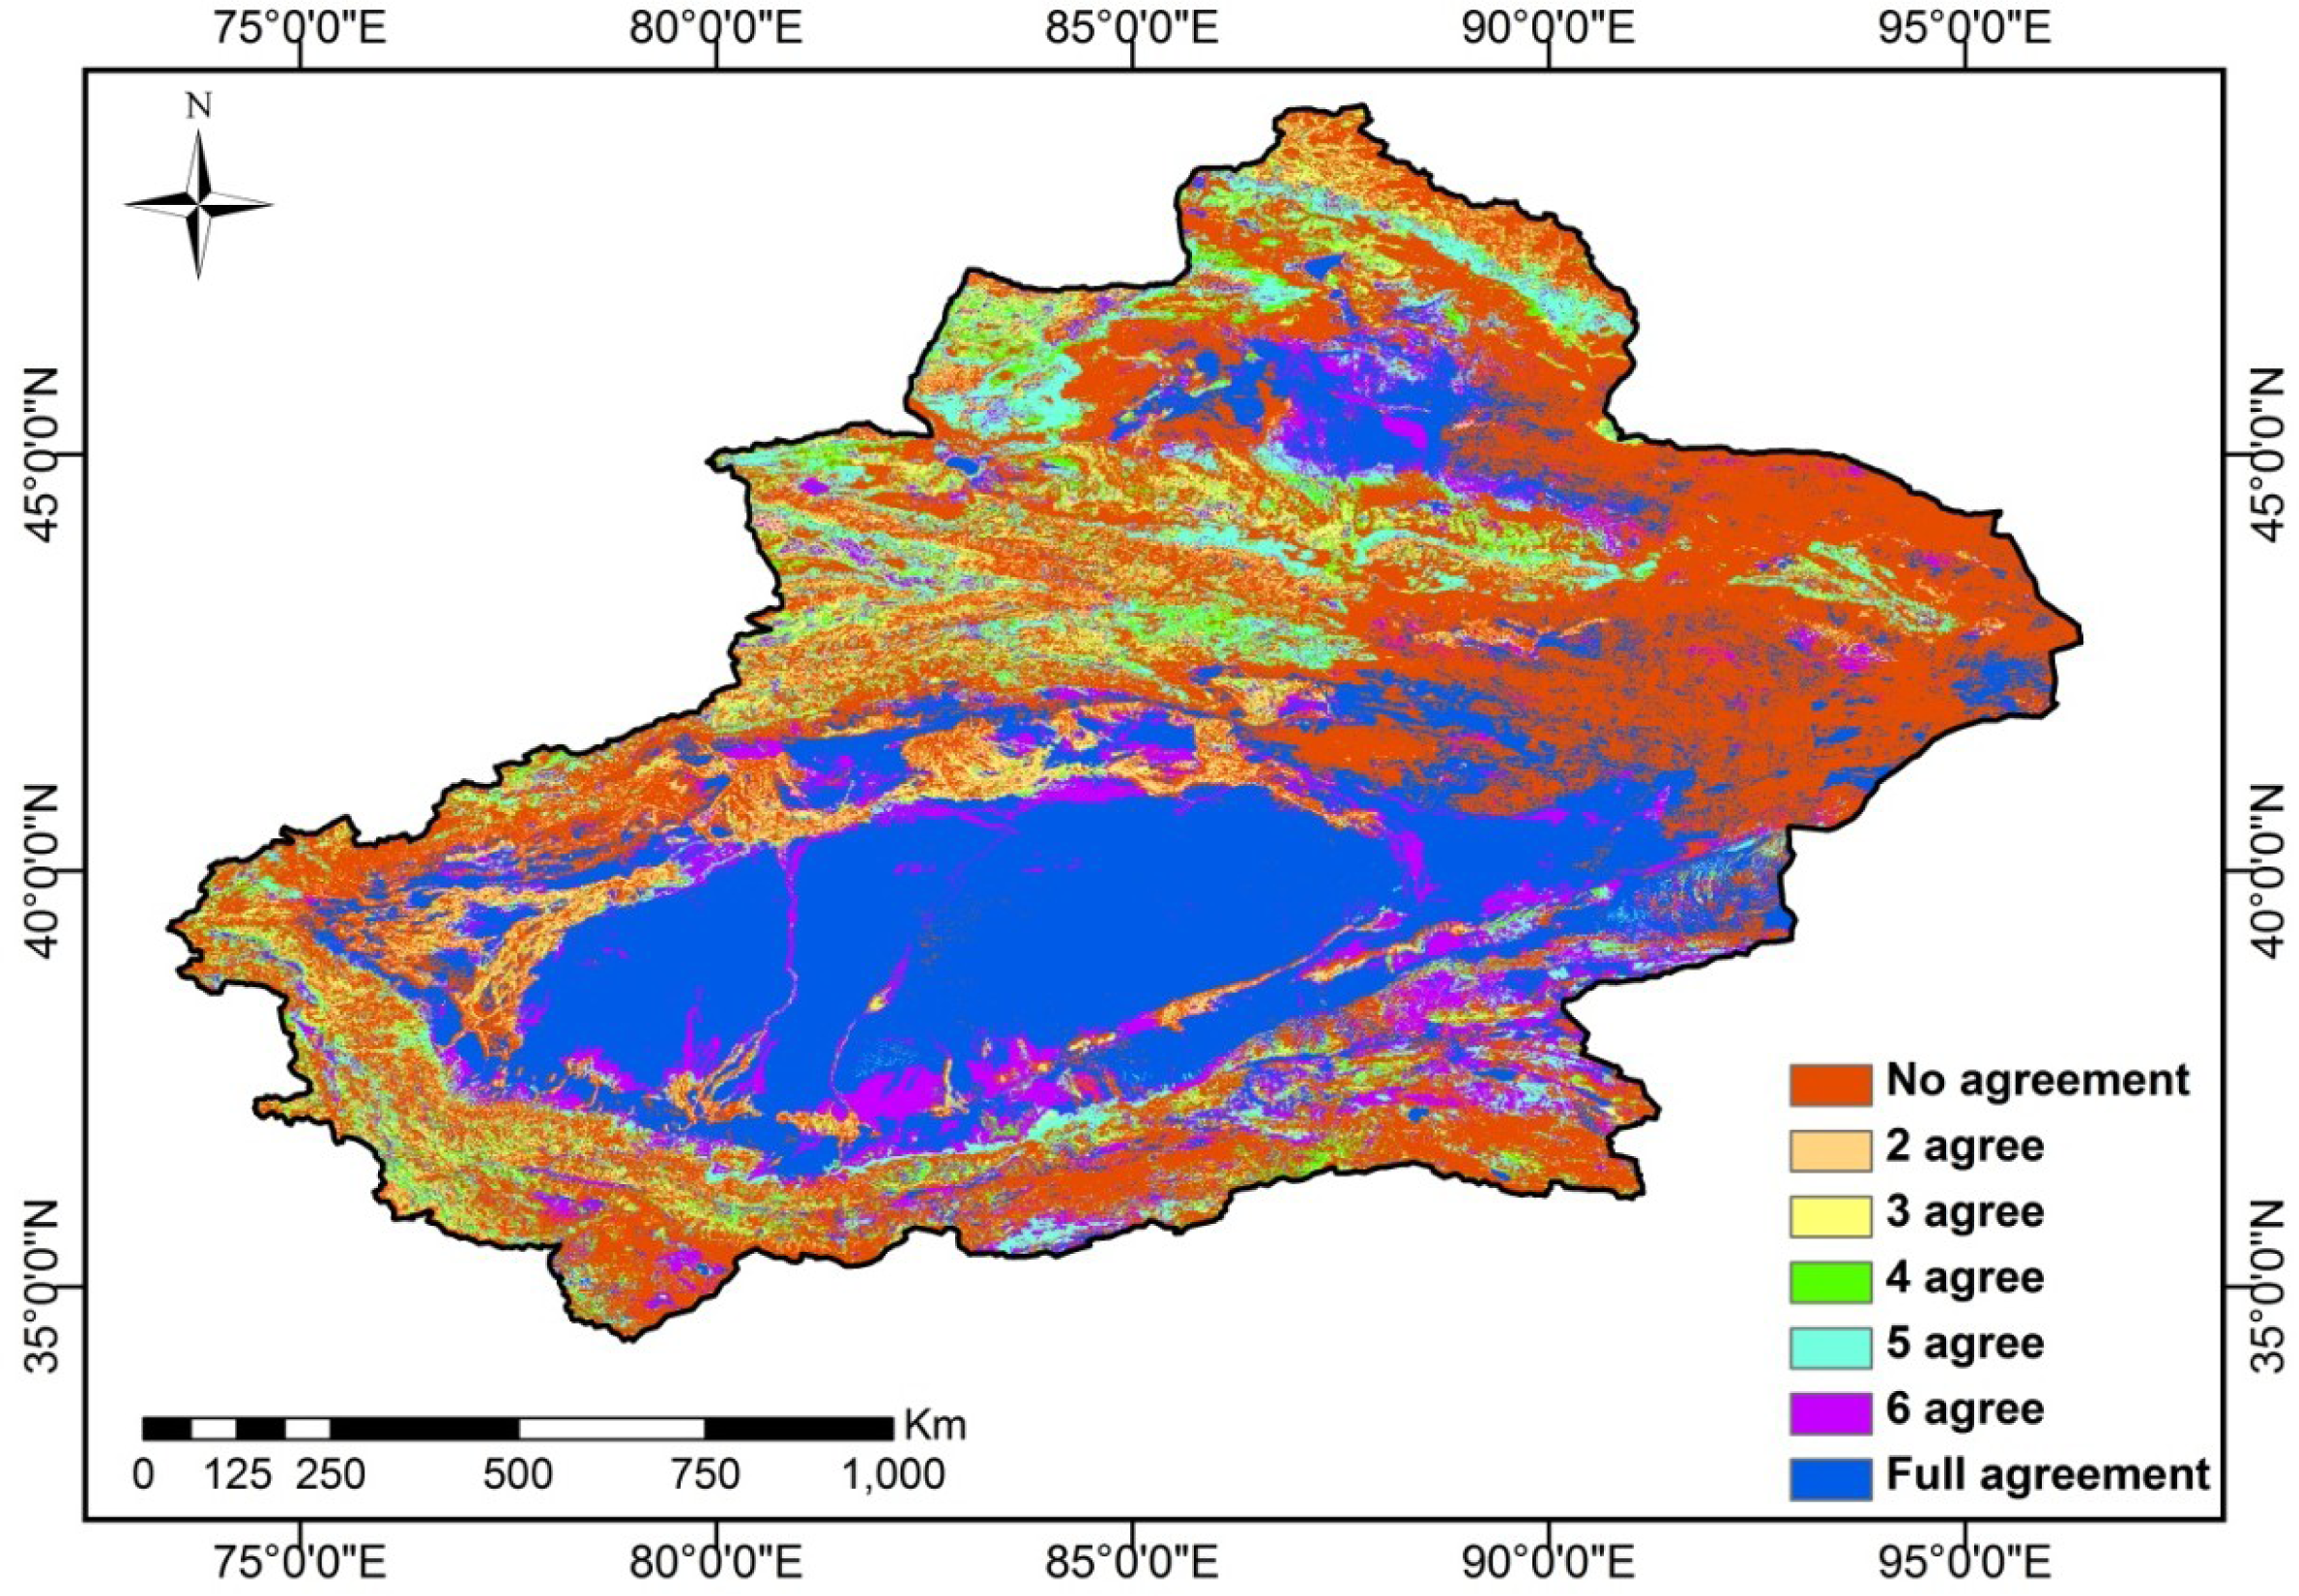
According to the levels of agreement in Figure 3, full agreements were obtained for the vast desert areas. Full or level six agreements were achieved for most of the water bodies. In the marginal area of deserts and in the transition zones between deserts and mountain ranges, partial agreement occurred. Most disagreements exist in the mountainous areas of the Kunlun Mountain and in the barren land area around the eastern part of the Tianshan Mountain.

Figure 3.
Levels of agreement among seven of the available land cover products covering the XUAR, classified according to the LCCS.
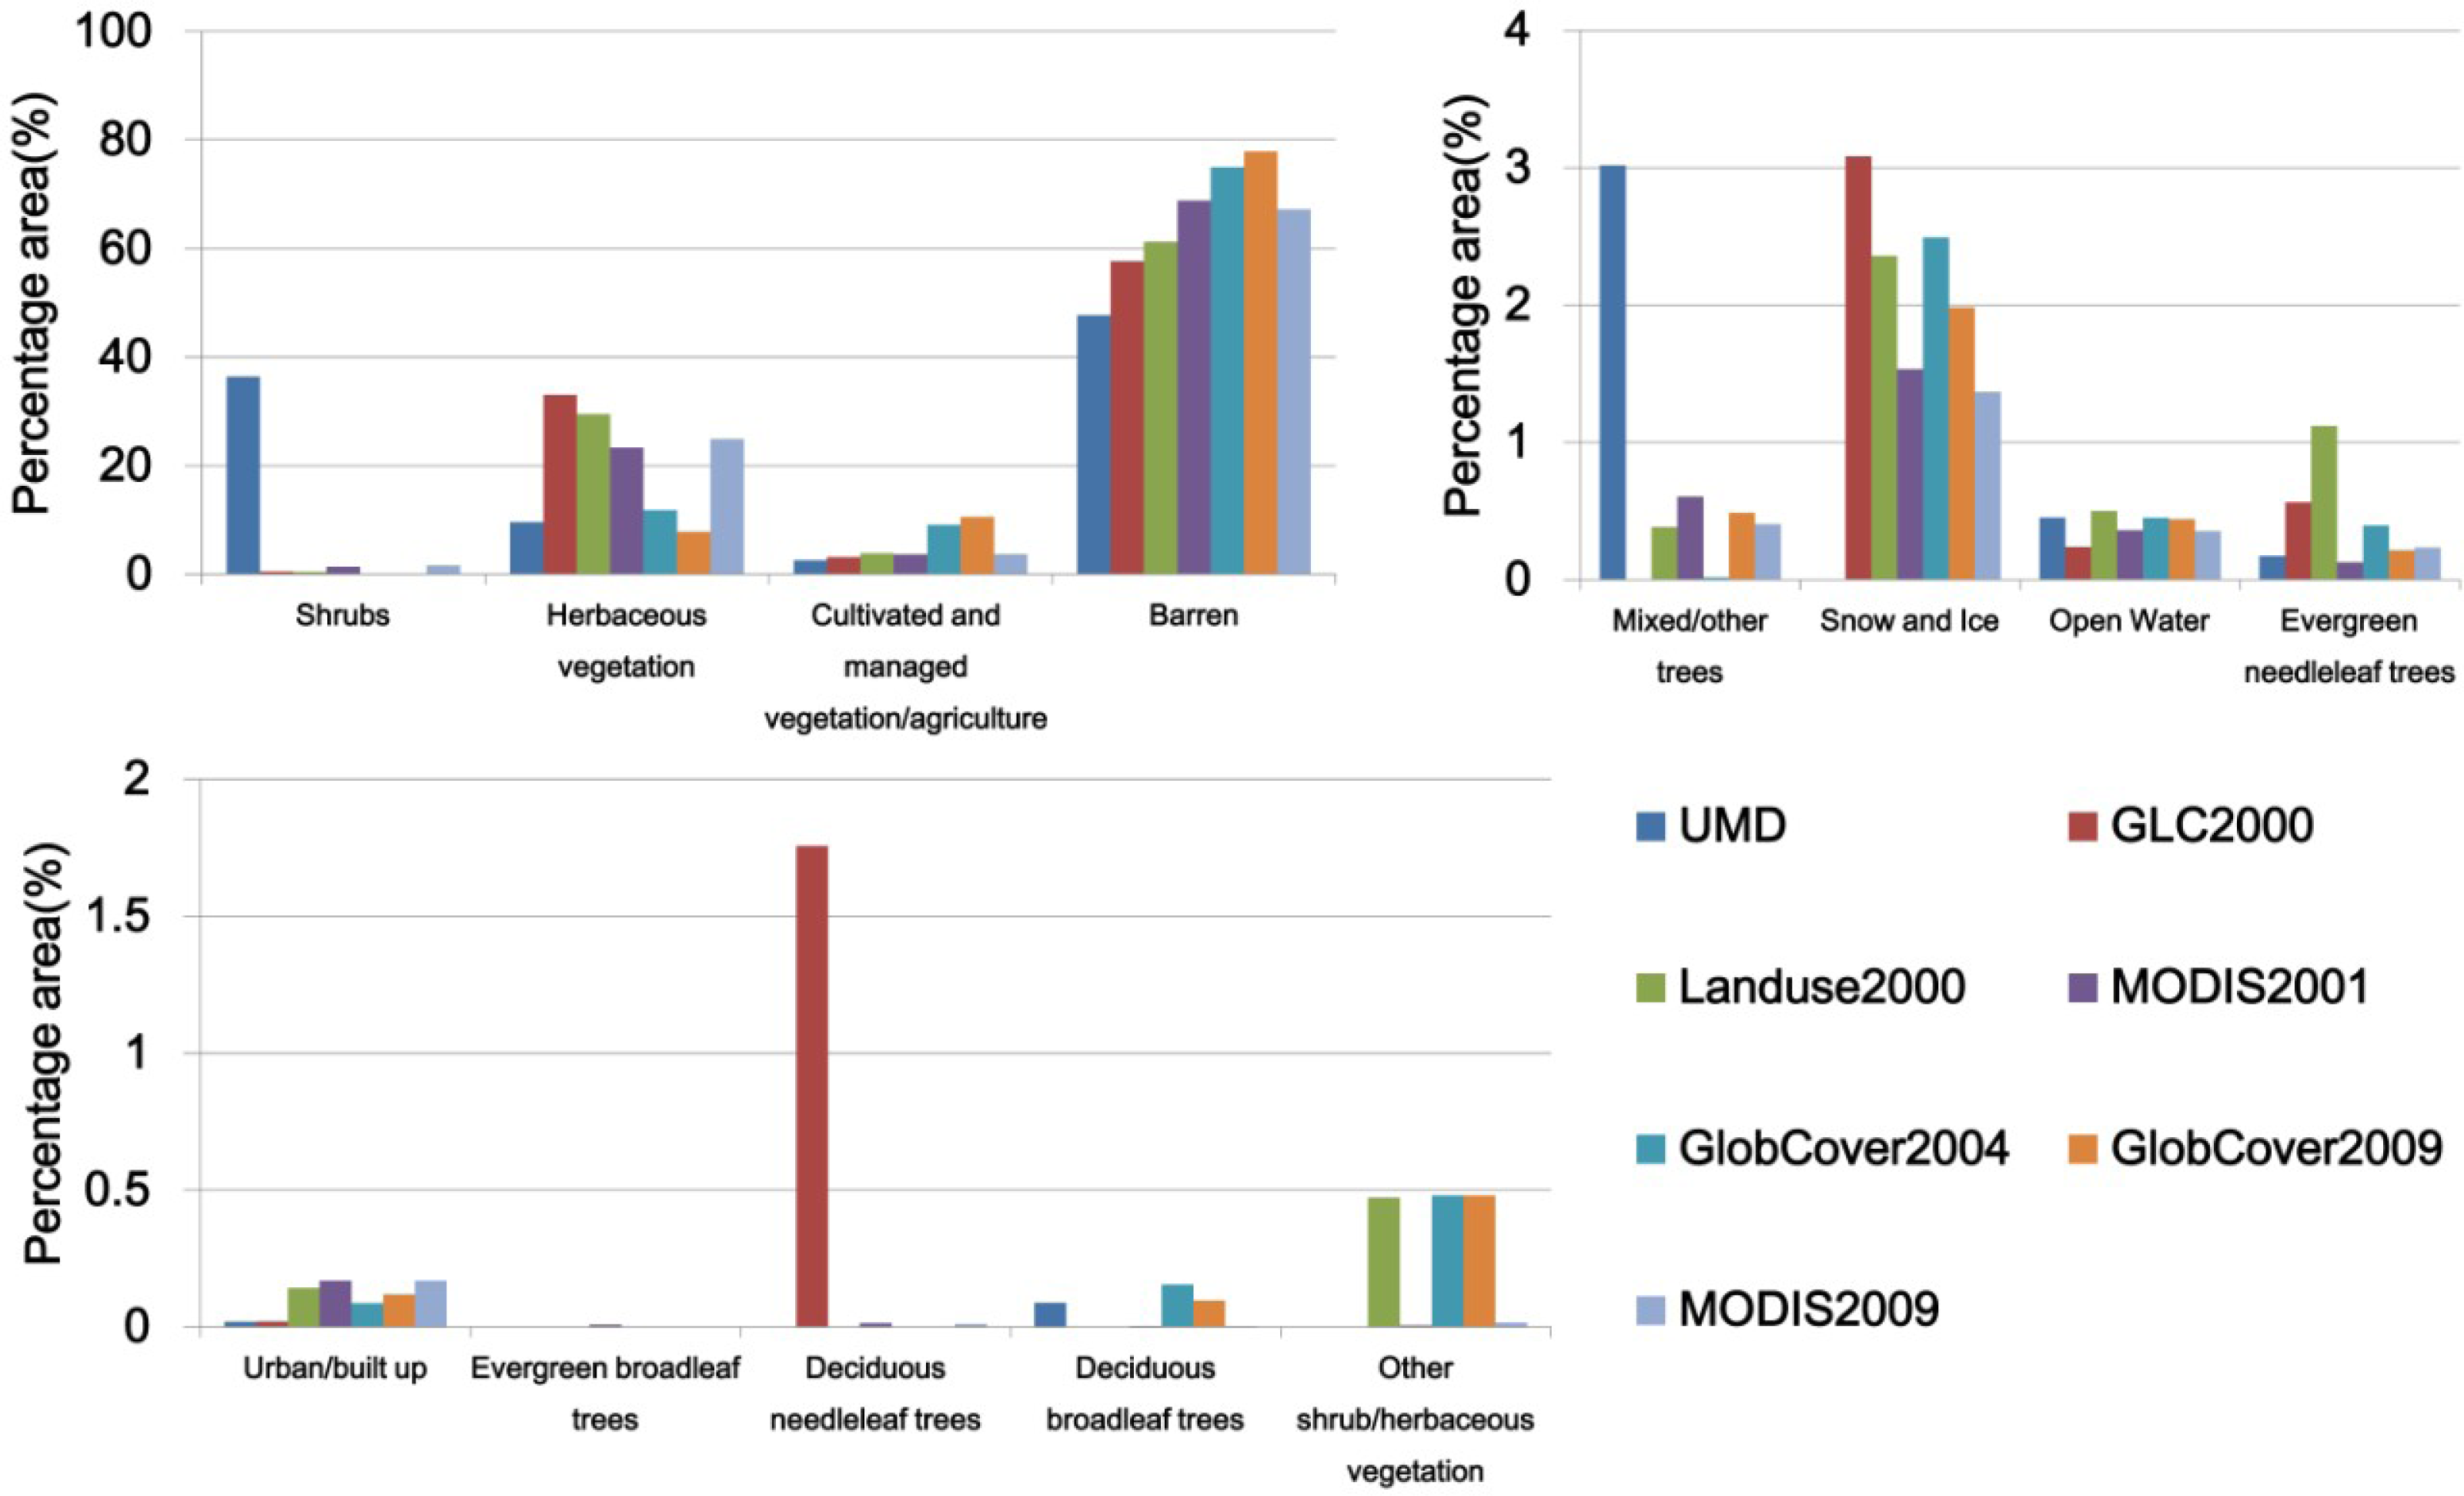
To quantitatively analyze the differences, the percentage areas for the 13 LCCS classes were calculated, and they are illustrated in Figure 4. Evergreen broadleaf trees can be neglected for the comparison because they occupy a very small percentage of the total area. There is reasonable agreement across the datasets for barren land, herbaceous vegetation, open water, built-up areas, snow and ice, and croplands. Disagreements were primarily found for vegetation types, including shrubs, mixed trees, deciduous trees, and other vegetation. According to the statistical data [35], the agricultural area of the XUAR at the end of 2008 was 41,245 km2, covering 2.48% of the entire area. The percentage area of the UMD product was closest to the statistical data (2.57%), and all of the other 6 products overestimated the area of the agricultural lands (3.4%∼10.54%). The urban area in 2010 was 838 km2, covering 0.05% of the entire area [35]. The UMD and GLC2000 products underestimated the built-up area (0.019%), and the other four products showed overestimations (0.08%∼0.17%).
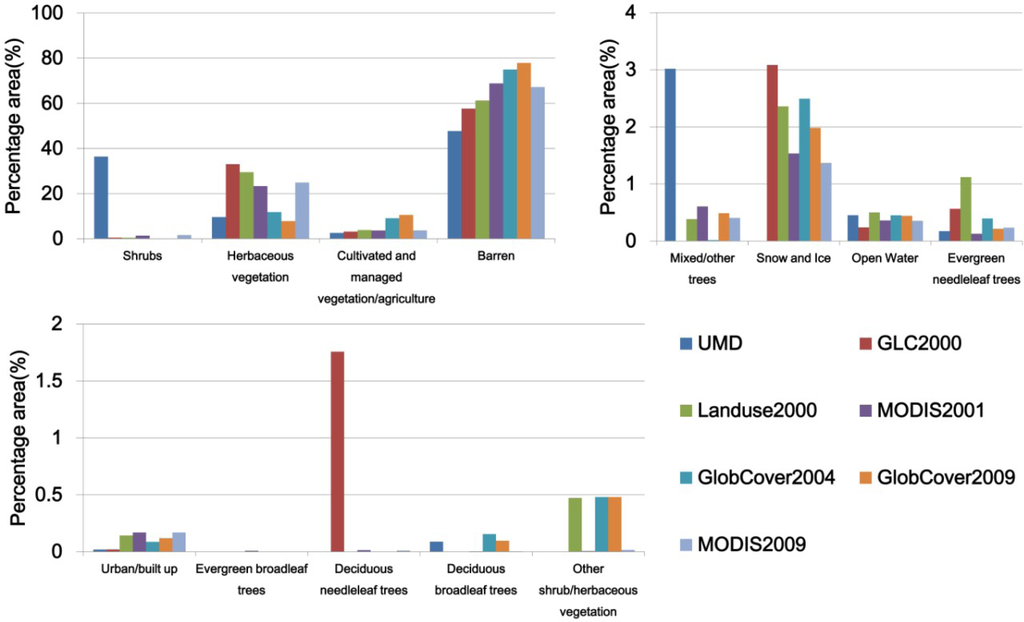
Figure 4.
Percentage area comparison of the LCCS land cover classes among seven available land cover products covering the XUAR.
The Manas River Basin was selected as a test site for the local comparison and detailed analyses. Figure 5 presents the seven harmonized products in greater detail for this test site. The Manas River watershed in the Xinjiang Province is a typical inland watershed in an arid area. Over the past 50 years, the population of this river basin increased from 59,000 in 1949 to 1,109,000 in 2004, which has led to intensive changes in land use, including farmland enlargement and urbanization [20,36]. The grasslands were detected in the MODIS data, whereas they were classified as shrub land in the UMD product and as croplands in the GlobCover data. The built-up area was not discernible in the GLC2000 data. The forest types differ significantly in the seven products. The area of snow and ice is smaller in the MODIS product compared with the other data. A temporal assessment and reasoning can be performed based on Figure 5. Although the data from the GlobCover 2009 and the MODIS land cover type product from 2009 were generated from the same year, the differences between the two products are significant. GlobCover 2009 displays a significantly larger areal coverage with cultivated agricultural land than the MODIS2009 product.
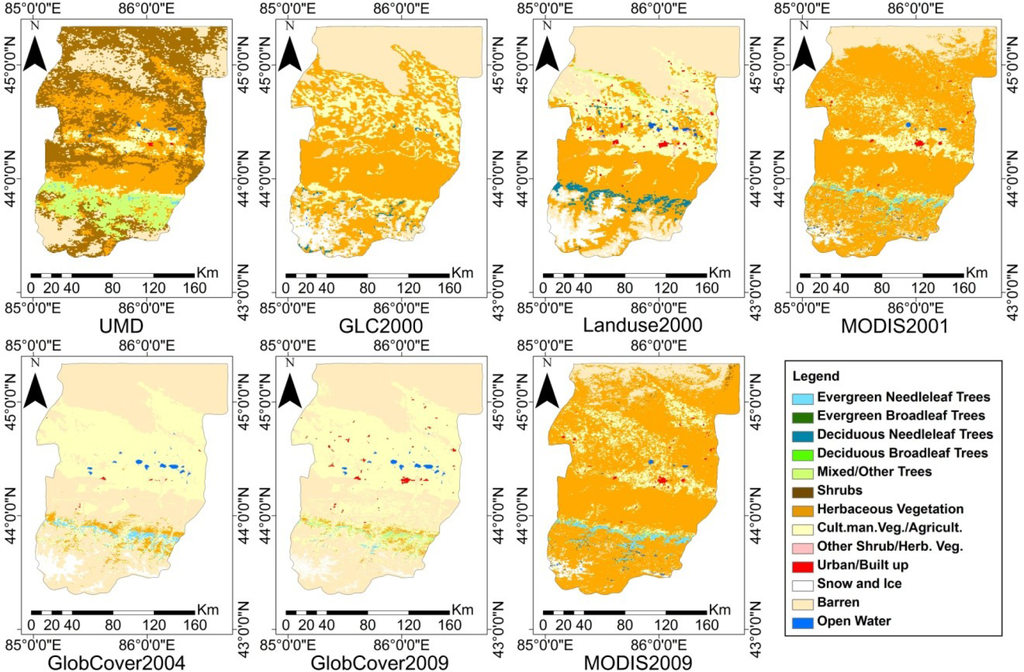
Figure 5.
Comparison of land cover maps extracted from seven of the available land cover products (LCCS harmonized) for the Manas River Basin of the XUAR.
The land cover products vary in the production algorithm, data resolution, and time of data acquisition, and these factors are responsible for the disagreements. The complex topography in the mountainous area may also lead to data noise and misclassification. The disagreements found globally and at the test site, across the seven datasets, indicate that users should review the global datasets before employing them in regional studies. The integration of the LC products with low accuracies into predictive models (hydrologic modeling, biomass modeling, climate change predictions, etc.) may have a devastating effect with respect to statements on future perspectives of an area.
4. Classification Approach
4.1. Classification Scheme
Based on the LCCS of the FAO of the United Nations, a hierarchical classification scheme (Figure 6) was developed specifically for the XUAR and was applied in this study [34].
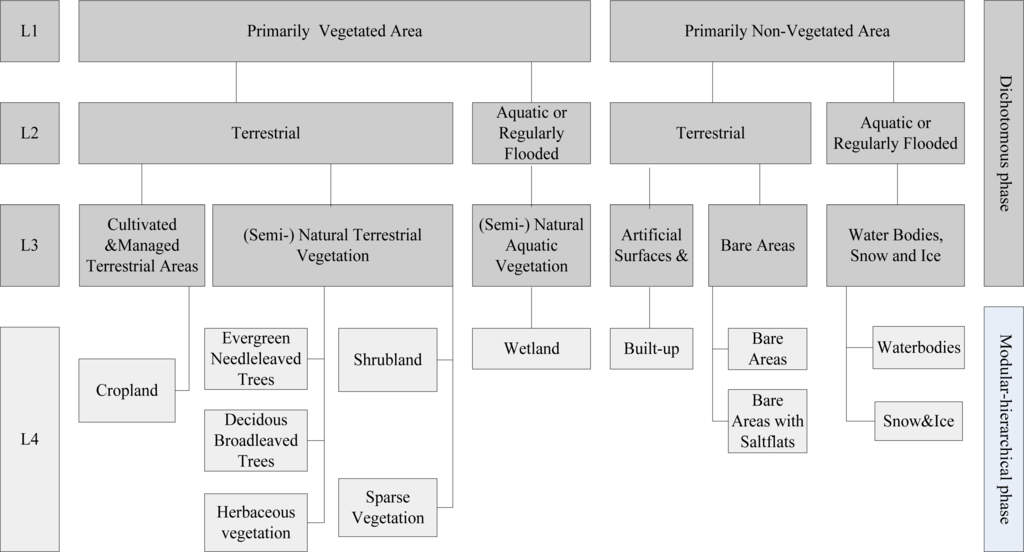
Figure 6.
Land cover classification scheme for the XUAR based on the LCCS standards.
The presented classification scheme with its 12 classes follows the international LCCS standards with clear and systematic definitions of each land cover class, providing internal consistency. All of the classes are clearly defined by unique labels, which were derived based on the LCCS software [34]. Table 3 provides descriptions of all of the classes of the introduced classification scheme, the unique class dichotomous codes and the associated class short names. Each label (dichotomous code) involves the specific class construction and a detailed description concerning the life form, canopy coverage, and predominant land use.
Table 3.
Land cover class description for the XUAR classification.
4.2. Methodology
The classification workflow consists of several steps, as shown in Figure 7. The MODIS data were preprocessed and ingested into an automatically self-generated decision tree classifier. The reference data used as training samples to build the decision tree were manually collected by visual interpreters. Furthermore, a large number of validation samples were collected for a subsequent accuracy assessment. After a post-classification processing of the automated classified image, the final land cover map was generated.
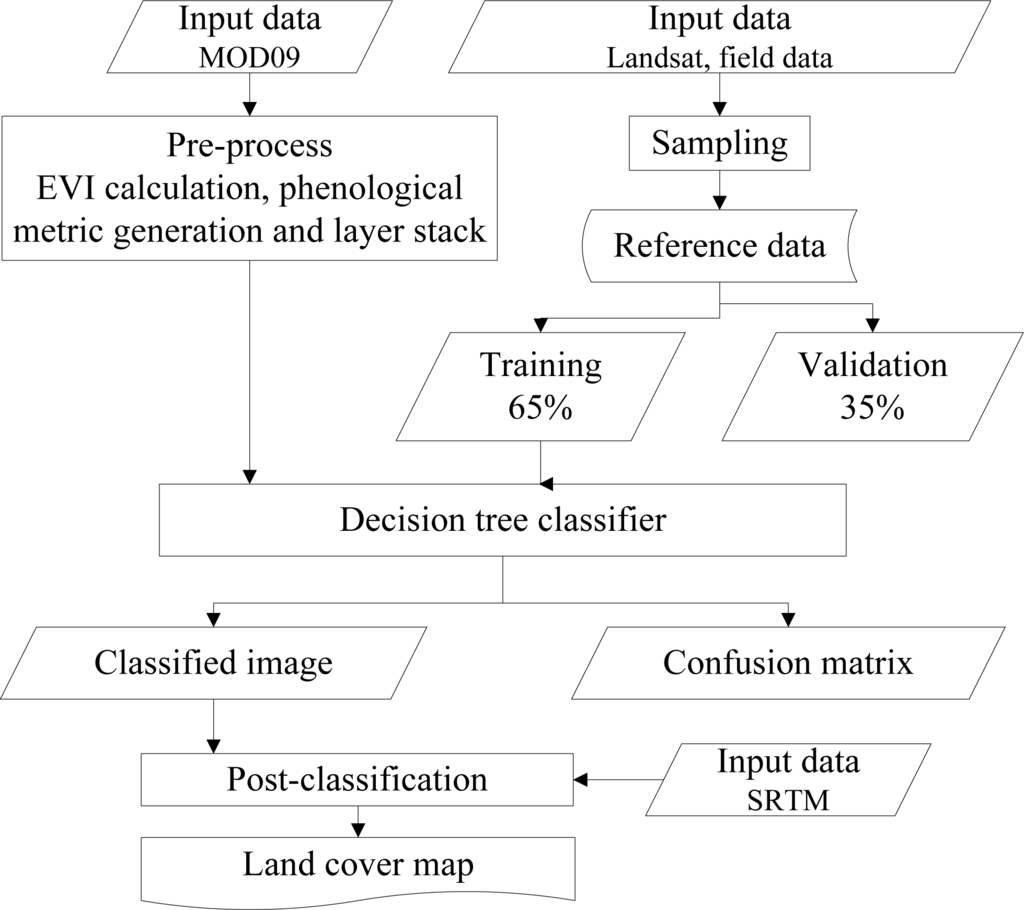
Figure 7.
Classification workflow applied in this study [23,37].
4.2.1. C5.0 Based Decision Tree Classification
The classification methodology is based on a C5.0 decision tree algorithm, which belongs to the supervised machine learning algorithms [38,39]. The C5.0 classifier is an empirical learning system that uses training samples with known labels to extract informative patterns. The extracted patterns are assembled into a tree-structured classifier, which is subsequently used to classify unseen cases [38]. A C5.0 classifier can be expressed as a decision tree or as a set of simple if-then rules (ruleset). The TWOPAC software was used to implement the C5.0 classification process [23].
4.2.2. Input Data
The input data for the classification are composed of spectral and temporal information derived from a one-year time-series (2010) of MODIS EVI and reflectance of the red and near-infrared channels, all at a spatial resolution of 500 m. The EVI time-series was calculated from the MODIS Surface-Reflectance Product (MOD 09A1), which is available in 8-day composites. For these time series (46 time steps of MOD09A1), phenological metrics were derived as descriptive statistics for temporal sections of the time-series. Four temporal sections were defined, namely the winter/spring section from January to March (before the growing season), the summer section from April to September (the growing season), the autumn/winter section from October to December (after the growing season), and the full annual cycle from January to December.
For each of the temporal sections, the median, minimum, maximum, and amplitude values of the EVI, red and near-infrared reflectances were calculated, resulting in 48 metrics. For all of the calculations, all of the observations labeled as cloudy or adjacent to clouds were removed. Six metrics were excluded from further processing due to their high correlation with the others, resulting in a total number of 42 MODIS metrics, which were finally used as features in the classification process.
4.2.3. Training and Validation Data Collection
The selection of reference data for training and validation is primarily a manual process. A reference sample is defined as a polygon with a minimum size of at least nine MODIS pixels. The polygons must be spatially homogeneous and characterized by one land cover type. For training sample generation, 17 Landsat images were acquired during May and June of 2010. The images were equally distributed over the study area and included all of the classes defined in the classification scheme. Suitable polygons were manually selected and assigned to the appropriate land cover class from the Landsat images and based on additional reference information gathered from a high-resolution satellite image and field data (Figure 8). For each of the 12 classes, at least 10 evenly distributed polygons were collected for each Landsat scene.
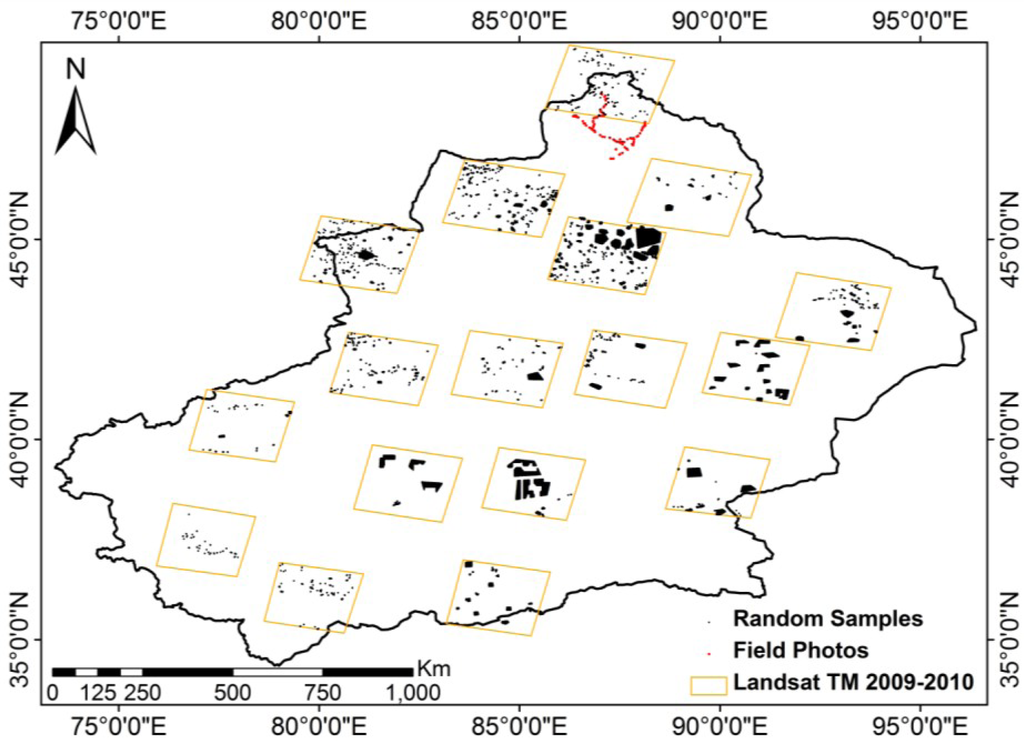
Figure 8.
Footprint of the reference data and validation samples.
The final reference dataset included 26,000 training samples (500 m × 500 m), approximating 6500 km2 or 0.5% of the XUAR. Compared with the MODIS Global Land Cover with 14,136 pixels for all of Asia [8], this reference dataset was more comprehensive. For the classification itself, two thirds of the reference dataset was used as training data, whereas the other third was employed for validation of the result.
4.2.4. Post Classification
To improve the classification results of certain spectral-temporal ambiguous classes, we applied several post-classification steps. The digital elevation model SRTM with a spatial resolution of 90 m over the XUAR was rescaled to the size of the MODIS pixels to enable spatial homogeneity because a DEM is a helpful layer to decrease misclassifications between spectrally ambiguous classes. For example, the class “ice and snow” has similar spectral features to “bare areas with salt flats”. Bare lands with salt flats or saline lands are primarily distributed in diluvial-alluvial plains in front of the Kunlun and Tianshan Mountains, the alluvial plain and the delta of large rivers where the altitude is lower than 1000 m [40,41]. Therefore, we reclassified the “bare areas with salt flats” pixels higher than 1000 m to “ice and snow”. According to Han et al., irrigated cultivated lands distributed in the oasis plains along the middle and lower reaches of the inland rivers support 95% of the population of the XUAR [42]. We assumed that crop growing is limited at heights above 2000 m in the XUAR due to climate conditions. Therefore, we reclassified “cropland” pixels higher than 2000 m as “grassland”.
5. Results
5.1. Land Cover Classification Map
Figure 9 shows the classification map generated with the MODIS time-series, which we will refer to as the “XUAR Landcover 2010” product. The classification map shows the extent and distribution of the different land cover types for the year 2010 over the XUAR. The Tianshan and Altay Mountains are primarily classified as grassland, ice and snow, and evergreen forest. The Kunlun Mountain is primarily characterized by bare land, grassland, and snow because the scarce precipitation hinders the growth of forests. Bareland extends over the Gurbantunggut and Taklamakan Deserts. Grassland and sparse vegetation spread along the transition zone between the mountains and deserts. Agricultural lands and built-up areas are primarily distributed close to river oases. Deciduous forests are distributed along rivers, and salty lands are distributed around lakes and rivers.
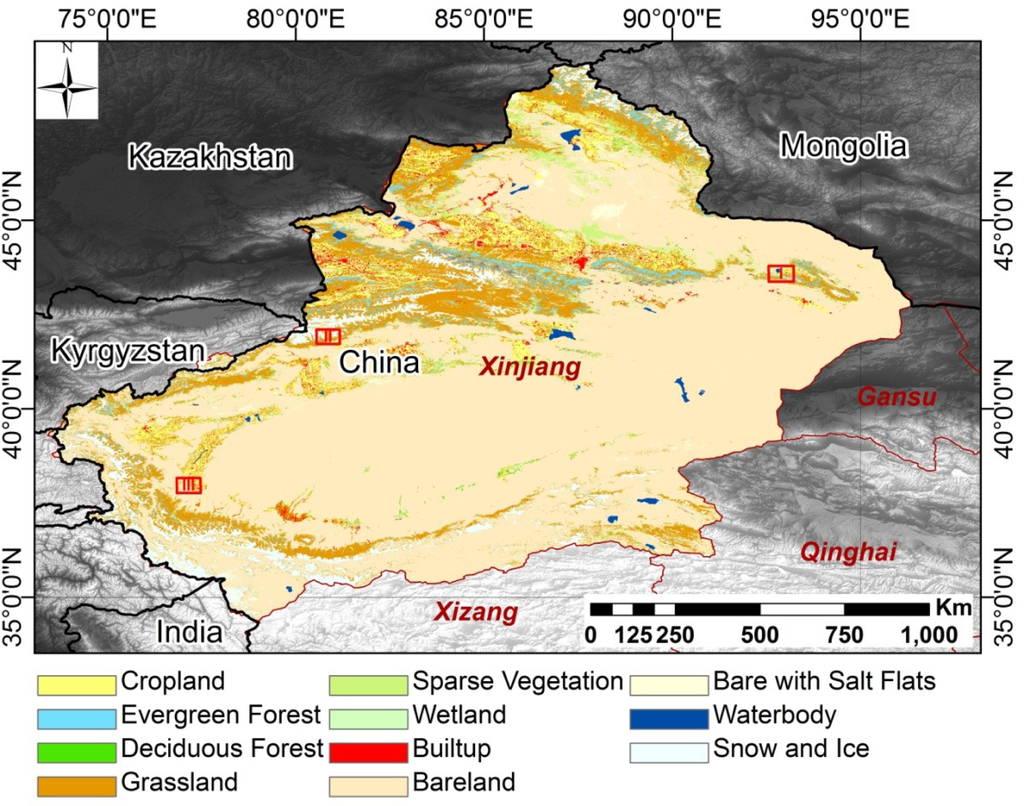
Figure 9.
Land cover classification result for the XUAR derived from a MODIS EVI time series for 2010. The three subsets marked with red rectangles were selected for a closer observation (see Figure 10), and the 90 m SRTM data were shown as the background of the study area.
Figure 10 shows three subsets within the XUAR, with locations indicated in Figure 9. For each subset, a Landsat TM scene (a) and the classification map (b) are presented. Plot I is located in the northeast of the XUAR in the grassland between the Junggar Basin and the eastern Tianshan Mountains. The Tianshan Mountains in this area are characterized by extensive areas of evergreen forest and grassland with certain bare regions and snow and ice occurring in high elevation areas. The classification map (Ia) correctly differentiated the distribution of evergreen forests and grasslands. The area of soil salinization is also discernible around the lake. The second subset covers a large area of the western Tianshan Mountains. The mountainous area is primarily covered by large areas of snow and ice in the higher regions. Forests and grasslands are distributed in the middle and lower elevation zones of the mountain range. The third plot is a typical oasis located near the southern range of the Taklamakan Desert and to the north of the Kunlun Mountains and is characterized by highly managed agricultural lands in the river plain. The built-up areas with varying sizes are differentiated from croplands in the land cover map (IIIc).
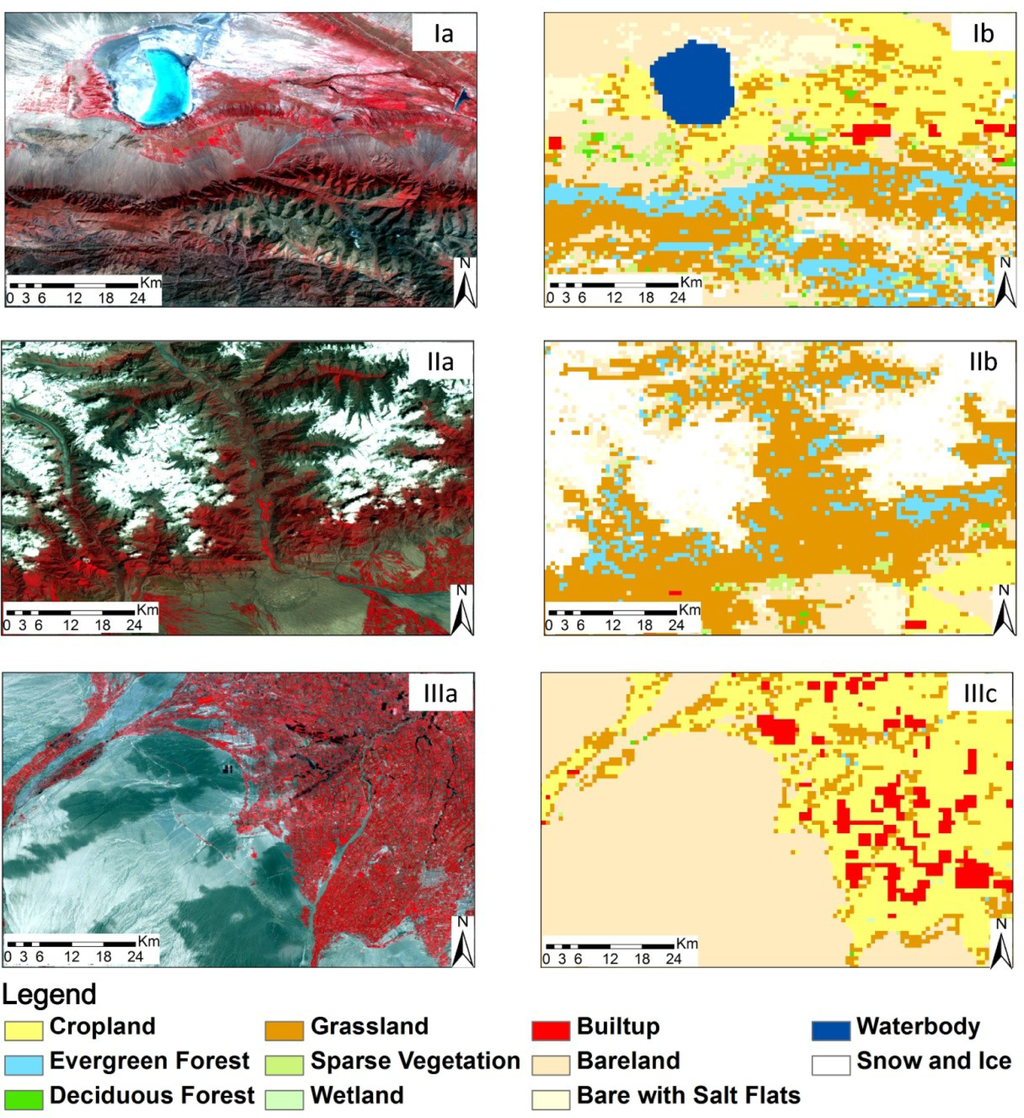
Figure 10.
Comparison of the Landsat imagery (a) with the land cover classification result for the XUAR in 2010 (b) for three different subsets (I–III). The Landsat imagery is displayed as an R(band 4) G(band 3) B(band 2) composite.
5.2. Accuracy Assessment
An accuracy assessment provides information on product quality and identifies possible sources of errors. The compilation of a confusion matrix is a standardized method to represent the accuracy of classification results derived from remote sensing data by calculating accuracy measurements, such as overall accuracy, producer’s accuracy, and user’s accuracy [43]. To evaluate the accuracy of the classification map, we created confusion matrices based on the validation datasets. The validation result is based on a non-overlapping set of samples and is calculated automatically within the TWOPAC classification chain. The results derived from the confusion matrix (Table 4) yield an overall accuracy (OA) of 77.61%. The class “evergreen forest” has a user accuracy of 77.05% due to a certain amount of misclassification with grassland. Deciduous forest areas have an accuracy of 87.5%. In certain cases, the grassland area was mislabeled as forest, cropland, and bare land, thus, achieving a user accuracy of 61.41%. The wetland class was partially misclassified as cropland and grassland and yields a user accuracy of 68.75%. The built-up areas reach an accuracy of 84.62%. High accuracies (>90%) were achieved for “cropland”, “water”, and “snow and ice”. Some of the most affected classes, which were misclassified, were relabeled by the post classification procedure.
Table 4.
Confusion matrices of the XUAR Landcover 2010 before and after post-classification. The bold values are the classification results after post-classification.
The confusion matrix after the post classification step is also shown in Table 4, and an overall accuracy of 79.78% is achieved. After post-classification, the user accuracies of the four land cover types (cropland, grassland, bare with salt and snow and ice) were improved.
6. Discussion
The Xinjiang Uygur Autonomous Region, which spans an area of 1,660,000 km2 and extends for over 1600 km from north to south and 2000 km from east to west, is characterized by a complex topography, with elevations ranging from −192 m to 8028 m, and a unique inland continental location, which results in complex ecosystems. Considering these challenging conditions and the significant disagreements among the existing land cover products analyzed prior to our own product generation, the accuracy of the novel XUAR 2010 land cover map can be considered satisfactory. As illustrated in Figure 9, the land cover distribution differs significantly across the region. According to the State Forestry Administration of China, the desertification area in the XUAR is 1,071,200 km2, constituting 65.24% of its territory [44]. The spatial distribution of the bare land in the XUAR 2010 land cover map agrees with the sandy deserts and desertified lands map produced with visual interpretation of the Landsat images [19]. The large-scale vegetation distribution is also consistent with the ecosystem distribution based on the topographic and climate system of this region [45]. From the plot analysis, the small-scale distribution is also well presented in the land cover product. The comparison of the classification product with the Landsat images in Figure 10 indicates that a distinction can be detected among the land cover classes at a spatial resolution of 500 m per pixel. The application of a regionally specified classification scheme, extensive training data, and regionally tuned data processing have been proven to significantly increase the quality and consistency of the LC maps [46,47].
The 79.78% OA of our XUAR Landcover 2010 map is comparable with the cross-validated MODIS land cover product (OA 75%) [8]. Although the OA of our XUAR Landcover 2010 map is lower than the classification results for small areas, classification with medium resolution images for large areas has been reported as being challenging. For example, Gong et al. have reported their effort to produce 30 m resolution global land cover maps using Landsat TM and ETM+ data, and the highest OA achieved is only 64.89% [48]. Low levels of accuracy primarily exist for spectrally and temporally ambiguous classes. Grasslands of different densities are occasionally confused with other land cover types. High-density grasslands have similar spectral and phenological characteristics to croplands, whereas sparse grasslands may be confused with sparse vegetation and bare lands. Misclassification of land cover types, such as wetland and built-up areas, can be attributed to mixed pixels. Wetland areas are typically a spectral mixture of vegetation and water. Built-up areas are mixed pixels of impervious areas and green areas, which may lead to its confusion with grassland. In addition, the derivation of ambiguous classes covering small areas is difficult at the 500 m resolution of the MODIS sensor.
Despite these misclassifications, which occur with all of the classification results for larger areas, the product retains significant potential because it is currently, according to our knowledge, the best land cover product that exists for this region. The XUAR Landcover 2010 map presented in this study might be a valuable tool for the modeling community, such as in the field of hydrologic modeling, biomass modeling, climate forecasting, or future land use change prediction. Interested scientists are encouraged to contact the authors to receive the novel classification product in a digital format.
Based on the classification approach proposed in this study, LC maps with refined classification schemes can be produced in further studies. For example, various forests and crops can be discriminated based on their different phenological characteristics [49,50]. For the refinement of the final LC product, the MODIS data in 2009 and 2011 can also be included to better characterize phenologies of various vegetation types in the classification process.
7. Conclusions
Accurate land cover mapping on a regional scale in the XUAR is useful for regional climate and environmental modeling. In this study, we evaluated the accuracy of seven global land cover products over the XUAR and found that significant discrepancies exist. Furthermore, the novel XUAR Landcover 2010 product was derived based on an automatic decision tree classification procedure employing the TWOPAC classification software. An extensive MODIS-derived EVI time series was utilized as the input data, covering six MODIS tiles with 46 dates each, which were first preprocessed and then used to extract phenological metrics. After post-processing, including the SRTM digital elevation model and parameters derived thereof, good accuracies of 79.78% for the overall products and accuracies ranging from 22.52% to 99.2% for the individual classes could be attained. For selected areas within the XUAR, we also compared the results with higher resolution Landsat data and found that small-scale types, such as salty lands and the differentiation between deciduous forest and grasslands, can be captured. We consider that the XUAR Landcover 2010 product is a solid input for the modeling community or for future studies on regional land cover change. The novel product in this study can be shared with interested researchers active in the XUAR area.
Acknowledgments
We are grateful to the reviewers and editors for their constructive comments. This research is supported by the National Key Technology R&D Program under Grant No. 2012BAH27B05 and the National Natural Science Foundation of China under Grant No. 41101393.
Author Contributions
Linlin Lu, Claudia Kuenzer and Huadong Guo designed the research parameters; Linlin Lu and Qingting Li performed the research; Tengfei Long and Xinwu Li collected the reference data; and Linlin Lu and Claudia Kuenzer authored the manuscript.
Conflicts of Interest
The authors declare no conflict of interest.
References
- Di Gregorio, A. Land Cover Classification System––Classification Concepts and User Manual for Software Version 2; Food and Agriculture Organization of the United Nations: Rome, Italy, 2005. [Google Scholar]
- Meyer, W.B.; Turner, B.L., II. Human population growth and global land use/land cover change. Ann. Rev. Ecol. Syst 1992, 23, 39–61. [Google Scholar]
- Foley, J.A.; DeFries, R.; Asner, G.P.; Barford, C.; Bonan, G.; Carpenter, S.R.; Chapin, F.S.; Coe, M.T.; Daily, G.C.; Gibbs, H.K.; et al. Global consequences of land use. Science 2005, 309, 570–574. [Google Scholar]
- Lubchenco, J. Entering the century of the environment: A new social contract for science. Science 1998, 279, 491–497. [Google Scholar]
- DeFries, R.; Hansen, M.; Townshend, J. Global discrimination of land cover types from metrics derived from AVHRR pathfinder data. Remote Sens. Environ 1995, 54, 209–222. [Google Scholar]
- Defries, R.S.; Townshend, J.R.G. NDVI-derived land-cover classifications at a global-scale. Int. J. Remote Sens 1994, 15, 3567–3586. [Google Scholar]
- Bartholome, E.; Belward, A.S. GLC2000: A new approach to global land cover mapping from Earth observation data. Int. J. Remote Sens 2005, 26, 1959–1977. [Google Scholar]
- Friedl, M.A.; Sulla-Menashe, D.; Tan, B.; Schneider, A.; Ramankutty, N.; Sibley, A.; Huang, X. MODIS Collection 5 global land cover: Algorithm refinements and characterization of new datasets. Remote Sens. Environ 2010, 114, 168–182. [Google Scholar]
- Arino, O.; Bicheron, P.; Achard, F.; Latham, J.; Witt, R.; Weber, J.L. GLOBCOVER—The Most Detailed Portrait of Earth. In ESA Bulletin Nr, 136; ESA Bulletin-European Space Agency: Rome, Italy, 2008; Volume 136, pp. 24–31. [Google Scholar]
- Verburg, P.H.; Neumann, K.; Nol, L. Challenges in using land use and land cover data for global studies. Glob. Chang. Biol 2011, 17, 974–989. [Google Scholar]
- Herold, M.; Mayaux, P.; Woodcock, C.E.; Baccini, A.; Schmullius, C. Some challenges in global land cover mapping: An assessment of agreement and accuracy in existing 1 Km datasets. Remote Sens. Environ 2008, 112, 2538–2556. [Google Scholar]
- Jung, M.; Henkel, K.; Herold, M.; Churkina, G. Exploiting synergies of global land cover products for carbon cycle modeling. Remote Sens. Environ 2006, 101, 534–553. [Google Scholar]
- Chandra, G.; Zhu, Z.; Reed, B. A comparative analysis of the global land cover 2000 and MODIS land cover data sets. Remote Sens. Environ 2005, 94, 123–132. [Google Scholar]
- Ran, Y.; Li, X.; Lu, L. Evaluation of four remote sensing based land cover products over China. Int. J. Remote Sens 2010, 31, 391–401. [Google Scholar]
- Vuolo, F.; Atzberger, C. Exploiting the classification performance of support vector machines with Multi-Temporal Moderate-Resolution Imaging Spectroradiometer (MODIS) data in areas of agreement and disagreement of existing land cover products. Remote Sens 2012, 4, 3143–3167. [Google Scholar]
- Kuenzer, C.; Leinenkugel, P.; Vollmuth, M.; Dech, S. Comparing global land cover products: An investigation for the trans-boundary Mekong basin. Int. J. Remote Sens 2014, in press. [Google Scholar]
- Pérez-Hoyos, A.; García-Haro, F.J.; San-Miguel-Ayanz, J. Conventional and fuzzy comparisons of large scale land cover products: Application to CORINE, GLC2000, MODIS and GlobCover in Europe. ISPRS J. Photogramm. Remote Sens 2012, 74, 185–201. [Google Scholar]
- Song, X.-P.; Huang, C.; Feng, M.; Sexton, J.O.; Channan, S.; Townshend, J.R. Integrating global land cover products for improved forest cover characterization: An application in North America. Int. J. Digit. Earth 2013. [Google Scholar] [CrossRef]
- Wang, T.; Yan, C.Z.; Song, X.; Xie, J.L. Monitoring recent trends in the area of aeolian desertified land using Landsat images in China’s Xinjiang region. ISPRS J. Photogramm. Remote Sens 2012, 68, 184–190. [Google Scholar]
- Cheng, W.; Zhou, C.; Liu, H.; Zhang, Y.; Jiang, Y.; Zhang, Y.; Yao, Y. The oasis expansion and eco-environment change over the last 50 years in Manas River Valley, Xinjiang. Sci. China Ser. D 2006, 49, 163–175. [Google Scholar]
- Yan, C.Z.; Wang, T.; Han, Z.W.; Qie, Y.F. Surveying sandy deserts and desertified lands in north-western China by remote sensing. Int. J. Remote Sens 2007, 28, 3603–3618. [Google Scholar]
- Buhe, A.; Tsuchiya, K.; Kaneko, M.; Ohtaishi, N.; Halik, M. Land cover of oases and forest in XinJiang, China retrieved from ASTER data. Adv. Space Res 2007, 39, 39–45. [Google Scholar]
- Huth, J.; Kuenzer, C.; Wehrmann, T.; Gebhardt, S.; Tuan, V.Q.; Dech, S. Land cover and land use classification with TWOPAC: Towards automated processing for pixel- and object-based image classification. Remote Sens 2012, 4, 2530–2553. [Google Scholar]
- Hansen, M.C.; Reed, B. A comparison of the IGBP DISCover and university of Maryland 1 Km global land cover products. Int. J. Remote Sens 2000, 21, 1365–1373. [Google Scholar]
- Fritz, S.; Bartholomé, E.; Belward, A.; Hartley, A.; Stibig, H.J.; Eva, H.; Mayaux, P.; Bartalev, S.; Latifovic, R.; Kolmert, S.; et al. Harmonization, Mosaicing and Production of the Global Land Cover 2000 Database (Beta Version); European Commission, Joint Research Centre: Ispra, Italy, 2003; p. 41. [Google Scholar]
- Mayaux, P.; Eva, H.; Gallego, J.; Strahler, A.H.; Herold, M.; Agrawal, S.; Naumov, S.; de Miranda, E.E.; di Bella, C.M.; Ordoyne, C.; et al. Validation of the global land cover 2000 map. IEEE Trans. Geosci. Remote Sens 2006, 44, 1728–1739. [Google Scholar]
- Liu, J.; Liu, M.L.; Tian, H.Q.; Zhuang, D.F.; Zhang, Z.X.; Zhang, W.; Tang, X.M.; Deng, X.Z. Spatial and temporal patterns of China’s cropland during 1990–2000. An analysis based on Landsat TM data. Remote Sens. Environ 2005, 98, 442–456. [Google Scholar]
- Arino, O.; Ramos, J.; Kalogirou, V.; Defourny, P.; Achard, F. GlobCover 2009. In Proceedings of the ESA Living Planet Symposium, Bergen, Norway, 28 June–2 July 2010. SP-686.
- UMD Land Cover Classification. Available online: http://glcf.umd.edu/data/landcover/ (accessed on 31 October 2013).
- Global Land Cover 2000. Available online: http://bioval.jrc.ec.europa.eu/products/glc2000/glc2000.php (accessed on 31 October 2013).
- Chinese Land Use Data. Available online: http://www.geodata.cn/Portal/metadata/viewMetadata.jsp?id=100101-43 (accessed on 31 October 2013).
- ESA Global Land Cover Map. Available online: http://ionia1.esrin.esa.int/ (accessed on 31 October 2013).
- MODIS Land Cover Type Product. Available online: https://lpdaac.usgs.gov/products/modis_products_table/mcd12q1 (accessed on 31 October 2013).
- Jansen, L.J.M.; di Gregorio, A. Parametric land cover and land-use classifications as tools for environmental change detection. Agric. Ecosyst. Environ 2002, 91, 89–100. [Google Scholar]
- Statistic Bureau of Xinjiang Autonomous Region. Xinjiang Statistical Yearbook 2012; China Statistics Press: Beijing, China, 2012. [Google Scholar]
- Feng, Y.; Luo, G.; Lu, L.; Zhou, D.; Han, Q.; Xu, W.; Yin, C.; Zhu, L.; Dai, L.; Li, Y.; et al. Effects of land use change on landscape pattern of the Manas River watershed in Xinjiang, China. Environ. Earth Sci 2011, 64, 2067–2077. [Google Scholar]
- Klein, I.; Gessner, U.; Kuenzer, C. Regional land cover mapping and change detection in Central Asia using MODIS time-series. Appl. Geogr 2012, 35, 219–234. [Google Scholar]
- Quinlan, J.R. C4.5 Programs for Machine Learning; Morgan Kaufmann Publishers Inc: San Francisco, CA, USA, 1993. [Google Scholar]
- Rulequest Research. Data Mining Tools See5 and C5.0. Available online: http://www.rulequest.com/see5-info.html (accessed on 14 January 2010).
- Tian, C.; Zhou, H.; Liu, G. The proposal on control of soil salinizing and agricultural sustaining development in 21’s century in Xinjiang. Arid Land Geogr 2000, 23, 178–181, (In Chinese with English abstract). [Google Scholar]
- Li, Y.; Qao, M.; Wu, S.; Li, H.; Zhou, S. A study on status investigation and control countermeasures of saliruzation of cultivated land in Xinjiang oasis based on 3S technology. Xinjiang Agric. Sci 2008, 45, 642–649, (In Chinese with English abstract). [Google Scholar]
- Han, S.; Yang, Z. Cooling effect of agricultural irrigation over Xinjiang, Northwest China from 1959 to 2006. Environ. Res. Lett 2013, 8. [Google Scholar] [CrossRef]
- Congalton, R.G.; Green, K. Assessing the Accuracy of Remotely Sensed Data: Principles and Practices; CRC Press Taylor & Francis Group: Boca Raton, FL, USA, 2009; p. 183. [Google Scholar]
- State Forestry Administration P.R. China. A Bulletin of Status Quo of Desertification and Sandification in China. Available online: http://www.china.org.cn/china/2011-01/06/content_21685560.htm (accessed on 15 January 2014).
- Zheng, Y.; Xie, Z.; Jiang, L.; Shimizu, H.; Drake, S. Changes in Holdridge life zone diversity in the Xinjiang Uygur Autonomous Region (XUAR) of China over the past 40 years. J. Arid Environ 2006, 66, 113–126. [Google Scholar]
- Leinenkugel, P.; Kuenzer, C.; Oppelt, N.; Dech, S. Characterisation of land surface phenology and land cover based on moderate resolution satellite data in cloud prone areas—A novel product for the Mekong Basin. Remote Sens. Environ 2013, 136, 180–198. [Google Scholar]
- Wardlow, B.D.; Egbert, S.L. Large-area crop mapping using time-series MODIS 250 m NDVI data: An assessment for the U.S. Central Great Plains. Remote Sens. Environ 2008, 112, 1096–1116. [Google Scholar]
- Gong, P.; Wang, J.; Yu, L.; Zhao, Y.; Zhao, Y.; Liang, L.; Niu, Z.; Huang, X.; Fu, H.; Liu, S.; et al. Finer resolution observation and monitoring of global land cover: First mapping results with Landsat TM and ETM+ data. Int. J. Remote Sens 2013, 34, 2607–2654. [Google Scholar]
- Cheema, M.J.M.; Bastiaanssen, W.G.M. Land use and land cover classification in the irrigated Indus Basin using growth phenology information from satellite data to support water management analysis. Agric. Water Manag 2010, 97, 1541–1552. [Google Scholar]
- Kiptala, J.K.; Mohamed, Y.; Mul, M.L.; Cheema, M.J.M.; van der Zaag, P. Land use and land cover classification using phenological variability from MODIS vegetation in the Upper Pangani River Basin, Eastern Africa. Phys. Chem. Earth PT A/B/C 2013, 66, 112–122. [Google Scholar]


© 2014 by the authors; licensee MDPI, Basel, Switzerland This article is an open access article distributed under the terms and conditions of the Creative Commons Attribution license (http://creativecommons.org/licenses/by/3.0/).