Highlights
What are the main findings?
- SCOPES framework operates directly on image footprints in continuous space, employing a three-stage strategy (preliminary selection–structural optimization–supplementary selection) with lazy greedy algorithm, spatial Boolean overlay, and incremental gap repair to achieve efficient, low-redundancy image selection.
- A unit area cost function is designed to balance image quality and spatial contribution, while the lazy greedy mechanism achieves up to 229-fold computational speedup in large-scale scenarios without compromising selection quality.
What are the implications of the main findings?
- SCOPES achieves maximum coverage with minimal image counts and highly competitive, often minimal, redundancy ratios, demonstrating superior efficiency and redundancy control across all tested regions.
- This framework provides an intelligent assistance tool for remote sensing platforms, substantially reducing manual screening workload and delivering high-quality candidate image sets for large-scale applications.
Abstract
The rapid growth of remote sensing data offers unprecedented opportunities for global environmental monitoring and resource assessment, yet poses significant challenges for efficient selection of large-scale image datasets. Traditional conditional retrieval methods often return extensive sets with substantial spatial redundancy, imposing heavy selection burdens on users. Existing automated selection methods struggle to balance coverage accuracy, redundancy control, and computational efficiency in large-scale scenarios, making efficient and accurate image selection a critical challenge for large-scale applications. To address this, we propose SCOPES (Spatially-Constrained Optimization for Efficient Image Selection), a novel spatial constraint optimization framework. SCOPES operates directly on actual image footprints in continuous space, thereby circumventing the limitations of traditional discretization-based modeling. We design a unit area cost function aimed at balancing image quality with spatial contribution. To ensure computational efficiency and solution optimization, SCOPES adopts a three-stage “preliminary selection-structural optimization-supplementary selection” strategy: employing lazy greedy for efficient initial selection, spatial Boolean overlay for redundancy control, and supplementary selection for coverage gap repair. Experiments conducted in four regions of different scales demonstrate that compared to baseline methods, SCOPES minimizes the number of selected images and maximizes coverage while achieving a near-universally minimal redundancy ratio. Meanwhile, the introduction of the lazy greedy algorithm significantly improves computational efficiency, achieving up to a 229-fold speedup in the large-scale East Asia region. Overall, SCOPES provides an efficient, accurate, and scalable solution for remote sensing data selection, substantially reducing the manual selection workload for platform users.
1. Introduction
Remote sensing has become an indispensable technology for global environmental monitoring [1], resource assessment [2], and disaster management [3,4], owing to its advantages of wide coverage, short revisit cycles, and high spatiotemporal resolution [5]. In recent years, with the deployment of multi-source satellite platforms and the rapid development of high-resolution sensors, remote sensing data has experienced unprecedented growth across spatial, temporal, and spectral dimensions [6]. This explosive data growth has greatly expanded large-scale applications ranging from climate change research to operational mapping. However, due to limitations in satellite orbits and observation coverage, remote sensing data acquisition exhibits spatial and temporal discontinuities. Additionally, variations in meteorological conditions and environmental factors lead to differences in data quality among images, which, to some extent, increases the complexity and difficulty of large-scale remote sensing applications.
To facilitate global environmental monitoring and change analysis, international data platforms or companies regularly release complete, continuous global remote sensing data products. For example, NASA provides MODIS daily global surface reflectance and atmosphere mosaic products [7], and the ACRI-ST company provides global mosaic data based on Sentinel-2 [8]. From a global-scale perspective, continuous remote sensing mosaic products, while providing large-scale, consistent surface observations, have significant limitations in refined monitoring and regional analysis due to their long production cycles, poor timeliness, limited spatial resolution, unstable cloud and atmospheric correction, and insufficient temporal series consistency.
Therefore, for large-scale remote sensing application tasks, multiple images may need to be combined to achieve maximum coverage of the region of interest (ROI). Traditional retrieval methods typically rely on conditional queries (e.g., by time, orbit, or sensor) to return all images that meet user-specified conditions. However, the resulting image sets are often highly spatially redundant with variable image quality, requiring users to manually filter and select data. This manual selection is not only time-consuming and labor-intensive, but also prone to significant deviations between manually selected result sets and relatively ideal result sets, leading to wasted computational and time resources as data production needs to process more remote sensing data.
Some existing remote sensing data service platforms (such as Digital Globe [9], China Platform of Earth Observation System [10], etc.) provide single-coverage retrieval functions, but in large-scale or high-volume scenarios, there are limitations such as decreased coverage, high redundancy, and insufficient quality selection, requiring users to perform extensive manual adjustments and replacement operations. Furthermore, inaccuracies in metadata—such as spatial footprint offsets—are inherent in massive data archives, making fully automated selection difficult to meet all high-precision mapping requirements directly. Therefore, for single-coverage retrieval scenarios under specific constraints, a key challenge in promoting large-scale applications is to automatically extract high-quality, low-redundancy preliminary datasets from massive archives. The core objective is to provide users with a high-value optimized candidate “shortlist” to replace raw, overwhelming retrieval results, thereby assisting users in finalizing the optimal dataset selection with minimal manual fine-tuning.
To address this problem, scholars have proposed various automated algorithms. Continuous-space methods directly operate on image footprints or fragments, employing ranking, filtering, clipping, or fragment weighting schemes [11,12,13]. While effective for small-scale datasets, they face issues with redundancy control and scalability. Grid-based methods reformulate image selection as a set cover problem (SCP) [14,15,16], providing a general optimization framework. However, discretization cannot accurately represent image footprints, leading to boundary errors for coarse grids and high computational costs for fine grids. Therefore, existing methods cannot balance coverage accuracy, redundancy control, and efficiency in large-scale scenarios, urgently requiring an optimization paradigm that can operate directly in continuous space while balancing efficiency and accuracy.
To overcome these limitations, this paper proposes a framework named SCOPES (Spatially-Constrained Optimization for Efficient Image Selection), designed to provide an efficient, accurate, and scalable solution for large-scale remote sensing image selection. The primary innovations and contributions of this study are summarized as follows:
- (1)
- Continuous spatial modeling based on actual footprints. Departing from traditional grid-based discretization methods, SCOPES operates directly on the spatial footprints of images in a continuous space. This modeling approach fundamentally eliminates discretization-induced boundary errors.
- (2)
- Novel unit area cost function. A new cost function is designed to unify image quality and spatial contribution within a continuous space. This function enables the selection process to transition from a purely “coverage-driven” approach to a “dual-driven approach of quality and spatial increment,” enhancing the usability of the resulting image set while ensuring high coverage.
- (3)
- Three-stage optimization framework: “Preliminary selection–Structural optimization–Supplementary selection.” By incorporating the Lazy Greedy algorithm, the framework significantly improves computational speed and scalability, integrated with spatial Boolean overlay and an incremental greedy mechanism. This strategy achieves a reduction in the number of selected images and redundancy ratios while strictly ensuring the maximum attainable coverage of the ROI.
- (4)
- Comprehensive validation across multi-scale regions. Through systematic validation across four scales—Hebei, Sichuan, Xinjiang, and East Asia —it is demonstrated that SCOPES outperforms baseline methods across multiple key metrics. Notably, when processing large-scale datasets, it achieves a speedup ratio of up to 229 times compared to the traditional greedy algorithm, validating the engineering application value of the algorithm.
2. Related Work
2.1. Remote Sensing Data Selection
Effectively selecting and acquiring remote sensing data is crucial for advancing large-scale, automated, and intelligent remote sensing applications. Current research mainly focuses on content-based image retrieval (CBIR), which extracts similarity metrics from spectral, texture, shape, spatial, or semantic features for image matching, de-redundancy, and semantic retrieval [17,18], supporting classification [19], change detection [20], and time series construction [21]. However, CBIR primarily addresses semantic similarity and feature-level redundancy without addressing spatial coverage issues within the ROI.
In contrast, metadata-based remote sensing data retrieval has a long history in spatial data retrieval [22,23], where users query datasets through acquisition time, orbit, sensor, or geographic extent. However, with the rapid growth in the number of remote sensing images, simple conditional queries often return large sets of overlapping images, causing serious spatial redundancy. To reduce redundancy, some studies have begun to introduce spatial relationships between images and regions, thereby promoting research on remote sensing data area coverage optimization methods [11,24].
In addition to metadata-driven methods, some studies have also explored area coverage optimization and mosaicking by directly utilizing image content. Kempeneers and Soille [25] optimized Sentinel-2 image selection using quicklook-based evaluation in a big data environment; Yu et al. [12] developed a multi-temporal orthoimage mosaicking method based on dynamic variable patches; Pan et al. [26] proposed a full-coverage image selection method based on deep learning quality grading. These methods highlight the potential of content-based strategies in improving coverage and mosaic quality. However, because they require geometric and radiometric correction of all candidate images, the computational cost becomes prohibitive in large-area studies. Metadata-driven area coverage selection can alleviate this burden by reducing the number of images requiring such expensive preprocessing, thereby supporting more efficient use of content-based mosaicking methods.
2.2. Modeling and Solving the Area Coverage Problem
The area coverage problem is a combinatorial optimization problem defined in continuous space. Its objectives typically fall into two categories: first, achieving maximum coverage under limited total cost; second, achieving target coverage with minimum total cost. Due to the inherent difficulty of solving this combinatorial optimization problem in continuous space, many studies transform the area coverage problem into the well-known SCP for efficient computation. As an NP-hard problem, the SCP is usually addressed through integer programming, heuristic, or metaheuristic algorithms. Integer programming provides optimal solutions for small and medium-scale problems, while heuristic and meta-heuristic approaches are more suitable for large-scale applications [27,28].
In practical applications such as sensor networks, facility location, and environmental monitoring, researchers primarily adopt two strategies. One strategy involves discretizing the ROI into a grid and establishing coverage relationships between the target and grid cells [29,30,31] to solve the problem as a classic SCP. The other explores continuous-space methods to circumvent the boundary errors induced by discretization [32,33]. Within the remote sensing domain, area coverage optimization is a common concern in observation planning and multi-satellite cooperative imaging tasks [34,35,36,37]. However, for the specific task of single-coverage selection from archived remote sensing data, existing research primarily adheres to the following two paradigms.
- (1)
- Continuous Space Methods: Early studies mostly directly processed spatial relationships between images and the ROI in continuous space. These methods preserve the true geometric shape of image footprints, having natural advantages in boundary accuracy and overlap expression. He et al. [11] sorted images according to their timestamp and cloud coverage, progressively selecting images and clipping ROI boundaries; Yang et al. [38], targeting the ZY-3 satellite, progressively selected images with maximum coverage by continuously cutting the bounding rectangle of the ROI along coordinate axes; Yan et al. [13] cut the ROI into non-overlapping fragments, combining timestamp with the number of covered fragments to calculate weights for images, progressively selecting images to cover the ROI. However, while only validated on small-scale datasets, they struggle to maintain scalability in large-scale or dense image sets due to the extensive polygon clipping and spatial relationship calculations involved.
- (2)
- Discrete Grid-Based Methods: Subsequent research primarily discretizes the ROI into regular grids or point sets, thereby transforming the intrinsically difficult continuous optimization problem into the more fundamental, versatile, and well-established SCP, which has mature solution algorithms. For example, Chu et al. [39] designed fitness scores and utilized genetic algorithms to optimize remote sensing image selection; Tao et al. [16] established a Markov random field model to optimize greedy algorithm results; Li et al. [15] applied a greedy algorithm to obtain a locally optimal initial solution, then combined weighted gain-loss strategies and improved local search mechanisms to seek the optimal solution; Yang et al. [14] utilized ray projection and greedy algorithms to optimize image selection for Sentinel-1 data. However, discretization introduces an inherent contradiction: coarse grids (larger cells) lead to inaccurate boundary representation, unable to accurately represent the spatial relationship between images and the ROI. When image boundaries intersect with grid cells, the entire cell is typically marked as fully covered or fully uncovered, causing systematic errors (as shown in Figure 1). This leads to repeated selection near image boundaries—adjacent images may be selected to cover the same partially covered cell. Fine grids (smaller cells), while improving boundary accuracy, significantly increase computational complexity. The number of grid cells grows quadratically with increasing grid precision, while the SCP solution time typically grows super-linearly with problem scale. For continental-scale applications with millions of candidate images, fine grid discretization becomes computationally prohibitive.
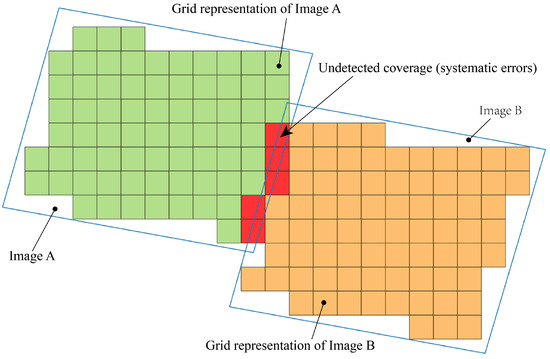 Figure 1. Discretization artifacts caused by grid-based modeling.
This inherent contradiction between accuracy and efficiency indicates that although grid-based SCP methods can be applied to large-scale problems, their scalability bottlenecks and boundary error limitations make it difficult to simultaneously meet the comprehensive requirements for high efficiency and precise redundancy control in current remote sensing data selection.
3. Materials and Methods
3.1. Study Areas and Dataset Description
To comprehensively evaluate the scale adaptability and robustness of the SCOPES framework, this study selected five regions of different scales as study areas: Hebei, Sichuan, Xinjiang, East Asia and South America (Figure 2). The first three regions correspond to Chinese provincial administrative divisions, while the East Asia region spans multiple countries, representing a larger and more complex cross-regional geographical context. To further verify the sensor generalization capability of the framework, this study specifically introduces an experimental region in South America based on the Landsat data source. These regions cover a wide range from local to continental scales, providing a solid foundation for comprehensively validating the framework’s performance in large-scale, complex geometric contexts.
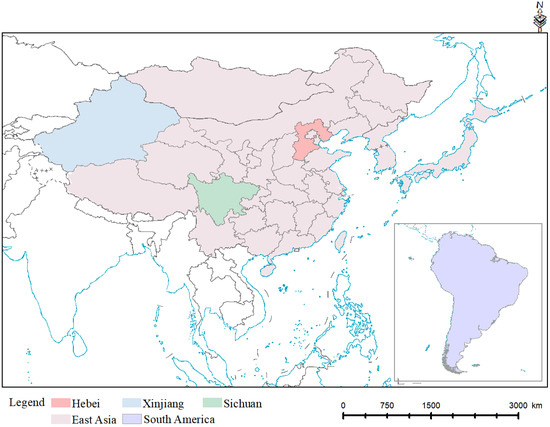
Figure 2.
Study areas used in this research.
The experimental dataset consists of GF-6 PMS data and Landsat 8/9 OLI data acquired in 2024. Specifically, the GF-6 PMS provides multi-spectral images with an 8-m spatial resolution and an 80-km swath width, while the Landsat 8/9 OLI provides multi-spectral images with a 30-m spatial resolution and a swath width of approximately 185 km. In this study, the GF-6 data are utilized for core performance evaluation, whereas the Landsat images serves as a supplementary data source for cross-sensor generalization validation and multi-source data iterative optimization. To ensure spatial continuity and data quality, only images with cloud coverage below 30% were retained. For each image, metadata including acquisition timestamp, cloud coverage, and spatial footprint were extracted and organized into a unified dataset for subsequent analysis. Footprint information was obtained from geometry fields in the database and processed as polygon vectors rather than raster masks in Python 3.10.
Despite GF-6 PMS’s high revisit frequency, existing data still cannot guarantee complete coverage of ROIs. After applying cloud threshold constraints, factors such as cloud coverage, acquisition scheduling, and sensor observation geometry result in certain sub-regions within the ROI lacking qualified observations that meet selection criteria. To enable the framework to adapt to this real-world data incompleteness, we identify and quantify coverage gaps by calculating the Boolean difference between the ROI and the cumulative spatial footprint of all available images. Uncovered areas are recorded and returned as coverage gap masks, thereby providing diagnostic evidence for users to perform progressive image supplementation or refinement when selecting alternative data sources. This design ensures that the SCOPES framework maintains practicality and iterative capability in scenarios where incomplete data coverage becomes a realistic constraint.
3.2. Proposed Method
3.2.1. Problem Formulation and Theoretical Foundations
In large-scale remote sensing tasks, the image selection task aims to select an optimal subset from a massive candidate image set . Where the ROI is set as T, and each image is associated with its spatial footprint . Our goal is to minimize the overall “cost” while satisfying maximum coverage of T. The “cost” here refers not only to the economic cost of acquiring images, but is a generalized concept encompassing both image quality and coverage efficiency.
The greedy strategy is one of the most commonly used heuristic methods in such problems. The standard greedy algorithm pursues “maximum marginal benefit,” i.e., at each step, selecting the image that covers the most new area at the lowest cost. To simultaneously consider quality and efficiency in image selection, we concretize this strategy as the “minimum unit area cost” criterion, i.e., at each iteration, we prioritize images that require the lowest quality cost per unit of new coverage area. In this way, the algorithm implicitly tends to select images with high coverage efficiency and good quality, thereby optimizing image quality while reducing the number of images selected.
However, the decision mechanism of the greedy method highly depends on local information, essentially belonging to “myopic” selection: each step only achieves local optimality for the current gap, without evaluating whether the image will introduce potential redundancy in the overall coverage structure. Therefore, initial solutions generated based on the greedy method often contain certain images that seem reasonable at the local level but have high redundancy from a global spatial perspective.
To overcome this limitation, the SCOPES framework proposed in this paper adopts a three-stage “preliminary selection-structural optimization-supplementary selection” strategy. SCOPES first uses the greedy strategy to generate an initial solution, then introduces spatial Boolean overlay analysis to perform geometric decomposition operations on the image coverage area in the initial solution. This operation precisely breaks down the union of image footprints into a set of non-overlapping atomic polygons. If an atomic polygon is covered by only one image, that image is a “necessary image”; if covered by multiple images, the corresponding area is redundant, and there is room for further optimization, and related images can be removed, as shown in Figure 3. After redundancy elimination, local gaps may appear in some areas; at this time, the greedy selection is executed again with the gap area as the ROI to obtain the final solution.
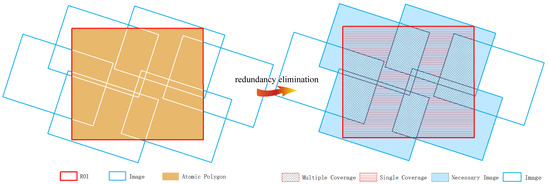
Figure 3.
Illustration of redundant image necessity determination.
It is worth noting that SCOPES’s multi-stage heuristic strategy is essentially a local optimization method, and its results can theoretically only guarantee local optimality, not global optimality. However, the supplementary selection stage after redundancy elimination faces a problem with a significantly simplified structure. Unlike the initial stage requiring global search over the complete ROI, the current decision environment has three key characteristics: (1) strong solution space constraints: most areas are already covered by necessary images, only needing to fill isolated local gaps; (2) small problem scale: single gap area is typically smaller than 5% of the overall ROI, with a limited number of corresponding candidate images; (3) high decision independence: different gaps are spatially separated and can be approximately viewed as independent sub-problems. Under these conditions, the “myopia” impact of the greedy algorithm is significantly weakened. Experimental results also support this argument: for example, in the East Asia region, after redundant image elimination, each coverage gap produced can be completely covered by adding a single image. This indicates that the optimal solution structure of sub-problems is simple and easy to identify; therefore, although SCOPES overall is still a heuristic method, the quality of its greedy strategy solution in this scenario is proven to approach theoretical optimality.
To further improve computational efficiency, SCOPES adopts a lazy greedy evaluation mechanism inspired by submodular optimization [40]. As images are progressively selected and the covered region expands, the area of the remaining uncovered region monotonically decreases or remains constant; consequently, the marginal coverage area provided by any candidate image cannot increase during the iterative process. This property implies that the marginal coverage contribution calculated for an image in an earlier iteration serves as a valid upper bound for its contribution in subsequent iterations. Based on this monotonicity characteristic, SCOPES adopts a lazy greedy evaluation mechanism. In each selection round, the true marginal contribution is recalculated only when the priority of a candidate image cannot be confirmed, thereby avoiding the need for full updates of all candidates at every step. This strategy is consistent with the lazy evaluation concept for submodular optimization proposed by Minoux [41]. While its worst-case time complexity remains the same as that of the standard greedy algorithm, it significantly reduces the number of marginal evaluations in practical execution. Furthermore, Leskovec et al. [42] have verified in large-scale problems such as coverage optimization that this type of lazy evaluation strategy effectively enhances computational efficiency while maintaining the same selection results as the standard greedy approach. Therefore, without altering the theoretical worst-case complexity, SCOPES significantly reduces the actual computational overhead in large-scale tasks.
3.2.2. Cost Function Design for Remote Sensing Images
As described in Section 3.2.1, the core of the greedy strategy lies in evaluating the “cost” of each candidate image. To this end, this paper designs a multi-factor combined unit area cost function that quantifies image availability and coverage completeness into a unified dimensionless metric.
- a.
- Metric Selection and Normalization
Image quality is key to measuring its availability. To evaluate image attributes of different dimensions on a unified scale, this paper constructs a general normalized quality evaluation framework. The core of this framework is to transform attribute value into ideal value deviation, ensuring the final score , with smaller values indicating better image quality. For attribute j of the image , its standardized score is calculated as follows:
where is the original attribute value, is the ideal target value for that attribute, and and are the maximum and minimum values of that attribute, respectively.
When users set more than one selecting preference (i.e., image attributes), we introduce attribute preference weight to express the user’s preference degree for attribute j and construct a comprehensive image quality score using weighted averaging:
The above framework has good scalability, and users can flexibly configure the quality metric system according to specific application requirements. For example, in high-precision mapping tasks, factors such as solar elevation angle ( to reduce terrain shadows), atmospheric transparency, radiometric consistency, or spatial resolution (for homologous data with varying scales) can be further incorporated, and the importance of different quality dimensions can be balanced by adjusting the weight .
To demonstrate the effectiveness of the method in subsequent experiments and ensure fair comparison with baseline methods, this study selects the two most representative and universal attributes in remote sensing data applications: cloud coverage ratio and imaging timestamp. These two metrics can be directly obtained from image metadata without additional radiometric processing or geometric calculations, suitable for large-scale, rapid selection scenarios. We set the ideal cloud coverage to 0 and the ideal timestamp to the middle value of the user-set time selecting range and calculate the cloud coverage score and timeliness score for images according to Equation (1). Let and be the user’s preference weights for cloud coverage and timestamp, respectively; at this time, the comprehensive quality score for image is
The main purpose of this paper is to demonstrate the method’s effectiveness, with no obvious preference for cloud coverage and time; therefore, we set = = 0.5.
To accurately measure the actual spatial contribution of images during the greedy selection process, this paper introduces the concept of a dynamic area to be covered. Let T represent the total ROI, and the area to be covered in the k-th iteration is denoted as . Considering that the candidate image set may not completely cover the ROI, we initialize the area to be covered as the intersection of the ROI and the total coverage of the candidate image set, i.e., . Subsequently, each iteration updates the remaining area to be covered according to the footprint corresponding to the image selected in the k-th round, with the recursive relationship defined as follows:
In the k-th round, the intersection area between the image and the current area to be covered is calculated as the image coverage area metric :
To eliminate dimensional differences and enable spatial resolution to be comprehensively evaluated with quality scores on a unified scale, this paper utilizes the maximum and minimum value of the candidate image coverage area of the initial ROI in each iteration to perform linear normalization on the marginal coverage area of the candidate image set, obtaining the coverage score :
Unlike the static coverage calculation method based on the global ROI T, the coverage area based on can more accurately reflect the effective contribution of each image at the current stage, avoiding interference from repeated coverage on evaluation results. Here, we choose static initial reference values and to ensure that the unit area cost is monotonically non-decreasing.
- b.
- Cost Function Form and Adjustment Factor
Based on the above two normalized dimensions, the unit area cost function we define in the k-th iteration has the following form:
where serves as the intensity adjustment for the quality penalty term and can be flexibly set according to task requirements. The construction logic of this function embodies dual optimization objectives: on the one hand, the normalized coverage score is in the denominator, encouraging the selection of images with greater spatial coverage contribution to achieve efficient coverage of the ROI; on the other hand, through the multiplicative term , an explicit penalty mechanism is introduced for image quality.
The adjustment factor plays a key role in regulating this balance relationship. When , the cost function degenerates to a form related only to image spatial contribution:
At this time, the image quality score no longer affects the image ranking and selection process, and the algorithm will optimize entirely based on the marginal coverage area of images for the current area to be covered, always prioritizing images with the greatest spatial contribution. This situation is suitable for task scenarios where image quality is not a concern or quality has been standardized in preprocessing steps.
Practical applications often require integration of data from different sensors (such as Landsat, Sentinel, ZY-3, etc.), and these data have essential differences in attributes such as resolution and swath width that are difficult to objectively and effectively normalize within a unified cost function. Therefore, when constructing the cost function, we deliberately did not include resolution as an attribute, but focused quality assessment on the more universal cloud coverage and timeliness indicators. Addressing the integration needs for multi-source heterogeneous data in practical applications, SCOPES recommends adopting a priority progressive selection strategy: according to preset data source preferences (for example, prioritizing high-resolution data), perform optimization sequentially and use the coverage results from the previous round as masks to guide supplementary selection of the next round data source. This design is a practical engineering solution that effectively circumvents complex cross-sensor normalization challenges in the algorithm process, ensuring the operability of this method in multi-source scenarios.
3.2.3. Algorithm Process and Key Mechanisms
The core algorithm process of SCOPES consists of the following three tightly connected stages, as shown in Figure 4.
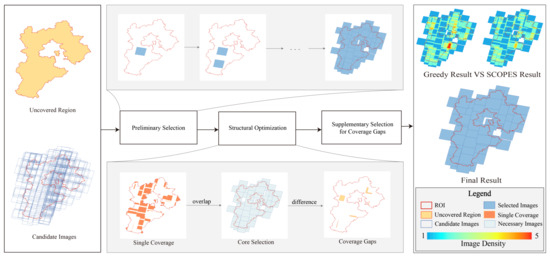
Figure 4.
SCOPES algorithm flowchart. Image density represents the number of times images repeatedly cover an area.
- a.
- Initial Solution Construction and Lazy Greedy Strategy
The construction of the initial solution is based on the minimum unit area cost greedy strategy defined in Section 3.2.2. To address the efficiency bottleneck of large-scale datasets, this paper introduces a lazy greedy strategy based on priority queues. This strategy utilizes the monotonically non-decreasing characteristic of image unit area cost, recalculating the true cost only for the current optimal candidate image, effectively avoiding global repeated calculations and significantly reducing computational overhead. In a specific implementation, the algorithm initializes the area to be covered as the intersection of the ROI and total candidate image coverage , and constructs a priority queue based on the cost function. During iteration, continuously pop the heap-top image and its unit area cost at heap insertion time. Determine whether the updated unit area cost meets the inclusion condition, and continue until the ROI is completely covered. The specific implementation process is shown in Algorithm 1.
| Algorithm 1 Lazy Greedy Image Selection |
|
- b.
- Spatial Redundancy Elimination Mechanism
The redundancy elimination strategy is based on spatial Boolean overlay analysis, precisely decomposing the union of image footprints in the preliminary result into non-overlapping atomic polygon units . Based on the number of covering images for each atomic polygon , image necessity can be determined. Specifically, if , the atomic polygon is covered by only one image, and that image is determined to be a necessary image. The necessary image set satisfies
This operation effectively eliminates redundant images, achieving compression of the overall scale of the image set.
- c.
- Supplementary Selection and Termination Criterion
Following redundancy elimination, to repair potential spatial coverage gaps, this paper proposes a supplementary selection strategy. This strategy first identifies the remaining area still requiring coverage, , by subtracting the area already covered by the “necessary image” set from the original target region:
Next, using as the new input target and as the initial selected image set, run the same unit area cost evaluation and lazy greedy mechanism as in the initial stage among all candidate images, selecting images with minimum unit area cost until coverage is complete. The termination criterion for supplementary selection is . Specific implementation details are shown in Algorithm 2.
| Algorithm 2 Supplementary Selection |
|
4. Results
4.1. Experimental Setup
To objectively evaluate the performance of the SCOPES framework proposed in this paper, we selected three representative baseline algorithms in the remote sensing image selection domain for comparative evaluation. These baseline methods cover different modeling and solution strategies: Tao et al. [16]’s method is based on grid discretization, transforming the area coverage problem into a grid voting problem and introducing a Markov random field model to balance image quality and spatial distribution. Yan et al. [13]’s method operates in continuous space, calculating weights by dividing the ROI into non-overlapping fragments and combining image acquisition time with the number of covered fragments to iteratively select for optimal image combinations. Li et al. [15]’s method establishes comprehensive coverage relationships between images and grids using global grids and employs a novel mechanism-enhanced greedy algorithm for the solution.
We implemented the three algorithms proposed by Tao et al. [16], Yan et al. [13], and Li et al. [15] in strict accordance with the methodologies disclosed in their respective papers. To ensure fairness and effectiveness of comparison, we followed the principle of baseline alignment in parameter settings: for Tao et al.’s method, we maintained consistency with the original paper by using 10 km grid size for discretization; considering that the SCOPES framework proposed in this study does not mandate overlap between images, we set the user-specified target overlap ratio in this method to 0. For Li et al.’s method, we adopted exactly the same grid size and key parameter settings as in the original paper. More importantly, to ensure uniformity of evaluation standards, all baseline algorithms adopted the same cloud coverage ratio and imaging timestamp indicators as the SCOPES framework when evaluating image quality. Through this approach, our experiments ensure high consistency between SCOPES and baseline methods in input data and quality measurement standards. All experiments were conducted using Python 3.10 on a workstation running Ubuntu 20.04, equipped with an Int el® Xeon® E5-2650 v4 CPU (2.20 GHz) (Santa Clara, CA, USA).
To comprehensively evaluate the performance of different selection methods in spatial coverage, redundancy control, image quality, and computational efficiency, this study adopts an evaluation framework informed by recent relevant studies, such as Tao et al. [16] and Li et al. [15]. Based on these works, the following five key metrics are utilized to provide a multidimensional assessment:
- ECR (Effective Coverage Ratio): The percentage of ROI area covered by selected images, quantifying the completeness of spatial coverage. Higher ECR indicates more complete coverage of the ROI. The formula is as follows:
- NSI (Number of Selected Images): The total number of images retained in the final selection. Although NSI does not directly measure redundancy, a smaller NSI typically indicates a more compact selection with lower redundancy.
- RR (Redundancy Ratio): Defined as the ratio of overlapping area within the selected image set to the intersection area between the ROI and the union of all candidate images. Lower RR reflects better redundancy control and higher spatial utilization efficiency. The formula is as follows:
- AQS (Average Quality Score): The average quality score of selected images, reflecting the average quality level of images. Lower AQS indicates better image quality. The formula is as follows:
- RT (Runtime): The execution time of the selection process, used to evaluate computational efficiency and method scalability.
4.2. Analysis of Key Algorithmic Mechanisms
To verify the effectiveness of key mechanisms in the proposed SCOPES method, two targeted experiments were conducted to analyze its core algorithm design. The first experiment evaluates the improvement effect of the lazy greedy algorithm on computational efficiency without changing selection results. The second experiment evaluates the control effect of spatial redundancy elimination and supplementary selection strategies on the number and redundancy of selected images.
4.2.1. Efficiency Analysis and Evaluation of the Lazy Greedy Algorithm
We compared the standard greedy algorithm with the lazy greedy algorithm on the same candidate image set and the same ROI. Both algorithms use the same selection criteria and cost function to ensure that performance differences come only from different algorithm strategies. Performance comparisons were independently conducted in the four designated test regions: Hebei, Sichuan, Xinjiang, and East Asia. Three metrics were recorded for each region: RT, NSI, and ECR. Specific results are summarized in Table 1.

Table 1.
Comparison of the standard greedy algorithm (SG) and the lazy greedy algorithm (LG) in computational efficiency and selection performance. Bold values represent better performance for each metric.
Experimental results demonstrate that compared to the standard greedy algorithm, the lazy greedy algorithm adopted in this paper significantly improves computational efficiency while ensuring completely identical selection results. In all four test regions—Hebei, Sichuan, Xinjiang, and East Asia—the lazy greedy algorithm achieved the same NSI images and ECR as the standard greedy algorithm, while RT was reduced by orders of magnitude. Specifically, in the Hebei region, RT decreased from 3.88 s to 0.45 s (8.6-fold speedup); in Sichuan from 9.44 s to 1.60 s (5.9-fold); in Xinjiang from 150.89 s to 4.64 s (32.5-fold); and the improvement was most significant in the East Asia region, with RT drastically decreasing from 80,602.14 s to 350.98 s, approximately a 229-fold speedup. Furthermore, the lazy greedy algorithm achieved efficiency improvements without any loss in selection quality. For example, in the Xinjiang region, both methods selected 386 images with an ERC of 99.94%; in the East Asia region, both selected 2730 images with a coverage rate of 97.16%.
4.2.2. Evaluation of the Spatial Redundancy Elimination Strategy
To evaluate the effectiveness of the proposed spatial redundancy elimination and supplementary selection strategies, we compared the preliminary results generated by the lazy greedy algorithm with the final optimized results output by the SCOPES method. Through this comparison, the performance improvement brought by the structural optimization module can be quantitatively evaluated in terms of redundancy suppression, selection compactness, and overall spatial coverage.
We calculated key performance metrics (ECR, RR, AQS, RT) for both results and quantified the effectiveness of the spatial redundancy elimination strategy through comparison. Table 2 summarizes the evaluation results for the four test regions.
Table 2.
Comparison of LG algorithm preliminary results and SCOPES optimized results on NSI, ECR, RR, and AQS metrics. Bold values represent better performance for each metric.
Experimental results indicate that the spatial redundancy elimination and supplementary selection strategy adopted in this paper can effectively reduce image selection redundancy. In all four test regions, this method significantly reduced the NSI and lowered RR while maintaining original coverage. In the Hebei region, the NSI decreased from 61 to 55 (9.8% reduction), and the RR decreased from 0.9239 to 0.7403. Similar trends were observed in Sichuan (NSI decreased from 126 to 114, a 9.5% reduction; RR decreased from 0.8034 to 0.6239), Xinjiang (NSI decreased from 386 to 355, a 8.0% reduction; RR decreased from 0.9274 to 0.7592), and the East Asia region (NSI decreased from 2730 to 2475, a 9.3% reduction; RR decreased from 0.9429 to 0.7460). In terms of ECR, coverage remained unchanged in all regions (e.g., 99.9381% for Xinjiang, 97.1617% for East Asia). Additionally, in all experimental regions, the AQS of optimized results showed slight increases (e.g., Hebei from 0.2182 to 0.2251 and Sichuan from 0.4047 to 0.4158).
4.3. Comparative Analysis with Baseline Methods
To comprehensively evaluate the overall performance of the SCOPES method, we conducted a comparative analysis with the three aforementioned baseline methods. This comparison aims to quantify SCOPES’s performance in coverage completeness, redundancy control capability, and computational efficiency within each study region.
4.3.1. Quantitative Analysis
Table 3 provides a quantitative comparison of the original data and the selection results of four methods through five evaluation metrics (NSI, ECR, RR, AQS, and RT), where bold values represent better performance.
Table 3.
Performance and result comparison of SCOPES with baseline methods. Bold values represent better performance for each metric.
In terms of spatial coverage completeness, all methods achieved high ECR in the four study regions: Hebei, Sichuan, Xinjiang, and East Asia. SCOPES and Yan et al.’s method achieved optimal coverage in Sichuan, Xinjiang, and East Asia regions, maintaining consistency with the original dataset coverage at 90.9207%, 99.9381%, and 97.1617%, respectively, while Tao et al.’s and Li et al.’s methods resulted in slight decreases in coverage.
In terms of redundancy control capability, the SCOPES method performs particularly well. In all four study regions, SCOPES’s RR is the lowest or near-lowest. Specifically, the RR in the Hebei region is 0.7403, a 49.7% reduction compared to Tao et al.’s 1.4717; the RR in the Xinjiang region is 0.7592, an 18.5% reduction compared to the second-best method by Yan et al. at 0.9478; the RR in the East Asia region is 0.7460, also superior to all other baseline methods. Notably, in the Sichuan region, SCOPES achieves an RR of 0.6239, which is highly competitive and only marginally higher than the best-performing method by Yan et al. (0.6115).
In terms of image selection efficiency, SCOPES demonstrates clear advantages in the NSI. In the Hebei region, SCOPES requires only 55 images to achieve 100% coverage, an 81.6% reduction compared to the original data’s 299 images, and a 17.9% reduction compared to the second-best method by Li et al. at 67 images. In the largest East Asia region, SCOPES selected 2475 images, a 25.0% reduction compared to Tao et al.’s 3299 images and a 6.6% reduction compared to Yan et al.’s 2649 images.
In terms of image quality, the results of each method vary. In this experiment, the lowest AQS represents optimal quality. Overall, in all four test regions, SCOPES’s AQS values lie between the best and worst methods, reflecting its multi-objective optimization characteristics. In the Hebei region, SCOPES’s AQS is 0.2251, better than Li et al.’s method (0.3510) but slightly higher than Yan et al.’s optimal value (0.2059). In the Sichuan region, Tao et al.’s method achieved the lowest AQS (0.4012), while Li et al.’s method had the highest AQS value (0.4274), with SCOPES’s AQS at a medium level (0.4158). In the Xinjiang and East Asia regions, SCOPES’s AQS values similarly lie between the optimal (lowest AQS) and worst (highest AQS) baseline methods.
In terms of computational efficiency, SCOPES demonstrates excellent performance. In all four study regions, SCOPES’s RT is the shortest. Particularly in the large-scale East Asia region, SCOPES requires only 571.86 s, a 72.1% improvement compared to Tao et al.’s 2046.71 s and a 53.7% improvement compared to Yan et al.’s 1235.44 s. Even in the relatively small Hebei region, SCOPES’s runtime is only 0.55 s, demonstrating excellent scalability.
4.3.2. Visualization Analysis
To deeply analyze the spatial distribution characteristics of images selected by the four methods, we plotted overlap density distribution maps for their selected image sets. Visualization results can intuitively reflect the degree and distribution structure characteristics of spatial redundancy, thereby providing a more comprehensive basis for evaluating the feasibility of each method in practical applications.
Figure 5, Figure 6, Figure 7 and Figure 8 show the spatial distribution of image overlap density in the Hebei, Sichuan, Xinjiang, and East Asia regions, respectively. In each figure, subfigure (a) corresponds to the distribution results of Tao et al.’s method, subfigure (b) to Yan et al.’s method, subfigure (c) to Li et al.’s method, and subfigure (d) to the SCOPES method proposed in this paper. Color gradients from blue to red indicate increasing degrees of image overlap.
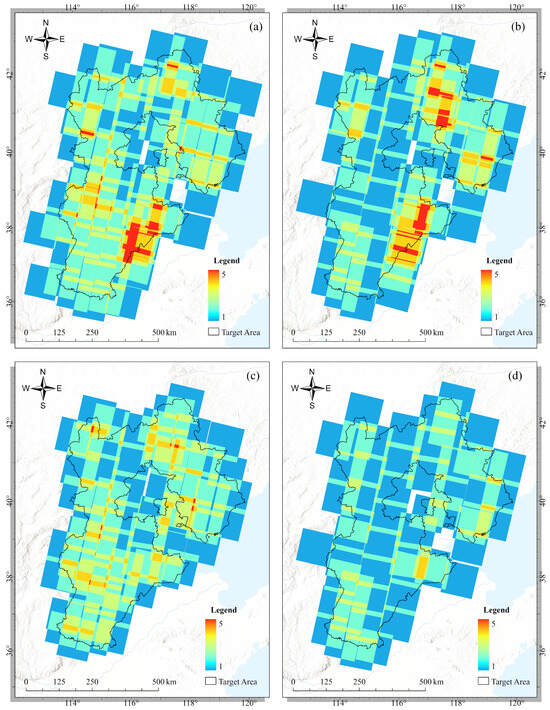
Figure 5.
Comparison of GF-6 PMS image overlap distribution in Hebei experimental region: (a) Tao et al.’s method, (b) Yan et al.’s method, (c) Li et al.’s method, (d) SCOPES method.
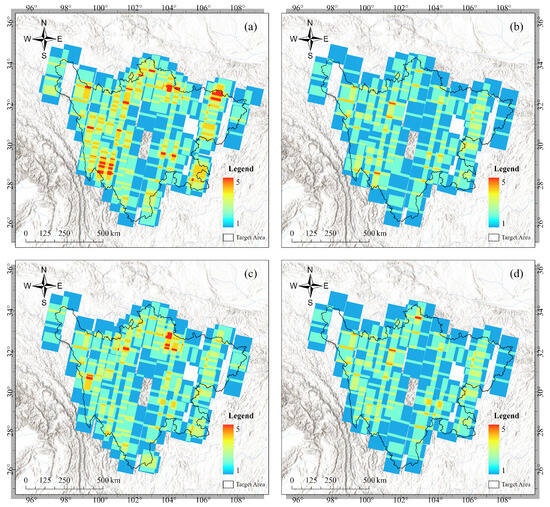
Figure 6.
Comparison of GF-6 PMS image overlap distribution in Yunnan experimental region: (a) Tao et al.’s method, (b) Yan et al.’s method, (c) Li et al.’s method, (d) SCOPES method.
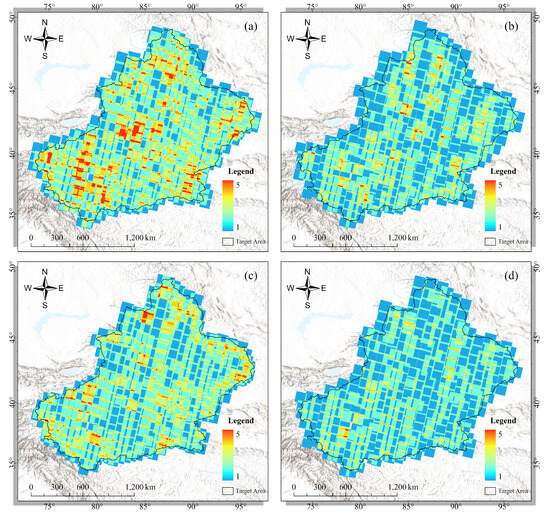
Figure 7.
Comparison of GF-6 PMS image overlap distribution in Xinjiang experimental region: (a) Tao et al.’s method, (b) Yan et al.’s method, (c) Li et al.’s method, (d) SCOPES method.
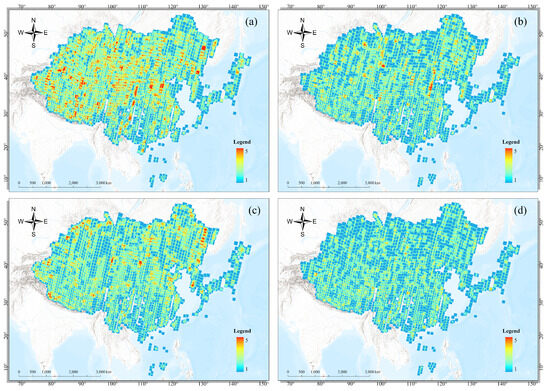
Figure 8.
Comparison of GF-6 PMS image overlap distribution in East Asia experimental region: (a) Tao et al.’s method, (b) Yan et al.’s method, (c) Li et al.’s method, (d) SCOPES method.
From the overall distribution perspective, Tao et al.’s method (Figure 5a) presents relatively obvious high-overlap areas in the Hebei experimental region, particularly in the central and southern parts of the study area, where red and orange regions are widely distributed, indicating significant spatial redundancy. Yan et al.’s method (Figure 5b) shows improvement compared to Tao et al., with reduced continuous high-overlap areas, but multiple obvious red clustering regions can still be observed. Li et al.’s method (Figure 5c) shows a medium-level overlap distribution, with fewer red regions but still widespread orange areas. In contrast, the SCOPES method (Figure 5d) is predominantly blue and light green overall, with almost no visible high-overlap areas (red and dark orange) and only small-scale overlap in a few locations, which is consistent with the quantitative result of RR value of 0.7403 in the Hebei region in Table 3.
Due to the uneven distribution of original data in the Sichuan region, image coverage is more challenging. Tao et al.’s method (Figure 6a) shows a relatively uniform but elevated overlap density distribution, with red and orange regions occupying a considerable proportion. Yan et al.’s method (Figure 6b) performs well in this region, with significantly reduced overlap density, dominated by green and light blue tones. Li et al.’s method (Figure 6c) has distribution characteristics between Tao et al.’s and Yan et al.’s, with some medium-overlap regions and a small amount of red high-overlap regions at boundaries. SCOPES method (Figure 6d) is relatively close to Yan et al.’s method in visual effect, maintaining relatively low overlap density overall, which is consistent with the quantitative results of similar RR values between the two (0.6239 and 0.6115, respectively) in Table 3.
As the largest single study region by area, the image selection results for the Xinjiang region better reflect the scalability of methods. Tao et al.’s method (Figure 7a) shows yellow to red medium-high overlap regions over a large area, indicating limited redundancy control effectiveness. Yan et al.’s method (Figure 7b) significantly improves overlap distribution, mainly presented in green and light blue, but still has sporadic red regions. Li et al.’s method (Figure 7c) performs between the two, with higher overlap density in boundary areas and continuous distribution of medium-overlap regions. The SCOPES method (Figure 7d) is characterized by a predominance of blue and light green across the entire study region, with minimal instances of orange high-overlap areas. This uniformity in overlap density distribution underpins its superior quantitative performance, specifically achieving the minimum RR value of 0.7592 in the Xinjiang region.
As the largest-scale test region with the most images, the visualization results for the East Asia region best reflect the performance of each method in complex, large-scale scenarios. Tao et al.’s method (Figure 8a) presents large areas of orange and red regions, especially in the main land body, with significantly elevated overlap density. Yan et al.’s method (Figure 8b) achieves good redundancy control, with overall tones dominated by green, but still has local red high-overlap regions. The distribution pattern of Li et al.’s method (Figure 8c) resembles that of Tao et al.; however, the overall overlap is notably attenuated, with a significant reduction in the spatial extent of red high-overlap regions. SCOPES method (Figure 8d) presents uniform blue-green tones overall, with the sparsest distribution of red high-overlap regions, selecting only 2475 out of 9439 candidate images to achieve 97.1617% coverage and the lowest RR value of 0.7460.
4.4. Sensitivity Analysis of Parameter
To evaluate the robustness and configurability of the proposed cost function, we conducted a systematic sensitivity analysis of the quality penalty weight in Sichuan and Xinjiang regions. Seven configurations were tested, , covering the range from pure area-driven selection ( = 0) to strict quality priority ( = 10). Four key metrics were recorded: NSI, RR, AQS, and ECR. Quantitative results are shown in Table 4, with trends visualized in Figure 9 and Figure 10.
Table 4.
Sensitivity analysis of quality penalty weight in Sichuan and Xinjiang regions.
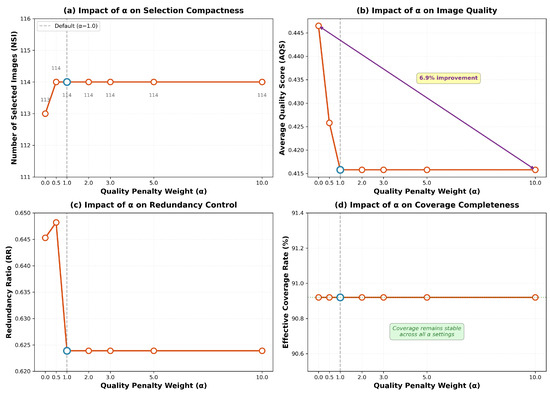
Figure 9.
Sensitivity analysis of quality penalty weight in Sichuan region.
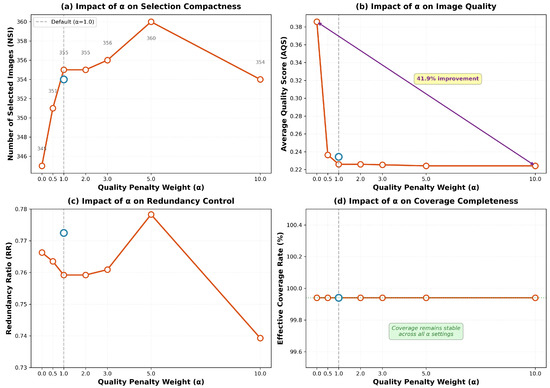
Figure 10.
Sensitivity analysis of quality penalty weight in Xinjiang region.
Both regions exhibit relatively stable characteristics in terms of NSI, albeit with distinct variation patterns. In the Sichuan region (Figure 9a), the NSI remains stable at 114 images for all non-zero values, compared to 113 images at , representing an increase of only one image (a variation amplitude of 0.9%). In contrast, the Xinjiang region (Figure 10a) presents a non-monotonic pattern: NSI gradually increases from 345 at to a peak of 360 at , before decreasing to 354 at . Despite these fluctuations, the overall variation amplitude is controlled within a 4.3% range (345–360 images).
The AQS metric in both regions demonstrates a strong monotonic relationship with , though the magnitude of optimization differs. In the Sichuan region (Figure 9b), as increases from 0 to 10, AQS decreases from 0.4465 to 0.4158, achieving a 6.9% quality improvement. The primary gains are concentrated in the initial stage ( to ), where AQS drops by 4.6% (from 0.4465 to 0.4258); from to , AQS only further decreases by 2.3% (from 0.4258 to 0.4158) and reaches a plateau for , indicating that the potential for quality improvement is largely exhausted. In the Xinjiang region (Figure 10b), AQS significantly decreases from 0.3857 () to 0.2242 (), a cumulative improvement of 41.9%, far exceeding that of Sichuan. Similarly, the most significant quality gains occur in the initial stage: between and , AQS decreases by 38.7% (from 0.3857 to 0.2365), accounting for 92.4% of the total improvement. Beyond , the curve flattens significantly—increasing from 2 to 10 yields only a marginal gain of 0.8% (from 0.2260 to 0.2242).
The RR metric shows moderate sensitivity to in both regions, with varying fluctuation modes. In the Sichuan region (Figure 9c), RR fluctuates slightly between 0.6239 () and 0.6482 (), with a variation range of only 3.9%. At , RR is 0.6453; after introducing the quality penalty (), it rises briefly to 0.6482 before stabilizing at 0.6239 for . In the Xinjiang region (Figure 10c), RR fluctuates between 0.7393 () and 0.7783 (), with overall levels significantly higher than those in Sichuan (averaging approximately 17% higher).
The ECR metric demonstrates exceptional stability across all configurations in both regions. ECR remains constant at 90.92% for Sichuan (Figure 9d) and 99.94% for Xinjiang (Figure 10d) regardless of the value. The perfect stability of ECR in both regions fully validates the core advantage of the algorithm design: coverage is strictly guaranteed as the primary priority, ensuring that coverage requirements are never sacrificed for the pursuit of higher image quality.
4.5. Generalization Analysis
To further verify the generalization capability and robustness of the SCOPES framework in practical applications, this section moves beyond the limitations of a single sensor (GF-6) and local scales. Scalability experiments were conducted across three dimensions: cross-scale geographic scenarios, iterative optimization of multi-source data, and extreme data distribution characteristics.
4.5.1. Intercontinental Application and Sensor Generalization
In response to the need for verifying the algorithm’s applicability at a global scale, this study selected South America as the experimental region and utilized Landsat-8/9 satellite data for regional selection. Compared to the aforementioned East Asia study area, the South American experimental scenario not only features a broader latitudinal span but also employs Landsat data that exhibits significant heterogeneity in orbital geometry and imaging swath width compared to GF-6.
Experimental results (Figure 11) show that the original dataset before selection contained 17,025 images, characterized by severe orbital overlap and redundant stacking (with density exceeding 50 layers at its peak). After SCOPES optimization, the number of images was reduced to 739, significantly decreasing the overlap density while maintaining coverage over the South American continent. This demonstrates that the continuous space modeling of SCOPES can seamlessly adapt to different sensor parameters and possesses the computational stability required to handle massive, intercontinental-scale datasets.
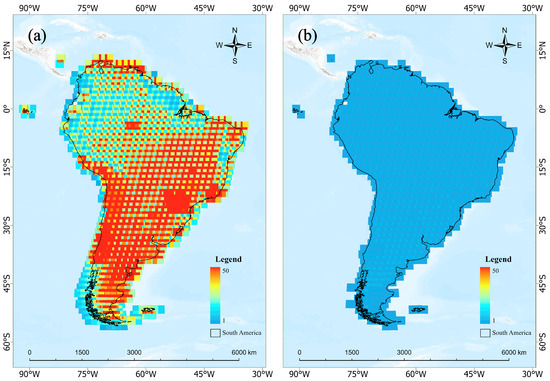
Figure 11.
Comparison of Landsat image overlap distribution in South America: (a) Results of conditional retrieval; (b) optimal selection results of the SCOPES algorithm.
4.5.2. Multi-Sensor Collaboration and Iterative Selection
To address the increasing demand for multi-source data collaboration in remote sensing applications, this study conducted a hybrid selection experiment using GF-6 and Landsat data in the Sichuan region. The experiment aimed to verify the performance of the SCOPES framework in handling insufficient coverage of primary data: an initial selection was first performed based on existing GF-6 archival images, followed by the introduction of Landsat images as an incremental supplement through an iterative optimization mechanism to address identified spatial coverage gaps.
The visualization results (Figure 12) intuitively demonstrate the iterative selection process of the SCOPES algorithm across heterogeneous sensor footprints. The algorithm accurately identifies the coverage gaps left by the GF-6 image set and automatically selects the optimal images from the Landsat candidate images for spatial completion. Experimental results show that through this iterative mechanism, the final coverage rate of the ROI increased from 90.92% to 100%, effectively compensating for the spatial incompleteness of a single data source.
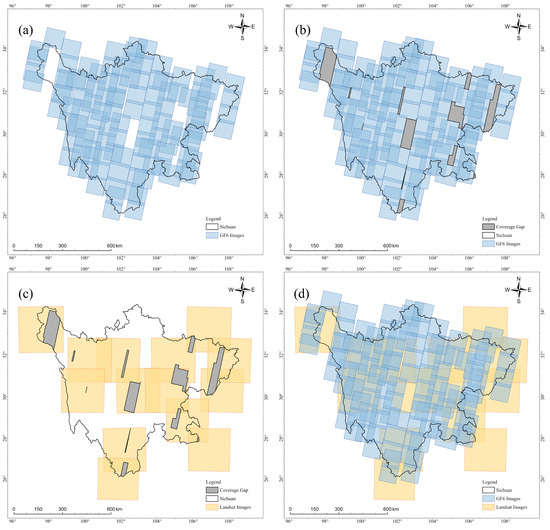
Figure 12.
Schematic diagram of iterative selection for GF-6 and Landsat data in the Sichuan experimental area: (a) Selection results of GF-6 data; (b) coverage gaps of GF-6 data over the ROI; (c) gap-filling results using Landsat; (d) final optimal selection results.
4.5.3. Robustness to Extreme Data Sparsity
To test the algorithm’s performance under extreme conditions, this study constructed data-sparse scenarios in the Sichuan and Xinjiang regions through random data thinning (with sampling rates reduced from 100% to 5%). Four key metrics were recorded: NSI, ECR, RR, and AQS. The experimental results are shown in Table 5.
Table 5.
Comparison of Coverage Performance under Different Data Densities in Sichuan and Xinjiang Regions.
The results indicate that SCOPES exhibits significant optimization capabilities across all sampling rates. Compared to the original candidate sets after thinning, SCOPES substantially reduces the NSI. For instance, in the Xinjiang region at a 100% sampling rate, the NSI was reduced from 1961 to 355. The RR after selection is significantly lower than that of the candidate datasets, proving the algorithm’s effectiveness in eliminating overlapping areas. Furthermore, the AQS of the selected images decreases despite the drastic reduction in image count, indicating that the algorithm effectively filters for image quality. In all test scenarios, the ECR after SCOPES optimization remains perfectly consistent with the maximum coverage capacity of the candidate sets. This demonstrates that the algorithm accurately identifies and retains all marginal images contributing to spatial coverage during redundancy elimination, without sacrificing coverage accuracy for the sake of lower redundancy. At extremely low sampling rates (e.g., 5%), the optimized results were observed to be identical to the candidate sets (where NSI no longer decreases and RR approaches 0).
5. Discussion
5.1. Effectiveness Analysis of Core Mechanisms
The excellent performance of SCOPES stems from the synergy of multiple mechanisms, and the experiments in Section 4.2 clearly reveal the independent contribution and operation mode of each mechanism. The lazy greedy algorithm reduces runtime by one to two orders of magnitude while ensuring completely identical selection results (NSI, ECR). The acceleration effect amplifies with increasing problem scale, achieving up to a 229-fold speedup in the East Asia region, for example. This significant performance improvement, especially in large-scale scenarios, confirms the high scalability and practical value of the lazy greedy algorithm in handling large-scale candidate sets. The spatial redundancy elimination and supplementary selection mechanism effectively improves data redundancy caused by the greedy algorithm. Through precise geometric analysis, it reduces the number of selected images by an average of 9.2% and lowers the redundancy ratio by an average of 19.4% without compromising coverage completeness (no loss in ECR) (see Table 2). Supplementary selection successfully repairs local gaps after redundancy elimination, utilizing problem simplification characteristics to ensure the reliability and high quality of the final solution. Notably, coverage remains unchanged in all regions, confirming that redundancy reduction does not compromise spatial integrity.
5.2. Performance Comparison with Baseline Methods and Paradigm Difference Discussion
Overall, the SCOPES method achieves significant improvements in redundancy control, number of image selections, and computational efficiency while ensuring spatial coverage completeness. Compared to baseline methods, SCOPES can complete high-quality image selection tasks with fewer images, lower redundancy, and shorter computation time. In all test regions, SCOPES’s RR and NSI performance are optimal or near-optimal, and visualization results also confirm its most uniform spatial distribution characteristics. For example, in the East Asia region, SCOPES reduces NSI by 6.6% compared to the second-best method and improves RT by more than 53.7%.
The quantitative comparison results with baseline methods (Table 3) and visualization analysis (Figure 5, Figure 6, Figure 7 and Figure 8) reveal the essential differences between different modeling paradigms. Grid discretization methods (Tao et al., Li et al.), while easy to formalize, accumulate systematic boundary representation errors in large-scale scenarios, leading to continuous high-redundancy bands in boundary areas (shown as continuous yellow and orange regions in visualization results). In contrast, the core innovation of SCOPES lies in its three-stage optimization process—comprising preliminary selection, structural optimization, and supplementary selection. By incorporating a spatial Boolean overlay mechanism within a continuous spatial framework, SCOPES introduces a global-perspective redundancy evaluation that effectively mitigates the inherent limitations of traditional greedy algorithms.
Our experimental results demonstrate that the high-quality local optima identified by SCOPES in continuous space offer significantly greater practical value than the so-called “global optima” derived from discretized spaces. This advantage is particularly pronounced in large-scale, complex scenarios. While grid-based methods seek optimality within a simplified, discretized mathematical model, the resulting systematic precision loss leads to unavoidable redundancy and coverage gaps when translated back to the actual geographic space. Conversely, by maintaining the geometric integrity of image footprints, SCOPES ensures comprehensive coverage while achieving minimal redundancy and superior spatial uniformity, thereby validating its efficacy and robustness in real-world engineering applications.
5.3. Parameter Sensitivity and Multi-Objective Trade-Offs
Furthermore, sensitivity analysis of the quality penalty weight reveals the inherent multi-objective trade-off problem in image selection tasks. Experimental results (Table 4) show that the ECR remains constant regardless of variations in (e.g., stabilizing at 90.92% in the Sichuan region). This demonstrates that the SCOPES framework can optimize image quality and redundancy while strictly guaranteeing coverage integrity. The algorithm consistently prioritizes the geographic coverage of the ROI as the primary objective, while treating quality selection and redundancy control as secondary optimization goals, providing a reliable guarantee for critical coverage tasks in practical operations. It is observed that when (pure area-driven), the algorithm tends to achieve maximum coverage with the minimum number of images (minimum NSI), though the AQS remains at a high level (indicating relatively poorer quality). As increases, AQS decreases significantly and eventually stabilizes, at the cost of a slight increase in NSI or minor adjustments in RR. This indicates that effectively guides the algorithm in finding a balance between “minimum quantity” and “optimal quality.” In practical applications, users can adjust based on task requirements: a smaller can be set for census tasks with high timeliness requirements, while a larger should be used for precision quantitative inversion tasks to obtain a higher-quality candidate set.
5.4. Generality, Synergy, and Robustness of the SCOPES Framework
Extended validation using Landsat data at the intercontinental scale in South America proves that the SCOPES framework possesses sensor generalization capability. Since the algorithm is based on continuous space modeling and directly processes image footprints—rather than relying on specific orbital models or grid—SCOPES is inherently adaptable to heterogeneous satellite data with different swath widths and orbital parameters.
The multi-source data synergy experiment in the Sichuan region verifies the capability of SCOPES to handle multi-source data in operational applications. The iterative selection mechanism allows the algorithm to accurately identify coverage gaps based on existing archival images and perform incremental filling using heterogeneous images. This cross-platform adaptability enables SCOPES to support various complex monitoring tasks, including the fusion of infrared and visible light data [43].
Data thinning tests in the Sichuan and Xinjiang experimental areas further reveal the performance characteristics of the SCOPES framework in non-ideal data environments. In scenarios with sparse image resources, SCOPES can identify and eliminate residual minor overlaps, ensuring that AQS remains at the same level as, or slightly optimized compared to, the original sampled set within a limited selection space. This proves that the cost function exerts an effective guiding role across different data densities. Regardless of data sparsity, the optimized ECR always remains consistent with the maximum coverage capacity provided by the current candidate set. This phenomenon indicates that the incremental gap repair mechanism of SCOPES possesses reliable geographic completeness when handling fragmented and sparse footprint distributions, never sacrificing existing spatial coverage to reduce redundancy. When the sampling rate drops to extremely low levels (e.g., 5%), the optimized set exhibits a tendency to regress toward the candidate set, as evidenced by the NSI and RR values stabilizing near the levels of the initial candidate images. This behavior reflects the diminishing marginal effect of algorithmic optimization under sparse footprint distributions; in such cases, the algorithm retains almost all available images to ensure the maximum attainable coverage of the ROI, rather than sacrificing potential coverage for lower redundancy.
5.5. Limitations and Future Research
Although SCOPES demonstrates advantages in redundancy control and computational efficiency, limitations still exist. The current version treats spatial redundancy as a negative factor to be avoided, failing to consider explicit requirements for moderate image overlap in tasks such as photogrammetric mapping. Future research will explore introducing configurable minimum overlap constraints in the cost function and developing adaptive redundancy control strategies. In terms of image quality assessment, the general normalization framework adopted in this study (Equation (1)) is designed with good scalability and can flexibly incorporate different quality metrics to adapt to specific application requirements. Current experiments adopt cloud coverage and timestamp as core metrics, mainly considering their universality and acquisition convenience in large-scale remote sensing applications. Future research can explore incorporating supplementary quality factors such as solar elevation angle, atmospheric conditions, and image contrast into the cost function to further optimize image selection results in specific scenarios. Additionally, determining how to efficiently process multi-source heterogeneous datasets within a unified framework is an important topic for the future. Although current SCOPES supports users in adopting priority progressive selection strategies to handle multi-source data, effectively circumventing complex cross-sensor normalization challenges in the algorithm process, we clearly recognize the limitations of this strategy—its sequential execution may not fully utilize the complementarity between different data sources. In the future, we will explore joint selection strategies based on multi-objective optimization to achieve collaborative coverage and quality balance of multi-source data. Furthermore, while SCOPES currently relies on a heuristic-based spatial optimization framework, there is significant potential in integrating deep learning models to enhance its intelligent decision-making capabilities. Future work will investigate the use of reinforcement learning or graph neural networks to learn optimal selection patterns from historical archival data, potentially replacing or augmenting hand-crafted cost functions. This integration could enable the framework to adaptively perceive complex scene features and sensor characteristics, thereby improving its robust performance in processing massive, high-dimensional, and heterogeneous remote sensing datasets.
6. Conclusions
This paper addresses the core challenges in large-scale remote sensing image selection tasks and proposes the SCOPES framework. Through the organic combination of continuous space modeling, lazy greedy algorithm, and spatial redundancy optimization mechanism, SCOPES achieves a multi-objective balance of redundancy control, computational efficiency, and image quality while ensuring coverage completeness. In experimental validation across four representative regions, SCOPES demonstrates comprehensive performance superior to baseline methods: maximum coverage consistent with original data (90.92–99.94%), significantly fewer images (average reduction of 8–25%), lower redundancy (RR values reduced by 18–50%), and higher computational efficiency (improvements of 53–72%). Crucially, as an intelligent decision-support tool, SCOPES streamlines the path from “massive candidates” to “refined recommendations,” offering users a high-quality starting point while subsantially mitigating the manual selection workload. Future research will mainly focus on addressing two major challenges: first, enhancing the algorithm’s adaptability to specific tasks such as mosaic mapping by introducing configurable overlap constraints and expanding supplementary quality factors such as solar elevation angle and atmospheric conditions; second, exploring joint selection strategies based on multi-objective optimization to overcome the limitations of current progressive selection and achieve collaborative optimization of multi-source heterogeneous data. Additionally, we will explore the deep integration of deep learning models with heuristic spatial optimization, leveraging the potential of neural networks in complex pattern recognition to enhance the algorithm’s intelligent perception and decision-making capabilities in large-scale heterogeneous data environments.
Author Contributions
H.F. designed the experiments and wrote the manuscript; W.L. supervised the study and reviewed the draft; S.L. revised the manuscript and gave some appropriate suggestions. All authors have read and agreed to the published version of the manuscript.
Funding
This research was funded by Hainan Provincial Natural Science Foundation of China (624MS124).
Data Availability Statement
The data presented in this study are available upon request from the corresponding author. The data are not publicly available due to institutional confidentiality.
Acknowledgments
We thank the China Remote Sensing Satellite Ground Station for providing remote sensing metadata and for supporting this experiment.
Conflicts of Interest
The authors declare no conflicts of interest.
References
- Limon, J. Remote Sensing in Climate Science: A Tool for Global Monitoring and Analysis. J. Remote Sens. GIS 2024, 13, 1–2. [Google Scholar]
- Wang, Y.; Sun, Y.; Cao, X.; Wang, Y.; Zhang, W.; Cheng, X. A review of regional and Global scale Land Use/Land Cover (LULC) mapping products generated from satellite remote sensing. ISPRS J. Photogramm. Remote Sens. 2023, 206, 311–334. [Google Scholar] [CrossRef]
- Zhang, M.; Chen, Z.; Wang, J.; Kar, B.; Pierce, M.; Tiampo, K.; Eguchi, R.; Glasscoe, M. Optical Remote Sensing for Global Flood Disaster Mapping: A Critical Review Towards Operational Readiness. Remote Sens. 2025, 17, 1886. [Google Scholar] [CrossRef]
- Gyang, P.; Donkor, A. A Review of the use of GIS and Remote Sensing Technologies in Monitoring, Prediction, and Response to Natural Disasters in the U.S. Int. J. Res. Publ. Rev. 2024, 5, 5976–5983. [Google Scholar]
- Guanhua, X.U.; Qinhuo, L.I.U.; Liangfu, C.; Liangyun, L.I.U. Remote sensing for China’s sustainable development: Opportunities and challenges. Natl. Remote Sens. Bull. 2021, 20, 679–688. [Google Scholar] [CrossRef]
- Dritsas, E.; Trigka, M. Remote Sensing and Geospatial Analysis in the Big Data Era: A Survey. Remote Sens. 2025, 17, 550. [Google Scholar] [CrossRef]
- MODIS/Terra Surface Reflectance Daily L3 Global 0.05Deg CMG V006 | NASA Earthdata. Available online: https://ladsweb.modaps.eosdis.nasa.gov/missions-and-measurements/products/MOD09CMG (accessed on 14 December 2025).
- Sentinel-2 Global Mosaic Service. Available online: https://www.earthdata.nasa.gov/data/catalog/lpcloud-mod09cmg-006 (accessed on 14 December 2025).
- DigitalGlobe. Available online: https://evwhs.digitalglobe.com (accessed on 14 December 2025).
- China National Platform for Remote Sensing Data and Application Services. Available online: https://www.cpeos.org.cn (accessed on 14 December 2025).
- He, F.; Huang, X.; Ma, J.; Wang, D.; Jiang, H. Single Time Phase and Full Coverage Retrieval Method of Remote Sensing Data Based on Space Secondary Filter. J. Henan Univ. Nat. Sci. Ed. 2017, 47, 287–292. (In Chinese) [Google Scholar] [CrossRef]
- Yu, X.; Pan, J.; Chen, S.; Wang, M. A flexible multi-temporal orthoimage mosaicking method based on dynamic variable patches. Inf. Fusion 2024, 108, 102350. [Google Scholar] [CrossRef]
- Yan, X.; Liu, S.; Liu, W.; Dai, Q. An improved coverage-oriented retrieval algorithm for large-area remote sensing data. Int. J. Digit. Earth 2022, 15, 606–625. [Google Scholar] [CrossRef]
- Yang, K.; Zhang, L.; Wu, J.; Qian, J. Precise Retrieval of Sentinel-1 Data by Minimizing the Redundancy with Greedy Algorithm. IEEE J. Sel. Top. Appl. Earth Obs. Remote Sens. 2024, 17, 19478–19486. [Google Scholar] [CrossRef]
- Li, X.; Liu, S.; Liu, W. Remote Sensing Image Retrieval Algorithm for Dense Data. Remote Sens. 2023, 16, 98. [Google Scholar] [CrossRef]
- Tao, P.; Xi, K.; Niu, Z.; Chen, Q.; Liao, Y.; Liu, Y.; Liu, K.; Zhang, Z. Optimal selection from extremely redundant satellite images for efficient large-scale mapping. ISPRS J. Photogramm. Remote Sens. 2022, 194, 21–38. [Google Scholar] [CrossRef]
- Aptoula, E. Remote Sensing Image Retrieval with Global Morphological Texture Descriptors. IEEE Trans. Geosci. Remote Sens. 2014, 52, 3023–3034. [Google Scholar] [CrossRef]
- Göksu, Ö.; Aptoula, E. Content based image retrieval of remote sensing images based on deep features. In Proceedings of the 2018 26th Signal Processing and Communications Applications Conference (SIU), Izmir, Turkey, 2–5 May 2018; pp. 1–4. [Google Scholar] [CrossRef]
- Ghanbarzadeh, A.; Soleimani, H. Self-supervised in-domain representation learning for remote sensing image scene classification. Heliyon 2024, 10, e37962. [Google Scholar] [CrossRef] [PubMed]
- Khelifi, L.; Mignotte, M. Deep Learning for Change Detection in Remote Sensing Images: Comprehensive Review and Meta-Analysis. IEEE Access 2020, 8, 126385–126400. [Google Scholar] [CrossRef]
- Moreno, G.M.d.S.; de Carvalho Júnior, O.A.; de Carvalho, O.L.F.; Andrade, T.C. Deep semantic segmentation of mangroves in Brazil combining spatial, temporal, and polarization data from Sentinel-1 time series. Ocean Coast. Manag. 2023, 231, 106381. [Google Scholar] [CrossRef]
- Shekhar, S.; Chawla, S.; Ravada, S.; Fetterer, A.; Liu, X.; Lu, C.-T. Spatial databases-accomplishments and research needs. IEEE Trans. Knowl. Data Eng. 1999, 11, 45–55. [Google Scholar] [CrossRef]
- Gaede, V.; Günther, O. Multidimensional access methods. ACM Comput. Surv. 1998, 30, 170–231. [Google Scholar] [CrossRef]
- Li, F.; You, S.; Wei, H.; Wei, E.; Chen, L. Optimal Dataset Selection Model for Regional Coverage of Remote Sensing Images. Radio Eng. 2017, 47. (In Chinese) [Google Scholar]
- Kempeneers, P.; Soille, P. Optimizing Sentinel-2 image selection in a Big Data context. Big Earth Data 2017, 1, 145–158. [Google Scholar] [CrossRef]
- Pan, J.; Chen, L.; Shu, Q.; Zhao, Q.; Yang, J.; Jin, S. Spatiotemporal imagery selection for full coverage image generation over a large area with HFA-Net based quality grading. Geo-Spat. Inf. Sci. 2023, 27, 1524–1541. [Google Scholar] [CrossRef]
- Côté, G.; Laughton, M.A. Large-scale mixed integer programming: Benders-type heuristics. Eur. J. Oper. Res. 1984, 16, 327–333. [Google Scholar] [CrossRef]
- Ejaz, N.; Choudhury, S. A Comprehensive Survey of Linear, Integer, and Mixed-Integer Programming Approaches for Optimizing Resource Allocation in 5G and Beyond Networks. arXiv 2025, arXiv:2502.15585. [Google Scholar] [CrossRef]
- Wu, J.; Li, H.; Luo, L.; Ou, J.; Zhang, Y. Multiobjective Optimization Strategy of WSN Coverage Based on IPSO-IRCD. J. Sens. 2022, 2022, 7483148. [Google Scholar] [CrossRef]
- Kumari, S.; Srirangarajan, S. Node Placement and Path Planning for Improved Area Coverage in Mixed Wireless Sensor Networks. IEEE Robot. Autom. Lett. 2024, 9, 6800–6807. [Google Scholar] [CrossRef]
- Taus, L.; Tsai, Y.H.R. Optimizing Sensor Network Design for Multiple Coverage. arXiv 2024, arXiv:2405.09096. [Google Scholar] [CrossRef]
- Yakovlev, S.; Shekhovtsov, S.; Kirichenko, L.; Matsyi, O.; Podzeha, D.; Chumachenko, D. Continuous Maximum Coverage Location Problem with Arbitrary Shape of Service Areas and Regional Demand. Symmetry 2025, 17, 676. [Google Scholar] [CrossRef]
- Byrne, T.; Kalcsics, J. Conditional facility location problems with continuous demand and a polygonal barrier. Eur. J. Oper. Res. 2022, 296, 22–43. [Google Scholar] [CrossRef]
- Wu, G.; Luo, Q.; Du, X.; Chen, Y.; Suganthan, P.N.; Wang, X. Ensemble of Metaheuristic and Exact Algorithm Based on the Divide-and-Conquer Framework for Multisatellite Observation Scheduling. IEEE Trans. Aerosp. Electron. Syst. 2022, 58, 4396–4408. [Google Scholar] [CrossRef]
- Xu, Y.; Liu, X.; He, R.; Chen, Y.; Chen, Y. Multi-Satellite Scheduling Framework and Algorithm for Very Large Area Observation. In Proceedings of the 2018 IEEE Congress on Evolutionary Computation (CEC), Rio de Janeiro, Brazil, 8–13 July 2018; pp. 1–8. [Google Scholar] [CrossRef]
- Gu, Y.; Han, C.; Chen, Y.; Liu, S.; Wang, X. Large Region Targets Observation Scheduling by Multiple Satellites Using Resampling Particle Swarm Optimization. IEEE Trans. Aerosp. Electron. Syst. 2023, 59, 1800–1815. [Google Scholar] [CrossRef]
- Lu, Z.; Shen, X.; Li, D.; Li, D.; Chen, Y.; Wang, D.; Shen, S. Multiple super-agile satellite collaborative mission planning for area target imaging. Int. J. Appl. Earth Obs. Geoinf. 2023, 117, 103211. [Google Scholar] [CrossRef]
- Yang, X.; Yan, J. Research on Optimal Region Covering Algorithm for ZY-3 Satellite Image. J. Geomat. 2019, 44, 71–74. [Google Scholar] [CrossRef]
- Chu, B.; Gao, F.; Chai, Y.; Liu, Y.; Yao, C.; Chen, J.; Wang, S.; Li, F.; Zhang, C. Large-Area Full-Coverage Remote Sensing Image Collection Filtering Algorithm for Individual Demands. Sustainability 2021, 13, 13475. [Google Scholar] [CrossRef]
- Khuller, S.; Moss, A.; Naor, J.S. The budgeted maximum coverage problem. Inf. Process. Lett. 1999, 70, 39–45. [Google Scholar] [CrossRef]
- Minoux, M. Accelerated greedy algorithms for maximizing submodular set functions. In Optimization Techniques; Stoer, J., Ed.; Springer: Berlin/Heidelberg, Germany, 1978; Volume 7, pp. 234–243. [Google Scholar] [CrossRef]
- Leskovec, J.; Krause, A.; Guestrin, C.; Faloutsos, C.; VanBriesen, J.; Glance, N. Cost-effective outbreak detection in networks. In KDD ’07: Proceedings of the 13th ACM SIGKDD International Conference on Knowledge Discovery and Data Mining; Association for Computing Machinery: New York, NY, USA, 2007; pp. 420–429. [Google Scholar] [CrossRef]
- Li, L.; Shi, Y.; Lv, M.; Jia, Z.; Liu, M.; Zhao, X.; Zhang, X.; Ma, H. Infrared and Visible Image Fusion via Sparse Representation and Guided Filtering in Laplacian Pyramid Domain. Remote Sens. 2024, 16, 3804. [Google Scholar] [CrossRef]


Disclaimer/Publisher’s Note: The statements, opinions and data contained in all publications are solely those of the individual author(s) and contributor(s) and not of MDPI and/or the editor(s). MDPI and/or the editor(s) disclaim responsibility for any injury to people or property resulting from any ideas, methods, instructions or products referred to in the content. |
© 2026 by the authors. Licensee MDPI, Basel, Switzerland. This article is an open access article distributed under the terms and conditions of the Creative Commons Attribution (CC BY) license.