Highlights
What are the main findings?
- Sentinel-1 InSAR time series shows heterogeneous subsidence and uplift across the Beijing Plain during 2014–2024, driven by groundwater changes and modulated by faulting.
- From 2015–2021, most major roads and runways were stable, but PEK’s middle runway shows abnormal gradients, indicating potential risk.
What are the implications of the main findings?
- The land subsidence in Beijing has been effectively controlled by the water resource management policy from local and regional governments.
- The deformation gradient from high-resolution spaceborne InSAR is a powerful indicator of structural risks in large-scale transportation infrastructure.
Abstract
Transportation infrastructure is vulnerable to heterogeneous deformation, yet such deformation remains insufficiently monitored and characterized in metropolitan regions due to the lack of high-resolution deformation gradient products and comparison with industrial standards. Here, we generated a 45 m resolution interferometric synthetic aperture radar (InSAR) surface displacement time series across the Beijing Plain using Sentinel-1 SAR imagery acquired between 2014 and 2024, and calculated deformation gradients along all ring roads, major expressways, and airport runways. These deformation gradients are compared with national standards to evaluate their structural risks. Our analysis shows that (1) subsidence in the Beijing Plain is concentrated in the northern, eastern, and southern regions, where the northeastern region has been uplifting since 2018 due to the groundwater recovery in Beijing; (2) all ring roads, expressways, and airport runways are relatively stable during our observation period of 2015–2021, except for the central runway of Beijing Capital International Airport, which has accumulated a deformation gradient of 1.9‰ during 2015–2021, exceeding the safety limit of 1.5‰, indicating structural risks. These results demonstrate the effectiveness of high-resolution InSAR time series for monitoring deformation and pinpointing potential structural risks.
1. Introduction
Transportation infrastructure—including highways, bridges, railways, and airport runways—constitutes the backbone of urban mobility and regional economic development. Its structural integrity and long-term stability are essential for ensuring transportation safety, operational efficiency, and urban resilience [1,2]. Throughout their service life, these systems are subjected to traffic loading, environmental variations, and geological processes, which can induce multiple deformation behaviors [3]. Among these, differential settlement is particularly detrimental because it promotes stress concentration and structural damage [4], leading to hazards such as pavement cracking, reduced bridge serviceability, and runway unevenness that threatens aircraft operations [5]. Consequently, reliable and continuous deformation monitoring is indispensable for structural assessment, early warning, and informed infrastructure management [6]. Traditional geodetic techniques—such as leveling, global navigation satellite system (GNSS), total-station surveying, and inclinometer measurements—provide high accuracy but rely on sparse observation points, entail high operational costs, and lack temporal continuity [6]. These limitations restrict their applicability to large-scale or corridor-wide monitoring in rapidly developing megacities. This drives the demand for a spatially continuous, temporally dense, and highly reliable monitoring technique to support infrastructure safety evaluation and data- driven decision making.
Interferometric synthetic aperture radar (InSAR) has emerged as a powerful solution to this challenge. By exploiting phase differences between repeat-pass SAR acquisitions, InSAR enables millimeter-level deformation measurements across large areas under all-weather, day–night observation conditions [7,8,9]. With its operational capability increasingly established, time-series InSAR has been widely applied to urban subsidence monitoring [10,11,12] and infrastructure-related deformation detection, including buildings [13,14], bridges [15,16], highways [17,18], railways [19,20], sea dikes [21], and dams [22]. These applications demonstrate the strong potential of InSAR for corridor-scale infrastructure monitoring.
Beyond detecting deformation patterns, recent research has increasingly emphasized the extraction of structure-scale deformation indicators—such as deflection, angular strain, and settlement gradients—to provide more refined and engineering-relevant assessments of infrastructure performance. Representative studies include bridge deflection monitoring [23], the identification of expressway deformation hotspots across U.S. metropolitan areas [24], strain-based analysis of airport runways [25], and settlement gradient mapping along metro systems in Mexico City and Beijing [26,27,28]. While these studies highlight the growing analytical capability of time-series InSAR, the thresholds used to interpret these indicators typically rely on empirical classifications or statistical distributions. They are not usually based on the allowable deformation limits specified in engineering standards for roads, bridges, and airport pavements. This disconnect limits the practical applicability of InSAR-derived metrics in engineering decision making, particularly for determining whether observed deformation has reached critical or unacceptable levels. To address this gap, this study explores a route-scale assessment approach in which InSAR-derived indicators are interpreted directly within the framework of engineering specifications, providing an initial step toward more actionable infrastructure safety evaluations.
Beijing provides a representative environment for implementing and demonstrating this approach. As China’s political and economic center, the reliable functioning of its transportation system carries national-level importance [29]. Beijing hosts an extensive and complex transportation network composed of multiple ring roads, expressways, and two international airports, spanning diverse structural types and construction periods. These features render it particularly sensitive to differential settlement. Meanwhile, decades of groundwater extraction and subsequent replenishment have produced characteristic geological conditions—including subsidence funnels and heterogeneous settlement zones—that continue to shape the city’s deformation pattern [30]. Additionally, Beijing benefits from long-term, high-quality Sentinel-1 InSAR observations and comprehensive groundwater monitoring records [31], offering a robust foundation for corridor-scale subsidence characterization. This study employs a nearly decade-long time-series InSAR dataset (2014–2024) from C-band Sentinel-1 to characterize the spatially heterogeneous subsidence across Beijing and quantify differential settlement along major transportation corridors using settlement gradients. By linking these InSAR-derived indicators with engineering specifications, the study provides a practical reference basis for future safety assessments of linear transportation infrastructure.
2. Study Area
The study area is situated in the plain region of Beijing, where the overall topography slopes from northwest to southeast [32]. The northern part lies at the foothills of the Yanshan Mountains, the western boundary adjoins the piedmont zone of the Taihang Mountains, and the southeastern portion consists of extensive alluvial plains formed by the Yongding, Chaobai, and North Grand Canal river systems (Figure 1b). This transition from mountainous terrain to plains, combined with a complex hydrogeological setting dominated by groundwater supply, makes the region highly susceptible to land subsidence [30,33]. Geologically, the Beijing Plain is mainly composed of thick Quaternary unconsolidated deposits, with thicknesses generally ranging from 100 to 600 m (Figure 1d). The stratigraphy consists of alternating layers of clay, silt, and fine sand. The area contains three primary confined aquifers (I–III) and a shallow phreatic aquifer, which together form the main groundwater system [34].
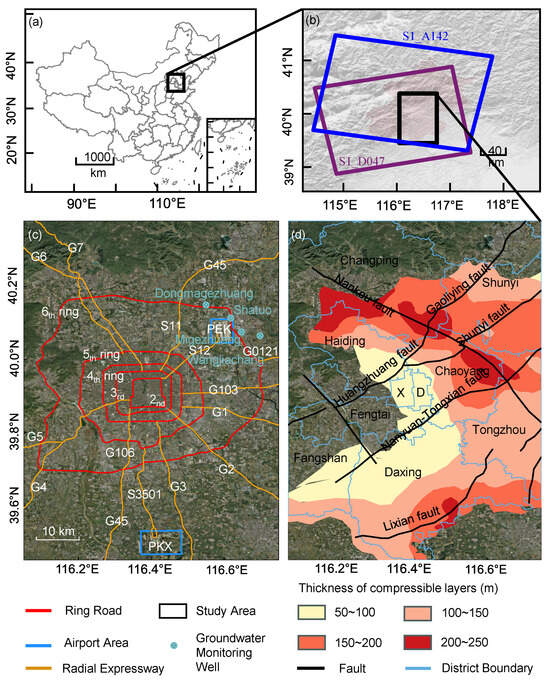
Figure 1.
Geographic setting of the Beijing Plain and key factors relevant to land subsidence. (a) Location of the Beijing metropolitan area within China. (b) Coverage of the Sentinel-1 ascending track 142 and descending track 47 used for time-series InSAR monitoring, with the black box marking the study area. (c) Transportation framework and major infrastructure within the study region, including the Second to Sixth Ring Roads, radial expressways (e.g., G2, G4, G6), groundwater monitoring wells, and the locations of Beijing Capital International Airport (PEK) and Beijing Daxing International Airport (PKX). (d) Thickness distribution of compressible Quaternary sediments and major active faults across the Beijing Plain. Boundaries of administrative districts are also shown.
Since the 1970s [35], intensive groundwater extraction to meet urban and agricultural demands has caused significant consolidation of highly compressible clay layers, triggering widespread land subsidence. Since 2014, the implementation of the South-to-North Water Diversion Project and groundwater extraction control policies has promoted a gradual rise in groundwater levels, effectively mitigating regional subsidence [36]. Nevertheless, spatial variations in subsidence remain evident across the plain [32]. The locations of the groundwater monitoring wells used in this study are shown in Figure 1c, and the groundwater-level observations were obtained from the Beijing Water Authority.
Beijing’s road transportation network is organized around a framework of ring roads and radial expressways, forming a characteristic “ring–radial’’ pattern (Figure 1a). The Second to Sixth Ring Roads were constructed sequentially outward from the city center, with their total lengths increasing from 32.7 km to 192 km, thereby linking the urban core with surrounding new towns. The radial expressways—including the Beijing–Lhasa (G6), Beijing–Shanghai (G2), and Beijing–Hong Kong–Macau (G4) corridors—constitute key components of the national trunk network and play an essential role in supporting urban economic growth and spatial expansion. The two major international airports, PEK and PKX, represent critical nodes within this transportation system. PEK, located in Shunyi District in the northeast, completed its third-phase expansion in 2008 and is notably affected by concealed fault structures [12,37,38]. PKX, situated in Daxing District to the south and operational since 2019, is underlain by thick layers of silty clay and artificial fill (Table 1). Both the ring–radial transportation framework and the two airport zones constitute key areas of uneven subsidence analyzed in this study.

Table 1.
Overview of ring roads, expressways, and airport runways.
3. Data and Methods
Our InSAR data processing and analysis workflow is illustrated in Figure 2. We generated stacks of unwrapped interferograms using the stack processor within the ISCE-2 software (v2.6.x) [39,40], and derived the deformation time series and velocity maps using the MintPy software (v1.6.x) [41]. The ascending and descending velocity results were then used to calculate cumulative subsidence and gradient values along the ring roads, expressways, and airport runways.
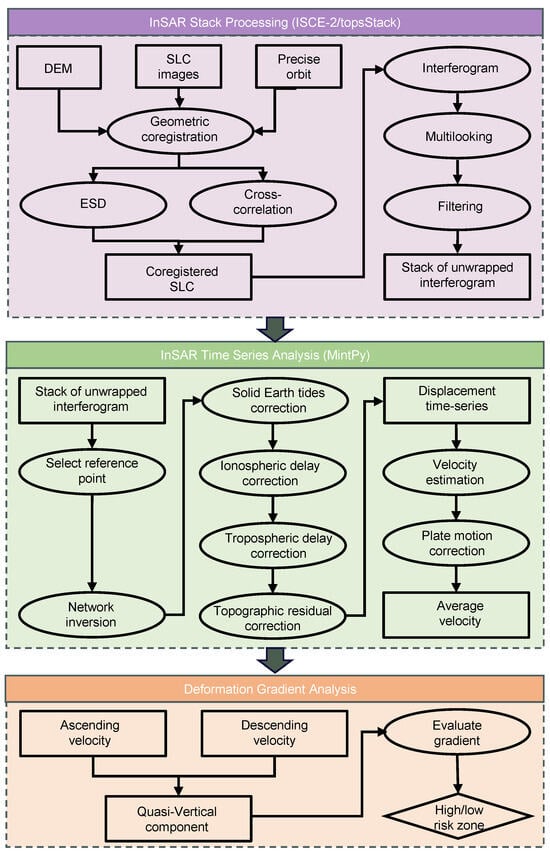
Figure 2.
Workflow of InSAR data processing and analysis. The workflow consists of three main steps: (1) generation of unwrapped interferogram stacks using ISCE-2, (2) derivation of deformation velocity fields using MintPy, and (3) identification of potential risk zones based on ascending and descending velocities.
3.1. SAR Dataset
The study area extends from 39.46°N to 40.38°N and from 116.05°E to 116.75°E. Figure 1b shows the spatial coverage of the Sentinel-1 SAR images used in this study. A total of 237 ascending-track Single Look Complex (SLC) images acquired during 2014–2024 and 153 descending-track SLC images acquired during 2015–2021 were collected, as summarized in Table 2. No Sentinel-1 descending-track data were available after 2021 due to the loss of the Sentinel-1B satellite at the end of 2021 [42].
Table 2.
Summary of Sentinel-1 imagery used in this study.
3.2. InSAR Data Processing
We co-registered the Sentinel-1 Level-1 SLC images using the topsStack processor within the ISCE-2 software [39,40]. The co-registration procedure included (1) geometric registration based on precise orbit information and an external digital elevation model (DEM) [43], (2) refined co-registration using the network-enhanced spectral diversity method [39] in the azimuth direction, and cross-correlation in the range direction [9]. The 1-arcsecond SRTM DEM [44] was employed to remove topographic and Earth-curvature-related phase contributions, resulting in a co-registered SLC stack. Subsequently, an interferogram network with a maximum sequential connection number of five was constructed. Each interferogram was multilooked by 3 × 9 pixels in the range and azimuth directions and filtered using a Goldstein filter with a filtering strength of 0.8. Two-dimensional phase unwrapping was performed using the minimum-cost flow algorithm implemented in SNAPHU [45].
Based on the stacks of unwrapped interferograms, the small baseline subset (SBAS) method implemented in MintPy [41] was applied to construct the temporal inversion network. To ensure a stable deformation baseline, we selected a coherent and temporally stable reference pixel located near the area of interest. High coherence guarantees a reliable and low-noise phase history, while choosing a nearby reference reduces the influence of distance-dependent tropospheric variability, minimizing atmospheric residuals [41,46]. The line-of-sight (LOS) raw phase time series was then obtained using a weighted least-squares inversion with the inverse of the phase variance as the weight for each pixel, where = is an N-dimensional column vector, and the corresponding time vector is . The observed phase of each pixel can be written as
where denote the deformation phase, tropospheric delay, ionospheric delay, solid Earth tide phase, residual topographic phase, and noise at the i-th acquisition time, respectively.
To correct the solid Earth tides induced by the Sun and Moon, the PySolid package (v0.3.3) [47,48] was applied following the IERS 2010 Conventions. The long-wavelength ionospheric delay was removed using the global ionospheric maps derived from GNSS observations [49], which can be expressed as
where is the total electron content at , K is a constant, and is the radar carrier frequency.
To reduce the medium-to-long-wavelength tropospheric effects, ERA5 reanalysis data [50] were used to calculate the delay along the LOS using PyAPS (v0.3.4) [51]. The corresponding phase term is
where is the tropospheric path delay, is the radar carrier wavelength, and is the atmospheric refractivity. We also tested the tropospheric correction using GACOS zenith total delay products [52], which yielded results similar to the ERA5-based PyAPS results (Supplementary Figure S6).
Residual topographic phase due to DEM errors was corrected using the correlation between residual phase and the temporal sequence of perpendicular baselines [53], as follows:
where is the perpendicular baseline, r is the slant range, is the incidence angle, and is the DEM error.
After applying all corrections, the LOS deformation rate was estimated using a linear least-squares regression of the final displacement time series [46,54], as follows:
where is the LOS linear deformation rate, and is a constant offset. Long-wavelength deformation due to rigid plate rotation was further removed using the ITRF2014 plate motion model [55,56], which was projected into the LOS direction and subtracted from the observed deformation field [57].
3.3. Spatial Heterogeneity Analysis Method
Based on the ascending and descending LOS velocities, the vertical deformation rate was obtained by solving the linear system using a least-squares inversion [58,59], which can be expressed as
where and are the incidence angles of the ascending and descending tracks, is the vertical deformation rate, and is the horizontal deformation component within the radar look-direction plane. Orbital errors were not corrected due to their insignificant influence on the estimated velocity when using the precise Sentinel-1 orbits [60].
To characterize the spatial variability of ground settlement and to explicitly capture the heterogeneous deformation patterns relevant to linear transportation infrastructure, the cumulative settlement over a time interval is derived from the vertical deformation rate field as
The spatial heterogeneity of settlement is quantified through the gradient of the two-dimensional settlement field, as follows:
where and denote the unit vectors in the x- and y-directions. The gradient vector reflects both the magnitude and the direction of spatial variations in settlement, and therefore provides a direct measure of the spatial heterogeneity contained in the deformation field.
For each linear engineering structure, the orientation of its centerline is represented by the unit vector . The settlement variation relevant to structural performance is quantified by projecting the gradient vector onto this direction:
The indicator G characterizes the degree of heterogeneous deformation along the structure, with larger values indicating stronger spatial variability and more profound differential settlement. Such heterogeneity can increase bending curvature, strain, and internal forces, potentially leading to local stress concentration and safety risks. To ensure temporal consistency, only the overlapping observation period of the ascending and descending Sentinel-1 datasets (July 2015–November 2021) was used. The deformation time series was generated following the workflow in Section 3.2, and vertical settlement velocities were obtained by decomposing the LOS measurements.
To suppress local noise and outliers and ensure accurate and continuous extraction of deformation characteristics, pixels within m of each engineering centerline were selected. This buffer width provides sufficient high-coherence pixels to improve the signal-to-noise ratio and reduce systematic errors in gradient estimation, while avoiding an overly wide buffer that would introduce deformation signals from surrounding areas rather than the infrastructure itself. In addition, given the ∼45 m spatial resolution of Sentinel-1, the exact locations of individual scatterers cannot be precisely determined; therefore, a moderate buffer is necessary to reliably capture deformation associated with the infrastructure corridor. The median vertical settlement rate of these pixels was used to represent the settlement velocity at each position along the line, from which a continuous settlement profile was constructed. Based on this profile, cumulative settlement was computed, and the spatial distribution of settlement gradients was derived using Equations (7)–(9). The cumulative settlement and settlement-gradient profiles in Figure 3 are entirely derived from the InSAR-estimated vertical deformation field (Section 3.1, Section 3.2 and Section 3.3). The engineering specifications cited later provide only threshold values for comparison and do not constitute data inputs.
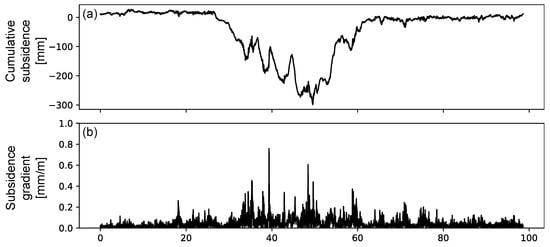
Figure 3.
Cumulative settlement (a) and settlement gradient (b) along the Beijing Fifth Ring Road during 2015–2021. The eastern segment (30–60 km) shows the largest cumulative settlement (∼300 mm), while all settlement gradients remain below 0.8‰.
Threshold values for differential settlement gradients were evaluated according to relevant engineering specifications. For expressways, the “Specifications for Design of Highway Subgrades” (JTG D30–2015) [61] specify a maximum allowable non-uniform settlement of 3‰ (≈3 mm/m). Although primarily intended for construction quality control, these thresholds are adopted here for stability assessment. For airport runways, the “Code for Geotechnical Design of Civil Airports” (MH/T 5027–2013) [62] specifies an allowable differential settlement rate of 1.0–1.5‰. By comparing measured gradients against these limits, structurally critical segments can be identified, enabling assessment of potential risks and supporting maintenance and mitigation planning. As an example, Figure 3 shows a profound subsidence trough along the eastern section (30–60 km) of the Beijing Fifth Ring Road.
4. Land Subsidence Analysis
4.1. Validation of InSAR Time Series Using GNSS Measurements
We use three publicly available GNSS stations (BJFS, BJMT, and IMEJ) in Beijing to validate our InSAR displacement time series results, as shown in Figure 4. Because both InSAR and GNSS provide relative displacement measurements—InSAR with respect to the reference pixel selected during interferometric processing (Figure 5) and GNSS with respect to a stable ground station—their time series must be expressed in a common reference frame before comparison. We downloaded the GNSS daily solutions from the University of Nevada, Reno [63]; croped them in time to overlap with the InSAR time series; and then projected the three-dimensional GNSS displacement time series in the east, north, and up directions into the radar LOS direction. We choose the BJFS station as the spatial reference and the first valid GNSS observations as the temporal reference. Note that we use the GNSS time series at BJFS starting from 1 January 2016 to avoid equipment-related offsets. We then derive relative GNSS displacement by differencing each target station with BJFS. This station-by-station differencing ensures that no GNSS observations are merged and that all series are expressed within a consistent reference frame. To obtain the corresponding InSAR displacement for each station, we select pixels within a 200 m radius, remove pixels with temporal coherence below 0.9, and take the median value. The InSAR series are then referenced to BJFS in the same manner as the GNSS data. After unifying the reference frame, the GNSS displacement time series are smoothed and interpolated to the InSAR acquisition epochs. Figure 4 shows that the two datasets agree well, with root-mean-square error (RMSE) values of 6.8 and 8.9 mm, demonstrating the millimeter-level accuracy of the derived InSAR time series. The remaining discrepancies at station BJMT may be related to the relatively low temporal coherence of InSAR pixels around BJMT due to decorrelation from vegetation and to non-closure phase bias caused by changes in dielectric properties [64,65].
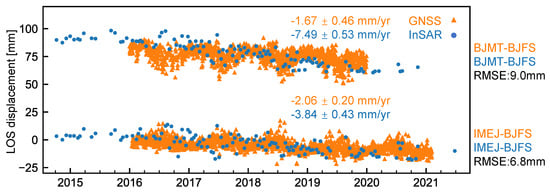
Figure 4.
Comparison of GNSS and InSAR LOS displacement time series. Spatial reference: BJFS station. Temporal reference for GNSS: the first date with valid observation. The InSAR time series is shifted by its median difference with the GNSS time series. All GNSS observations are plotted with orange triangles and all InSAR observations with blue circles. The time series of BJMT–BJFS is further shifted by 75 mm for display purposes. The locations of GNSS stations are shown in Figure 1b.
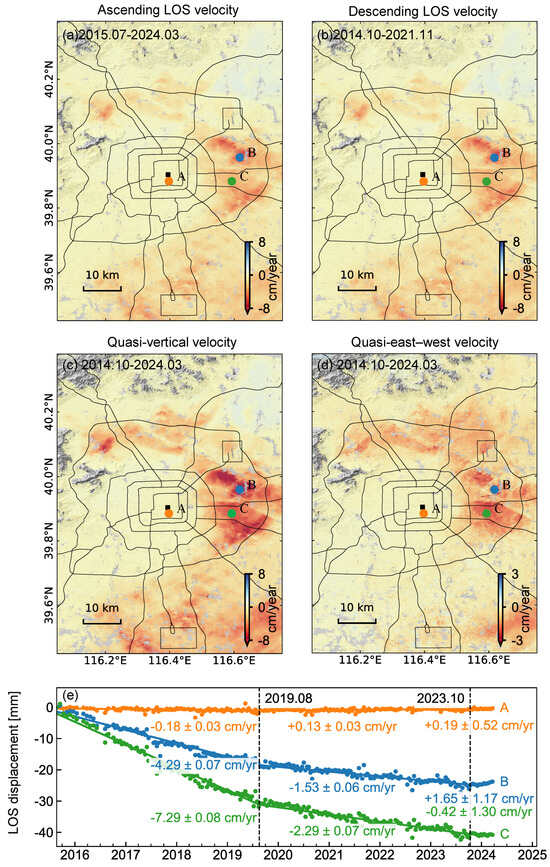
Figure 5.
InSAR-derived deformation velocity maps and time series analysis of the study area. (a) Ascending LOS velocity from 30 July 2015 to 20 March 2024. (b) Descending LOS velocity from 8 October 2014 to 30 November 2021. (c) Quasi-vertical deformation velocity. (d) East–west deformation velocity. (e) Time series deformation of characteristic points (A, B, and C). Negative values indicate subsidence, and positive values indicate uplift. Black squares mark the reference point (39.904°N, 116.394°E).
4.2. Ground Deformation in the Beijing Plain
Figure 5a,b show the InSAR results derived from the ascending and descending orbits, respectively. They exhibit a highly consistent spatial pattern of land deformation across the Beijing Plain. Minor differences in subsidence rates between the two datasets are primarily caused by the different viewing geometry and, to a lesser extent, by their slightly different temporal coverage. Central and western Beijing remain very stable, while the major subsiding areas are located in the northern, eastern, and southern parts of the city, including the Chaoyang, Yizhuang, Shunyi, and Changping districts. The maximum LOS deformation rate reaches approximately cm/yr in Shunyi District. These observations are consistent with previous findings [33,66,67].
To better quantify the spatial variations in ground deformation, the velocity fields were decomposed into quasi-vertical and quasi-east–west components, as shown in Figure 5c,d. Most subsiding areas exhibit both vertical and horizontal deformation components, except for southern Beijing north of Beijing Daxing International Airport. The maximum vertical subsidence rate is 11.4 mm/yr in the Chaoyang and Shunyi districts.
To investigate the temporal evolution of land subsidence, we select three points and plot their displacement time series in Figure 5e: point A in Dongcheng District (representing the central old town), point B at the margin of the Shunyi subsidence funnel, and point C at the center of the subsidence funnel. The temporal evolution can be divided into three distinct periods, with turning points occurring in August 2019 and October 2023. The long-term stability of point A indicates that no significant surface deformation has occurred in the central and eastern districts of Beijing, implying a relatively low risk of structural settlement. In contrast, points B and C—located approximately 10 km apart—show similar temporal trends but substantial differences in magnitude. Notably, point B exhibits a slight rebound beginning in late 2023, whereas point C shows only a reduction in the subsidence rate. These results suggest that, even within adjacent subsidence funnels, variations in stratigraphic thickness and compressibility may lead to notable delays between groundwater recovery and the corresponding surface response [35,68,69]. To further investigate the ground uplift in northeastern Beijing driven by aquifer recovery from the South-to-North Water Diversion Project, as reported in recent literature [70], we use the ascending track 142 as an example and illustrate the temporal evolution in Figure 6. The displacement time series at point D on the Chaobai River Plain shows slow subsidence before March 2018, followed by persistent uplift from 2018 to 2023, and stabilization after February 2023. Another point E, located at the boundary between Haidian and Changping districts, shows rapid subsidence during 2015–2018, followed by a reversal and continuous uplift since June 2021. These observations confirm the effectiveness of the aquifer recovery strategy implemented by the government.
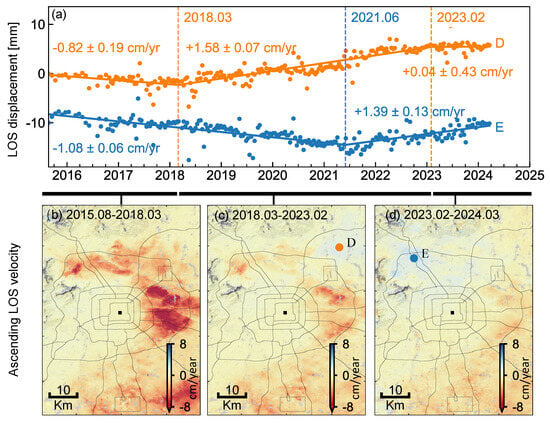
Figure 6.
Temporal evolution of ground uplift signals in Beijing from Sentinel-1 ascending orbit. (a) LOS displacement time series at point D, located in the Chaobai River Plain, and point E, located near the boundary between Haidian and Changping districts. (b–d) LOS velocity fields for August 2015–March 2018, March 2018–February 2023, and February 2023–March 2024, respectively. The black square marks the reference point (39.904°N, 116.394°E).
4.3. Land Subsidence at the Beijing Capital International Airport Area
We show the deformation at Beijing Capital International Airport in Figure 7. Both the ascending (Figure 7a) and descending (Figure 7b) orbits exhibit a consistent spatial pattern of ground deformation, with clear contrasts in subsidence rates on the two sides of the Shunyi–Liangxiang Fault [12,38], which crosses the middle of the airport and cuts the central runway in half. The western side experiences stronger subsidence, introducing a sharp deformation gradient across the fault. This unique spatial pattern indicates that the fault acts as a structural boundary controlling the deformation distribution. The primary difference between the two LOS results lies in the magnitude and spatial extent of subsidence, implying a strong horizontal deformation contribution, mainly associated with creeping of the Shunyi–Liangxiang Fault, as shown by the decomposed fault-parallel deformation (Figure 7g–i). Projecting the horizontal velocities onto the fault-parallel direction isolates the deformation component most directly governed by the Shunyi–Liangxiang Fault, thereby revealing its influence more clearly [58].
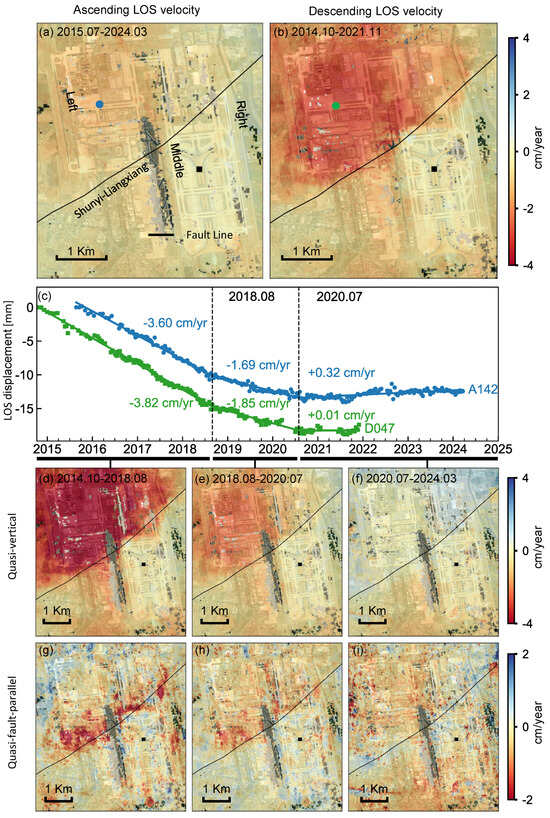
Figure 7.
Deformation at the Beijing Capital International Airport. (a) Ascending LOS velocity from July 2015 to March 2024, (b) descending LOS velocity from October 2014 to November 2021, (c) point LOS displacement time series from the ascending (blue dots) and descending orbits (green dots) with velocities from three deformation stages: rapid subsidence (October 2014–August 2018), slow subsidence (August 2018–July 2020), and stabilization (after July 2020). (d–f) Quasi-vertical deformation velocities for the three stages; (g–i) fault-parallel deformation velocities for the three stages with positive values for motion towards east–north direction. Black lines represent the Shunyi–Liangxiang Fault. Black squares mark the reference point (39.904°N, 116.394°E).
To investigate the temporal evolution of the deformation, we select a point within the airport (marked in Figure 7a,b) and plot its displacement time series from the ascending and descending tracks in Figure 7c. The two time series exhibit consistent temporal deformation patterns during the overlapping period (2015–2021), which can be divided into three stages: rapid asymmetric deformation across the fault before August 2018, followed by a deceleration phase, and stabilization after July 2020. Notably, since July 2020, not only has the vertical subsidence on the western side of the fault ceased, but the fault-parallel creeping has also disappeared, indicating the remarkable effectiveness of the three major overhauls implemented at the airport [71].
4.4. Land Subsidence at Beijing Daxing International Airport Area
Beijing Daxing International Airport began construction in 2015 and entered regular operation in 2019. The airport is located at the boundary between Daxing District, Beijing, and Guangyang District, Langfang, Hebei Province. Situated in the northeastern part of the North China Plain, the airport lies within the alluvial–proluvial fan of the Yongding River, underlain by a silty clay foundation, and is affected by ground subsidence primarily driven by the substantial residual groundwater extraction in this region, as shown in Figure 5.
Figure 8a,b show the ascending and descending LOS velocities, while Figure 8c,d present the decomposed quasi-vertical and quasi-east–west velocities, similar to Figure 5. As shown in these velocity maps, the runways and terminal buildings remain stable, whereas subsidence is mainly concentrated in three localized areas: the northern section of the south runway (point A), the maintenance area (point B), and the cargo area (point C). The decomposed quasi-vertical and quasi-east–west velocities (Figure 8c,d) further indicate that vertical compaction dominates the subsidence, while the east–west horizontal component remains relatively small. This suggests that the deformation is primarily controlled by groundwater-level variations rather than crustal extension or shear, consistent with previous findings derived from combined Sentinel-1 and TerraSAR-X observations [72].
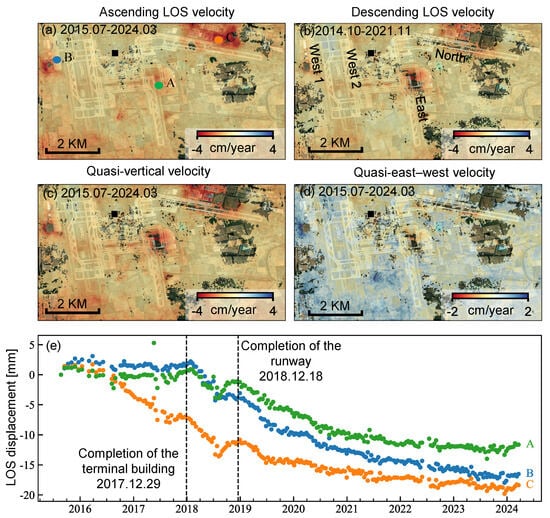
Figure 8.
Deformation at Beijing Daxing International Airport. (a,b) Ascending and descending LOS velocities. (c,d) Quasi-vertical and quasi-east–west velocities. (e) Point displacement time series of the three points A (east runway), B (maintenance area), and C (cargo area). Black squares mark the reference point (39.904°N, 116.394°E).
Three representative locations (points A–C) were selected to examine the temporal behavior of these subsidence-prone zones (Figure 8e). To remove regional subsidence bias and improve local deformation characterization, the InSAR dataset was re-referenced using the mean velocity of stable pixels on the terminal building. Before the completion of the terminal building in December 2017, points A and B exhibited little subsidence, whereas point C experienced significantly greater deformation. This pattern is likely associated with construction-related soil stockpiling that triggered localized foundation reconsolidation, as also suggested in previous studies [73]. During the runway construction phase from December 2017 to December 2018, all three points exhibited a pattern of rapid subsidence, followed by gradual deceleration, likely related to foundation disturbance caused by excavation and backfilling activities. After runway completion, the deformation rates at all three points progressively decreased and eventually stabilized, indicating that foundation consolidation was largely completed.
5. Land Subsidence Gradient Analysis
5.1. Subsidence Gradient Along Ring Roads and Major Expressways
Following the method described in Section 3.3, the cumulative subsidence and subsidence-gradient maps of Beijing’s ring–radial expressway network from July 2015 to November 2021 were derived, as shown in Figure 9. Both the cumulative subsidence and its gradient exhibit sharp increases where the expressways intersect the Tongzhou–Yizhuang subsiding regions. More specifically, for the second to sixth ring roads, subsidence increases progressively outward, indicating the pattern of urban expansion, with maximum gradients of 0.24‰, 0.23‰, 0.57‰, 0.71‰, and 0.72‰, respectively. For radial expressways, the maximum gradient along the G1 Expressway reaches 0.55‰, whereas the G2 Expressway reaches 1.98‰, the highest among all routes. The remaining expressways—including G3, G4, G5, G6, G7, and G45—fall within the range of 0.2–0.8‰. Overall, the maximum cumulative gradient of the entire ring–radial network during the measurement period of 2015–2021 is 1.98‰, which is below the 3‰ threshold specified in the Highway Subgrade Design Code (JTG D30–2015).
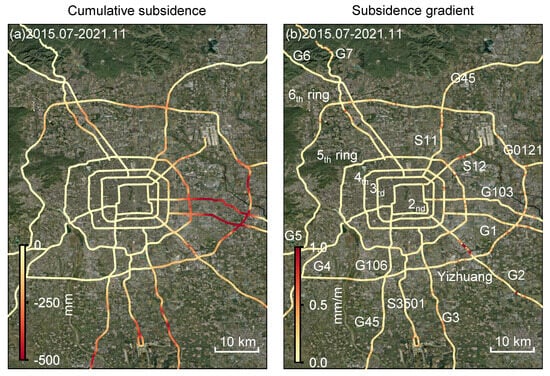
Figure 9.
(a) Cumulative subsidence and (b) subsidence gradients of Beijing’s ring roads and radial expressways during 2015–2021.
Using the deformation gradients observed during 2015–2021 (approximately 6.5 years) as the baseline, we applied linear scaling according to the actual operational time of each road since opening, thereby estimating the cumulative deformation gradient up to 2025 (see Table 3). Based on the estimated full-period deformation gradients in 2025 (Table 3), the G2, G103, and S12 expressways exceed the 3‰ threshold, with values of 10.1‰, 4.1‰, and 3.4‰, respectively, while all other roads remain below the limit. Given that Beijing experienced higher subsidence rates prior to our observation period, these full-period estimates [11,12] should therefore be regarded as conservative. It is important to note that these exceedances represent projected full-period deformation rather than the present-day condition; the measured gradients during 2015–2021 remain below the 3‰ threshold. Therefore, the potential risk indicated for G2, G103, and S12 reflects long-term cumulative deformation rather than an immediate structural concern.
Table 3.
Cumulative deformation gradients along major roads and expressways.
5.2. Subsidence Gradient Along Airport Runways
Compared with expressways, airport runways require much stricter control over differential settlement. According to the Code for Geotechnical Engineering Design of Civil Airports (MH/T 5027–2013), the post-construction differential deformation rate of a runway must not exceed 1.5‰. Exceeding this threshold may introduce longitudinal surface irregularities capable of affecting aircraft dynamic responses and operational safety [74]. In accordance with this standard, we analyzed the subsidence gradients of the three runways at Beijing Capital International Airport (PEK) and the four runways at Beijing Daxing International Airport (PKX), as shown in Figure 10.
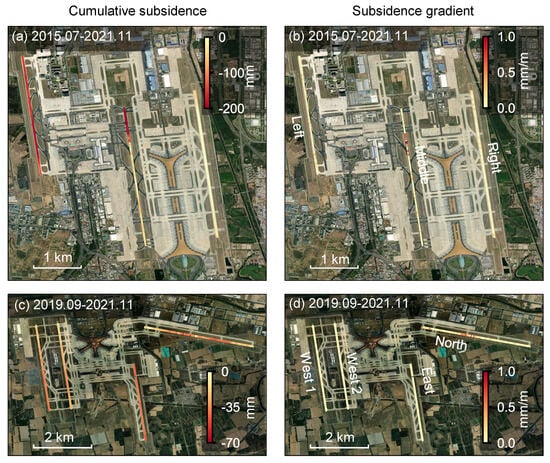
Figure 10.
Cumulative subsidence (left panels) and subsidence gradient (right panels) of runways at PEK and PKX airports in Beijing. (a,b) The PEK airport during July 2015 to November 2021; (c,d) the PKX airport during September 2019 to November 2021.
For Beijing Capital International Airport (Figure 10a) during July 2015 to November 2021, the left and right runways experienced cumulative subsidence of 121–193 mm and 2–57 mm, with maximum gradients of 0.31‰ and 0.33‰, respectively. In contrast, the middle runway shows much larger variation (9–210 mm) with a maximum gradient of 1.9‰, exceeding the code limit of 1.5‰ and implying a potential structural risk. The location of the peak gradient can be further pinpointed, providing guidance for targeted monitoring and maintenance. This location corresponds to the asymmetric deformation across the Shunyi–Liangxiang Fault. Fortunately, ground fissures had already been identified in the runway, and three major overhauls were conducted in 2013, 2015, and 2017 to eliminate this safety hazard [71]. Although the maximum gradient reached 1.9‰ during the observation period, this exceedance reflects historical deformation rather than the current condition. The time series results show that deformation has progressively stabilized since July 2020, indicating that the previous rehabilitation works have effectively mitigated the immediate structural risk.
Beijing Daxing International Airport entered operation in September 2019; therefore, we analyzed the InSAR-derived deformation from September 2019 to November 2021 (Figure 10c,d). From left to right, the west-1, west-2, east, and north runways show cumulative subsidence of 15–43 mm, 14–35 mm, 33–55 mm, and 1–62 mm, with maximum gradients of 0.12‰, 0.12‰, 0.16‰, and 0.77‰, respectively. All four runways remain far below the 1.5‰ limit, indicating stable ground conditions and safe operational performance.
6. Discussion
6.1. Impact of Phase Corrections on InSAR Measurements
We show the impact of phase corrections on InSAR time series measurement in Figure 11. Figure 11a,b show the linear velocity before and after all corrections, while Figure 11c–g show the apparent velocity of each error source. Compared with the rapid land subsidence of ∼8 cm/yr, the millimeter-per-year level of phase corrections seems insignificant. However, the impact of phase corrections can be more effectively demonstrated using two points in the relatively stable region, as shown in Figure 11h, which shows the displacement time series and its velocity estimates after each correction progressively. The estimated velocity changes from 2.9 mm/yr to 2.7 mm/yr, while the estimated velocity standard deviation reduces from 0.94 mm/yr to 0.55 mm/yr, confirming the effectiveness of our phase corrections. Note that the tropospheric delay and plate rotation dominate the contributions among all error sources, as shown clearly in Figure 11c–h.
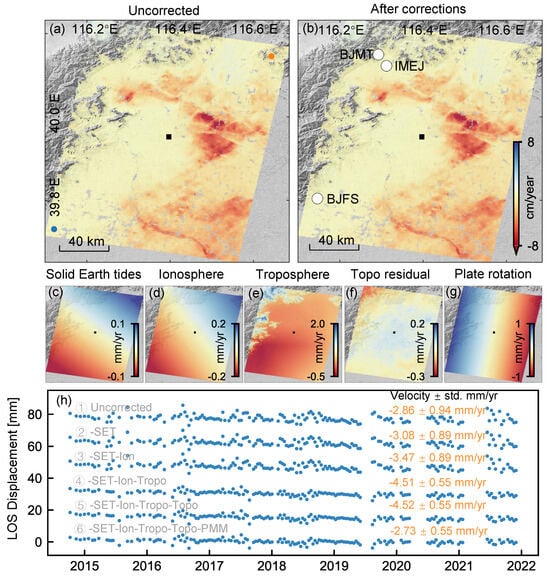
Figure 11.
Impact of phase corrections on InSAR measurements for Sentinel-1 descending track 47. Positive values indicate motion toward the satellite. (a,b) LOS velocities (a) before and (b) after all corrections. White circles in (b) represent GNSS stations. (c,g) Apparent LOS velocity from each error source: (c) solid Earth tides, (d) ionospheric delay, (e) tropospheric delay, (f) DEM error, and (g) plate rotation. Black squares mark the reference point (39.904°N, 116.394°E). (h) Differential displacement time series between two points (orange and blue points in (a)) after each of the error corrections.
6.2. Surface Deformation Modulated by Groundwater Variation
We investigate the driving force of the surface deformation here using in situ groundwater depth data of 20 wells in eastern Beijing from the Beijing Hydrology Center. We extend the analysis time period from previous studies of December 2022 [12,35,75,76] to April 2024 in this study, better covering the groundwater recovery process in recent years (Figure 6). For each well, we grab the corresponding surface deformation using the median value from all valid InSAR pixels within a 200 m radius. Both InSAR and well data are referenced to a common start date around January 2020. Figure 12 shows four representative monitoring wells, and analysis of all wells is provided in the Supplementary Material Figure S12.
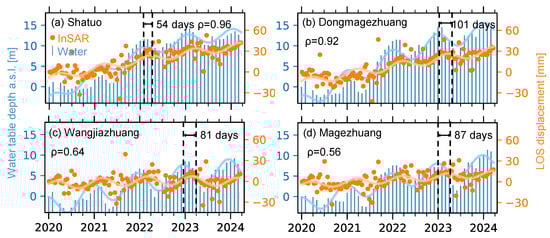
Figure 12.
Correlation between InSAR-derived surface deformation and groundwater variation on four wells. Orange dots represent the observed InSAR LOS displacement, and blue bars represent in situ groundwater depths. The orange and blue lines denote the fitted InSAR deformation and groundwater depth, respectively. Locations of the (a) Shatuo, (b) Dongmagezhuang, (c) Wangjiazhuang, and (d) Magezhuang wells are shown in Figure 1c. indicates the Pearson correlation coefficient.
At all four wells, InSAR-derived surface deformation shows similar long-term trends and seasonal variation patterns as the water table depth, with deformation generally lagging behind groundwater fluctuation. Temporal fitting using a quadratic polynomial and a periodic function yields lag times of 54–101 days, indicating a heterogeneous response of the surface deformation due to groundwater variation. The correlation analysis using Pearson correlation coefficients shows a value range from 0.56 to 0.96, further confirming the modulation effect of the groundwater variation on the surface deformation during the current groundwater recovery process.
7. Conclusions
In this paper, we generated the surface deformation history of the Beijing Plain from 2014 to 2024 using Sentinel-1. By combining data from both ascending and descending orbits, we further derived the quasi-vertical deformation and deformation gradients along 5 ring roads, 13 expressways within and outside the city, and 7 airport runways. Our results show that subsidence in Beijing is mainly concentrated in the northern, eastern, and southern regions, with a maximum vertical subsidence rate of 11.4 mm/yr in the Chaoyang and Shunyi districts. Areas with high deformation gradients are sparsely distributed in local subsidence funnels or around the boundary of regional subsidence funnels across the northern, eastern, and southern regions. Based on the national standards, we found that the central runway of Beijing Capital International Airport has accumulated a deformation gradient of 1.9‰, exceeding the safety limit of 1.5‰ for airport runways. A simple extrapolation from our observation time period of 2015–2021 to the entire operation period for each road and expressway shows that the G2, G103, and S12 expressways may have accumulated deformation gradients of 10.1‰, 4.1‰, and 3.4‰, exceeding the safety limit of 3.0‰ for highways. This work demonstrates the effectiveness of high-resolution spaceborne InSAR time series for monitoring and pinpointing potential structural risks in major transportation infrastructure.
Future work could focus on (1) analysis based on even higher-resolution deformation products, either through full-resolution time series analysis or by exploiting new high-resolution SAR missions such as LuTan-1 [77] and commercial SAR satellites, and (2) integrating modeling with multi-source observations, including gravity data [78] and seismic interferometry [79], to better understand the physical mechanism associated with the recent groundwater recovery.
Supplementary Materials
The following supporting information can be downloaded at: https://www.mdpi.com/article/10.3390/rs18030520/s1.
Author Contributions
Conceptualization, Z.Y., X.G. and W.L.; methodology, Z.Y.; software, W.L. and Z.Y.; formal analysis, W.L.; data curation, W.L., Y.W. and C.H.; writing—original draft preparation, W.L.; writing—review and editing, W.L., Z.Y., X.G., Y.W. and C.H.; visualization, W.L., Z.Y., Y.W. and C.H.; supervision, Z.Y. and X.G. All authors have read and agreed to the published version of the manuscript.
Funding
This research received no external funding.
Data Availability Statement
The datasets and analysis code used in this study are available on Zenodo (https://doi.org/10.5281/zenodo.17661293, https://doi.org/10.5281/zenodo.18324501). ISCE-2 (https://github.com/isce-framework/isce2, accessed on 15 January 2026) and MintPy (https://github.com/insarlab/MintPy, accessed on 15 January 2026) are publicly available.
Acknowledgments
The authors gratefully acknowledge the European Space Agency (ESA) for providing free access to Sentinel-1 SAR data, the Copernicus Emergency Rapid Mapping Image Service (ERIS) for supplying geospatial datasets, and the OpenStreetMap community for making openly accessible cartographic data available.
Conflicts of Interest
The authors declare no conflicts of interest.
References
- Li, M.; Gong, D.; Song, Y. Research on multiple paths of transportation system resilience building in digital contexts. Sci. Rep. 2025, 15, 28644. [Google Scholar] [CrossRef] [PubMed]
- Shi, Q.; Zhu, J.; Liu, Z.; Guo, H.; Gao, S.; Liu, M.; Liu, Z.; Liu, X. The last puzzle of global building footprints—Mapping 280 million buildings in East Asia based on VHR images. J. Remote Sens. 2024, 4, 0138. [Google Scholar] [CrossRef]
- Zhang, J.; Zhang, A.; Li, J.; Fan, H. Enhanced understanding on permanent deformation behaviour of subgrade compacted clay under long-term cyclic loading. Soil Dyn. Earthq. Eng. 2024, 187, 108972. [Google Scholar] [CrossRef]
- Golewski, G.L. The Phenomenon of Cracking in Cement Concretes and Reinforced Concrete Structures: The Mechanism of Cracks Formation, Causes of Their Initiation, Types and Places of Occurrence, and Methods of Detection—A Review. Buildings 2023, 13, 765. [Google Scholar] [CrossRef]
- Xu, L.; Zhang, R.; Zheng, J.; Sun, H.; Gao, Y. Evolution of axial cumulative strain and micro-pore structure characteristics of solidified mud under cyclic loading. Transp. Geotech. 2025, 50, 101454. [Google Scholar] [CrossRef]
- Brownjohn, J.M. Structural Health Monitoring of Civil Infrastructure. Philos. Trans. R. Soc. A Math. Phys. Eng. Sci. 2007, 365, 589–622. [Google Scholar] [CrossRef]
- Rosen, P.A.; Hensley, S.; Joughin, I.R.; Li, F.K.; Madsen, S.N.; Rodriguez, E.; Goldstein, R.M. Synthetic aperture radar interferometry. Proc. IEEE 2002, 88, 333–382. [Google Scholar] [CrossRef]
- Ferretti, A.; Prati, C.; Rocca, F. Permanent Scatterers in SAR Interferometry. IEEE Trans. Geosci. Remote Sens. 2001, 39, 8–20. [Google Scholar] [CrossRef]
- Berardino, P.; Fornaro, G.; Lanari, R.; Sansosti, E. A New Algorithm for Surface Deformation Monitoring Based on Small Baseline Differential SAR Interferograms. IEEE Trans. Geosci. Remote Sens. 2002, 40, 2375–2383. [Google Scholar] [CrossRef]
- Fu, Y.; Zhu, Z.; Liu, L.; Zhan, W.; He, T.; Shen, H.; Zhao, J.; Liu, Y.; Zhang, H.; Liu, Z.; et al. Remote Sensing Time Series Analysis: A Review of Data and Applications. J. Remote Sens. 2024, 4, 0285. [Google Scholar] [CrossRef]
- Fu, Y.; Wang, J.; Zhang, Y.; Yang, H.; Li, L.; Ren, Z. Spatiotemporal Evolution Characteristics of Ground Deformation in the Beijing Plain from 1992 to 2023 Derived from a Novel Multi-Sensor InSAR Fusion Method. Remote Sens. Environ. 2025, 319, 114635. [Google Scholar] [CrossRef]
- Dong, J.; Guo, S.; Wang, N.; Zhang, L.; Ge, D.; Liao, M.; Gong, J. Tri-Decadal Evolution of Land Subsidence in the Beijing Plain Revealed by Multi-Epoch Satellite InSAR Observations. Remote Sens. Environ. 2023, 286, 113446. [Google Scholar] [CrossRef]
- Cavalagli, N.; Kita, A.; Falco, S.; Trillo, F.; Costantini, M.; Ubertini, F. Satellite Radar Interferometry and In-Situ Measurements for Static Monitoring of Historical Monuments: The Case of Gubbio, Italy. Remote Sens. Environ. 2019, 235, 111453. [Google Scholar] [CrossRef]
- Cerchiello, V.; Tessari, G.; Velterop, E.; Riccardi, P.; Defilippi, M.; Pasquali, P. Building Damage Risk by Modeling Interferometric Time Series. IEEE Geosci. Remote Sens. Lett. 2017, 14, 509–513. [Google Scholar] [CrossRef]
- DePrekel, K.; Bouali, E.H.; Oommen, T. Monitoring the Impact of Groundwater Pumping on Infrastructure Using Geographic Information System (GIS) and Persistent Scatterer Interferometry (PSI). Infrastructures 2018, 3, 57. [Google Scholar] [CrossRef]
- Selvakumaran, S.; Plank, S.; Geiss, C.; Rossi, C.; Middleton, C. Remote Monitoring to Predict Bridge Scour Failure Using Interferometric Synthetic Aperture Radar (InSAR) Stacking Techniques. Int. J. Appl. Earth Obs. Geoinf. 2018, 73, 463–470. [Google Scholar] [CrossRef]
- Infante, D.; Di Martire, D.; Calcaterra, D.; Miele, P.; Scotto di Santolo, A.; Ramondini, M. Integrated Procedure for Monitoring and Assessment of Linear Infrastructures Safety (I-Pro MONALISA) Affected by Slope Instability. Appl. Sci. 2019, 9, 5535. [Google Scholar] [CrossRef]
- Macchiarulo, V.; Milillo, P.; Blenkinsopp, C.; Giardina, G. Monitoring Deformations of Infrastructure Networks: A Fully Automated GIS Integration and Analysis of InSAR Time-Series. Struct. Health Monit. 2022, 21, 1849–1878. [Google Scholar] [CrossRef]
- Chang, L.; Sakpal, N.P.; Elberink, S.O.; Wang, H. Railway Infrastructure Classification and Instability Identification Using Sentinel-1 SAR and Laser Scanning Data. Sensors 2020, 20, 7108. [Google Scholar] [CrossRef]
- Luo, Q.; Li, M.; Yin, Z.; Ma, P.; Perissin, D.; Zhang, Y. Land Subsidence Velocity and High-Speed Railway Risks in the Coastal Cities of Beijing–Tianjin–Hebei, China, with 2015–2021 ALOS PALSAR-2 Multi-Temporal InSAR Analysis. Remote Sens. 2024, 16, 4774. [Google Scholar] [CrossRef]
- Yunjun, Z.; Zi, W.; Chou, X.; Yun, S.; Minghuan, Y.; Wu, C.; Xin, W. Deformation analysis of the seawall in Qiantang estuary with multi-temporal InSAR. J. Remote Sens. 2015, 19, 339–354. [Google Scholar]
- Milillo, P.; Bürgmann, R.; Lundgren, P.; Salzer, J.; Perissin, D.; Fielding, E.; Biondi, F.; Milillo, G. Space Geodetic Monitoring of Engineered Structures: The Ongoing Destabilization of the Mosul Dam, Iraq. Sci. Rep. 2016, 6, 37408. [Google Scholar] [CrossRef]
- Jung, J.; Kim, D.; Palanisamy Vadivel, S.K.; Yun, S.H. Long-Term Deflection Monitoring for Bridges Using X- and C-Band Time-Series SAR Interferometry. Remote Sens. 2019, 11, 1258. [Google Scholar] [CrossRef]
- Ohenhen, L.O.; Zhai, G.; Lucy, J.; Werth, S.; Carlson, G.; Khorrami, M.; Onyike, F.; Sadhasivam, N.; Tiwari, A.; Ghobadi-Far, K. Land Subsidence Risk to Infrastructure in US Metropolises. Nat. Cities 2025, 2, 543–554. [Google Scholar] [CrossRef]
- Cigna, F.; Paranunzio, R.; Bonì, R.; Teatini, P. Present-Day Land Subsidence Risk in the Metropolitan Cities of Italy. Sci. Rep. 2025, 15, 34999. [Google Scholar] [CrossRef] [PubMed]
- Solano-Rojas, D.; Wdowinski, S.; Cabral-Cano, E.; Osmanoğlu, B. Geohazard Assessment of Mexico City’s Metro System Derived from SAR Interferometry Observations. Sci. Rep. 2024, 14, 6035. [Google Scholar] [CrossRef]
- Zuo, S.; Liao, M.; Dong, J.; Wang, R.; Guo, S.; Lin, F.; Wang, N.; Zhang, D. Risk Assessment of Building and Infrastructure Using InSAR-Derived Deformation Gradients and Pattern Variations in the Beijing Plain, China. Int. J. Digit. Earth 2025, 18, 2528629. [Google Scholar] [CrossRef]
- Huang, C.; Tan, L.; Liu, J.; Yan, K. Multi-Temporal-InSAR Ground Deformation Mapping of Beijing Subway Network Based on ALOS-2 and Sentinel-1 Data. Pol. J. Environ. Stud. 2025, 34, 8115–8129. [Google Scholar] [CrossRef]
- Ni, H.; Yu, L.; Gong, P.; Li, X.; Zhao, J. Urban renewal mapping: A case study in Beijing from 2000 to 2020. J. Remote Sens. 2023, 3, 0072. [Google Scholar] [CrossRef]
- Meng, D.; Chen, B.; Gong, H.; Zhang, S.; Ma, R.; Zhou, C.; Lei, K.; Xu, L.; Wang, X. Land Subsidence and Rebound Response to Groundwater Recovery in the Beijing Plain: A New Hydrological Perspective. J. Hydrol. Reg. Stud. 2025, 57, 102127. [Google Scholar] [CrossRef]
- Bai, Z.; Wang, Y.; Balz, T. Beijing Land Subsidence Revealed Using PS-InSAR with Long Time Series TerraSAR-X SAR Data. Remote Sens. 2022, 14, 2529. [Google Scholar] [CrossRef]
- Chen, B.; Gong, H.; Chen, Y.; Li, X.; Zhou, C.; Lei, K.; Zhu, L.; Duan, L.; Zhao, X. Land Subsidence and Its Relation with Groundwater Aquifers in Beijing Plain of China. Sci. Total Environ. 2020, 735, 139111. [Google Scholar] [CrossRef]
- Zhu, L.; Gong, H.; Li, X.; Wang, R.; Chen, B.; Dai, Z.; Teatini, P. Land Subsidence Due to Groundwater Withdrawal in the Northern Beijing Plain, China. Eng. Geol. 2015, 193, 243–255. [Google Scholar] [CrossRef]
- Chen, B.; Gong, H.; Li, X.; Lei, K.; Zhu, L.; Gao, M.; Zhou, C. Characterization and Causes of Land Subsidence in Beijing, China. Int. J. Remote Sens. 2017, 38, 808–826. [Google Scholar] [CrossRef]
- Zhou, C.; Tang, Q.; Zhao, Y.; Warner, T.A.; Liu, H.; Clague, J.J. Reduction of Subsidence and Large-Scale Rebound in the Beijing Plain after Anthropogenic Water Transfer and Ecological Recharge of Groundwater: Evidence from Long Time-Series Satellites InSAR. Remote Sens. 2024, 16, 1528. [Google Scholar] [CrossRef]
- Beijing Water Authority. Notice on Delimiting Prohibited, Restricted, and Reserved Groundwater Extraction Zones as Well as Key Spring Protection Areas in Beijing; Beijing Water Authority: Beijing, China, 2022. [Google Scholar]
- Guo, H.; Fu, W.; Liu, G. Scientific Satellite and Moon-Based Earth Observation for Global Change; Springer: Singapore, 2019. [Google Scholar]
- Zhou, Z.; Yao, X.; Ren, K.; Liu, H. Formation Mechanism of Ground Fissure at Beijing Capital International Airport Revealed by High-Resolution InSAR and Numerical Modelling. Eng. Geol. 2022, 306, 106775. [Google Scholar] [CrossRef]
- Fattahi, H.; Agram, P.; Simons, M. A Network-Based Enhanced Spectral Diversity Approach for TOPS Time-Series Analysis. IEEE Trans. Geosci. Remote Sens. 2017, 55, 777–786. [Google Scholar] [CrossRef]
- Rosen, P.A.; Gurrola, E.; Sacco, G.F.; Zebker, H. The InSAR Scientific Computing Environment. In Proceedings of the EUSAR 2012, 9th European Conference on Synthetic Aperture Radar, Nuremberg, Germany, 23–26 April 2012; VDE: Berlin, Germany, 2012; pp. 730–733. [Google Scholar]
- Yunjun, Z.; Fattahi, H.; Amelung, F. Small Baseline InSAR Time Series Analysis: Unwrapping Error Correction and Noise Reduction. Comput. Geosci. 2019, 133, 104331. [Google Scholar] [CrossRef]
- European Space Agency. Mission Ends for Copernicus Sentinel-1B Satellite. 2022. Available online: https://www.esa.int/Applications/Observing_the_Earth/Copernicus/Sentinel-1/Mission_ends_for_Copernicus_Sentinel-1B_satellite (accessed on 15 January 2026).
- Scheiber, R.; Moreira, A. Coregistration of Interferometric SAR Images Using Spectral Diversity. IEEE Trans. Geosci. Remote Sens. 2000, 38, 2179–2191. [Google Scholar] [CrossRef]
- Farr, T.G.; Rosen, P.A.; Caro, E.; Crippen, R.; Duren, R.; Hensley, S.; Kobrick, M.; Paller, M.; Rodriguez, E.; Roth, L.; et al. The Shuttle Radar Topography Mission. Rev. Geophys. 2007, 45. [Google Scholar] [CrossRef]
- Chen, C.W.; Zebker, H.A. Two-Dimensional Phase Unwrapping with Statistical Models for Nonlinear Optimization. In Proceedings of the IGARSS 2000: IEEE 2000 International Geoscience and Remote Sensing Symposium, Honolulu, HI, USA, 24–28 July 2000; IEEE: New York, NY, USA, 2000; Volume 7, pp. 3213–3215. [Google Scholar]
- Fattahi, H.; Amelung, F. InSAR Bias and Uncertainty Due to the Systematic and Stochastic Tropospheric Delay. J. Geophys. Res. Solid Earth 2015, 120, 8758–8773. [Google Scholar] [CrossRef]
- Yunjun, Z.; Fattahi, H.; Pi, X.; Rosen, P.; Simons, M.; Agram, P.; Aoki, Y. Range Geolocation Accuracy of C-/L-Band SAR and Its Implications for Operational Stack Coregistration. IEEE Trans. Geosci. Remote Sens. 2022, 60, 5227219. [Google Scholar] [CrossRef]
- Milbert, D. SOLID: Solid Earth Tide, 2018. Available online: http://geodesyworld.github.io/SOFTS/solid.htm (accessed on 6 September 2025).
- Wang, Y.; Yunjun, Z.; Wang, N.; Liu, R.; Liang, C.; Aoki, Y.; Wang, R. Towards Long-Wavelength Ionospheric Correction of InSAR Time Series Using GNSS-Based TEC. IEEE Trans. Geosci. Remote Sens. 2026, 1–1. [Google Scholar] [CrossRef]
- Hersbach, H.; Bell, B.; Berrisford, P.; Hirahara, S.; Horányi, A.; Muñoz-Sabater, J.; Nicolas, J.; Peubey, C.; Radu, R.; Schepers, D.; et al. The ERA5 Global Reanalysis. Q. J. R. Meteorol. Soc. 2020, 146, 1999–2049. [Google Scholar] [CrossRef]
- Jolivet, R.; Grandin, R.; Lasserre, C. Systematic InSAR Tropospheric Phase Delay Corrections from Global Meteorological Reanalysis Data. J. Geophys. Res. 2011, 38, L17311. [Google Scholar] [CrossRef]
- Yu, C.; Li, Z.; Penna, N.T.; Crippa, P. Generic atmospheric correction model for interferometric synthetic aperture radar observations. J. Geophys. Res. Solid Earth 2018, 123, 9202–9222. [Google Scholar] [CrossRef]
- Fattahi, H.; Amelung, F. DEM Error Correction in InSAR Time Series. IEEE Trans. Geosci. Remote Sens. 2013, 51, 4249–4259. [Google Scholar] [CrossRef]
- Hetland, E.A.; Musé, P.; Simons, M.; Lin, Y.N.; Agram, P.S.; DiCaprio, C.J. Multiscale InSAR Time Series (MInTS) Analysis of Surface Deformation. J. Geophys. Res. Solid Earth 2012, 117, B02404. [Google Scholar] [CrossRef]
- Altamimi, Z.; Métivier, L.; Rebischung, P.; Rouby, H.; Collilieux, X. ITRF2014 Plate Motion Model. Geophys. J. Int. 2017, 209, 1906–1912. [Google Scholar] [CrossRef]
- Stephenson, O.L.; Liu, Y.; Yunjun, Z.; Simons, M.; Rosen, P.; Xu, X. The Impact of Plate Motions on Long-Wavelength InSAR-Derived Velocity Fields. Geophys. Res. Lett. 2022, 49, e2022GL099835. [Google Scholar] [CrossRef]
- Liu, Y.K.; Yunjun, Z.; Simons, M. Inferring tectonic plate rotations from InSAR time series. Geophys. Res. Lett. 2025, 52, e2025GL115137. [Google Scholar] [CrossRef]
- Fialko, Y.; Simons, M.; Agnew, D. The Complete (3-D) Surface Displacement Field in the Epicentral Area of the 1999 Mw7.1 Hector Mine Earthquake, California, from Space Geodetic Observations. Geophys. Res. Lett. 2001, 28, 3063–3066. [Google Scholar] [CrossRef]
- Wright, T.J.; Parsons, B.E.; Lu, Z. Toward Mapping Surface Deformation in Three Dimensions Using InSAR. Geophys. Res. Lett. 2004, 31, L01607. [Google Scholar] [CrossRef]
- Fattahi, H.; Amelung, F. InSAR Uncertainty Due to Orbital Errors. Geophys. J. Int. 2014, 199, 549–560. [Google Scholar] [CrossRef]
- JTG D30-2015; Specifications for Design of Highway Subgrades. China Communications Press: Beijing, China, 2015.
- MH/T 5027-2013; Code for Geotechnical Design of Civil Airports. China Civil Aviation Press: Beijing, China, 2013.
- Blewitt, G.; Hammond, W.; Kreemer, C. Harnessing the GPS Data Explosion for Interdisciplinary Science. Eos 2018, 99, EO102446. [Google Scholar] [CrossRef]
- Ansari, H.; De Zan, F.; Parizzi, A. Study of Systematic Bias in Measuring Surface Deformation with SAR Interferometry. IEEE Trans. Geosci. Remote Sens. 2020, 59, 1285–1301. [Google Scholar] [CrossRef]
- Zheng, Y.; Fattahi, H. Modeling, Prediction, and Retrieval of Surface Soil Moisture from InSAR Closure Phase. Remote Sens. Environ. 2026, 333, 115104. [Google Scholar] [CrossRef]
- Hu, L.; Dai, K.; Xing, C.; Li, Z.; Tomás, R.; Clark, B.; Shi, X.; Chen, M.; Zhang, R.; Qiu, Q. Land Subsidence in Beijing and Its Relationship with Geological Faults Revealed by Sentinel-1 InSAR Observations. Int. J. Appl. Earth Obs. Geoinf. 2019, 82, 101886. [Google Scholar] [CrossRef]
- Lei, K.; Ma, F.; Chen, B.; Luo, Y.; Cui, W.; Zhou, Y.; Liu, H.; Sha, T. Three-Dimensional Surface Deformation Characteristics Based on Time Series InSAR and GPS Technologies in Beijing, China. Remote Sens. 2021, 13, 3964. [Google Scholar] [CrossRef]
- Zhang, X.; Chen, B.; Gong, H.; Lei, K.; Zhou, C.; Lu, Z.; Zhao, D. Inversion of Groundwater Storage Variations Considering Lag Effect in Beijing Plain, from RADARSAT-2 with SBAS-InSAR Technology. Remote Sens. 2022, 14, 991. [Google Scholar] [CrossRef]
- Chaussard, E.; Bürgmann, R.; Shirzaei, M.; Fielding, E.J.; Baker, B. Predictability of Hydraulic Head Changes and Characterization of Aquifer-System and Fault Properties from InSAR-Derived Ground Deformation. J. Geophys. Res. Solid Earth 2014, 119, 6572–6590. [Google Scholar] [CrossRef]
- Zhang, X.; Sun, Q.; Gui, R.; Hu, J.; Yang, Q.; Su, G. Long-Time Surface Deformation in Beijing, China for Three Decades by Multi-Sensor, Multi-Track and Multi-Temporal InSAR Seamless Connection. Geomat. Nat. Hazards Risk 2025, 16, 2478950. [Google Scholar] [CrossRef]
- Liu, J.; Ma, R. Major Overhaul of the Central Runway at Beijing Capital Airport Completed and Opened for Trial Operation. CAAC Online, 2017. Available online: https://www.ccaonline.cn/news/top/328808.html (accessed on 15 March 2025). (In Chinese)
- Wang, Y.; Wen, F.; Yu, Q.; Zhao, X.; Wang, Z.; Chen, Y.; Song, C. Monitoring Ground Subsidence at Beijing Daxing International Airport by Integrating Sentinel-1 and TerraSAR-X Data. Adv. Space Res. 2025, 76, 6086–6096. [Google Scholar] [CrossRef]
- Deng, H.; Zhang, Z.; Fan, P. Temporal and Spatial Analysis of Ground Deformation of Beijing Daxing International Airport before and after Operation Using Time Series InSAR. J. Sens. 2024, 2024, 1163535. [Google Scholar] [CrossRef]
- Gerardi, T.; Gerardi, M. Airport Pavement Multiple-Event Roughness Detection and Evaluation; Federal Aviation Administration: Washington, DC, USA, 2024. [Google Scholar]
- Duan, G.; Gong, H.; Chen, B.; Li, X.; Pan, X.; Shi, M.; Zhang, H. Spatiotemporal Heterogeneity of Land Subsidence in Beijing. Sci. Rep. 2022, 12, 15120. [Google Scholar] [CrossRef]
- Zhang, X.; Hu, J.; Motagh, M.; Li, M.; Wang, Y.; Yang, Q.; Su, G.; Wang, H. Groundwater volume loss and land subsidence in the North China plain investigated using wide-area InSAR surveying and mechanical modeling. Remote Sens. Environ. 2026, 333, 115164. [Google Scholar] [CrossRef]
- Wang, R.; Liu, K.; Liu, D.; Ou, N.; Yue, H.; Chen, Y.; Yu, W.; Liang, D.; Cai, Y. LuTan-1: An innovative L-band spaceborne bistatic interferometric synthetic aperture radar mission. IEEE Geosci. Remote Sens. Mag. 2024, 13, 58–78. [Google Scholar] [CrossRef]
- Adams, K.H.; Reager, J.T.; Rosen, P.; Wiese, D.N.; Farr, T.G.; Rao, S.; Haines, B.J.; Argus, D.F.; Liu, Z.; Smith, R. Remote Sensing of Groundwater: Current Capabilities and Future Directions. Water Resour. Res. 2022, 58, e2022WR032219. [Google Scholar] [CrossRef]
- Mao, S.; Ellsworth, W.L.; Zheng, Y.; Beroza, G.C. Depth-Dependent Seismic Sensing of Groundwater Recovery from the Atmospheric-River Storms of 2023. Science 2025, 387, 758–763. [Google Scholar] [CrossRef]


Disclaimer/Publisher’s Note: The statements, opinions and data contained in all publications are solely those of the individual author(s) and contributor(s) and not of MDPI and/or the editor(s). MDPI and/or the editor(s) disclaim responsibility for any injury to people or property resulting from any ideas, methods, instructions or products referred to in the content. |
© 2026 by the authors. Licensee MDPI, Basel, Switzerland. This article is an open access article distributed under the terms and conditions of the Creative Commons Attribution (CC BY) license.