Highlights
What are the main findings?
- CryoFlora is developed tailored for cushion plant mapping, which is a compact instance segmentation framework integration of UniRepLKNetBlock large-kernel attention and BIMAFPN bidirectional fusion for enhanced detection of small, clustered objects.
- CryoFlora achieves high segmentation accuracy (0.944 mAP@0.5 and 0.622 mAP@0.5:0.95) with only 7.65 million parameters, demonstrating an effective balance between model compactness and detection accuracy.
What is the implication of the main finding?
- This framework enables automated extraction of key ecological metrics, including vegetation cover, density, individual area, and perimeter, providing a scalable and high-resolution monitoring approach for quantifying spatiotemporal dynamics of moraine–talus ecosystems under climate change.
Abstract
Cushion plants, renowned for their resilience to alpine and arctic extremes, remain challenging to delineate at the species level due to dense interwoven canopies and high spectral similarity among species. This study introduces CryoFlora, an instance segmentation framework tailored to cushion species, integrating a large-kernel attention backbone, UniRepLKNetBlock, with a bidirectional attention-based fusion neck, BIMAFPN, to enhance feature representation and boundary precision. CryoFlora was trained on 528 annotated UAV image tiles containing 17,488 instances of Thylacospermum caespitosum and Rhodiola rosea, representing the two principal morphological forms of cushion plants, flat and hemispherical. The model achieved a mean average precision of 0.975 at IoU 0.5 and 0.785 at IoU 0.5–0.95, with only 7.65 M parameters. Field validation across four 100 × 100 m plots in the Bayi Glacier forefield confirmed its ability to map total cover (575.5–999.3 m2), patch density (0.14–1.48 ind/m2), and individual canopy metrics, revealing clear elevational gradients in species dominance and morphology. By automating extraction of ecological indicators directly from UAV imagery, CryoFlora provides a scalable tool for dynamic monitoring of glacier-forefield ecosystems, supporting conservation and adaptive management under accelerating climate change.
1. Introduction
Moraine–talus ecosystem, typical of extreme alpine and arctic environments, lies on the newly exposed, ice-free terrain resulting from glacier retreat, acting as vital refugia for pioneer species and facilitating the early stages of ecosystem succession [1,2,3]. Among these pioneers, cushion plants are particularly prominent for their remarkable adaptations to the severe climatic and edaphic stresses characteristic of these habitats. As representatives of cryospheric flora, they exhibit hemispherical to flat, mat-like shapes characterized by extremely short internodes and densely branched shoots, with small leaves that pack a compact canopy close to the ground [4]. Their compact canopies efficiently retain heat and water, reducing energy loss through a low surface-to-volume ratio. Beyond individual resilience, cushion-forming species often act as ecosystem facilitators by improving environmental conditions for co-occurring species while also indirectly reducing biotic stressors like herbivory and competition [5,6,7]. These pioneering communities provide essential ecosystem services in glacier forelands by stabilizing fresh sediment, enhancing carbon sequestration, and modulating downstream hydrological regimes, which underscores their importance for watershed resilience under climate change [8]. However, these traits complicate accurate delineation in high-resolution imagery, as cushion plants are easily confused with fragmented meadow patches or other low-stature species [9]. Consequently, high-resolution, timely monitoring of periglacial vegetation dynamics is critical for informed conservation and adaptive management.
Traditional quadrat surveys remain the gold standard for taxonomic accuracy but are inherently labor-intensive and spatially limited, often covering <1 ha per campaign [10]. To overcome spatial constraints, satellite remote sensing platforms such as Landsat 8 and Sentinel-2 provide multi-decadal NDVI time series at 10–30 m resolution, revealing broad greening trends [11]. For instance, Ref. [12] found that 77% of the European Alps above the tree line have shown increased productivity over the past four decades. However, these data cannot resolve detailed community structure or species-level composition of cushion species.
The advent of unmanned aerial vehicles (UAVs) equipped with high-resolution RGB and multispectral sensors has enabled centimeter-scale mapping (ground sampling distance 3–5 cm), uncovering fine-grained patterns of vegetation colonization along deglaciation chronosequences [13]. Paired with high-resolution mapping, hyperspectral UAV surveys enable precise classification of functional groups (e.g., cryptogams versus vascular flora) through narrow-band index analysis; however, these surveys generate large datasets and are susceptible to significant sensor noise [14]. Despite these advances, most UAV-based workflows (e.g., pixel-based and edge-detection-based methods) utilized for early interpretation of images mainly rely on shallow semantic information, such as image texture and color gradient, restricting the further capability to obtain high-level semantic information [15]. In addition, this approach for target extraction in complex remote-sensing imagery fails to meet analytical needs, constrains processing throughput, and rarely achieves species-level delineation at scale [16,17].
Beyond general vegetation mapping, several studies have explicitly explored the identification of cushion plants or cushion-dominated vegetation using remote sensing techniques. Bricher et al. (2013) [18] demonstrated that very-high-resolution satellite imagery, when combined with terrain derivatives and Random Forest classification, can successfully delineate the distribution of the endangered cushion plant Azorella macquariensis in sub-Antarctic environments, highlighting the importance of morphological traits and microtopographic constraints for species-level mapping. With the increasing availability of UAV platforms, Lucieer et al. (2014) [19] further showed that centimeter-scale UAV imagery and structure-from-motion techniques can capture fine-scale micro-topography and low-stature vegetation patterns in Antarctic environments, providing critical structural context for detecting cushion- and mat-forming plant communities. More recently, Sotille et al. (2022) [20] applied UAV-based object-oriented image analysis and Random Forest classifiers to discriminate maritime Antarctic vegetation types, including cushion-like and other low-growing forms, demonstrating the growing potential of UAV remote sensing for fine-grained mapping of polar and alpine vegetation. Collectively, these studies confirm the feasibility of remote sensing-based detection of cushion plants while also underscoring persistent challenges related to small object size, dense clustering, and weak spectral contrast against heterogeneous substrates.
Recent work has begun to address these gaps by integrating machine-learning and deep-learning frameworks for automated trait extraction and object-based segmentation. Early approaches combined object-based Random Forest and SVM classifiers with UAV imagery to extract features and classify vegetation [21,22]. Building on this, more advanced convolutional- and transformer-based segmentation networks, such as U-Net, DeepLabv3+, Mask R-CNN, and various YOLO variants, have achieved over 90% overall accuracy on high-resolution UAV datasets [23,24,25]. For example, Ref. [26] introduced a Multi-Branch Auxiliary Fusion YOLO framework with re-parameterized heterogeneous convolutions, achieving more accurate small-object detection in complex scenes, while Ref. [27] demonstrated that an LC-DETR-based detector can effectively separate fine structural targets in industrial imagery.
While these frameworks demonstrate potential for detailed plant instance localization in moraine–talus ecosystem, they typically require thousands of annotated samples and rely on heavy backbones that impede real-time field deployment. Lightweight architectures that fuse efficient encoders (for example, Mobile-Net-V3) with feature-pyramid attention modules can achieve inference rates above 30 FPS, yet they still underperform when segmenting small, densely clustered objects because of limited receptive fields and insufficient multiscale fusion [28,29]. Hence, there remains a critical need for a streamlined, small-sample instance segmentation framework tailored to cushion species that balances high accuracy, computational efficiency, and low annotation demand.
Here, we introduce CryoFlora, a novel small-sample instance segmentation framework optimized for periglacial plant species. CryoFlora combines a large-kernel attention backbone (UniRepLKNetBlock) with a bidirectional, attention-driven neck (BIMAFPN) and achieves three key objectives: (i) perform accurate, real-time detection of periglacial dominant species at centimeter-scale resolutions; (ii) enable automated extraction of key ecological metrics directly from UAV imagery, including species total cover, species density, individual counts, and per-individual canopy area and perimeter; and (iii) demonstrate robust and stable performance on limited annotated samples with efficient inference suitable for resource-constrained deployment. By fulfilling these aims, CryoFlora provides a scalable tool for dynamic monitoring of glacier-foreland vegetation and establishes a methodological foundation for extending high-precision, small-sample plant mapping to other extreme alpine and polar ecosystems under accelerating climate change.
2. Multitask Deep Learning Framework
2.1. Overall Network Architecture
To address this gap, we propose CryoFlora, a purpose-built instance segmentation framework for accurate delineation of cushion plants in moraine–talus ecosystems. CryoFlora integrates UniRepLKNetBlock, a lightweight, large-kernel backbone, that enhances the capture of fine-grained spatial details, with a Bi-directional Multi-scale Adaptive Feature Pyramid Network (BIMAFPN) that improves feature alignment across resolutions. This architecture targets key challenges in UAV-based vegetation monitoring, including small object size, dense spatial distribution, low contrast backgrounds, and limited training samples, and directly supports ecological indicator extraction.By generating high-precision instance masks, CryoFlora directly supports the extraction of ecological indicators such as cover, density, individual area, perimeter, and shape metrics, offering a practical solution for species-level vegetation mapping in periglacial environments.
The network is composed of three main components (see Figure 1):
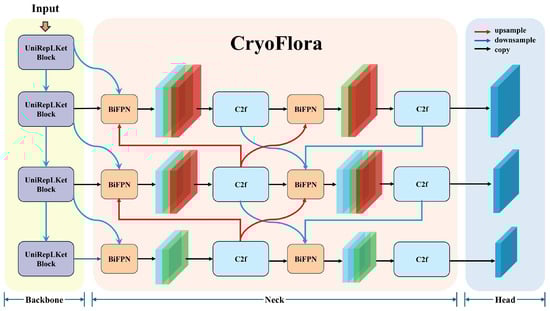
Figure 1.
The deep neural network architecture of CryoFlora. Including the UniRepLKNetBlock backbone, the BIMAFPN multi-scale feature fusion neck, and the instance-aware segmentation head.
- Backbone: The backbone is designed to extract low-level to high-level features from the input RGB image. In our model, we propose a customized structure called UniRepLKNetBlock, which stacks multiple depth-wise convolutional units [30]. Each block utilizes large-kernel depth-wise convolution, channel attention, and feedforward transformation with GRN (Gated Relative Normalization) to expand the receptive field while maintaining computational efficiency. These architectural elements contribute to a more comprehensive capture of spatially extended and low-contrast objects. In moraine–talus ecosystem, where cushion plants show subtle spectral contrast against rocky substrates, this design improves separation between vegetation and background. The enlarged receptive field supports recognition of their overall morphology, while channel-wise recalibration and GRN improve sensitivity to their weak textural and radiometric signals under variable terrain and lighting conditions.
- Neck: The neck is built with a multi-stage Fusion module, configured to operate in BiFPN mode [31], where features from different scales (P3, P4, P5) are fused in both top-down and bottom-up pathways. Here, the P3, P4, and P5 levels in the Neck share identical scale definitions with the Head (1/8, 1/16, and 1/32 of the input resolution, respectively); the only difference is that the Neck features have undergone multi-scale feature fusion. As the foundational fusion unit, we adopt a modified version of the C2f block, which splits the input into two paths, processes one through lightweight bottlenecks, and then fuses them to enhance gradient flow, reduce redundancy, and improve efficiency compared to standard residual bottlenecks. Unlike the original PANet (Path Aggregation Network) designs, our neck allows repeated bidirectional fusion, with each fusion stage incorporating learnable soft attention weights to adaptively control the contribution of each input feature. This configuration helps maintain both localized detail and global context, which is especially relevant when delineating cushion plants whose boundaries are often diffuse and irregular. The ability to emphasize semantically meaningful regions across scales enhances robustness against the background heterogeneity typical of moraine–talus surfaces, where the visual distinction between vegetation and substrate can be subtle and spatially inconsistent.
- Head: The instance segmentation head comprises classification, abjectness, and mask prediction branches. Its outputs are per-object masks aligned with three detection layers corresponding to P3 (low-level), P4 (mid-level), and P5 (high-level) feature maps, allowing the model to assign predictions to the most appropriate spatial scale. This multi-resolution output design accommodates the natural variation in cushion plant size, from small early-stage individuals to larger, mature mats with hemispherical growth forms. It also facilitates accurate delineation in cases where cushion boundaries are gradual and visually merge into surrounding gravel, soil, or adjacent vegetation. By leveraging spatial information at different levels, the head contributes to more stable and precise segmentation across the full morphological spectrum of cushion plants in moraine–talus ecosystem.
UniRepLKNetBlock [30], a lightweight and general-purpose feature extraction module that extends the idea of large-kernel convolution while addressing practical deployment and training challenges. The goal is to enhance the model’s ability to capture rich spatial patterns in mat-like vegetation, which often exhibits fine-grained, low-texture, and irregular structures in UAV imagery.
2.1.1. Architectural Design
Each UniRepLKNetBlock consists of four key components (see Figure 2):
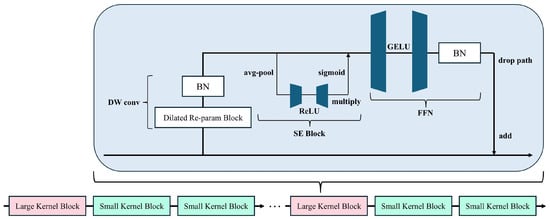
Figure 2.
Schematic Diagram of a Single UniRepLKNetBlock. The block integrates depthwise convolution (DW conv), a dilated re-parameterization module, and a squeeze-and-excitation (SE) unit, followed by a feed-forward network (FFN).
- Depth-wise Large Kernel Convolution: The core of the block is a depth-wise convolution layer with an enlarged kernel size (e.g., or ), enabling an expanded receptive field without significantly increasing computation. This operation is defined as:where is the input feature, is a depth-wise kernel, and ∗ denotes convolution.
- Channel Attention via Squeeze-and-Excitation (SE): After the convolution, we apply a SE block [32] o perform adaptive recalibration of channel-wise feature responses:where is the global average pooled descriptor for channel c, are linear layers, denotes the ReLU activation, and is the sigmoid function. The original feature map is then re-weighted channel-wise.
- Feedforward Network with GRN: To enhance non-linearity and capture global context, we employ a feedforward block composed of two linear transformations and GRN (Gated Relative Normalization):where are learnable parameters, and is a small constant. This operation promotes stable training and better convergence by normalizing feature magnitudes across spatial locations.
- Residual Addition and Layer Scale: Finally, the output is scaled by a learnable parameter and added to the original input:where denotes the transformed feature.
UniRepLKNetBlock incorporates deployment-aware re-parameterization, which allows the large-kernel convolution to be fused into a single standard convolution layer during inference, reducing runtime complexity and memory usage. This makes the module highly suitable for real-time applications in field monitoring scenarios.
2.1.2. Comparison and Advantages
Compared to traditional residual bottlenecks or C2f blocks, the proposed UniRepLKNetBlock achieves a larger effective receptive field, enabling the capture of spatially extended and low-contrast vegetation structures. Its channel-wise feature recalibration enhances the representation of subtle plant textures, while the incorporation of GRN strengthens non-linear transformations without compromising computational efficiency. Furthermore, the structural re-parameterization design allows flexible deployment across training and inference stages. Together, these properties enable the backbone to extract discriminative features crucial for identifying cushion species under varying backgrounds and scales.
2.2. BIMAFPN
To enhance the model’s ability to extract reliable features for the segmentation of cushion species with ambiguous boundaries in high-altitude regions, we propose a novel feature fusion neck structure termed BIMAFPN (Figure 3), which integrates the bidirectional fusion mechanism of the Bidirectional Feature Pyramid Network (BiFPN) [26] with the adaptive attention design of the Multilevel Attention Feature Pyramid Network (MAFPN). This combination enables more balanced and discriminative multi-scale feature representations.
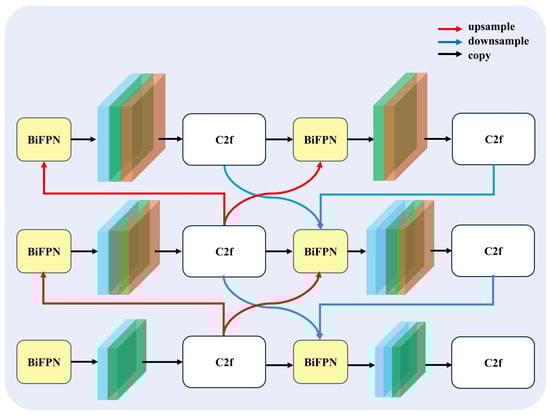
Figure 3.
BIMAFPN: A Novel BiFPN–MAFPN Hybrid Feature Fusion Neck. The design integrates bidirectional feature fusion from BiFPN with adaptive attention mechanisms inspired by MAFPN to achieve balanced and discriminative multi-scale feature representations.
2.2.1. Multilevel Attention Fusion
MAFPN enhances the traditional feature pyramid by introducing attention-aware weighted fusion, which allows the network to focus on critical feature regions across different scales. This is particularly beneficial in ecological segmentation tasks where the object edges are often fuzzy or poorly defined.
Given a set of input feature maps from different backbone stages, the attention-enhanced fusion is performed as:
where denotes the neighboring levels to be fused with level i, are normalized fusion weights learned during training, and denotes the attention module that filters the relevant regions in before fusion. This attention-based mechanism ensures that useful context and spatial cues are preserved, while irrelevant noise is suppressed.
2.2.2. Bidirectional Feature Flow
While the attention mechanism enhances the discriminability of individual features, BiFPN introduces a recurrent bidirectional fusion structure that repeatedly propagates information both top-down and bottom-up. This iterative refinement enhances feature consistency across scales and improves the generalization of the segmentation network to complex alpine backgrounds. At each iteration t, the feature maps are updated via:
where the Fusion operator denotes a lightweight aggregation using depthwise separable convolution and learned scalar weights. Multiple iterations are applied to gradually refine the feature representations.
2.2.3. Advantages and Relevance
BIMAFPN improves feature fusion and attention selectivity by enhancing fuzzy boundary representation and integrating low-level texture with high-level contextual semantics for robust multi-scale segmentation. The symmetrical bidirectional fusion structure maintains a balanced information flow between layers, effectively preventing overfitting to deep or shallow features. In addition, the use of separable convolutions ensures computational efficiency suitable for UAV-based onboard or post-processing applications. By integrating these capabilities, BIMAFPN substantially enhances the network’s ability to handle spatial ambiguity and heterogeneous vegetation scales encountered in high-resolution imagery from moraine–talus environments.
3. Study Area and Dataset
3.1. Study Area
The forefield of Bayi Glacier (–E, –N; Figure 4b) was selected as the study area for model training and testing. Situated on the northeastern margin of the Tibetan Plateau (Figure 4a), Bayi Glacier is the largest plateau ice-cap glacier in the Qilian Mountains and ranks among the most extensive inland glaciers in China [33]. The regional climate is governed by prevailing westerlies, with a mean annual precipitation of 886.1 mm and a mean annual air temperature of −8.6 °C [34]. Compared with other debris-covered areas, cushion species are well developed and form patchy mats on stabilized microsites, making the site suitable for UAV surveys and consistent annotation (see Figure 5).
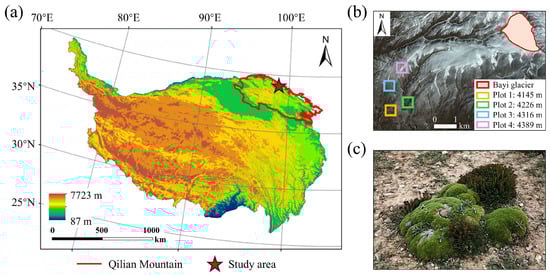
Figure 4.
Study area overview. (a) Geographic location on the Tibetan Plateau; (b) Foreland of Bayi Glacier with four sampling plots surveyed in July 2024; dominant cushion species R. rosea and T. caespitosum observed in the field. (c) Typical periglacial species: Thylacospermum caespitosum and Rhodiola rosea.
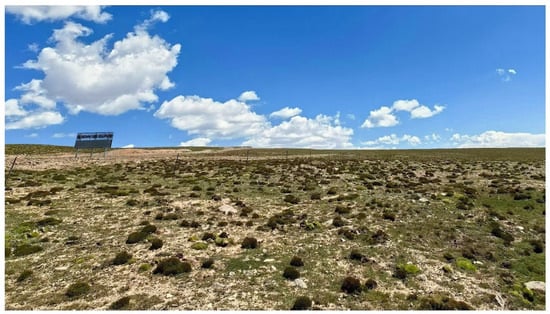
Figure 5.
Field view of the study area in the Bayi Glacier forefield, Qilian Mountains.
Following Rauh’s typology, cushion species are commonly distinguished into two major forms: hemispherical and flat cushions [4]. Based on this classification, we selected two canonical periglacial species (see Figure 4c) as primary segmentation targets: Thylacospermum caespitosum (Cambess.) Schischk., which forms flat, mat-like cushions, and Rhodiola rosea L., which exhibits compact hemispherical cushions.
The study area ranges from 4100 to 4400 m a.s.l., with sampling plots established at 100 m intervals along the moraine–talus surface. Both R. rosea and T. caespitosum are widely distributed across this range, with subordinate taxa such as Sedum spp., Saussurea spp., Leontopodium spp., Rhodiola spp., and Saxifraga spp. Furthermore, graminoid species such as Festuca spp. and Kobresia spp. become apparent in the lower zone (around 4100 m a.s.l.).
3.2. Field Data Collection
3.2.1. Aerial Photography
For each 100 m × 100 m plot (Figure 4b), a UAV (DJI 350, DJI Innovation Company, Shenzhen, China), controlled by DJI RC Plus remote, was deployed to take photographs at a height of 30–70 m (varied depending on the terrain), with the camera oriented vertically downward. The UAV carried a DJI Zenmuse L2 payload, featuring a CMOS RGB mapping camera (20 MP effective pixels, 24 mm equivalent focal length, 84° field of view).
Under clear weather and light winds, the aerial photography work was carried out at around 12 a.m. on 16–18 July 2024. A forward overlap of 75% and side overlap of 50% were set, acquiring individual images at a ground sampling distance of 0.5–3 cm. The raw UAV photos were then processed using Pix4D 4.5.6 software to generate orthoimages.
3.2.2. Field Survey
Field surveys were conducted starting on the day following the completion of the UAV flight campaigns to ensure temporal consistency between field observations and aerial imagery. Within each 100 m × 100 m plot, three large quadrats (30 m × 30 m) were delineated based on UAV orthomosaics, following a diagonal sampling layout as illustrated in Figure 6.
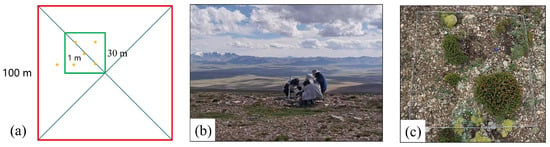
Figure 6.
Field survey sampling design and implementation. (a) Schematic of the sampling layout within each 100 m × 100 m plot: the red square denotes the plot boundary, the green squares denote the 30 m × 30 m large quadrats, and the yellow points denote the predefined candidate locations along the diagonal transect used for selecting 1 m × 1 m subquadrats; (b) Field survey scene; (c) Example of a 1 m × 1 m field quadrat.
Along the diagonal of each large quadrat, five candidate points were predefined, from which five 1 m × 1 m subquadrats were randomly selected. In addition, one extra 1 m × 1 m subquadrat was randomly established outside the large quadrats within each plot to capture local heterogeneity. This sampling design resulted in a total of 16 field quadrats per plot. In total, 64 valid field quadrats were surveyed across the four plots. Within each subquadrat, species-level canopy cover and plant density were recorded for subsequent comparison with UAV-derived estimates.
3.2.3. Georeferenced Cushion Species Dataset
High-quality training samples are essential for developing robust deep-learning models for periglacial vegetation mapping. First, we manually annotated a reference dataset from Plot 3 (4100 m a.s.l.) using Labelme 5.8.3, as shown in Figure 7. T. caespitosum (outlined in red) typically exhibits a relatively flat and continuous cushion canopy with smoother surface texture and larger individual size. In RGB orthomosaics, its foliage appears yellowish-green, often corresponding to young or actively growing tissues, which contrasts clearly with the surrounding gravel substrate. In contrast, R. rosea (outlined in green) forms compact, rosette-like structures with darker green tones, smaller and more irregular canopy outlines, and greater internal structural heterogeneity. These individuals commonly display uneven margins and fragmented internal textures, reflecting their distinct growth form.
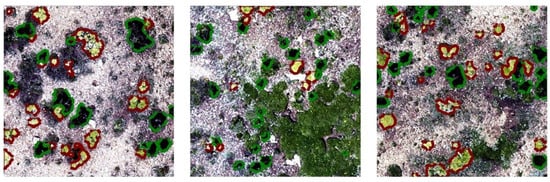
Figure 7.
Examples of annotated R. rosea (green) and T. caespitosum (red).
Background elements were also explicitly considered during annotation to reduce mislabeling. Non-target features mainly consisted of exposed moraine–talus surfaces and contiguous graminoid meadows, which are characterized by large, connected patches and linear or fibrous textures, clearly differing from discrete cushion canopies. Annotation was conducted by cross-referencing UAV imagery with contemporaneous field observations to ensure consistency between image-based interpretation and in situ species traits. Ambiguous objects occurring under strong shadowing, extreme illumination contrast, or partial occlusion were conservatively excluded from the training set. Together, these criteria ensured that species labels were grounded in reproducible morphological and spectral cues rather than subjective visual judgment, thereby enhancing the reliability of species-level segmentation.
We extracted 528 non-overlapping image tiles of pixels comprising 5738 instances of T. caespitosum and 11,750 instances of R. rosea (17,488 labels in total), holding out 20% of the tiles of the same size for validation. To preserve spatial independence, 80% of the tiles were used for training and 20% for validation. Each annotation polygon was georeferenced to the orthomosaic and accompanied by metadata on geographic coordinates, illumination, and substrate type. This dataset captures fine-scale heterogeneity in vegetation cover and reflectance patterns across moraine–talus surfaces, providing a representative basis for model development and evaluation.
4. Experiments and Results
4.1. Experimental Setup
To evaluate the effectiveness of our proposed method, we conducted all experiments on a workstation running Windows 11 (Microsoft Corporation, Redmond, WA, USA). The hardware configuration included an NVIDIA RTX 4070 Ti Super GPU (NVIDIA Corporation, Santa Clara, CA, USA) with 16 GB of memory. The models were implemented using the PyTorch version 2.2.2 deep learning framework (v2.2.2, PyTorch Foundation, San Francisco, CA, USA).
For fair comparison, all models were trained from scratch without using any pretrained weights. The training was conducted for 300 epochs with a batch size of 8. During testing, the Intersection over Union (IoU) threshold was set to 0.7, and the batch size was increased to 16 to accelerate inference and maintain consistent accuracy.
4.2. Evaluation Metrics
To comprehensively evaluate the performance of our model, we adopt several widely used metrics in object detection tasks, including Precision, Recall, Average Precision (AP), mean Average Precision (mAP), and Parameters (Params).
4.2.1. Precision and Recall
Precision and recall are calculated as follows:
where:
- TP (True Positives): Correctly predicted positive instances.
- FP (False Positives): Incorrectly predicted positive instances.
- FN (False Negatives): Missed positive instances.
4.2.2. Average Precision (AP)
AP represents the area under the precision-recall curve and is calculated as:
where is the precision at a given recall .
4.2.3. Mean Average Precision (mAP)
We report both mAP@0.5 and mAP@0.5:0.95. The mAP is the mean of AP over all classes:
where:
- K: The total number of classes.
- : The average precision for class i.
- Specifically, mAP@0.5 refers to the average precision at an IoU threshold of 0.5, while mAP@0.5:0.95 is the average of mAP values computed at IoU thresholds from 0.5 to 0.95 with an increment of 0.05.
4.2.4. Model Complexity
The number of model parameters (Params) is reported to reflect the model’s complexity and computational demand.
4.3. Ablation Study
Table 1 summarizes the ablation study results conducted to evaluate the individual and combined contributions of the proposed UniRepLKNetBlock and BIMAFPN modules. To ensure consistency and reproducibility, these modules were incrementally integrated into a YOLOv8s baseline, which serves as a reference framework. We report key detection metrics including Precision (P), Recall (R), mean Average Precision at an IoU threshold of 0.5 (mAP@0.5), mean Average Precision averaged over multiple IoU thresholds from 0.5 to 0.95 (mAP@0.95), as well as the total number of model parameters in millions (Params).

Table 1.
Ablation study on the proposed modules. Precision (P), Recall (R), mAP@0.5, and mAP@0.5:0.95 are reported.
The baseline YOLOv8s model achieves a relatively high precision of 0.928, indicating accurate positive predictions, but its recall and mAP metrics suggest room for improvement in detecting all relevant objects, especially under challenging highland vegetation conditions.
Introducing the BIMAFPN module, which enhances multi-scale feature fusion through bidirectional and attention mechanisms, improves the recall from 0.911 to 0.924 and mAP@0.5 from 0.956 to 0.964. Interestingly, this module also reduces the parameter count significantly, from 11.78 M to 8.58 M, indicating a more efficient network design. The slight decrease in precision to 0.930 suggests a minor trade-off for better coverage of true positives.
The UniRepLKNetBlock, designed to improve feature extraction with large-kernel convolutions and attention mechanisms, also yields notable improvements in recall and mAP values compared to the baseline, with a more balanced precision-recall trade-off. The parameter size is moderately reduced to 10.85 M, reflecting the addition of more sophisticated backbone blocks.
The combined model that integrates both UniRepLKNetBlock and BIMAFPN achieves the best overall performance across all metrics. It improves recall to 0.930, mAP@0.5 to 0.975, and mAP@0.95 to 0.785, while achieving the lowest parameter count of 7.65 M among all variants. This demonstrates that the synergy of enhanced backbone feature extraction and advanced neck-level fusion can lead to both better detection accuracy and model efficiency.
Overall, these results validate the effectiveness of the proposed modules in addressing the challenges of fuzzy boundaries and complex textures in mat-like species segmentation. The improvements in both detection metrics and model compactness highlight the practical potential of our approach for deployment in resource-constrained environments.
4.4. Comparison with Other Models
To evaluate the performance of the proposed model, we used CryoFlora, a comprehensive comparison against representative lightweight detectors including YOLOv5s [35], YOLOv8s [36], and YOLOv9s [37]. As shown in Table 2, we report four key metrics—Precision (P), Recall (R), mAP@0.5, and mAP@0.5:0.95—for both the full dataset (all classes) and individual species, namely T. caespitosum and R. rosea.
Table 2.
Comparison of different models on the cushion species dataset. Metrics reported are Precision (P), Recall (R), mAP@0.5, and mAP@0.5:0.95. Best values in each column are highlighted in bold.
For the overall detection task, our model achieves a Precision of 0.952, Recall of 0.930, mAP@0.5 of 0.975, and mAP@0.5:0.95 of 0.785, outperforming all baseline models in both accuracy and robustness (see Table 2). Notably, it also has the lowest parameter count (7.65 M) among all evaluated models, confirming its suitability for edge deployment and resource-constrained ecological monitoring systems.
At the species level, the advantages of the proposed model are even more pronounced. For T. caespitosum, CryoFlora achieves the best performance in all four metrics, with a Precision of 0.965, Recall of 0.942, mAP@0.5 of 0.980, and mAP@0.5:0.95 of 0.800. This demonstrates its superior ability to detect smaller, more fragmented vegetation patterns. For R. rosea, CryoFlora attains the highest mAP@0.5:0.95 (0.770) among all evaluated models, while simultaneously maintaining high Precision (0.939) and Recall (0.918). The performance consistency across species underscores the generalizability and robustness of our multi-scale and modality-aware architecture.
The superior results can be attributed to two key architectural enhancements: (1) the UniRepLKNetBlock, which captures both local texture and long-range dependencies through efficient convolutional operations, and (2) the BIMAFPN, which adaptively fuses multi-modal features and enhances semantic representations across scales. These innovations allow the model to better capture subtle morphological cues and context variations, which are critical for accurate identification in heterogeneous highland vegetation scenes.
Overall, the proposed model outperforms YOLO-based baselines while maintaining a compact size, highlighting its suitability for UAV and edge-based ecological monitoring.
4.5. Cushion Species Mapping Results
To translate segmentation outputs into ecologically interpretable indicators, the model further enables quantitative extraction of object-level geometric traits. Three key metrics were computed to characterize patch size and shape complexity: area, perimeter, and shape index, all derived from the binary segmentation mask.
The area A of a target is calculated as the product of the number of pixels in the mask and the actual area represented by a single pixel :
The perimeter P of a target is obtained by summing the lengths of its external contours, converted to real-world units. Where represents the length of each contour, scaled by the pixel size:
The shape index (SI) is used to quantify shape complexity, defined as:
where SI ≈ 1 indicates a near-circular object, and larger values reflect greater deviation from circularity. These morphological descriptors serve as the foundation for analyzing spatial patterns of cushion plant colonization across elevation gradients.
Figure 8 shows the prediction of T. caespitosum and R. rosea across the four plots in the forefield of Bayi Glacier, with total mapped cover ranging from 575.50 m2 at Plot 2 to 999.34 m2 at Plot 4 (Table 3). To assess the accuracy of UAV-derived ecological indicators, canopy cover and patch density estimated from CryoFlora outputs were compared with field survey measurements. In total, 53 valid field quadrats record were used and spatially matched with the corresponding UAV imagery. The coefficient of determination (R2) was calculated to quantify the agreement between field-based and UAV-derived estimates at both the plot level (total) and the species level.
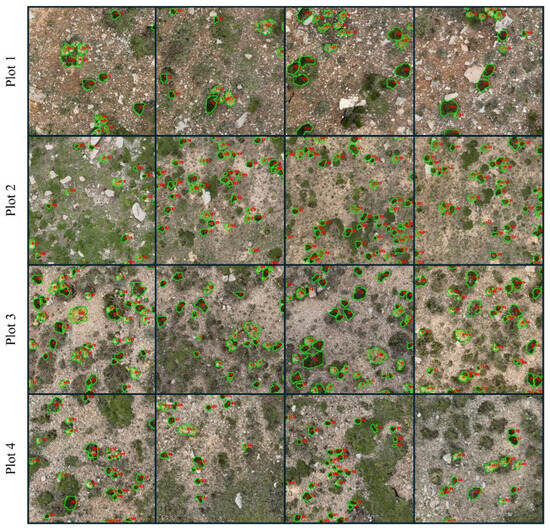
Figure 8.
Instance segmentation results of CryoFlora across four plots along an elevational gradient (4100–4400 m a.s.l.).
Table 3.
Spatial structure metrics of T. caespitosum and R. rosea across four plots. Area in m2, density in ind/m2, average perimeter in m, shape index in %.
As shown in Table 4, UAV-derived canopy cover exhibits moderate to strong agreement with field measurements across all plots. At the plot level, the R2 values for total cover range from 0.564 in Plot 1 to 0.648 in Plot 3, with consistently high correspondence also observed at the species level. For example, R2 values for R. rosea reach 0.682 in Plot 3 and 0.681 in Plot 4, indicating stable performance across sites. In contrast, density shows lower and more variable agreement, with plot-level R2 values ranging from 0.322 to 0.440, particularly in sparsely vegetated plots. The underlying causes of these differences are discussed in Section 5.
Table 4.
values between UAV-derived and field-based indicators.
As the foundation species of this glacier-foreland ecological community, their combined cover, apart from Plot 2 (575.50 m2, 5.76%), increases steadily with elevation, approaching 10% of the plot area at Plot 4. Patch density follows a mid-elevation peak, rising from Plot 1 (0.21 ind/m2) to Plot 2 (0.37 ind/m2), peaking at Plot 3 (1.48 ind/m2) before declining to 0.14 ind/m2 at Plot 4. This pattern indicates that pioneer cushion plants are most fragmented at 4300 m a.s.l., while lower and higher elevations support fewer but larger, contiguous patches.
The proportion of R. rosea increases slightly with elevation, accounting for 74.1% of total cover in Plot 1 and rising to 76.1% in Plot 4, whereas T. caespitosum contributes the remaining 23.9–25.9%. Patch density varies markedly among sites, peaking at 1.48 patches/m2 in Plot 3 and dropping to 0.14 patches/m2 in Plot 4. Mean patch area is smallest in Plot 3 (0.05 m2) and largest in Plot 4 (0.17 m2), mirroring trends in average perimeter (0.93 m vs. 1.86 m). Average Shape Index remains relatively constant (1.16–1.23), indicating similar patch compactness across elevations. These results reveal clear elevational gradients in both species dominance and patch morphology, reflecting the combined effects of microtopography, substrate stability, and moisture availability on glacier-forefield vegetation.
T. caespitosum exhibits a hump-shaped response to elevation. Its total cover peaks at Plot 3 with 266.30 m2, declines to a minimum of 140.24 m2 at Plot 2, then rises again to 240.53 m2 at the highest Plot. Patch density similarly falls from 0.58 ind/m2 at Plot 1 to 0.09 ind/m2 at Plot 2, rebounds to 0.50 ind/m2 at Plot 3, and finally drops to 0.04 ind/m2 at Plot 4. Mean patch area and perimeter follow the same U-shaped pattern, reaching their minimum at mid-elevation (0.05 m2 and 0.93 m) and increasing toward the low and high elevation extremes. Shape index remains relatively constant between 1.17 and 1.23.
By contrast, R. rosea’s total cover increases steadily with elevation, from 623.72 m2 at Plot 1 to 758.81 m2 at Plot 4. Its patch density peaks at mid-elevation (0.98 ind/m2 at Plot 3) and declines toward both lower and higher elevations (0.15 ind/m2 at Plot 1, 0.10 ind/m2 at Plot 4). Mean patch area and perimeter are smallest at Plot 3 (0.07 m2 and 1.03 m) and largest at Plot 4 (0.23 m2 and 1.86 m), while shape index remains stable at 1.16–1.20. Within each plot, R. rosea consistently forms fewer but larger patches compared to T. caespitosum, indicating that R. rosea establishes as extensive, contiguous mats, whereas T. caespitosum occurs as numerous, smaller cushions, most notably fragmented at mid-elevation.
5. Discussion
5.1. Ecological Significance and Monitoring Potential of Cryoflora
As glaciers retreat and ice cover melts, newly exposed moraine–talus landscapes provide critical natural laboratories for investigating some of the most pressing issues of the Anthropocene, including climate change, habitat degradation, biodiversity loss, and freshwater scarcity [1,3,38]. However, the harsh environmental conditions of these high-altitude forefields, together with the limited spatial resolution of satellite imagery and the logistical constraints of ground-based surveys, have long restricted comprehensive spatial analysis and vegetation mapping. As a result, ecological understanding of glacier-fields systems has traditionally relied on localized plot-based observations, which, while taxonomically accurate, are difficult to extrapolate to landscape scales or to repeat consistently through time.
Within these pristine and highly dynamic ecosystems, cushion plants commonly function as foundation species or key facilitators. By forming compact canopies close to the ground, they buffer extreme temperature fluctuations, retain moisture, and stabilize unconsolidated substrates, thereby creating favorable microhabitats for other plant species. Consequently, the conservation value of cushion plants lies not only in their own persistence, but also in the micro-communities and interaction networks they sustain. Recent network-based evidence demonstrates that the loss of cushion foundations can trigger cascading effects across associated plant assemblages, lending support to the concept of “micro-communities as conservation units” rather than treating individual species in isolation [39]. In this context, spatially explicit information on the persistence, expansion, or fragmentation of foundation cushions becomes directly relevant for conservation planning, such as delineating micro-reserves or implementing exclusion management in the most sensitive forefield zones.
Despite their ecological importance, cushion plants are characterized by small canopy sizes and highly fragmented spatial distributions, making manual surveys impractical for landscape-scale analyses [2,11]. CryoFlora was therefore designed around a pragmatic objective for periglacial ecology: to advance from community-level cover estimates to individual-plant recognition at landscape scale. Implemented within an instance segmentation framework, the model integrates a customized backbone, an enhanced feature-fusion neck, and an instance-aware head, enabling the reliable separation of small, densely clustered cushions and dwarf rosettes from heterogeneous backgrounds while effectively separating adjacent individuals, which is a limitation widely documented in high-resolution remote-sensing-based vegetation mapping [15,24]. In ablation experiments, the introduction of instance-aware segmentation substantially reduced merging and splitting errors within aggregated cushion canopies relative to the semantic-only baseline. As a result, overall recall increased from 0.911 to 0.930, and mAP@0.5 improved from 0.956 to 0.975, while the total number of model parameters was reduced from 11.78 M to 7.65 M. This combination of improved accuracy and reduced model complexity facilitates lightweight and efficient processing of large volumes of UAV RGB imagery, which is a critical requirement for operational ecological monitoring in remote alpine environments.
This capability is consistent with advances in individual-based remote sensing across diverse ecological contexts. In species-rich mosaics, deep learning applied to UAV-based RGB imagery has already been shown to identify and map individual plants, demonstrating that canopy-scale texture and morphology carry species and growth-form signals usable for ecological inference [40]. At the tree scale, individual-based approaches have been used to map functional diversity by aggregating morphological and, where available, physiological traits from remote sensing to neighborhoods and stands, providing a template for scaling traits from organisms to communities without losing individual information [41]. Recent phenological studies also demonstrated the capacity of UAV-based instance segmentation models to quantify tree-level flowering dynamics with high temporal precision, as shown in peach orchards where an optimized instance segmentation framework accurately detected and tracked phenophases across individual canopies [42]. These studies highlight the advantages of instance delineation for trait ecology and support our contention that plant-level segmentation in forefields can similarly connect organismal traits to emergent patterns of diversity and function across chronosequences.
By resolving plants as discrete biological individuals rather than pixel aggregates, instance-level segmentation fundamentally changes what can be inferred from UAV imagery in periglacial ecosystems. This shift enables direct quantification of individual-level traits, such as canopy area, perimeter and shape index, that are foundational to trait-based ecology and to linking organismal form with function. In glacier-foreland chronosequences, where colonization proceeds over highly heterogeneous substrates and microclimates, these traits help explain how early colonists establish, persist, and engineer niches that then cascade to community assembly and ecosystem functioning. For example, global syntheses show that glacier retreat reorganizes biodiversity and ecosystem services, with vegetation playing a central role in soil development, microclimate regulation, and primary productivity; however, most evidence has been compiled above the community scale, limiting mechanistic interpretation [1,8,43]. By extracting per-plant morphology consistently over space and time, CryoFlora fills this gap and provides the missing resolution to examine how individual cushions or rosettes modulate microhabitats, interact with neighbors, and contribute to successional trajectories.
5.2. Uncertainty and Limitations of UAV-Derived Ecological Indicators
Similar size-dependent detection biases have been widely reported in UAV-based vegetation mapping studies, particularly in alpine and proglacial environments. Several studies have demonstrated that sparse and low-frequency species are systematically underrepresented in UAV-derived products due to spatial resolution constraints and limited radiometric contrast, even when advanced object-based or deep-learning approaches are applied [10,13,17].
Consistent with these findings, our results indicate that the minimum detectable canopy area in the UAV imagery is approximately 0.0055 m2, constrained primarily by ground sampling distance and radiometric contrast. However, field quadrants frequently contain a substantial number of individuals smaller than this threshold, which are therefore omitted from UAV-based estimates. This size-dependent detection bias leads to a systematic underestimation of total cover, particularly in plots characterized by early successional stages or a high proportion of juvenile plants. Importantly, this effect reflects a resolution-driven visibility constraint rather than algorithmic failure and thus represents a fundamental limitation of image-based monitoring at the centimeter scale.
For plant density, the lower R2 values relative to cover are therefore expected and can be primarily attributed to the cumulative effect of false negatives. Density estimates are inherently more sensitive to missed detections than area-based metrics, as each undetected small individual directly reduces the count, whereas its contribution to total cover would be marginal. Consequently, plots dominated by small or highly fragmented individuals exhibit the largest discrepancies between UAV-derived and field-based density estimates. This pattern further reinforces that the dominant source of uncertainty arises from resolution-driven invisibility of small plants rather than misclassification of larger, ecologically dominant cushions, a limitation that has been widely reported to disproportionately affect density-related indicators in UAV-based ecological studies [16,21].
A second challenge affecting cover accuracy is related to interspecific canopy overlap. In moraine–talus ecosystems, T. caespitosum often functions as a physical substrate, with R. rosea and other low-stature alpine herbs (e.g., Kobresia spp.) rooting and growing directly on its cushion surface. Although species were annotated and quantified separately wherever possible, cases remain in which overlapping canopies could not be fully disentangled in nadir UAV imagery. In such situations, the overstory cushion species may be correctly detected, while the epiphytic or embedded species is partially or entirely absorbed into a single instance [9], leading to conservative estimates of species-specific cover and a tendency toward false negatives for subordinate taxa.
In addition to structural overlap, spectral ambiguity further contributes to localized cover uncertainty for R. rosea. This species exhibits relatively dark and spectrally muted tones in RGB imagery, which can resemble non-vegetated features such as pika burrow entrances, small ungulate fecal patches, or shaded meadow fragments. Despite the use of instance-level segmentation and contextual cues, residual confusion persists under low-illumination or high-shadow conditions, occasionally introducing localized overestimation in some plots.
Taken together, these complementary sources of uncertainty indicate that errors in UAV-based instance segmentation are not uniformly propagated across ecological indicators. While interspecific overlap and spectral confusion may introduce localized bias in species-specific cover, their influence is largely constrained to subordinate or spectrally ambiguous taxa. By contrast, canopy cover and spatial structure of dominant cushion species remain robustly captured, whereas density estimates for very small individuals are inherently conservative due to resolution-driven omission. Future work will focus on mitigating these limitations by integrating higher-resolution sensors, multi-angle observations, or multimodal data (e.g., RGB–thermal or RGB–hyperspectral fusion), as well as by developing scale-aware correction models that explicitly account for size-dependent detection probability. Such advances are expected to improve the reliability of density-based indicators and extend the applicability of CryoFlora to earlier successional stages and more heterogeneous alpine vegetation communities.
5.3. Limitations and Future Directions of Cryoflora
Despite CryoFlora’s strong performance in detecting and segmenting individual periglacial plants, several limitations remain that must be addressed to improve generalizability, ecological applicability, and operational efficiency.
Data availability and representativeness remain primary constraints. The current training dataset covers only two dominant cushion species, T. caespitosum and R. rosea, within a single glacier forefield. This limited taxonomic and spatial scope raises concerns regarding model transferability to other species, vegetation forms, and periglacial landscapes with different substrate textures, illumination conditions, and microclimates [40]. At present, there are no publicly available, high-resolution UAV benchmark datasets specifically targeting species-level mapping of alpine cushion plants in glacier-forefield or periglacial environments. Most existing UAV vegetation datasets focus on forests, croplands, or low-altitude grasslands, whose canopy structures and spectral characteristics differ fundamentally from those of cushion-dominated alpine systems. Expanding annotated datasets across multiple forefields and climatic zones is therefore essential for building more robust models. Collaborative initiatives and shared benchmarks, such as the NEON crown delineation dataset for forests [44], could accelerate this process, while domain adaptation techniques could reduce the need for exhaustive re-annotation [45].
Within these data constraints, we conducted a weak but meaningful generalization assessment by training CryoFlora on annotated data from a single plot and subsequently applied, without additional fine-tuning, to multiple independent plots spanning an elevational gradient from 4100 to 4400 m a.s.l. These plots differ in vegetation cover, species dominance, substrate composition, and illumination conditions, representing realistic environmental heterogeneity commonly encountered in alpine glacier forefields [2,10,12]. Although this cross-elevation deployment does not constitute a full cross-regional validation, it provides a preliminary assessment of model robustness beyond the training distribution and reflects practical deployment scenarios in high-altitude ecological monitoring, where annotated data are typically available only for limited areas.
Another methodological consideration concerns the scope of model comparison. In this study, we focused on lightweight, one-stage instance segmentation frameworks rather than heavier two-stage or transformer-based architectures such as Mask R-CNN or DETR variants. While these models have demonstrated strong performance on generic benchmarks, their high computational cost and relatively slow inference speed pose substantial challenges for large-scale UAV-based ecological monitoring [15,29], where thousands of high-resolution images must be processed efficiently.
The primary motivation behind this design choice is the potential for future onboard deployment of CryoFlora on UAV platforms. Our objective was not to pursue absolute state-of-the-art accuracy under laboratory conditions, but to develop a compact and deployable framework that can operate under constrained computational resources. In this regard, the relatively low parameter count of CryoFlora provides a practical foundation for subsequent real-time or near-real-time deployment on embedded devices. Our objective was not to achieve absolute state-of-the-art accuracy under laboratory conditions, but to develop a compact and deployable framework capable of rapidly processing large UAV datasets under constrained computing resources, which is a common requirement in alpine and cryospheric field studies [46,47].
At present, CryoFlora has not yet been deployed directly on UAV platforms. All training and inference in this study were conducted on local computing resources, and real-time onboard analysis has not been implemented. While the model’s current performance suggests that 30 FPS inference on embedded devices is theoretically achievable, actual deployment in high-altitude or polar environments would need to address additional constraints such as reduced battery capacity, intermittent GNSS signals, and unstable data links. In future work, integrating CryoFlora into an edge-cloud hybrid architecture, in which preliminary segmentation is performed onboard and batch refinement is completed on cloud servers, could enable near-real-time alerts while preserving high-quality outputs for long-term ecological archives [48].
Looking forward, future directions include:
- 1.
- Building multi-site, multi-species benchmark datasets for periglacial vegetation across different glacier forefields and alpine regions, with standardized annotation protocols to support robust cross-site validation and improve model generalizability under heterogeneous environmental conditions;
- 2.
- Integrating multi-sensor UAV payloads, including hyperspectral, LiDAR, and thermal sensors, to jointly characterize structural, biochemical, and physiological traits of individual plants, thereby extending CryoFlora from purely structural mapping toward functionally informed ecological monitoring;
- 3.
- Developing real-time or near-real-time onboard deployment strategies for CryoFlora on UAV platforms, leveraging lightweight model design and edge–cloud hybrid architectures to enable in situ analysis, rapid ecological feedback, and adaptive survey strategies in remote and data-scarce periglacial environments;
- 4.
- Establishing open-access repositories of per-plant metrics and georeferenced instance data to facilitate meta-analyses, cross-region synthesis, and predictive modeling of glacier-foreland vegetation dynamics and successional trajectories under ongoing climate change.
By systematically addressing these limitations, CryoFlora can evolve from a site-specific monitoring tool into a generalizable, scalable, and ecologically integrative platform for high-resolution vegetation mapping, supporting long-term observation and comparative analysis across some of the most rapidly transforming terrestrial ecosystems on Earth.
6. Conclusions
This study introduces CryoFlora, a lightweight instance segmentation framework for high-resolution monitoring of cushion species in glacier forefields and alpine environments. By integrating a large-kernel attention backbone (UniRepLKNetBlock) with a bidirectional multi-scale fusion neck (BIMAFPN), CryoFlora achieves a favorable balance between segmentation accuracy and computational efficiency, attaining 0.944 mAP@0.5 and 0.622 mAP@0.5:0.95 with only 7.65 million parameters. This design enlarges the effective receptive field and stabilizes cross-scale semantics, enabling reliable delineation of small, densely clustered cushions against moraine–talus substrates. Beyond segmentation accuracy, the framework converts instance masks into ecological indicators, including plant cover, patch density, individual counts, canopy area, and perimeter, facilitating quantitative ecosystem assessments from UAV imagery.
Future work will prioritize landscape-level applications by integrating repeat UAV missions, high-resolution satellite imagery, and domain adaptation strategies to cover broader alpine and polar regions. Coupling CryoFlora’s outputs with geospatial analytics could further support applications such as habitat change detection along glacier retreat zones, erosion risk assessment, and alpine biodiversity conservation. By bridging deep learning and ecological monitoring, this work lays the foundation for reproducible, long-term assessment of climate-sensitive high-altitude ecosystems.
Author Contributions
Conceptualization, X.A. and R.C.; methodology, J.H. and Y.L.; validation, X.A., J.H.; formal analysis, X.A., J.H., Y.L. and R.C.; investigation, C.H. and Y.T.; data curation, X.A., C.H. and Y.T.; writing—original draft preparation, X.A., and J.H.; writing—review and editing, X.A., J.H., Z.L. and Y.Z.; visualization, X.A.; supervision, J.H. and R.C.; project administration, R.C.; funding acquisition, R.C. and C.H. All authors have read and agreed to the published version of the manuscript.
Funding
This work was supported by the Central Government for Local Science and Technology Development Project (Grant No.25ZYJA019), Gansu Provincial Science and Technology Planning Project (Grant No. 24ZD13FA004), Gansu Provincial Key Research and Development Plan Projects (Grant No. 25YFFA094), National Natural Science Foundation of China (Grant No. 42171145), Functional Development of Instruments and Equipment Technology Innovation Project of Chinese Academy of Sciences (Grant No. 2025g104).
Data Availability Statement
The original contributions presented in this study are included in the article. Further inquiries can be directed to the corresponding author.
Conflicts of Interest
The authors declare no conflicts of interest.
References
- Cauvy-Fraunié, S.; Dangles, O. A global synthesis of biodiversity responses to glacier retreat. Nat. Ecol. Evol. 2019, 3, 1675–1685. [Google Scholar] [CrossRef]
- Ficetola, G.F.; Marta, S.; Guerrieri, A.; Gobbi, M.; Ambrosini, R.; Fontaneto, D.; Zerboni, A.; Poulenard, J.; Caccianiga, M.; Thuiller, W. Dynamics of ecological communities following current retreat of glaciers. Annu. Rev. Ecol. Evol. Syst. 2021, 52, 405–426. [Google Scholar] [CrossRef]
- Bosson, J.B.; Huss, M.; Cauvy-Fraunié, S.; Clément, J.C.; Costes, G.; Fischer, M.; Poulenard, J.; Arthaud, F. Future emergence of new ecosystems caused by glacial retreat. Nature 2023, 620, 562–569. [Google Scholar] [CrossRef] [PubMed]
- Aubert, S.; Boucher, F.; Lavergne, S.; Renaud, J.; Choler, P. 1914–2014: A revised worldwide catalogue of cushion plants 100 years after Hauri and Schröter. Alp. Bot. 2014, 124, 59–70. [Google Scholar] [CrossRef]
- Cavieres, L.A. Facilitation and the invasibility of plant communities. J. Ecol. 2021, 109, 2019–2028. [Google Scholar] [CrossRef]
- Michalet, R.; Chen, S.y.; An, L.z.; Wang, X.t.; Wang, Y.x.; Guo, P.; Ding, C.c.; Xiao, S. Communities: Are they groups of hidden interactions? J. Veg. Sci. 2015, 26, 207–218. [Google Scholar] [CrossRef]
- Sotomayor, D.A.; Lortie, C.J. Indirect interactions in terrestrial plant communities: Emerging patterns and research gaps. Ecosphere 2015, 6, 1–23. [Google Scholar] [CrossRef]
- Casallas, L.M.V.; Khelidj, N.; Morán-Ordóñez, A.; Losapio, G. Global impacts of glacier retreat on ecosystem services provided by soil and vegetation in mountain Regions: A literature review. Ecosyst. Serv. 2025, 73, 101730. [Google Scholar] [CrossRef]
- Knoflach, B.; Ramskogler, K.; Talluto, L.; Hofmeister, F.; Haas, F.; Heckmann, T.; Pfeiffer, M.; Piermattei, L.; Ressl, C.; Wimmer, M.H.; et al. Modelling of vegetation dynamics from satellite time series to determine proglacial primary succession in the course of global warming—A case study in the Upper Martell Valley (Eastern Italian Alps). Remote Sens. 2021, 13, 4450. [Google Scholar] [CrossRef]
- Bayle, A.; Carlson, B.Z.; Zimmer, A.; Vallée, S.; Rabatel, A.; Cremonese, E.; Filippa, G.; Dentant, C.; Randin, C.; Mainetti, A.; et al. Local environmental context drives heterogeneity of early succession dynamics in alpine glacier forefields. Biogeosciences 2023, 20, 1649–1669. [Google Scholar] [CrossRef]
- Fischer, A.; Fickert, T.; Schwaizer, G.; Patzelt, G.; Groß, G. Vegetation dynamics in Alpine glacier forelands tackled from space. Sci. Rep. 2019, 9, 13918. [Google Scholar] [CrossRef]
- Rumpf, S.B.; Gravey, M.; Brönnimann, O.; Luoto, M.; Cianfrani, C.; Mariethoz, G.; Guisan, A. From white to green: Snow cover loss and increased vegetation productivity in the European Alps. Science 2022, 376, 1119–1122. [Google Scholar] [CrossRef] [PubMed]
- Kupková, L.; Červená, L.; Potŭčková, M.; Lysák, J.; Roubalová, M.; Hrázskỳ, Z.; Březina, S.; Epstein, H.E.; Müllerová, J. Towards reliable monitoring of grass species in nature conservation: Evaluation of the potential of UAV and PlanetScope multi-temporal data in the Central European tundra. Remote Sens. Environ. 2023, 294, 113645. [Google Scholar] [CrossRef]
- Adão, T.; Hruška, J.; Pádua, L.; Bessa, J.; Peres, E.; Morais, R.; Sousa, J.J. Hyperspectral imaging: A review on UAV-based sensors, data processing and applications for agriculture and forestry. Remote Sens. 2017, 9, 1110. [Google Scholar] [CrossRef]
- Li, J.; Cai, Y.; Li, Q.; Kou, M.; Zhang, T. A review of remote sensing image segmentation by deep learning methods. Int. J. Digit. Earth 2024, 17, 2328827. [Google Scholar] [CrossRef]
- Sun, Z.; Wang, X.; Wang, Z.; Yang, L.; Xie, Y.; Huang, Y. UAVs as remote sensing platforms in plant ecology: Review of applications and challenges. J. Plant Ecol. 2021, 14, 1003–1023. [Google Scholar] [CrossRef]
- Zangerl, U.; Haselberger, S.; Kraushaar, S. Classifying sparse vegetation in a proglacial valley using UAV imagery and random forest algorithm. Remote Sens. 2022, 14, 4919. [Google Scholar] [CrossRef]
- Bricher, P.K.; Lucieer, A.; Shaw, J.; Terauds, A.; Bergstrom, D.M. Mapping sub-Antarctic cushion plants using random forests to combine very high resolution satellite imagery and terrain modelling. PLoS ONE 2013, 8, e72093. [Google Scholar] [CrossRef]
- Lucieer, A.; Turner, D.; King, D.H.; Robinson, S.A. Using an Unmanned Aerial Vehicle (UAV) to capture micro-topography of Antarctic moss beds. Int. J. Appl. Earth Obs. Geoinf. 2014, 27, 53–62. [Google Scholar] [CrossRef]
- Sotille, M.E.; Bremer, U.F.; Vieira, G.; Velho, L.F.; Petsch, C.; Auger, J.D.; Simões, J.C. UAV-based classification of maritime Antarctic vegetation types using GEOBIA and random forest. Ecol. Inform. 2022, 71, 101768. [Google Scholar] [CrossRef]
- Groos, A.R.; Aeschbacher, R.; Fischer, M.; Kohler, N.; Mayer, C.; Senn-Rist, A. Accuracy of UAV photogrammetry in glacial and periglacial alpine terrain: A comparison with airborne and terrestrial datasets. Front. Remote Sens. 2022, 3, 871994. [Google Scholar] [CrossRef]
- Feng, C.; Zhang, W.; Deng, H.; Dong, L.; Zhang, H.; Tang, L.; Zheng, Y.; Zhao, Z. A combination of OBIA and random forest based on visible UAV remote sensing for accurately extracted information about weeds in areas with different weed densities in farmland. Remote Sens. 2023, 15, 4696. [Google Scholar] [CrossRef]
- Ronneberger, O.; Fischer, P.; Brox, T. U-net: Convolutional networks for biomedical image segmentation. In Proceedings of the International Conference on Medical Image Computing and Computer-Assisted Intervention; Springer: London, UK, 2015; pp. 234–241. [Google Scholar]
- He, K.; Gkioxari, G.; Dollár, P.; Girshick, R. Mask r-cnn. In Proceedings of the IEEE International Conference on Computer Vision; IEEE: Piscataway, NJ, USA, 2017; pp. 2961–2969. [Google Scholar]
- Chen, L.C.; Zhu, Y.; Papandreou, G.; Schroff, F.; Adam, H. Encoder-decoder with atrous separable convolution for semantic image segmentation. In Proceedings of the European Conference on Computer Vision (ECCV); Springer: Berlin/Heidelberg, Germany, 2018; pp. 801–818. [Google Scholar]
- Yang, Z.; Guan, Q.; Zhao, K.; Yang, J.; Xu, X.; Long, H.; Tang, Y. Multi-branch auxiliary fusion yolo with re-parameterization heterogeneous convolutional for accurate object detection. In Proceedings of the Chinese Conference on Pattern Recognition and Computer Vision (PRCV); Springer: Berlin/Heidelberg, Germany, 2024; pp. 492–505. [Google Scholar]
- Liu, H.; Hu, J.; Zhang, R.; Zhang, Y.; Liu, F.; Liao, Y. LC-DETR-Based Target Detection Algorithm for Separating Point of Ore Belt in Spiral Concentrator. In Proceedings of the 2025 IEEE 6th International Seminar on Artificial Intelligence, Networking and Information Technology (AINIT); IEEE: Piscataway, NJ, USA, 2025; pp. 1574–1581. [Google Scholar]
- Qian, S.; Li, J.; Yao, X. A lightweight image segmentation algorithm based on MobileNetv3 and global context block attention mechanism. In Proceedings of the Fourth International Conference on Computer Vision, Application, and Algorithm (CVAA 2024); SPIE: Bellingham, WA, USA, 2025; Volume 13486, pp. 637–647. [Google Scholar]
- Yasir, M.; Jianhua, W.; Shanwei, L.; Sheng, H.; Mingming, X.; Hossain, M. Coupling of deep learning and remote sensing: A comprehensive systematic literature review. Int. J. Remote Sens. 2023, 44, 157–193. [Google Scholar] [CrossRef]
- Ding, X.; Zhang, Y.; Ge, Y.; Zhao, S.; Song, L.; Yue, X.; Shan, Y. Unireplknet: A universal perception large-kernel convnet for audio video point cloud time-series and image recognition. In Proceedings of the IEEE/CVF Conference on Computer Vision and Pattern Recognition; IEEE: Piscataway, NJ, USA, 2024; pp. 5513–5524. [Google Scholar]
- Tan, M.; Pang, R.; Le, Q.V. Efficientdet: Scalable and efficient object detection. In Proceedings of the IEEE/CVF Conference on Computer Vision and Pattern Recognition; IEEE: Piscataway, NJ, USA, 2020; pp. 10781–10790. [Google Scholar]
- Hu, J.; Shen, L.; Sun, G. Squeeze-and-excitation networks. In Proceedings of the IEEE Conference on Computer Vision and Pattern Recognition; IEEE: Piscataway, NJ, USA, 2018; pp. 7132–7141. [Google Scholar]
- Guo, S.; Chen, R.; Liu, G.; Han, C.; Song, Y.; Liu, J.; Yang, Y.; Liu, Z.; Wang, X.; Liu, X.; et al. Simple parameterization of aerodynamic roughness lengths and the turbulent heat fluxes at the top of midlatitude August-One Glacier, Qilian Mountains, China. J. Geophys. Res. Atmos. 2018, 123, 12–066. [Google Scholar] [CrossRef]
- Zhao, Y. Observation Comparative Experiment and Calibration Research of Solid Precipitation in the Qilian Mountains. Master’s Thesis, Northwest Institute of Eco-environment and Resources, University of Chinese Academy of Sciences, Xi’an, China, 2022. [Google Scholar]
- Jocher, G. YOLOv5 by Ultralytics. Version 7.0. 2020. Available online: https://github.com/ultralytics/yolov5 (accessed on 10 September 2025). [CrossRef]
- Jocher, G.; Chaurasia, A.; Qiu, J. YOLOv8 by Ultralytics. Version 8.0.0. 2023. Available online: https://github.com/ultralytics/ultralytics (accessed on 10 September 2025).
- Wang, C.Y.; Yeh, I.H.; Mark Liao, H.Y. Yolov9: Learning what you want to learn using programmable gradient information. In Proceedings of the European Conference on Computer Vision; Springer: Berlin/Heidelberg, Germany, 2024; pp. 1–21. [Google Scholar]
- Zimmer, A.; Beach, T.; Klein, J.A.; Recharte Bullard, J. The need for stewardship of lands exposed by deglaciation from climate change. Wiley Interdiscip. Rev. Clim. Change 2022, 13, e753. [Google Scholar] [CrossRef]
- Niu, M.Q.; Huang, M.H.; Yang, P.F.; Fu, Q.S.; Lin, J.; Chen, J.; Zhang, T.; Li, Z.M.; Liao, Z.Y.; Sun, H.; et al. Multiple cushion plants enhance alpine plant diversity through sustaining plant–plant co-occurrence networks. J. Plant Ecol. 2025, 18, rtaf116. [Google Scholar] [CrossRef]
- Zhang, C.; Atkinson, P.M.; George, C.; Wen, Z.; Diazgranados, M.; Gerard, F. Identifying and mapping individual plants in a highly diverse high-elevation ecosystem using UAV imagery and deep learning. ISPRS J. Photogramm. Remote Sens. 2020, 169, 280–291. [Google Scholar] [CrossRef]
- Zheng, Z.; Zeng, Y.; Schneider, F.D.; Zhao, Y.; Zhao, D.; Schmid, B.; Schaepman, M.E.; Morsdorf, F. Mapping functional diversity using individual tree-based morphological and physiological traits in a subtropical forest. Remote Sens. Environ. 2021, 252, 112170. [Google Scholar] [CrossRef]
- Gu, Q.; Cheng, J.; Zhang, M.; Li, X.; Jackson, R.; Ju, L.; Lou, W.; Chen, M.; Zhou, J.; Zhang, X. Quantifying tree-level peach flowering dynamics using UAV imagery and an optimized instance segmentation model. Comput. Electron. Agric. 2025, 237, 110766. [Google Scholar] [CrossRef]
- Wei, T.; Shangguan, D.; Yi, S.; Ding, Y. Characteristics and controls of vegetation and diversity changes monitored with an unmanned aerial vehicle (UAV) in the foreland of the Urumqi Glacier No. 1, Tianshan, China. Sci. Total Environ. 2021, 771, 145433. [Google Scholar] [CrossRef]
- Weinstein, B.G.; Marconi, S.; Bohlman, S.A.; Zare, A.; Singh, A.; Graves, S.J.; White, E.P. A remote sensing derived data set of 100 million individual tree crowns for the National Ecological Observatory Network. eLife 2021, 10, e62922. [Google Scholar] [CrossRef]
- Zeng, Q.; Geng, J. Task-specific contrastive learning for few-shot remote sensing image scene classification. ISPRS J. Photogramm. Remote Sens. 2022, 191, 143–154. [Google Scholar] [CrossRef]
- Huang, F.; Chen, S.; Wang, Q.; Chen, Y.; Zhang, D. Using deep learning in an embedded system for real-time target detection based on images from an unmanned aerial vehicle: Vehicle detection as a case study. Int. J. Digit. Earth 2023, 16, 910–936. [Google Scholar] [CrossRef]
- Cheng, Q.; Wang, H.; Zhu, B.; Shi, Y.; Xie, B. A real-time uav target detection algorithm based on edge computing. Drones 2023, 7, 95. [Google Scholar] [CrossRef]
- Koubaa, A.; Ammar, A.; Abdelkader, M.; Alhabashi, Y.; Ghouti, L. AERO: AI-enabled remote sensing observation with onboard edge computing in UAVs. Remote Sens. 2023, 15, 1873. [Google Scholar] [CrossRef]


Disclaimer/Publisher’s Note: The statements, opinions and data contained in all publications are solely those of the individual author(s) and contributor(s) and not of MDPI and/or the editor(s). MDPI and/or the editor(s) disclaim responsibility for any injury to people or property resulting from any ideas, methods, instructions or products referred to in the content. |
© 2026 by the authors. Licensee MDPI, Basel, Switzerland. This article is an open access article distributed under the terms and conditions of the Creative Commons Attribution (CC BY) license.