Highlights
What are the main findings?
- IMERG Early and Late Run satellite products delivered the most reliable precipitation estimates in the high-altitude lower Yarlung Zangbo Basin.
- Most satellite products systematically underestimated rainfall, with errors strongly dependent on season and elevation.
What is the implication of the main finding?
- Operational monitoring should use specific products for different tasks, such as IMERG for real-time alerts and reanalysis data for seasonal planning.
- The severe failure of a statistically corrected product underscores that local validation is essential and global algorithms may not work in complex terrain.
Abstract
Real-time precipitation monitoring through satellite remote sensing represents a critical technological frontier for operational hydrology in data-scarce mountainous regions. Following a comprehensive evaluation of reanalysis precipitation products in the downstream Yarlung Zangpo watershed, this investigation advances understanding by systematically assessing eight satellite-based precipitation retrieval algorithms against ground truth observations from 18 meteorological stations (2014–2022). Multi-temporal performance analysis employed statistical metrics including correlation analysis, root mean square error, mean absolute error, and bias assessment to characterize algorithm reliability across annual, monthly, and seasonal scales. Representative monthly spatial analysis (January, April, July) and comprehensive 12 month × 18 station heatmap visualization revealed pronounced seasonal performance variations and elevation-dependent error patterns. Satellite retrieval algorithms demonstrated systematic underestimation tendencies, with observational precipitation averaging 2358 mm/yr, substantially exceeding remote sensing estimates across six of eight products. IMERG_EarlyRun and IMERG_LateRun achieved optimal performance with annual correlation coefficients of 0.41/0.37 and minimal bias (relative bias: −3.0%/1.4%), substantially outperforming other products. Unexpectedly, IMERG_FinalRun exhibited severe deterioration (correlation: 0.37, relative bias: −73.8%) compared to Early/Late Run products despite comprehensive gauge adjustment, indicating critical limitations of statistical correction procedures in data-sparse mountainous environments. Temporal analysis revealed substantial year-to-year performance variability across all products, with algorithm accuracy strongly modulated by annual precipitation characteristics and underlying meteorological conditions. Station-level assessment demonstrated that 100% of stations showed underestimation for IMERG_FinalRun versus balanced patterns for IMERG_EarlyRun/LateRun (53% underestimation, 47% overestimation), confirming systematic gauge-adjustment failures. Supplementary terrain–precipitation analysis indicated GSMaP_MVK_G shows superior spatial pattern representation, while IMERG_LateRun excels in capturing temporal variations, suggesting multi-product integration strategies for comprehensive monitoring. Comparative assessment with previous reanalysis evaluation establishes that satellite products offer superior real-time availability but exhibit greater temporal variability compared to model-based approaches’ consistent performance. IMERG_EarlyRun and IMERG_LateRun are recommended for operational real-time applications, GSMaP_MVK_G for terrain-sensitive spatial analysis, and reanalysis products for seasonal assessment, while IMERG_FinalRun and FY2 require substantial improvement before deployment in high-altitude watershed management systems.
1. Introduction
Real-time precipitation monitoring has become increasingly critical for operational hydrology, disaster risk reduction, and climate monitoring systems worldwide [1,2,3,4,5]. Satellite-based precipitation retrieval technologies offer unprecedented opportunities for continuous monitoring, particularly in regions where conventional ground-based networks are inadequate [6,7,8,9,10]. Unlike historical reconstruction approaches, satellite systems provide near real-time estimates with global coverage, enabling rapid response to extreme weather events [11,12,13,14,15].
The southeastern margin of the Tibetan Plateau, particularly the lower Yarlung Zangpo River basin, presents a unique natural laboratory for evaluating satellite precipitation algorithms due to its exceptional climatic and topographical diversity [16,17,18,19,20]. This region encompasses the Yarlung Zangpo Grand Canyon, where precipitation patterns exhibit extreme spatial gradients over distances of just a few kilometers, creating ideal conditions for testing satellite sensor capabilities [21,22]. The area’s position at the intersection of multiple climate systems generates complex precipitation mechanisms that challenge current satellite retrieval algorithms [23,24,25].
Modern satellite precipitation products have evolved from single-sensor retrievals to sophisticated multi-satellite constellation approaches [26,27,28]. Products including China’s Fengyun (FY) series [29,30,31,32], Japan’s Global Satellite Mapping of Precipitation (GSMaP) family [33,34,35], and NASA’s Integrated Multi-Satellite Retrievals for Global Precipitation Measurement (IMERG) suite [36,37] represent the culmination of decades of sensor development and algorithm refinement. These products integrate observations from passive microwave radiometers, infrared sounders, and precipitation radars, employing advanced machine learning and data fusion techniques to optimize retrieval accuracy [11,38].
However, satellite-based precipitation detection faces inherent limitations in complex mountainous environments [39]. Microwave sensors suffer from signal contamination by surface emissions and scattering effects in topographically complex areas [40,41]. Infrared-based approaches rely on cloud-top temperature relationships that may not accurately represent precipitation intensity in orographically influenced systems [42,43]. Mixed-phase precipitation processes in high-altitude environments present additional challenges, as retrieval schemes are primarily calibrated for liquid precipitation [44,45]. These fundamental limitations have motivated extensive research into regional algorithm performance, particularly in mountainous watersheds where topographical complexity amplifies retrieval uncertainties.
In response to these validation needs, recent evaluations of precipitation products on the Tibetan Plateau have provided valuable regional performance insights [46,47,48,49], though most studies have focused predominantly on reanalysis or model-based datasets. Our previous systematic assessment of reanalysis precipitation products in the lower Yarlung Zangpo River region [50] revealed significant performance variations and highlighted topographical influences on accuracy but left open the question of how observation-based satellite retrievals perform under identical conditions. Building upon these findings, evaluating satellite-based products becomes essential to understand complementary strengths and limitations compared to model-driven approaches. While reanalysis products excel in providing physically consistent datasets, satellite products offer superior temporal resolution and independence from numerical model biases [51,52], making direct performance comparison scientifically valuable and operationally relevant. A critical dimension of this comparison concerns how different product types interact with complex topography—a factor that fundamentally shapes retrieval algorithm performance in mountainous regions.
Topographical influences on satellite precipitation retrieval represent a rapidly advancing research frontier, with studies demonstrating systematic elevation-dependent biases and aspect-related errors [44,47,53,54,55,56,57,58,59,60,61,62,63] that may differ fundamentally from the terrain-related errors observed in reanalysis products. Satellite products exhibit distinct error characteristics compared to reanalysis datasets, showing greater sensitivity to surface conditions and atmospheric variations [39,45,64] due to their direct reliance on electromagnetic signal interactions with the land-atmosphere system. The complex orography of the lower Yarlung Zangpo River basin—with elevation ranges exceeding 2000 m and steep precipitation gradients—provides an ideal testbed for quantifying these topographical effects and comparing how satellite versus reanalysis approaches respond to terrain complexity [48,65,66]. However, despite growing recognition of terrain influences, systematic comparative evaluation of multiple operational satellite products—spanning different algorithms, latency levels, and calibration approaches—remains limited in this critical hydrological region.
To address this knowledge gap and provide the comparative satellite-reanalysis assessment needed for informed operational decisions, this study presents the comprehensive evaluation of eight widely used satellite precipitation products (FY2, GSMaP_MVK, GSMaP_MVK_G, GSMaP_NRT, GSMaP_NRT_G, IMERG_EarlyRun, IMERG_LateRun, and IMERG_FinalRun) in the lower Yarlung Zangpo River basin. Unlike previous assessments that focused on model-based precipitation datasets, this investigation specifically examines the performance characteristics of observation-based satellite retrievals, providing complementary insights to our earlier reanalysis product evaluation [50]. The study incorporates nine years of ground observation data (2014–2022), encompassing recent algorithm improvements and capturing the evolution of satellite precipitation estimation capabilities.
The primary objectives of this research are to perform the following: (1) quantify the accuracy and bias characteristics of contemporary satellite precipitation products against ground observations in the lower Yarlung Zangpo River basin; (2) analyze the spatial error patterns and their relationships with topographical variables, building upon our previous understanding of reanalysis product performance in the region; (3) evaluate the capability of satellite products to capture precipitation spatial heterogeneity and provide insights for operational hydrological applications; and (4) compare satellite product performance with our previously evaluated reanalysis datasets to guide optimal data source selection for different applications.
2. Data and Methods
2.1. Study Region Charateristics
The lower Yarlung Zangpo River basin (Figure 1) represents one of Earth’s most challenging environments for satellite precipitation retrieval, characterized by extreme topographical complexity and diverse microclimatic conditions. This region encompasses the dramatic transition from the high-altitude Tibetan Plateau (>4000 m) to subtropical valleys (<1000 m) within distances of less than 100 km, creating steep precipitation gradients that test the spatial resolution limits of current satellite sensors [17,20,21]. The basin’s unique position at the convergence of multiple atmospheric circulation systems—including the South Asian monsoon, East Asian monsoon, and mid-latitude westerlies—generates complex precipitation patterns with high temporal variability that challenge satellite algorithm assumptions [24,67,68].
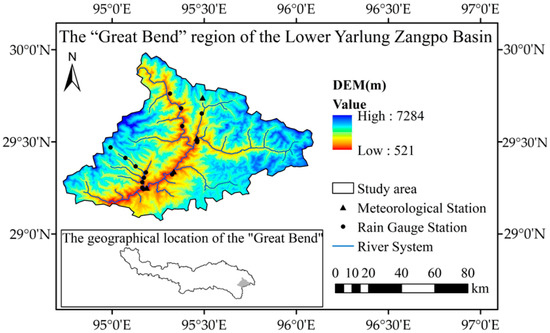
Figure 1.
Topographic map of the ‘Great Bend’ region in the Lower Yarlung Zangpo Basin displaying elevation gradients (521–7284 m), hydrological monitoring stations, and river networks, illustrating the dramatic terrain variation and observational infrastructure within this critical Himalayan watershed.
Satellite observation conditions in this region are particularly demanding due to frequent cloud cover during monsoon seasons, mixed-phase precipitation processes at high elevations, and complex surface emissivity patterns caused by varied land cover types ranging from glaciers to dense forests. These conditions create systematic challenges for passive microwave sensors, which must distinguish precipitation signals from surface emissions, and infrared sensors, which rely on cloud-top temperature relationships that may not accurately represent surface precipitation intensity.
2.2. Satellite Precipitation Products
This investigation employs eight operational satellite precipitation products, selected to represent the diversity of current retrieval approaches and data availability characteristics critical for operational applications. The product selection encompasses different levels of processing latency, from near real-time (1–4 h) to research-quality (3.5 months), allowing for a comprehensive assessment of the accuracy–timeliness trade-offs inherent in satellite precipitation estimation.
Eight satellite precipitation products were evaluated in this study (Table 1), representing different retrieval algorithms, calibration approaches, and operational characteristics. These include the Chinese Fengyun-2 (FY2) geostationary infrared product [69,70], four variants from the Global Satellite Mapping of Precipitation (GSMaP) family [34], and three products from NASA’s Integrated Multi-Satellite Retrievals for GPM (IMERG) suite [37].

Table 1.
Characteristics of satellite precipitation products evaluated in this study.
The product selection represents the spectrum of operational satellite precipitation capabilities as follows: geostationary infrared-based estimation (FY2), near real-time products for operational applications (GSMaP_NRT, IMERG_EarlyRun), and research-quality products with comprehensive gauge adjustment (GSMaP_MVK_G, IMERG_FinalRun). This enables systematic evaluation of trade-offs between retrieval methods, data latency, gauge correction approaches, and accuracy in complex mountainous terrain.
All satellite products were acquired for the 2014–2022 period and standardized to a uniform 0.1° × 0.1° spatial grid using conservative remapping procedures to ensure consistent inter-product comparison. The standardization employed the first-order conservative remapping algorithm implemented in Climate Data Operators (CDO) [71,72], which preserves precipitation mass through area-weighted calculations as follows:
where P_target is the remapped value, P_source represents original grid values, A_overlap is the overlapping area between source and target cells, and A_source is the source cell area. This approach maintains water balance consistency, superior to bilinear interpolation for precipitation data.
P_target = Σ(P_source × A_overlap/A_source)
Products were temporally aggregated from native resolution (daily for FY2, hourly for GSMaP, and 30 min for IMERG) to monthly totals. Monthly values were calculated only when data availability exceeded 80%; months with >20% missing data were excluded. Post-standardization quality control verified precipitation mass conservation (deviations < 0.1%), grid alignment, and absence of spurious values.
2.3. Ground Reference Observations
Validation data comprise precipitation measurements from 18 operational stations distributed throughout the lower Yarlung Zangpo River basin, representing a subset of the regional hydrometeorological monitoring network. Station locations span elevations from 700 m to 4000 m, providing representation across the major elevation zones, though with acknowledged spatial limitations due to accessibility constraints in the most remote high-elevation areas.
Data preprocessing followed standard meteorological quality assurance protocols, including temporal continuity assessments, inter-station consistency checks, and climatological range validations. Missing data periods, primarily occurring during winter months at high-elevation stations, were excluded from comparative analyses to prevent biased performance statistics. The final validation dataset encompasses 1587 station-months of precipitation observations, with data completeness exceeding 85% across all stations.
To further illustrate the seasonal precipitation regime over the study region, Figure 2 presents the multi-year monthly climatology derived from 18 stations during 2014–2022. Precipitation exhibits a distinct monsoonal pattern, with rainfall increasing rapidly from March and peaking in June (approximately 320 mm). The period from June to September contributes around 70% of the annual total, indicating a concentrated wet season dominated by the Indian summer monsoon. From October onward, precipitation decreases sharply, and the dry season persists from December to February with monthly totals generally below 100 mm. This pronounced seasonal cycle highlights the strong intra-annual variability in precipitation, which is essential for interpreting the subsequent spatial and temporal analyses.
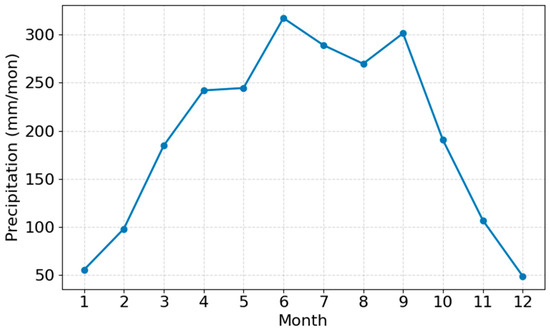
Figure 2.
Monthly climatology of precipitation based on observations from 18 meteorological stations (2014–2022).
2.4. Evaluation Methodology
2.4.1. Point-to-Grid Matching Strategy
Satellite product evaluation employed a point-extraction approach, wherein precipitation values from gridded satellite products were extracted at exact station coordinates using nearest-neighbor sampling [73]. This methodology avoids potential errors introduced by spatial interpolation while maintaining the native resolution characteristics of each satellite product [27].
2.4.2. Multi-Scale Temporal Analysis
Performance assessment was conducted across multiple temporal aggregation scales—monthly and annual—to capture both seasonal precipitation patterns and long-term climatological accuracy. Monthly analyses reveal satellite product performance during different monsoon phases and seasonal transition periods, while annual aggregations assess long-term bias characteristics and interannual variability representation.
2.4.3. Statistical Performance Metrics
Four complementary statistical metrics quantify satellite product accuracy relative to ground observations as follows: Pearson Correlation Coefficient (R), Root mean square error (RMSE), Mean absolute error (MAE), and Relative bias (RBIAS). The equations and optimal values of the four metrics are summarized in Table 2.
Table 2.
List of the statistical metrics used in the evaluation of precipitation products.
N represents the length of the precipitation time series. and denote the reanalysis precipitation data and ground station precipitation data, respectively. and correspond to the square root of the sum of squares of the difference between the first two and their mean values, respectively.
R measures linear association strength between satellite and observed precipitation, with values approaching ±1 indicating stronger relationships. This metric assesses temporal pattern fidelity regardless of absolute magnitude differences. RMSE quantifies overall prediction accuracy with enhanced sensitivity to large errors. MAE provides a robust error magnitude assessment less sensitive to outliers. RBIAS measures systematic over- or underestimation tendencies.
2.4.4. Topographical Analysis Framework
Seven terrain variables characterize the geographical context of precipitation patterns: elevation, slope gradient, slope aspect (0–360°), terrain roughness (elevation standard deviation within a 5 km radius), topographical openness [74] (unobstructed sky view angle), and geographical coordinates. The calculation of terrain factors relied on SRTM DEM data (SRTM 3 Arc-Second Global, 90 m resolution; USGS Earth Explorer, accessed on 3 November 2023) [74]. Utilizing ArcGIS 10.8 and Python 3.12, all topographic variables were derived at the exact locations of each rain gauge station and grid cell.
Multiple regression analysis quantifies terrain–precipitation relationships for each satellite product, enabling assessment of their capability to represent orographic precipitation processes compared to ground observations. Multiple linear regression analysis was employed to quantify terrain–precipitation relationships for both observed station data and satellite products. The regression model follows the general form:
where P represents precipitation (mm), β0 is the intercept, β1–β7 are regression coefficients quantifying the influence of each terrain variable, and ε represents the residual error term.
P = β0 + β1·Elevation + β2·Slope + β3·Aspect + β4·Roughness + β5·Openness + β6·Latitude + β7·Longitude + ε
The model was fitted separately for observed station precipitation and for each of the eight satellite products, enabling direct comparison of how different retrieval algorithms respond to topographical gradients. Model performance was evaluated using two metrics: (1) ordinary least squares (OLS) mean squared error (MSE) to assess overall fit quality and (2) Spearman’s rank correlation coefficient to evaluate the consistency of terrain–precipitation relationships. Given the spatial nature of the station network, potential spatial autocorrelation in residuals was assessed, though the relatively sparse station distribution (mean inter-station distance ~45 km) limits spatial dependency effects [50]. The regression coefficients (β1–β7) provide quantitative measures of each terrain variable’s influence on precipitation distribution, with the coefficient sign and magnitude indicating direction and strength of relationships. Comparison of coefficients between observed data and satellite products reveals whether algorithms accurately capture observed terrain–precipitation coupling mechanisms. This analysis framework enables two complementary assessments: (1) absolute performance—whether satellite products reproduce the observed spatial precipitation patterns associated with terrain gradients (evaluated via MSE and Spearman correlation), and (2) mechanistic fidelity—whether satellite algorithms capture the correct sign and relative magnitude of terrain influences (evaluated via coefficient comparison). Products demonstrating both low MSE and coefficient patterns consistent with observations indicate superior capability for representing orographic precipitation processes in complex mountainous environments.
To quantitatively assess how well satellite products reproduce observed terrain–precipitation coupling mechanisms, we employed a comparative analysis framework:
Overall relationship comparison (OLS coefficient matching): The multiple linear regression model (Equation 2) was fitted separately for observed gauge precipitation and for each satellite product, yielding two sets of regression coefficients (β1–β7). The similarity between satellite and observed coefficient sets was quantified using mean squared error:
where i represents each of the seven geographical factors. Lower MSE_OLS indicates the satellite product’s terrain–precipitation relationships more closely match observed patterns. Spearman’s rank correlation between the two coefficient sets was also calculated to assess consistency in the relative importance ranking of different terrain factors.
MSE_OLS = (1/7) Σ(β_satellite,i − β_gauge,i)2
Temporal variation comparison (monthly correlation matching): To evaluate whether satellite products capture monthly variations in terrain–precipitation relationships, we calculated Spearman correlations between precipitation and each geographical factor separately for each month (May–October) for both gauge and satellite data. For each product, the monthly mean MSE was calculated as follows:
where ρ represents the Spearman correlation coefficient. Lower MSE_monthly indicates the satellite product better captures the temporal evolution of terrain–precipitation relationships throughout the season. The mean Spearman correlation between satellite and gauge monthly correlation patterns across all factors was also calculated.
MSE_monthly = (1/6) Σ_months [(1/7) Σ_factors (ρ_satellite,month,factor − ρ_gauge,month,factor)2]
2.4.5. Spatial Heterogeneity Assessment
Beyond point-based validation, spatial precipitation patterns are analyzed through variogram analysis and spatial autocorrelation metrics to evaluate satellite products’ ability to represent precipitation spatial structure. This analysis is particularly relevant for hydrological applications requiring spatially distributed precipitation inputs.
The comprehensive evaluation framework addresses satellite precipitation products’ performance across multiple dimensions—temporal accuracy, spatial representation, and terrain sensitivity—providing insights essential for informed product selection in data-scarce mountainous regions.
3. Results
3.1. Comprehensive Accuracy Assessment of Precipitation Data
The precipitation in the downstream Yarlung Zangpo River shows significant seasonal variation, with flood season (May-October) contributing 62.09% of annual precipitation and reaching up to 73.80% in some years. This concentrated pattern necessitates evaluating satellite products’ capability to capture heavy precipitation events and terrain-influenced gradients.
This concentrated precipitation pattern leads to two key assessment needs: evaluating satellite products’ ability to capture heavy precipitation events during flood season and verifying products’ capability to characterize precipitation gradients influenced by terrain. Additionally, annual precipitation variations are primarily driven by flood season anomalies, making data accuracy during this period crucial for hydrological modeling reliability. Figure 3 provides scatter plots comparing observations from 18 ground stations with various precipitation datasets at annual, monthly, and flood season scales from 2014 to 2022, with the dashed line representing the 1:1 line.
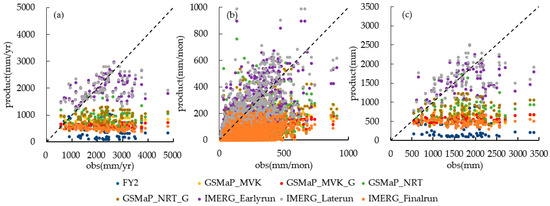
Figure 3.
Scatter plots of precipitation at annual scale (a), monthly-scale (b), and flood season (c).
At the annual scale (Figure 3a), most satellite products significantly underestimate annual precipitation. FY-2 shows the poorest performance with substantial deviations from observations. GSMaP series products exhibit obvious underestimation. IMERG_EarlyRun and IMERG_LateRun perform best with distributions closer to the 1:1 line, though showing slight overestimation. IMERG_FinalRun demonstrates relatively low estimates.
At the monthly-scale (Figure 3b), scatter distributions become more discrete, indicating greater estimation challenges. FY-2 and IMERG_FinalRun severely underestimate monthly precipitation, with zero estimates in some months. GSMaP_NRT and GSMaP_NRT_G perform well for moderate precipitation but show significant errors during heavy precipitation months. IMERG_EarlyRun and IMERG_LateRun maintain stable performance with relatively concentrated scatter around the 1:1 line.
Under the flood season scale (May–October, Figure 3c), performance patterns are similar to the annual scale but with increased dispersion in high precipitation areas. FY-2 fails to capture peak flood season precipitation. GSMaP series and IMERG_FinalRun continue underestimating precipitation. IMERG_EarlyRun and IMERG_LateRun perform well for moderate precipitation but underestimate extreme events.
Satellite products show significant differences in magnitude and spatial patterns (Figure 4). FY2 exhibits the lowest basin average (461.20 mm/yr) with uniform spatial patterns. GSMaP products (730–743 mm/yr) show similar patterns with low estimates, especially in the northeastern basin. IMERG_EarlyRun and IMERG_LateRun show dramatically higher averages (1830 and 1821 mm/yr, respectively) with opposite spatial patterns featuring higher southwestern precipitation. IMERG_FinalRun (518.98 mm/yr) resembles GSMaP patterns, indicating major final processing adjustments.
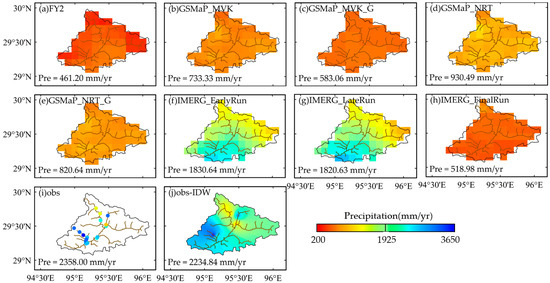
Figure 4.
Comparison of the spatial distribution of the multi-year average annual precipitation of satellite precipitation products: (a) FY2, (b) GSMaP_MVK, (c) GSMaP_MVK_G, (d) GSMaP_NRT, (e) GSMaP_NRT_G, (f) IMERG_EarlyRun, (g) IMERG_LateRun, (h) IMERG_FinalRun, (i) station observations, and (j) station-based IDW interpolation.
Ground observations (Figure 4i) average 2358 mm/yr, substantially higher than all satellite products. IDW interpolation (Figure 4j) reveals complex precipitation patterns that satellite products fail to capture, highlighting representativeness issues of ground stations and the challenge of accurately estimating precipitation in complex mountainous terrain.
3.2. Annual-Scale Validation Analysis
Eight satellite precipitation products were evaluated using four statistical indicators (R, RMSE, MAE, and RBIAS) against ground station observations from 2014 to 2022 (Figure 5).
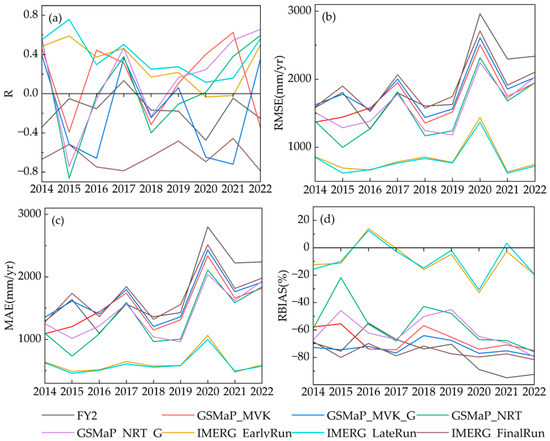
Figure 5.
Variation curve of the annual precipitation error index with year: (a) R, (b) RMSE, (c) MAE, (d) RBIAS.
Correlation coefficients (Figure 5a) showed significant fluctuations across all products. IMERG_EarlyRun and IMERG_LateRun consistently outperformed others with positive correlations (0.2–0.8), peaking in 2015 (R > 0.7). FY2 and IMERG_FinalRun exhibited the poorest performance, with FY2 showing persistent negative correlations (R < −0.6). GSMaP products fluctuated between positive and negative values, with notable degradation during 2018.
RMSE analysis (Figure 5b) revealed two distinct groups: high-error products (FY2, GSMaP products, and IMERG_FinalRun) exceeding 1500 mm/year, and lower-error products (IMERG_EarlyRun and IMERG_LateRun) below 1000 mm/year. FY2 consistently showed the highest RMSE, peaking at 3000 mm/year in 2020. MAE patterns (Figure 5c) closely mirrored RMSE, indicating systematic biases rather than isolated outliers.
RBIAS results (Figure 5d) revealed predominant underestimation. IMERG_EarlyRun and IMERG_LateRun showed moderate biases (−20% to 20%), while other products exhibited severe underestimation below −40%, worsening to −80% in recent years. FY2 reached nearly −100% by 2022.
Notably, IMERG_FinalRun exhibited unexpectedly poor performance compared to IMERG_EarlyRun and IMERG_LateRun throughout the study period, which differs from typical patterns reported in published validation studies, where FinalRun products generally achieve superior accuracy due to comprehensive gauge adjustment and post-processing. This counterintuitive finding in our study region may be related to the sparse gauge network density and exceptional topographic complexity of the lower Yarlung Zangpo basin, as will be discussed in Section 4.1. We emphasize that this observation is specific to our study context and should not be interpreted as a general assessment of IMERG_FinalRun performance, which has demonstrated high accuracy in numerous other regions and applications.
The substantial year-to-year performance fluctuations evident in Figure 5 reflect systematic relationships between satellite algorithm behavior and inter-annual precipitation variability. Product performance demonstrated strong sensitivity to annual precipitation characteristics, with notable synchronized degradation and recovery patterns occurring across the 2014–2022 period. The year 2018 exhibited particularly severe coordinated deterioration across multiple products: correlation coefficients declined substantially compared to 2017, with GSMaP_MVK dropping from R = 0.31 to R = −0.31, GSMaP_MVK_G from R = 0.36 to R = −0.24, and FY2 maintaining poor negative correlation (R = −0.17). IMERG_EarlyRun and IMERG_LateRun, while showing reduced performance (R = 0.17 and 0.25, respectively, down from 0.46 and 0.50 in 2017), remained the only products maintaining positive correlations. This synchronized degradation across independent retrieval algorithms suggests 2018 featured anomalous precipitation regimes that systematically challenged satellite retrieval capabilities. Conversely, the year 2021 demonstrated remarkable recovery for certain products, with GSMaP_MVK achieving its highest correlation across the entire study period (R = 0.63), while IMERG products showed modest performance (R = −0.02 and 0.16), indicating product-specific sensitivities to different meteorological conditions.
Beyond inter-annual fluctuations, the data reveal concerning systematic degradation trends for several products. FY2 exhibited persistent poor performance throughout 2014–2022, with correlations predominantly negative (8 out of 9 years with R < 0) and RBIAS systematically worsening from −69% (2014) to −92% to −94% (2021–2022). IMERG_FinalRun, despite being the post-processed research-quality product, demonstrated consistently poor performance with negative correlations every year (R ranging from −0.48 to −0.79) and severe underestimation intensifying from −69% (2014) to −82% (2022), raising fundamental questions about gauge-adjustment algorithm effectiveness in sparse station environments. GSMaP products showed high inter-annual volatility, with correlations fluctuating between strongly positive (GSMaP_MVK R = 0.63 in 2021) and strongly negative (R = −0.39 in 2015), indicating substantial algorithm sensitivity to meteorological regime variations. In stark contrast, IMERG_EarlyRun and IMERG_LateRun maintained relative temporal consistency, achieving positive correlations in 7–8 out of 9 years with values predominantly ranging from 0.17 to 0.59, RMSE fluctuating between 621 and 1438 mm/yr and 621–1368 mm/yr, respectively, and bias remaining within ±20% for most years. This temporal stability—maintaining acceptable performance across diverse meteorological conditions—represents a critical operational advantage over products showing either persistent failure (FY2, IMERG_FinalRun) or high inter-annual volatility (GSMaP family), as multi-year average statistics commonly reported in the literature mask the year-to-year reliability variations essential for operational decision-making.
Correlation coefficients (Figure 6) showed distinct spatial patterns. FY2 (Figure 6a) displayed consistently poor performance with negative average correlation (R = −0.08) and widespread inverse relationships. GSMaP products (Figure 6b–e) demonstrated progressive improvement from MVK (R = 0.18) to NRT_G (R = 0.24), with gauge-adjusted versions consistently outperforming non-adjusted counterparts. IMERG products showed the strongest spatial performance, with IMERG_EarlyRun (Figure 6f) achieving the highest correlation (R = 0.41), followed by IMERG_LateRun (R = 0.37) and IMERG_FinalRun (R = 0.34).
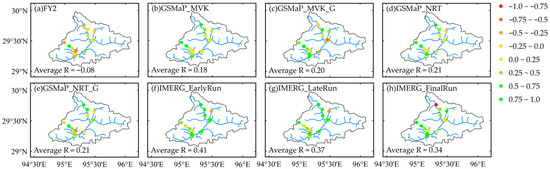
Figure 6.
Spatial distribution of annual mean values of R for four precipitation products on an annual scale.
RMSE spatial patterns (Figure 7) confirmed correlation results. FY2 (Figure 7a) exhibited the highest average RMSE (1978 mm/yr) with severe errors in central and western areas. GSMaP products (Figure 7b–e) showed moderate RMSE values (1472–1633 mm/yr), while IMERG_EarlyRun and IMERG_LateRun demonstrated substantially lower errors (739 and 711 mm/yr, respectively). Higher errors were consistently concentrated in central and western basin regions across all products.
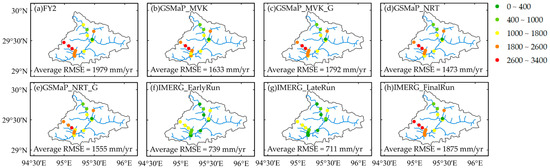
Figure 7.
Spatial distribution of annual mean values of RMSE for four precipitation products on an annual scale.
RBIAS spatial analysis (Figure 8) and summary statistics (Table 3) revealed systematic patterns. FY2 (Figure 8a) showed severe underestimation (average RBIAS = −76.9%) with 100% of stations underestimated. GSMaP products (Figure 8b–e) demonstrated consistent underestimation (−57% to −70%) at all stations. IMERG_EarlyRun (Figure 8f) achieved the most balanced performance (RBIAS = −2.7%) with 53% underestimation and 47% overestimation. IMERG_LateRun (Figure 8g) showed a slight positive bias (RBIAS = 1.4%) with 53% overestimation. IMERG_FinalRun (Figure 8h) unexpectedly returned to severe underestimation (RBIAS = −73.8%) at 100% of stations.
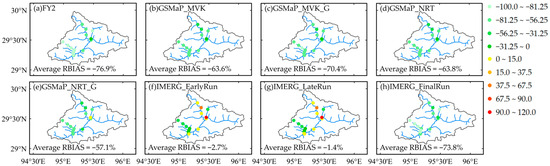
Figure 8.
RBIAS spatial distribution of the annual mean value of four precipitation products.
Table 3.
Annual-scale performance statistics at 18 meteorological stations: FY2, GSMaP_MVK, GSMaP_MVK_G, and GSMaP_NRT (2014–2022).
Detailed station-level statistics (Table 3 and Table 4 provide a comprehensive quantitative assessment of product performance across the 15 meteorological stations. FY2 exhibited predominantly negative correlations at 10 of 15 stations (67%), with particularly poor performance at high-elevation sites where R values reached −0.71 (ST12, 1200 m) and −0.44 (ST1, 2060 m). RMSE for FY2 ranged from 231 to 3272 mm/yr with a basin-wide mean of 1979 mm/yr, and severe underestimation occurred across all elevations (RBIAS: −11.1% to −90.7%, mean: −76.8%). GSMaP products (Table 3 and Table 4) showed improved performance with basin-wide mean correlations ranging from 0.18 to 0.21 and reduced RMSE (1633–1792 mm/yr), though systematic underestimation persisted (mean RBIAS: −63.6% to −70.4%). Notable station-specific variations emerged: high-elevation stations ST9 (3248 m) and ST10 (2600 m) showed relatively strong correlations for GSMaP products (R = 0.50–0.91), while mid-elevation stations exhibited more variable performance.
Table 4.
Annual-scale performance statistics at 18 meteorological stations: GSMaP_NRT_G and IMERG products (2014–2022).
IMERG_EarlyRun and IMERG_LateRun (Table 4) demonstrated superior and spatially consistent performance, achieving positive correlations at 13 and 11 of 15 stations (87% and 73%) with basin-wide mean R = 0.41 and 0.37, respectively. RMSE remained substantially lower (mean: 739 and 711 mm/yr) compared to other products, with particularly strong performance at low-to-mid elevation stations (ST1, ST2, ST4, ST6, ST8) where R exceeded 0.6 and RMSE remained below 621 mm/yr. Bias characteristics showed remarkable spatial balance: IMERG_EarlyRun exhibited near-zero bias at 6 stations (RBIAS within ±10%), moderate overestimation at two stations (RBIAS: 38.7–38.8% at ST2), and underestimation at seven stations, yielding a basin-wide mean RBIAS = −2.7%. IMERG_LateRun displayed similar patterns with basin-wide mean RBIAS = −1.4%. Station ST15 (2736 m, highest elevation) showed exceptional overestimation for both IMERG Early/Late products (RBIAS: 119.4% and 111.1%, respectively), suggesting algorithm difficulties with extremely high-altitude precipitation regimes.
IMERG_FinalRun (Table 4) exhibited unexpectedly poor performance, contradicting its research-quality designation. Despite positive correlations at 11 of 15 stations (73%), the product showed severe systematic underestimation (mean RBIAS = −73.8%), comparable to FY2 and substantially worse than IMERG Early/Late products. RMSE averaged 1875 mm/yr—2.5 times higher than IMERG_EarlyRun and 2.6 times higher than IMERG_LateRun—with particularly elevated errors at high-elevation stations (ST7: 3218 mm/yr, ST9: 2660 mm/yr, ST10: 2881 mm/yr). Only a single station (ST15) showed moderate underestimation (RBIAS = −34.6%), while all others exhibited severe underestimation (−52.2% to −87.5%), indicating systematic gauge-adjustment algorithm failures across diverse topographic settings. This station-level analysis confirms that IMERG_FinalRun’s poor performance is not isolated to specific locations but represents basin-wide systematic deterioration relative to the near real-time IMERG products.
3.3. Monthly-Scale Validation Analysis
Monthly-scale temporal evolution of error metrics from 2014 to 2022 revealed distinct seasonal patterns and product-specific characteristics (Figure 9).
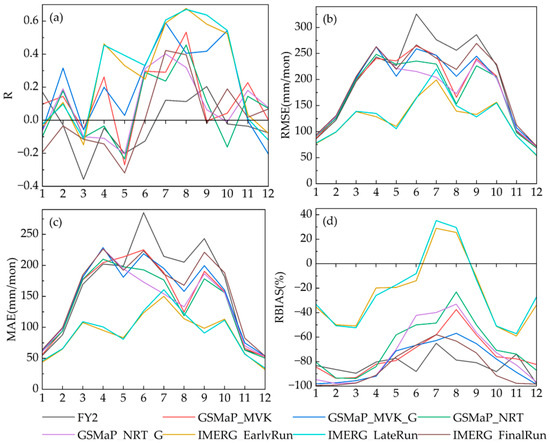
Figure 9.
Variation curve of monthly precipitation error index with month: (a) R, (b) RMSE, (c) MAE, (d) RBIAS.
Correlation coefficients (Figure 9a) showed moderate values (0.2–0.6) with peak performance during the summer monsoon (June–September). IMERG_EarlyRun and IMERG_LateRun exhibited superior correlation, maintaining R > 0.4 during the wet season and reaching ~0.6 in August. FY2 and IMERG_FinalRun showed consistently lower correlations, rarely exceeding 0.2. Most products displayed significant declines during non-flood season with negative correlations during transition periods.
RMSE values (Figure 9b) revealed substantial errors during the monsoon season, with peak errors exceeding 250–300 mm/month in June. FY2 consistently showed the highest RMSE throughout the year. IMERG_EarlyRun and IMERG_LateRun demonstrated lower monsoon-period errors. During the dry season (November-February), all products converged to 50–100 mm/month, reflecting reduced errors during low precipitation periods. MAE patterns (Figure 9c) mirrored RMSE distribution with pronounced seasonal cycles.
RBIAS (Figure 9d) revealed two distinct clusters: IMERG_EarlyRun and IMERG_LateRun showed positive bias (20–40%) during July–September but negative bias (−20% to −60%) otherwise, while all other products exhibited persistent negative bias (−40% to −100%) throughout the year. FY2 demonstrated the most severe underestimation, particularly during the dry season.
Monthly-scale spatial patterns exhibited pronounced seasonal variability, revealing distinct algorithm performance characteristics across different precipitation regimes. To characterize this temporal evolution, we examined correlation coefficient distributions during three representative months: January (dry season), April (pre-monsoon transition), and July (monsoon peak), complemented by a comprehensive 12 month × 18 station heatmap analysis.
Dry-season spatial patterns (January, Figure 10) demonstrated weak correlations across all products. FY2 showed predominantly negative correlations at the majority of stations, with R values ranging from −0.63 to 0.95. GSMaP products exhibited mixed performance: GSMaP_MVK maintained positive correlations (R = 0.16–0.99) at most stations, while GSMaP_NRT showed considerable spatial heterogeneity with negative correlations appearing at multiple sites. IMERG_EarlyRun and IMERG_LateRun demonstrated relatively superior and spatially consistent performance, though absolute correlation values remained moderate. IMERG_FinalRun exhibited unexpectedly poor performance with predominantly negative correlations across the basin.
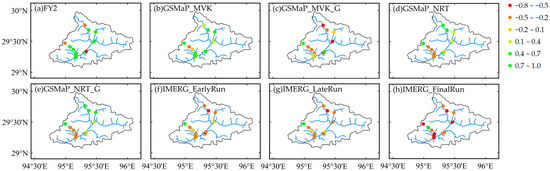
Figure 10.
Spatial distribution of R for January.
The pre-monsoon transition period (April, Figure 11) revealed increased spatial variability compared to January. GSMaP products showed improved spatial consistency, particularly GSMaP_MVK_G, which achieved moderate-to-strong correlations at central valley stations. IMERG_EarlyRun and IMERG_LateRun maintained positive correlations at the majority of stations, with values generally exceeding 0.5 at low-elevation sites. IMERG_FinalRun continued to show widespread negative correlations, indicating persistent algorithm issues during transition periods.
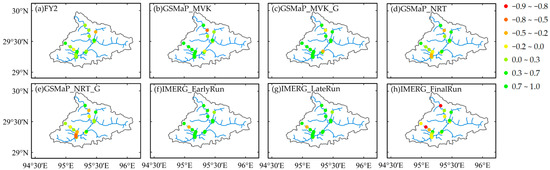
Figure 11.
Spatial distribution of R for April.
Monsoon-peak spatial patterns (July, Figure 12) demonstrated substantial performance enhancement for most products. GSMaP_MVK_G achieved strong correlations (R > 0.6) at multiple stations, reflecting effective gauge-adjustment benefits during high-precipitation periods. IMERG_EarlyRun and IMERG_LateRun exhibited exceptional performance with R > 0.7 at the majority of stations and peak correlations exceeding 0.8 in central valley regions. Clear elevation-dependent gradients emerged, with lower-elevation stations (<1500 m) consistently showing stronger correlations than high-elevation sites (>2000 m). IMERG_FinalRun showed spatial heterogeneity with mixed positive and negative correlations.
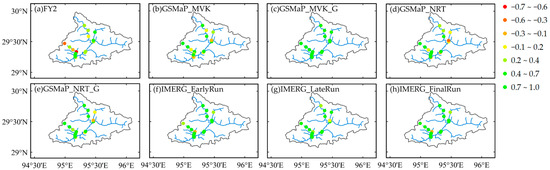
Figure 12.
Spatial distribution of R for July.
Comprehensive temporal analysis through heatmap visualization (Figure 13) revealed systematic seasonal cycles. IMERG_EarlyRun and IMERG_LateRun exhibited the most temporally coherent patterns with clear monsoon-phase dominance (June-September showing predominantly red colors indicating R > 0.6) and gradual seasonal transitions. Dry-season degradation (November–February) was evident across all products, with widespread blue colors indicating low or negative correlations. Transition-period instability (March–May, October–November) manifested as scattered patterns of alternating positive and negative correlations. FY2 and IMERG_FinalRun displayed erratic temporal behavior with no clear seasonal structure, while GSMaP products showed intermediate temporal consistency with pronounced monsoon-dry season contrasts.
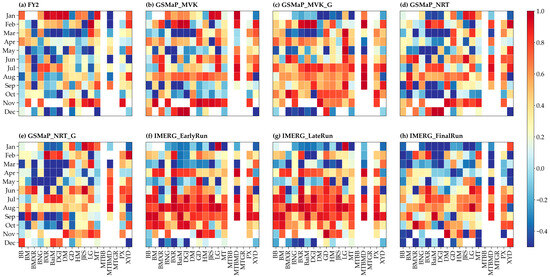
Figure 13.
Monthly performance heatmap of R (12 months × 18 stations).
The heatmap analysis further revealed station-specific seasonal sensitivities: stations at elevations below 1500 m maintained relatively stable performance year-round for IMERG products, while high-elevation stations showed extreme seasonal variability with correlations fluctuating between negative values in winter and moderate-to-strong positive values during the monsoon season.
RMSE spatial distributions revealed substantial seasonal variation in absolute error magnitudes, with terrain complexity exerting a pronounced influence on error patterns. Representative monthly analysis (Figure 14, Figure 15 and Figure 16) and comprehensive heatmap visualization (Figure 17) demonstrated systematic seasonal cycles and product-specific error characteristics.
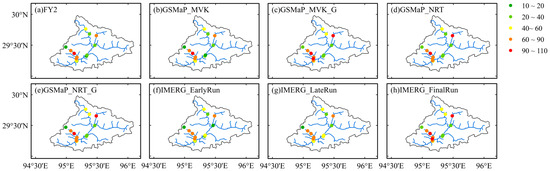
Figure 14.
Spatial distribution of RMSE (mm/mon) for January.
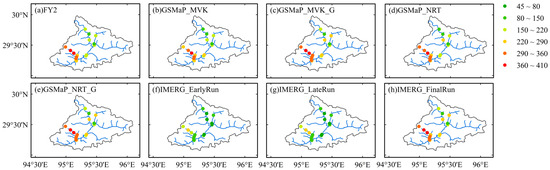
Figure 15.
Spatial distribution of RMSE (mm/mon) for April.
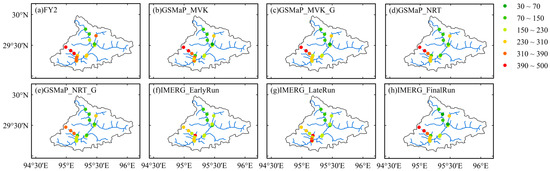
Figure 16.
Spatial distribution of RMSE (mm/mon) for July.
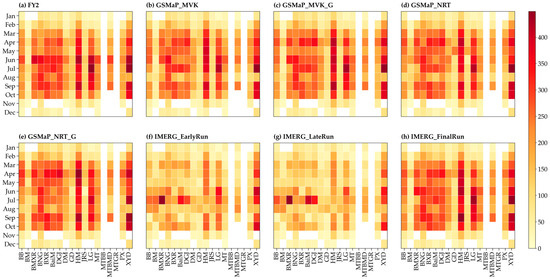
Figure 17.
Monthly performance heatmap of RMSE (mm/mon) (12 months × 18 stations).
Dry-season RMSE patterns (January, Figure 14) showed relatively low and spatially homogeneous errors, reflecting reduced precipitation amounts. All products exhibited RMSE values predominantly below 110 mm/month across the basin. FY2 demonstrated moderate errors ranging from 18 to 101 mm/month, with slightly elevated values at high-elevation stations above 2000 m (approximately 80–100 mm/month). GSMaP products showed comparable error magnitudes: GSMaP_MVK_G ranged from 15 to 108 mm/month, with gauge-adjusted versions generally exhibiting higher RMSE than non-adjusted counterparts during low-precipitation periods. IMERG_EarlyRun and IMERG_LateRun maintained the lowest basin-wide errors (10–81 mm/month), demonstrating superior performance across all elevation zones. IMERG_FinalRun showed errors (13–81 mm/month) comparable to IMERG Early/Late Run products during the dry season.
The pre-monsoon transition period (April, Figure 15) exhibited substantially amplified RMSE values as precipitation intensified. Errors increased 2–4 fold compared to January, with pronounced spatial heterogeneity emerging. High-elevation stations (>2000 m) demonstrated peak errors ranging from 280 to 410 mm/month for most products, indicating severe underestimation challenges in orographic precipitation regions. FY2 exhibited the highest basin-wide RMSE (93–390 mm/month) with particularly large errors at complex-terrain sites. GSMaP products showed moderate improvement: GSMaP_MVK_G ranged from 100 to 406 mm/month, with gauge-adjusted versions demonstrating mixed performance—some stations showed error reduction while others exhibited error amplification compared to non-adjusted versions. IMERG_EarlyRun and IMERG_LateRun achieved substantially lower errors (45–279 mm/month), with error magnitudes approximately 40–60% of those for FY2 and GSMaP products. IMERG_FinalRun exhibited unexpectedly high RMSE (57–404 mm/month), approaching or exceeding GSMaP product errors.
Monsoon-peak RMSE patterns (July, Figure 16) demonstrated maximum error magnitudes coinciding with peak precipitation intensity. Basin-wide errors ranged from 30 to 500 mm/month, with clear elevation-dependent gradients. High-elevation stations (>2500 m) exhibited extreme errors exceeding 400–495 mm/month, while stations above 2000 m showed 300–410 mm/month, reflecting persistent algorithm challenges in detecting intense orographic convection. FY2 showed the highest errors (110–495 mm/month) with particularly poor performance at precipitation-rich stations. GSMaP products demonstrated varied performance: GSMaP_MVK_G exhibited 39–422 mm/month, with gauge-adjusted versions showing improved accuracy at some valley stations but persistent high errors at mountain sites. IMERG_EarlyRun and IMERG_LateRun achieved the best performance (111–394 mm/month), maintaining 20–40% lower RMSE compared to other products. Notable exceptions appeared at isolated stations where IMERG products showed elevated errors approaching 400–449 mm/month, suggesting localized retrieval difficulties. IMERG_FinalRun displayed high RMSE (59–449 mm/month) with spatial inconsistency.
Comprehensive temporal analysis through RMSE heatmap (Figure 17) revealed the following:
- (1)
- Monsoon-period error amplification (June–August): All products exhibited maximum RMSE during peak precipitation months, with the heatmap showing predominant dark red colors indicating errors exceeding 250–350 mm/month at multiple stations. High-elevation stations (>2000 m) consistently showed the highest errors year-round, with particularly extreme values (>400 mm/month) during July and August. IMERG_EarlyRun and IMERG_LateRun heatmaps displayed lighter colors compared to other products, indicating systematically lower errors across all months and stations.
- (2)
- Dry-season error convergence (November–February): The heatmap showed predominant light yellow colors across all products, indicating basin-wide RMSE below 100 mm/month. Inter-product differences substantially diminished during this period, with IMERG products maintaining only a marginal advantage over GSMaP and FY2.
- (3)
- Transition-period error escalation (March–May, September–October): RMSE values showed a rapid increase from dry-season baseline to monsoon-peak levels. April–May exhibited particularly steep error gradients (indicated by abrupt color transitions in the heatmap), with high-elevation stations showing 3–5-fold error increases compared to March.
- (4)
- Station-specific error persistence: High-elevation stations (>2500 m) exhibited consistently elevated RMSE year-round across all products, with errors rarely falling below 150 mm/month even during the dry season. Conversely, low-elevation valley stations (<1200 m) showed strong seasonal modulation with dry-season RMSE < 50 mm/month, but monsoon-period errors reached 200–300 mm/month.
- (5)
- Product-specific error characteristics: IMERG_EarlyRun and IMERG_LateRun heatmaps demonstrated the most spatially and temporally consistent patterns with gradual seasonal transitions. GSMaP products showed intermediate error levels with pronounced station-to-station variability. FY2 and IMERG_FinalRun displayed the highest overall RMSE with substantial spatial heterogeneity throughout the year.
RBIAS spatial distributions revealed systematic underestimation tendencies across most products, with distinct seasonal transitions between dry-season negative bias and monsoon-period mixed bias patterns. Representative monthly analysis (Figure 18, Figure 19 and Figure 20) and comprehensive heatmap visualization (Figure 21) demonstrated product-specific bias characteristics and their temporal evolution.
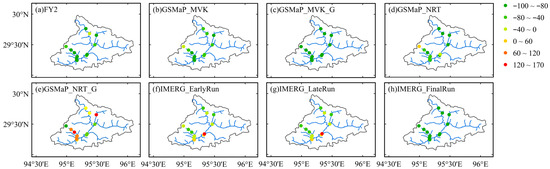
Figure 18.
Spatial distribution of RBIAS (%) for January.
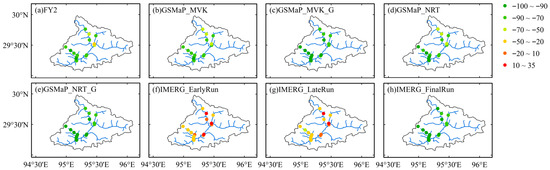
Figure 19.
Spatial distribution of RBIAS (%) for April.
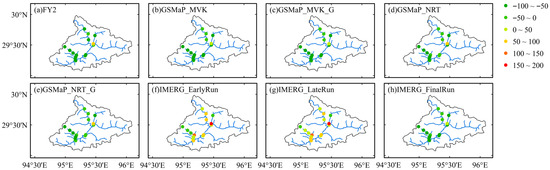
Figure 20.
Spatial distribution of RBIAS (%) for July.
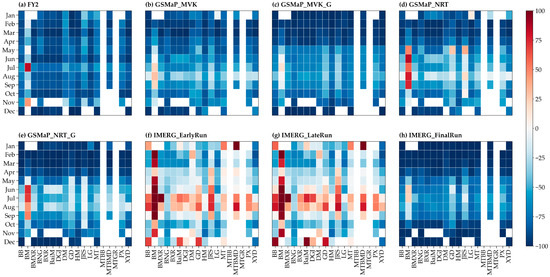
Figure 21.
Monthly performance heatmap of RBIAS (%) (12 months × 18 stations).
Dry-season RBIAS patterns (January, Figure 18) exhibited severe and spatially pervasive negative bias across most products. FY2 showed extreme underestimation ranging from −37% to −97%, with particularly severe bias at high-elevation stations (>2000 m) where RBIAS reached −88% to −97%. GSMaP products demonstrated highly variable performance: GSMaP_MVK exhibited mixed bias patterns (−4% to −90%), while gauge-adjusted GSMaP_MVK_G showed predominantly severe underestimation (−93% to −99%) at most stations. GSMaP_NRT displayed the most erratic spatial patterns, with RBIAS ranging from +9% to −91%, reflecting algorithm instability during low-precipitation conditions. IMERG_EarlyRun and IMERG_LateRun demonstrated superior bias characteristics with RBIAS ranging from −78% to +159%, showing mixed overestimation and underestimation patterns across different stations. Notably, several low-elevation stations (<1200 m) exhibited positive bias (+6% to +59%) for IMERG products, indicating an algorithm tendency to overestimate light precipitation in valley regions. IMERG_FinalRun showed severe underestimation (−98% to −100%) across the entire basin, comparable to the worst-performing products.
The pre-monsoon transition period (April, Figure 19) maintained a predominantly negative bias, though with reduced magnitude compared to January. FY2 exhibited persistent severe underestimation (−48% to −90%) across all stations. GSMaP products showed improved but still substantial negative bias: GSMaP_MVK ranged from −54% to −90%, while GSMaP_MVK_G demonstrated −79% to −96%, with gauge adjustment providing limited bias correction benefits during transition periods. GSMaP_NRT products exhibited −65% to −93% underestimation. IMERG_EarlyRun and IMERG_LateRun achieved substantially reduced bias magnitude (−47% to +30%), with several mid-elevation stations (1000–2000 m) showing near-zero or slight positive bias (−5% to +23%), indicating improved precipitation capture during pre-monsoon convective development. High-elevation stations (>2500 m) maintained substantial negative bias (−44% to −46%) even for IMERG products. IMERG_FinalRun continued severe underestimation (−73% to −96%) across the basin.
Monsoon-peak RBIAS patterns (July, Figure 20) revealed a dramatic bias transition, with IMERG products shifting from negative to predominantly positive bias while other products maintained underestimation. FY2 showed reduced but persistent negative bias (−46% to −83%), with slightly improved performance compared to the dry season. GSMaP products exhibited moderate underestimation: GSMaP_MVK ranged from −22% to −75%, GSMaP_MVK_G showed −13% to −78%, and gauge-adjusted versions demonstrated marginal improvement over non-adjusted counterparts. IMERG_EarlyRun and IMERG_LateRun displayed striking bias reversal, with predominantly positive RBIAS (+26% to +197%) at the majority of stations, indicating systematic overestimation of intense convective precipitation. This overestimation was particularly pronounced at low-elevation valley stations (<1500 m), where RBIAS exceeded +50% to +177%. High-elevation stations (>2000 m) showed mixed patterns, with some maintaining a slight negative bias (−1% to −27%) while others exhibited moderate overestimation. One isolated station showed extreme IMERG overestimation (+106% to +197%), suggesting localized algorithm artifacts. IMERG_FinalRun exhibited spatially heterogeneous patterns with RBIAS ranging from −77% to +22%, showing no consistent bias structure.
Comprehensive temporal analysis through RBIAS heatmap (Figure 21) revealed:
- (1)
- Product-specific bias evolution patterns: FY2, GSMaP_MVK, GSMaP_MVK_G, GSMaP_NRT, GSMaP_NRT_G, and IMERG_FinalRun heatmaps displayed predominantly blue colors (negative bias) throughout all 12 months, indicating persistent year-round underestimation. RBIAS values for these products rarely exceeded −40% and commonly reached −80% to −100%. In contrast, IMERG_EarlyRun and IMERG_LateRun heatmaps showed a clear seasonal dichotomy: blue colors (negative bias) during the dry season (November–May) transitioning to orange–red colors (positive bias) during the monsoon season (June–September), with peak overestimation (+30% to +80%) occurring in July and August.
- (2)
- Monsoon-period bias reversal (June–September): IMERG_EarlyRun and IMERG_LateRun exhibited systematic bias shift from approximately −20% to −60% in May to +20% to +70% in July and August, representing a dramatic 50–130 percentage point bias swing. This reversal appeared consistently across 10–12 stations, suggesting algorithm-level precipitation retrieval characteristics rather than random errors. Other products showed only modest bias reduction during monsoon (from approximately −90% in winter to −50% to −70% in summer) but maintained negative bias throughout.
- (3)
- Dry-season severe underestimation (November-February): The heatmap showed near-universal dark blue colors across all products and stations, with RBIAS predominantly below −60%. FY2, GSMaP_MVK_G and IMERG_FinalRun exhibited particularly extreme underestimation, with RBIAS commonly reaching −90% to −100%. IMERG_EarlyRun and IMERG_LateRun showed relatively better performance (RBIAS −30% to −70%) but still substantially underestimated dry-season precipitation.
- (4)
- Station-elevation bias dependency: High-elevation stations (>2500 m) showed consistent severe negative bias year-round across all products, with RBIAS rarely exceeding −40% even during the monsoon season. Low-elevation valley stations (<1200 m) exhibited strong seasonal modulation for IMERG products, transitioning from moderate negative bias in winter (−30% to −50%) to substantial positive bias in summer (+40% to +80%).
- (5)
- Gauge-adjustment paradox: GSMaP gauge-adjusted products (GSMaP_MVK_G, GSMaP_NRT_G) unexpectedly showed more severe negative bias compared to non-adjusted versions (GSMaP_MVK, GSMaP_NRT) throughout most months, particularly evident during the dry season, where gauge-adjusted RBIAS commonly reached −95% to −100% versus −60% to −80% for non-adjusted versions. This suggests potential gauge-adjustment algorithm failures in sparse station network environments.
Beyond monthly spatial patterns, station-level performance statistics provide an essential quantitative perspective to complement the correlation, RMSE, and RBIAS heatmap assessments. Detailed results for all 18 stations are summarized in Table 5 and Table 6, presenting comprehensive product-level performance across contrasting elevation zones and precipitation regimes.
Table 5.
Monthly-scale performance statistics at 18 meteorological stations: FY2, GSMaP_MVK, GSMaP_MVK_G, and GSMaP_NRT (2014–2022).
Table 6.
Monthly-scale performance statistics at 18 meteorological stations: GSMaP_NRT_G and IMERG products (2014–2022).
Table 5 presents station-level performance for FY2 and GSMaP products. FY2 exhibited generally poor skill, with weak correlations across most stations (basin-wide mean R = 0.36) and substantial performance deterioration at high-elevation sites such as ST12 (700 m, R = −0.02) and ST18 (952 m, R = 0.18). Error magnitudes were consistently high (mean RMSE = 217 mm/month; range 62–335 mm/month), accompanied by severe systematic underestimation (RBIAS −13.5% to −90.7%; mean −77.5% across stations).
The GSMaP family showed moderate improvement relative to FY2. GSMaP_MVK and GSMaP_MVK_G increased correlation skill to basin-wide means of 0.52 and 0.66, respectively, with reduced RMSE (191–194 mm/month), though substantial negative bias persisted (mean RBIAS −65.6% to −70.9%). Elevation-dependent patterns were evident: stations such as ST9 (750 m) and ST11 (2600 m) demonstrated relatively strong performance (R = 0.70 and 0.57), while mid-elevation stations (ST7; 1080 m) showed weaker correlations (R = 0.38). GSMaP_NRT demonstrated intermediate results (R = 0.50, RMSE ≈ 186 mm/month, RBIA Smean −55.2%), reducing errors compared to FY2 but maintaining persistent underestimation across nearly all locations. These results indicate that while GSMaP products consistently outperform FY2, all products in Table 5 struggle to accurately represent precipitation magnitude in complex terrain, especially at high elevations.
Table 6 further highlights significant performance contrast between GSMaP_NRT_G and IMERG products. GSMaP_NRT_G exhibited improved skill (R = 0.53) and moderate RMSE (183 mm/month) but still showed substantial negative bias (mean RBIAS −58.3%), particularly at high-elevation stations. In contrast, IMERG_EarlyRun and IMERG_LateRun demonstrated the strongest overall performance, achieving basin-wide mean correlations of 0.71 and 0.70, respectively, with the lowest RMSE among all products (129–134 mm/month) and nearly balanced bias characteristics (mean RBIAS −5.4% and −4.5%). Exceptional performance was observed at low-to-mid elevation sites such as ST5 (1130 m) and ST6 (1530 m), where R ≥ 0.85 and RMSE remained below 95 mm/month. However, localized extreme behavior was evident—for example, ST15 (1280 m) exhibited strong algorithmic overestimation (RBIAS 109.9–101.9%) for both IMERG Early and Late variants.
In stark contrast, IMERG_FinalRun performed unexpectedly poorly, with substantial negative bias (mean RBIAS −73.4%, comparable to FY2), elevated RMSE (mean 201 mm/month), and limited correlation improvement (mean R = 0.60). This degradation strongly contradicts its intended research-quality designation and suggests that gauge-adjustment mechanisms may introduce systematic failures under sparse observational networks and extreme relief conditions.
Overall, these station-level results reinforce the conclusions drawn from spatial and seasonal analyses: IMERG EarlyRun and LateRun represent the most accurate and physically consistent products, GSMaP products demonstrate intermediate performance with substantial negative bias, while FY2 and IMERG_FinalRun consistently perform poorly across both spatial and temporal dimensions. The persistent deterioration at high-elevation stations underscores the need for improved representation of orographic precipitation and enhanced calibration strategies for mountainous regions.
These station-level evaluation results complement the spatial and seasonal analyses presented earlier, providing quantitative evidence of product performance differences under contrasting precipitation regimes and elevation gradients. The findings derived from Table 5 and Table 6 reinforce the systematic characteristics observed from correlation, RMSE, and RBIAS heatmaps, demonstrating that product behavior is strongly conditioned by both seasonality and topographic complexity. Building on these results, an integrated multi-metric perspective is essential to fully interpret algorithm performance characteristics across temporal scales and precipitation intensities.
Integrating correlation, RMSE, and RBIAS analyses reveals complex product performance characteristics with distinct seasonal regimes and systematic error structures.
IMERG_EarlyRun and IMERG_LateRun demonstrated optimal overall performance but with characteristic seasonal bias patterns. During the monsoon season (June–September), these products achieved strong correlations (R = 0.6–0.8 at the majority of stations) and the lowest RMSE (110–280 mm/month at most sites), but systematic positive bias (+20% to +70%), indicating accurate temporal variability capture with consistent overestimation of precipitation magnitude. During the dry season (November–February), performance degraded substantially with weak correlations (R = 0.1–0.4), low absolute errors (RMSE < 80 mm/month due to low precipitation amounts), and moderate negative bias (−30% to −60%). This seasonal bias reversal—from monsoon overestimation to dry-season underestimation—represents a critical finding, suggesting that algorithm-level precipitation retrieval characteristics systematically vary with precipitation intensity and meteorological regime.
GSMaP products exhibited intermediate performance with strong precipitation-regime dependency. GSMaP_MVK_G and GSMaP_NRT_G showed the best GSMaP performance during the monsoon season with moderate correlations (R = 0.5–0.7) and RMSE (180–280 mm/month), but maintained persistent negative bias (−30% to −70%) throughout the year. Unexpectedly, gauge-adjusted versions showed more severe underestimation than non-adjusted counterparts, particularly during the dry season, where RBIAS reached −90% to −100% compared to −60% to −80% for non-adjusted products. This gauge-adjustment paradox suggests that current post-processing algorithms may be poorly calibrated for complex mountainous terrain with sparse station networks.
FY2 and IMERG_FinalRun exhibited consistently poor performance across all metrics and seasons. Both products showed weak correlations year-round (R typically < 0.4), the highest RMSE values (commonly 50–100 mm/month higher than best-performing products), and severe persistent negative bias (−60% to −100% throughout the year). IMERG_FinalRun’s unexpectedly poor performance relative to IMERG Early/Late Run products represents a critical concern, as the Final Run product undergoes additional gauge-adjustment processing intended to improve accuracy. The systematic performance degradation suggests fundamental issues with the gauge-adjustment algorithm when applied to high-altitude, data-sparse regions.
Elevation-dependent error patterns emerged consistently across all metrics. High-elevation stations (>2500 m) exhibited weak correlations (R < 0.5 even during monsoon), the highest RMSE (300–500 mm/month during monsoon), and persistent severe negative bias (−60% to −90%) year-round across all products. Low-elevation valley stations (<1500 m) showed strong seasonal performance variation: monsoon-period correlations reached R > 0.7 with moderate RMSE (150–300 mm/month) but exhibited substantial IMERG overestimation (+40% to +80%), while dry-season performance showed weak correlations (R < 0.3) with low RMSE (<60 mm/month) and moderate underestimation (−30% to −60%).
These findings demonstrate that monthly-scale validation reveals critical performance characteristics masked by annual-mean statistics. Product rankings are highly season-dependent, bias structures exhibit systematic seasonal reversal patterns for IMERG products, and gauge-adjustment procedures show unexpected performance degradation in complex terrain environments.
3.4. Supplementary Analysis: Basin-Scale Terrain–Precipitation Relationships
As a supplementary investigation, we examined whether satellite products capture observed spatial precipitation patterns associated with basin-scale topographic gradients. We acknowledge that the 0.1° spatial resolution of satellite products (approximately 10 km × 10 km grid cells) cannot resolve fine-scale (<1 km) terrain variability that significantly influences local precipitation distribution in complex mountainous environments. The terrain variables analyzed here (elevation, slope, and aspect) can vary substantially within individual grid cells, and the statistical relationships identified should be interpreted with appropriate caution given this scale mismatch.
Nevertheless, this analysis provides a supplementary perspective on whether satellite retrieval algorithms capture regional precipitation gradients at the spatial scales these products operationally provide—a relevant consideration for basin-scale hydrological applications where satellite data serve as distributed precipitation forcing. The 18 meteorological stations span distinct topographic zones across the basin (elevation range: 700–3248 m), and systematic deviations from observed spatial patterns may indicate algorithm-level representation issues, even if fine-scale processes remain unresolved.
3.4.1. Observed Terrain–Precipitation Relationships from Station Data
The downstream Yarlung Zangpo River exhibits complex terrain that substantially controls local precipitation distribution, posing challenges for satellite-based retrieval algorithms. This analysis characterizes fundamental terrain–precipitation relationships using ground observations from 2014 to 2022, focusing on flood season (May-October) data to minimize winter complications.
Seven terrain variables were examined: elevation, slope gradient, slope aspect, topographic relief, terrain openness, latitude, and longitude. Multiple linear regression (ordinary least squares) was conducted using the seven terrain variables as predictors. Preliminary assessment confirmed minimal spatial autocorrelation in residuals (Moran’s I = 0.12, p = 0.24), validating the OLS approach [50]. Terrain variables collectively account for 15.4% of flood season precipitation variance (R2 = 0.154), indicating topographic controls are important, but additional meteorological factors significantly influence regional distribution. The regression results (Table 7) demonstrate the following.
Table 7.
Results of partial correlation analysis between precipitation and geographical factors.
Steep terrain (slope) exhibits a strong negative association with precipitation (coefficient = −0.167, p < 0.001), likely reflecting enhanced wind exposure, rapid drainage, and topographic shadowing effects. Slope orientation (aspect) demonstrates significant influence (coefficient = −0.149, p = 0.002), with south-facing and west-facing slopes receiving higher precipitation, aligning with moisture transport directions and solar heating effects.
Both latitudinal and longitudinal positions show negative correlations (latitude: −0.079, p = 0.128; longitude: −0.158, p = 0.018), indicating a southwest-to-northeast decreasing precipitation gradient. Despite orographic precipitation theory expectations, elevation shows only a weak positive correlation (coefficient = 0.086, p = 0.131), suggesting other topographic factors mask typical elevation–precipitation relationships. Terrain undulation and terrain openness exhibit minimal influence (p > 0.4).
The correlation matrix between monthly flood season precipitation and geographical factors at the site (Figure 22) indicates that there are significant differences in the correlation between precipitation and geographical factors in different months.
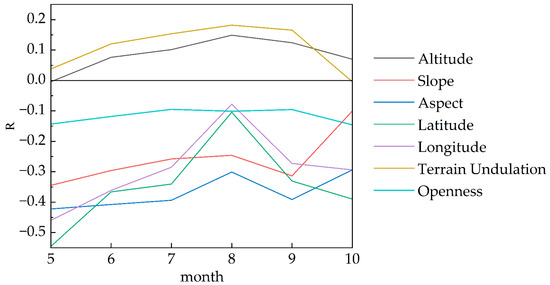
Figure 22.
Correlation coefficient between monthly station precipitation and geographical factors.
Monthly correlation analysis reveals significant temporal variations throughout the flood season. Elevation influence intensifies from July to October, coinciding with enhanced monsoon circulation. Slope gradient effects remain consistently negative, with peak influence during June and September. Aspect controls are most pronounced during May, July, and September, corresponding to variable wind patterns. Regional gradients show the strongest influence in May, diminishing during August as monsoon patterns stabilize.
Spatial regression analysis reveals substantial spatial variation in terrain influence patterns (MSE = 0.806). In topographically complex areas, elevation and relief become primary controlling factors, while in flat regions, slope characteristics and terrain openness exert greater influence (Figure 23).
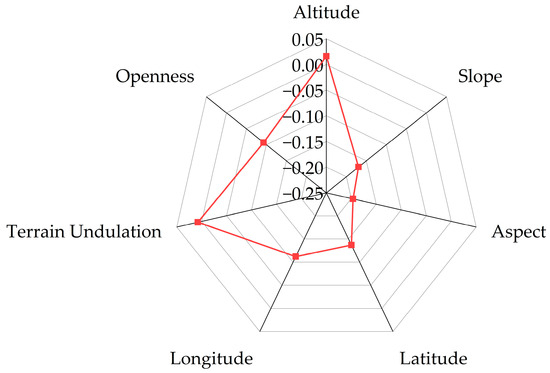
Figure 23.
Geographical factor regression coefficient.
3.4.2. Satellite Product Capability for Representing Terrain–Precipitation Relationships
Similar multiple linear regression analysis was performed for eight precipitation products to assess consistency with observed station data. Table 8 presents ordinary least squares regression coefficients relating products to geographical factors.
Table 8.
OLS regression coefficients of precipitation products and geographical factors.
Significant differences emerged in product responses to geographical factors. For slope effects, station observations show significant negative correlation (−0.1676). FY2 and GSMaP_NRT maintain similar negative correlations (−0.4665 and −0.0048), but GSMaP_MVK, GSMaP_MVK_G, GSMaP_NRT_G, and all IMERG products show a positive correlations contrary to observations, with IMERG_LateRun showing the largest deviation (0.5621).
Regarding aspect influences, station observations indicate a negative correlation (−0.1486). Only GSMaP_MVK, GSMaP_NRT, and GSMaP_NRT_G captured this pattern, with GSMaP_NRT_G showing the closest magnitude (−0.0140). Other products showed spurious positive relationships. For elevation, station observations show a weak positive correlation (0.0856). FY2, GSMaP_MVK, and GSMaP_NRT captured this trend, while GSMaP_MVK_G and all IMERG products exhibited contrary negative correlations.
We evaluated satellite precipitation products’ ability to reproduce observed terrain–precipitation coupling mechanisms using two complementary approaches (Table 9): (1) overall relationship fidelity through comparison of OLS regression coefficients and (2) temporal consistency through comparison of monthly correlation patterns.
Table 9.
Evaluation of the correlation coefficient characterization ability of monthly declining aquatic products to precipitation and geographical factors at stations.
Overall terrain–precipitation relationship fidelity (OLS coefficient comparison): GSMaP_MVK_G exhibits the lowest OLS MSE (54.26), indicating its terrain–precipitation regression coefficients most closely match those of gauge observations. IMERG_FinalRun shows moderate performance (MSE = 141.89), while GSMaP_NRT and GSMaP_MVK demonstrate higher discrepancies (MSE = 723.70 and 475.58, respectively). IMERG_LateRun and IMERG_EarlyRun show substantially larger deviations (MSE = 9380.06 and 8834.72), suggesting these products assign fundamentally different weights to terrain factors compared to observed patterns. For OLS Spearman correlations (evaluating consistency in relative importance of terrain factors), GSMaP_NRT performs best (0.32), indicating reasonable agreement in the ranking of terrain factor importance, while IMERG_EarlyRun shows a negative correlation (−0.39), suggesting it inverts the relative importance of some terrain factors compared to observations.
Temporal consistency of terrain–precipitation relationships (monthly correlation comparison): IMERG_LateRun demonstrates the best performance with the lowest monthly mean MSE (0.05), indicating its month-to-month variations in terrain–precipitation correlations closely track observed patterns. GSMaP_MVK_G and IMERG_EarlyRun show comparable performance (both MSE = 0.06), followed by GSMaP_MVK (0.08) and FY2 (0.10). IMERG_FinalRun exhibits the highest monthly mean MSE (0.14), suggesting less consistent temporal evolution of terrain relationships. For monthly mean Spearman correlations, GSMaP_MVK_G shows the strongest positive correlation (0.26), followed by IMERG_LateRun (0.20), indicating good agreement in the temporal patterns of terrain–precipitation coupling. FY2, GSMaP_MVK, GSMaP_NRT, and IMERG_FinalRun all show negative correlations (−0.21 to −0.53), suggesting their monthly variations in terrain–precipitation relationships are inconsistent with or opposite to observed patterns.
Synthesis and mechanistic interpretation: The results reveal complex, product-specific performance characteristics. GSMaP_MVK_G demonstrates the most balanced performance, achieving both the lowest OLS MSE (54.26) and a positive monthly mean Spearman correlation (0.26), indicating it accurately captures both the overall strength and temporal evolution of terrain–precipitation relationships.
IMERG_LateRun presents an interesting contrast: excellent temporal consistency (monthly mean MSE = 0.05, Spearman = 0.20) but very poor overall coefficient matching (OLS MSE = 9380.06). This indicates that while IMERG_LateRun successfully captures how terrain–precipitation relationships vary month-to-month, the absolute magnitude and signs of its terrain coefficients differ substantially from observations. In practical terms, this product may correctly identify that certain months show stronger/weaker terrain influences but systematically over- or underestimates the actual strength of these influences.
IMERG_EarlyRun shows the opposite pattern: poor overall coefficient matching (OLS MSE = 8834.72, OLS Spearman = −0.39) but reasonable monthly consistency (monthly mean MSE = 0.06). However, its slightly positive monthly mean Spearman (0.07) combined with negative OLS Spearman suggests inconsistent mechanistic representation.
IMERG_FinalRun demonstrates poor performance in both dimensions (OLS MSE = 141.89, monthly mean MSE = 0.14, both Spearman correlations negative), indicating it neither captures the correct overall terrain–precipitation coupling strengths nor their temporal variations, despite being the most heavily post-processed IMERG product.
These findings have important implications for product selection: GSMaP_MVK_G is recommended for studies requiring an accurate mechanistic representation of orographic precipitation processes. IMERG_LateRun may be suitable for applications where capturing temporal variations in terrain influence patterns is more critical than absolute coefficient accuracy (e.g., seasonal forecasting and climate variability studies), though users should be aware of systematic biases in coefficient magnitudes. Products showing negative correlations in either metric should be used cautiously for terrain-dependent applications.
These results should be interpreted with appropriate caution given the inherent spatial resolution limitations. The 0.1° satellite products aggregate considerable sub-grid terrain variability, and the statistical relationships identified here reflect only basin-scale spatial patterns rather than the fine-scale topographic controls that strongly influence precipitation distribution in complex mountainous terrain. The analysis provides a supplementary assessment of whether products reproduce observed regional precipitation gradients but cannot evaluate their ability to capture fine-scale orographic effects.
Within these limitations, the results suggest that GSMaP_MVK_G shows relatively better correspondence with observed basin-scale spatial patterns (OLS MSE = 54.26, monthly Spearman = 0.26), while IMERG_LateRun demonstrates superior capability in capturing seasonal dynamics (monthly MSE = 0.05, monthly Spearman = 0.20). However, systematic deviations from observed relationships—such as opposite-sign correlations for terrain variables—should be interpreted cautiously. Product selection for operational applications should prioritize the temporal validation results presented in Section 3.1, Section 3.2 and Section 3.3, which provide more robust performance assessments, while considering this supplementary spatial analysis as additional context rather than definitive evidence of spatial representation capability.
4. Discussion
4.1. Regional Context for IMERG Product Performance Patterns
One notable finding requiring careful interpretation is the relatively poor performance of IMERG_FinalRun compared to IMERG_EarlyRun and IMERG_LateRun in our study region. This pattern differs from typical results reported in published validation studies, where IMERG_FinalRun consistently demonstrates superior accuracy due to its comprehensive gauge adjustment and post-processing procedures [75,76]. We believe this discrepancy reflects specific characteristics of our study region rather than fundamental limitations of the IMERG_FinalRun product itself.
Several region-specific factors may contribute to this pattern.
The validation stations used in this study are operated by local agencies and enterprises, and the lower Yarlung Zangpo Grand Canyon region has sparse coverage of internationally networked meteorological stations (approximately 1 station per 50,000 km2 for nationally reporting stations). Gauge adjustment procedures, which rely on reference station networks, may face particular challenges in such data-sparse environments compared to better-gauged regions where IMERG_FinalRun typically excels [77,78]. This suggests that the effectiveness of gauge adjustment may be spatially heterogeneous and dependent on local station network density, though we acknowledge that gauge adjustment generally provides substantial accuracy improvements in adequately gauged areas [79].
Additionally, the study region’s exceptional topographic complexity—with elevation gradients exceeding 2000 m, steep precipitation gradients (annual totals varying from <1500 to >3000 mm/yr), and convergence of multiple monsoon circulation systems—creates precipitation patterns that may present particular challenges for spatial interpolation and adjustment procedures when reference stations are sparse. The sharp orographic precipitation discontinuities and complex seasonal regime transitions characteristic of this region differ substantially from the more spatially continuous precipitation patterns in many other validation study regions. We emphasize that these observations pertain specifically to our study context and should not be extrapolated to question the general utility of IMERG_FinalRun, which has demonstrated high performance across diverse global applications.
For our specific study region, the results suggest that IMERG_EarlyRun and IMERG_LateRun may be more suitable for operational applications, though users in other regions should consult local validation studies appropriate to their specific contexts. This finding underscores the importance of region-specific product evaluation rather than assuming global performance rankings apply universally [80]. We acknowledge that further investigation would be valuable to fully characterize the mechanisms underlying these regional performance patterns and to identify the specific conditions under which different IMERG products may be most appropriate. Our results contribute to the growing recognition that satellite precipitation product performance can vary substantially across different geographic and climatic contexts and that local validation remains essential for informed product selection in operational applications.
4.2. Inter-Annual Performance Variability and Temporal Stability
The downstream Yarlung Zangpo basin presents exceptional challenges for satellite precipitation retrieval due to the convergence of multiple complicating factors: extreme topographic complexity (elevation gradients exceeding 2000 m), concentrated seasonal precipitation (62% of annual total during the May–October monsoon), and the intersection of multiple atmospheric circulation systems [81,82,83,84,85]. Unlike systematic biases in reanalysis products [50], satellite products exhibit algorithm-specific error patterns reflecting fundamental remote sensing limitations rather than data assimilation procedures.
The substantial underestimation across most satellite products contrasts with mixed reanalysis performance patterns, highlighting the following distinct physical constraints: electromagnetic signal attenuation, beam filling effects, and calibration challenges under varying atmospheric conditions [86,87,88].
The paradoxical performance of IMERG processing levels—where Early/Late Run products outperform Final Run—reveals critical gauge adjustment limitations. This differs from reanalysis products, where comprehensive data assimilation generally improved accuracy [89]. The deterioration suggests sparse gauge networks may introduce rather than correct systematic errors when algorithms are optimized for different climatic regimes [90].
The pronounced inter-annual performance variability observed in this study has critical implications for operational applications and algorithm evaluation methodologies. The 2018 synchronized degradation and 2021 GSMaP recovery demonstrate that product performance rankings are not static but highly dependent on prevailing meteorological conditions. Notably, IMERG_FinalRun’s persistent failure across all nine years (consistently negative correlations, severe underestimation worsening to −82%) contradicts expectations that post-processing with gauge adjustment should improve upon near real-time products. This systematic underperformance relative to IMERG_EarlyRun and IMERG_LateRun suggests fundamental issues with current gauge-adjustment protocols in data-sparse mountainous regions, where sparse station networks may introduce more errors than corrections. The relative temporal stability of IMERG_EarlyRun and IMERG_LateRun—maintaining predominantly positive correlations and moderate bias across varying climatic conditions—represents their key operational value for water resource management requiring reliable year-to-year performance.
This temporal variability pattern contrasts markedly with reanalysis product performance documented in our previous study [50], where products demonstrated stable year-to-year characteristics with minimal inter-annual fluctuations. The difference reflects fundamental distinctions between observation-based satellite retrievals—sensitive to atmospheric conditions, sensor calibration, and algorithm updates—and physically based model approaches that maintain consistent process representations regardless of annual meteorological variations. For operational applications, this suggests satellite products require ongoing monitoring and validation, while reanalysis products offer more predictable long-term reliability.
4.3. Systematic Comparison with Reanalysis Products
Direct comparison with our previous reanalysis product evaluation in this identical study region reveals complementary strengths and limitations of satellite versus model-based precipitation estimation.
Bias characteristics: Satellite products exhibited more severe systematic underestimation (6 of 8 products: RBIAS −60% to −77%) compared to mixed reanalysis bias patterns. However, the best-performing satellite products (IMERG_EarlyRun/LateRun: RBIAS = −3%/+1%) achieved superior bias balance despite lower correlations (R = 0.41/0.37) than the best reanalysis product (ERA5-Land: R = 0.52, RBIAS = +8%).
Seasonal performance: Satellite products demonstrated dramatic seasonal variations—correlations exceeding 0.6–0.8 during the monsoon season but declining below 0.3 in dry season—reflecting algorithm superiority for convective precipitation detection but weakness with light stratiform processes. Reanalysis products maintained more uniform moderate performance across seasons, indicating all-weather capability through physically based process simulation.
Terrain representation: Most satellite products failed to capture observed negative slope–precipitation relationships (Table 6), with some showing opposite-sign correlations. This indicates fundamental limitations in empirical algorithm terrain corrections. Reanalysis products better represented terrain–precipitation coupling through explicit orographic lifting simulation, despite coarser native resolution (0.25–1° versus 0.1° for satellites). Physically consistent coarse estimates may thus be more valuable than high-resolution estimates with incorrect spatial patterns in complex mountainous terrain.
Gauge adjustment effects: A striking contrast emerged: reanalysis data assimilation generally improved performance [50] by integrating observations within physically constrained frameworks, while satellite gauge correction degraded performance in our data-sparse region (IMERG_FinalRun substantially underperformed Early/Late products). Statistical satellite corrections may introduce artifacts when reference stations inadequately represent complex precipitation fields, whereas model physical constraints prevent unphysical adjustments.
Operational implications: These contrasting characteristics define complementary roles: satellite products excel in real-time availability (1–14 day latency) and observation independence suitable for rapid event detection and flood monitoring; reanalysis products excel in temporal stability and physical consistency suitable for seasonal water resource assessment and climatological analysis. Optimal operational strategies should integrate both types, employing satellite products for real-time monitoring and reanalysis for planning applications, with combined ensemble approaches for comprehensive analysis.
4.4. Challenges and Opportunities in High-Altitude Precipitation Monitoring
The downstream Yarlung Zangpo basin’s extreme topographic complexity and concentrated seasonal precipitation (62% during May–October [81,82,83,84,85]) reveal fundamental satellite retrieval limitations. Substantial underestimation across most products reflects systematic challenges: warm rain process detection difficulties, electromagnetic signal attenuation in complex terrain, beam-filling effects, and algorithm calibration gaps for high-altitude environments [86,87,88]. The 2018 synchronized degradation across independent products indicates certain meteorological conditions systematically challenge current retrieval capabilities beyond individual algorithm differences. Integration opportunities between satellite and reanalysis approaches emerge from comparative evaluation: satellite observations could enhance reanalysis data assimilation, particularly during extreme events when conventional observations are sparse, while reanalysis model physics could provide physically consistent constraints for satellite algorithm development. Adaptive ensemble strategies adjusting product weights seasonally—leveraging satellite monsoon-season strengths and reanalysis temporal stability—represent promising directions. Regional bias correction accounting for topographic controls identified in Section 3.4 constitutes another priority for both product types.
While this study focused on operational satellite precipitation products with near real-time to short-latency availability (FY2, GSMaP, and IMERG), other precipitation datasets, such as the Climate Hazards Group InfraRed Precipitation with Station data (CHIRPS), provide valuable alternatives for retrospective hydrological analysis and climatological studies. CHIRPS emphasizes gauge-blending approaches optimized for drought monitoring and long-term trend analysis, representing a complementary operational niche to the real-time satellite products evaluated here. Future comparative studies incorporating CHIRPS alongside operational satellite products would provide valuable insights into the relative performance of gauge-blending versus pure satellite retrieval approaches in data-sparse mountainous environments, particularly for applications where longer data latency is acceptable.
4.5. Study Limitations and Future Research Priorities
Several limitations warrant acknowledgment. The 18-station validation network, while substantial for this remote region, remains sparse (~1 station per 2800 km2) for fully characterizing precipitation spatial variability in complex terrain. The 2014–2022 evaluation period captures recent algorithm developments and substantial climatic variability but represents a limited timeframe for assessing long-term algorithm stability across broader climate cycles. Future research priorities include the following: (1) evaluating emerging satellite missions and algorithm versions to track performance evolution; (2) developing basin-specific ensemble precipitation products integrating satellite and reanalysis strengths optimized for hydrological applications; (3) investigating process-level error sources through event-based analysis linking specific storm types and synoptic patterns to algorithm performance; and (4) extending comparative evaluation to other Tibetan Plateau watersheds to assess result generalizability across varying topographic and climatic gradients. Such investigations will advance understanding of satellite precipitation capabilities and limitations in high-altitude complex terrain, supporting development of next-generation monitoring systems for data-sparse mountainous regions globally.
5. Conclusions
This investigation advances our understanding of satellite precipitation monitoring capabilities in high-altitude complex watersheds through a comprehensive assessment of eight remote sensing products in the downstream Yarlung Zangbo Basin. Building upon our previous evaluation of reanalysis precipitation datasets in this region, this study reveals distinct technological limitations and opportunities unique to satellite-based precipitation retrieval systems.
Temporal validation across 2014–2022 demonstrates systematic underestimation across most satellite products, with ground observations recording 2358 mm/yr compared to substantially lower satellite estimates. Six of eight products exhibited severe negative bias (RBIAS < −60%), differing markedly from the mixed bias patterns documented for reanalysis products. IMERG_EarlyRun and IMERG_LateRun emerged as optimal performers, achieving annual correlation coefficients of 0.41 and 0.37 with near-zero bias (RBIAS: −3.0% and 1.4%), substantially outperforming FY2 (R = −0.13, RBIAS = −76.9%), GSMaP variants (R = 0.13–0.21, RBIAS = −60% to −71%), and, unexpectedly, IMERG_FinalRun (R = 0.37, RBIAS = −73.8%).
Monthly-scale analysis examining representative months (January, April, and July) revealed pronounced seasonal performance variations. IMERG_EarlyRun and IMERG_LateRun achieved correlations of 0.71 and 0.70 during the flood season, with peak performance exceeding R = 0.8 at central valley stations during monsoon months, but degraded substantially during the dry season (R < 0.3). Comprehensive heatmap visualization across 12 months and 18 stations demonstrated that high-elevation sites (>2500 m) showed weaker correlations year-round (R < 0.5) compared to low-elevation valley stations (<1500 m, monsoon R > 0.7 for IMERG products). This pronounced seasonal variability contrasts with the more temporally consistent performance of reanalysis products.
The unexpected severe underperformance of IMERG_FinalRun—maintaining negative correlations and severe underestimation across all temporal scales and spatial locations—contradicts conventional expectations. Station-level analysis revealed 100% of stations showed underestimation for IMERG_FinalRun compared to balanced patterns for IMERG_EarlyRun/LateRun (53% underestimation, 47% overestimation). This systematic failure throughout 2014–2022 indicates critical limitations of statistical gauge-adjustment procedures in data-sparse mountainous environments where reference stations inadequately represent complex precipitation fields, contrasting with generally beneficial effects of physically constrained data assimilation in reanalysis products.
Inter-annual analysis revealed substantial temporal variability with coordinated performance degradation during 2018 (correlations declining 0.3–0.5 across GSMaP products) and variable recovery patterns (2021: GSMaP_MVK achieving peak R = 0.63). Year-to-year fluctuations in satellite product rankings—contrasting with stable reanalysis temporal characteristics—demonstrate that algorithm accuracy strongly depends on prevailing meteorological conditions. This temporal instability underscores the necessity for continuous regional validation rather than assuming global performance assessments apply universally.
Spatial analysis with unified observational reference and satellite product maps facilitated direct visual assessment, revealing that underestimation pervades all topographic zones. Station-level statistics across the 18-site network demonstrated clear elevation-dependent gradients: low-to-mid-elevation stations (700–1500 m) achieved substantially higher correlations (R > 0.6–0.8 for IMERG during monsoon) with moderate errors, while high-elevation stations (>2500 m) showed persistently weaker performance (R < 0.5, higher errors), indicating systematic challenges in high-altitude precipitation detection.
Beyond temporal performance assessment, the geographic pattern analysis (Section 3.4.2, Table 7) reveals substantial variations in how satellite products capture terrain–precipitation relationships. GSMaP_MVK_G demonstrated superior overall terrain–precipitation coefficient matching (OLS MSE: 54.26) and positive temporal consistency (monthly mean Spearman: 0.26), indicating it best preserves the observed coupling between precipitation and topographical factors. IMERG_LateRun excelled in capturing temporal variations in terrain–precipitation relationships (monthly mean MSE: 0.05, monthly mean Spearman: 0.20) but showed poor overall coefficient agreement (OLS MSE: 9380.06), suggesting it captures month-to-month changes in terrain influence patterns despite systematic biases in absolute coupling strengths. As detailed in Section 3.4.2, these complementary performance characteristics suggest that optimal precipitation monitoring strategies in topographically complex regions should integrate multiple satellite products based on specific application requirements rather than relying on single-source approaches.
Comparative assessment with our previous reanalysis product evaluation establishes that satellite and reanalysis approaches offer complementary capabilities. Satellite products excel in real-time availability (1–14 day latency), independence from numerical model biases, and the ability to achieve near-zero precipitation bias when performing well. Reanalysis products excel in temporal consistency across years and seasons, physically consistent spatial patterns, and stable performance under varying meteorological regimes. The demonstrated product-specific strengths—IMERG_EarlyRun/LateRun for temporal accuracy and minimal bias, GSMaP_MVK_G for terrain–precipitation pattern representation and reanalysis products for temporal stability—indicate that optimal operational frameworks should integrate multiple approaches strategically based on specific application requirements.
For operational applications in the downstream Yarlung Zangbo basin and similar data-sparse high-altitude watersheds, we recommend the following differentiated product selection: (1) real-time flood monitoring: IMERG_EarlyRun or IMERG_LateRun, leveraging their superior temporal accuracy (R = 0.41/0.37, minimal bias) and real-time availability despite seasonal performance fluctuations; (2) spatial pattern analysis and terrain-sensitive applications: ** GSMaP_MVK_G, leveraging its superior capability in preserving terrain–precipitation relationships, particularly valuable when accurate spatial heterogeneity representation is critical for distributed hydrological modeling; (3) seasonal water resource assessment: ** ERA5-Land reanalysis, leveraging temporal consistency and physically based terrain representation, particularly valuable for dry-season estimates where satellite products show substantial degradation; (4) long-term climatological analysis: ** Combined satellite-reanalysis ensemble approaches integrating complementary strengths while mitigating individual product limitations; and (5) products to avoid: IMERG_FinalRun and FY2 for this specific region, given systematic severe underestimation and poor correlations, though users in other regions should conduct local validation before assuming these findings generalize.
These findings contribute to the recognition that satellite precipitation product performance varies substantially across geographic and climatic contexts and that different products excel in different performance dimensions—temporal accuracy, spatial pattern fidelity, terrain relationship representation, or temporal stability. Gauge-adjustment effectiveness depends critically on reference station network adequacy, as evidenced by IMERG_FinalRun’s degradation versus GSMaP_MVK_G’s improved terrain representation. The systematic underestimation across most products indicates fundamental retrieval challenges requiring continued algorithm development. However, superior real-time availability of well-performing satellite products positions them as essential operational tools complementing retrospective accuracy advantages of reanalysis datasets.
Future monitoring frameworks for Trans-Himalayan watersheds should leverage complementary strengths through adaptive multi-product strategies: IMERG products for real-time event detection during the monsoon season when they perform optimally, GSMaP_MVK_G when spatial pattern accuracy is paramount, reanalysis products for water resource planning where temporal consistency is essential, and integrated ensemble approaches for comprehensive characterization. Ongoing validation remains critical given demonstrated inter-annual variability and continuous algorithm evolution. Extension of this comparative framework to other Tibetan Plateau watersheds would assess result generalizability and support the development of region-appropriate precipitation monitoring systems for high-altitude, data-sparse environments globally.
Author Contributions
Conceptualization, A.T., H.L., L.C., and Y.S.; data curation, M.L., T.W. and W.W.; formal analysis, A.T.; Funding acquisition, L.C.; investigation, A.T.; methodology, A.T.; project administration, H.L. and Y.S.; supervision, Y.S.; validation, M.L. and W.W.; visualization, A.T.; writing—original draft, A.T.; writing—review and editing, A.T. and L.C. All authors have read and agreed to the published version of the manuscript.
Funding
This research was funded by the National Key Research and Development Program of China (Grant Number: 2023YFC3206305).
Data Availability Statement
The original contributions presented in this study are included in the article. Further inquiries can be directed to the corresponding author.
Conflicts of Interest
The authors declare no conflicts of interest.
References
- Huntington, T.G. Evidence for intensification of the global water cycle: Review and synthesis. J. Hydrol. 2006, 319, 83–95. [Google Scholar] [CrossRef]
- Schlesinger, W.H.; Jasechko, S. Transpiration in the global water cycle. Agric. For. Meteorol. 2014, 189, 115–117. [Google Scholar] [CrossRef]
- Harding, R.; Best, M.; Blyth, E.; Hagemann, S.; Kabat, P.; Tallaksen, L.M.; Warnaars, T.; Wiberg, D.; Weedon, G.P.; Lanen, H.V.; et al. WATCH: Current Knowledge of the Terrestrial Global Water Cycle. J. Hydrometeorol. 2011, 12, 1149–1156. [Google Scholar] [CrossRef]
- Levang, S.J.; Schmitt, R.W. Centennial Changes of the Global Water Cycle in CMIP5 Models. J. Clim. 2015, 28, 6489–6502. [Google Scholar] [CrossRef]
- Oki, T.; Entekhabi, D.; Harrold, T.I. The Global Water Cycle. In The State of the Planet: Frontiers and Challenges in Geophysics; American Geophysical Union: Washington, DC, USA, 2004; pp. 225–237. [Google Scholar]
- Schneider, U.; Becker, A.; Finger, P.; Meyer-Christoffer, A.; Ziese, M.; Rudolf, B. GPCC’s new land surface precipitation climatology based on quality-controlled in situ data and its role in quantifying the global water cycle. Theor. Appl. Climatol. 2014, 115, 15–40. [Google Scholar] [CrossRef]
- Hegerl, G.C.; Black, E.; Allan, R.P.; Ingram, W.J.; Polson, D.; Trenberth, K.E.; Chadwick, R.S.; Arkin, P.A.; Sarojini, B.B.; Becker, A.; et al. Challenges in Quantifying Changes in the Global Water Cycle. Bull. Am. Meteorol. Soc. 2015, 96, 1097–1115. [Google Scholar] [CrossRef]
- Hou, A.Y.; Kakar, R.K.; Neeck, S.; Azarbarzin, A.A.; Kummerow, C.D.; Kojima, M.; Oki, R.; Nakamura, K.; Iguchi, T. The Global Precipitation Measurement Mission. Bull. Am. Meteorol. Soc. 2014, 95, 701–722. [Google Scholar] [CrossRef]
- Skofronick-Jackson, G. The Global Precipitation Measurement (GPM) Mission. In Proceedings of the IGARSS 2020–2020 IEEE International Geoscience and Remote Sensing Symposium, Waikoloa, HI, USA, 26 September–2 October 2020; pp. 3589–3592. [Google Scholar]
- Li, Z.; Wang, H.; Tao, Z.; Zeng, Q.; Xiang, J.; Liu, Z.; Yang, R. Multi-Source Precipitation Data Merging for High-Resolution Daily Rainfall in Complex Terrain. Remote. Sens. 2023, 15, 4345. [Google Scholar] [CrossRef]
- Skofronick-Jackson, G.M.; Petersen, W.A.; Berg, W.K.; Kidd, C.; Stocker, E.F.; Kirschbaum, D.B.; Kakar, R.K.; Braun, S.A.; Huffman, G.J.; Iguchi, T.; et al. The global precipitation measurement (gpm) mission for science and society. Bull. Am. Meteorol. Soc. 2017, 98, 1679–1695. [Google Scholar] [CrossRef] [PubMed]
- Li, J.J.; Lu, C.S.; Chen, J.H.; Zhou, X.; Yang, K.; Li, J.; Wu, X.Q.; Xu, X.Q.; Wu, S.Y.; Hu, R.; et al. The influence of complex terrain on cloud and precipitation on the foot and slope of the southeastern Tibetan Plateau. Clim. Dyn. 2024, 62, 3143–3163. [Google Scholar] [CrossRef]
- Zhao, Y.; Li, J. Dominant Synoptic Systems for Summer Precipitation over the Complex Terrain of Southwestern China. Mon. Weather Rev. 2024, 152, 2443–2460. [Google Scholar] [CrossRef]
- Schirmer, M.; Jamieson, B. Verification of analysed and forecasted winter precipitation in complex terrain. Cryosphere 2015, 9, 587–601. [Google Scholar] [CrossRef]
- Livneh, B.; Deems, J.S.; Schneider, D.; Barsugli, J.J.; Molotch, N.P. Filling in the gaps: Inferring spatially distributed precipitation from gauge observations over complex terrain. Water Resour. Res. 2014, 50, 8589–8610. [Google Scholar] [CrossRef]
- Chen, D.; Xu, B.; Yao, T.; Guo, Z.; Cui, P.; Chen, F.; Zhang, R.; Zhang, X.; Zhang, Y.; Fan, J.; et al. Assessment of past, present and future environmental changes on the Tibetan Plateau. Chin. Sci. Bull. 2015, 60, 3025–3035. [Google Scholar] [CrossRef]
- Immerzeel, W.W.; van Beek, L.P.H.; Bierkens, M.F.P. Climate Change Will Affect the Asian Water Towers. Science 2010, 328, 1382–1385. [Google Scholar] [CrossRef]
- Yao, T.; Thompson, L.; Yang, W.; Yu, W.; Gao, Y.; Guo, X.; Yang, X.; Duan, K.; Zhao, H.; Xu, B.; et al. Different glacier status with atmospheric circulations in Tibetan Plateau and surroundings. Nat. Clim. Change 2012, 2, 663–667. [Google Scholar] [CrossRef]
- Xu, X.; Lu, C.; Shi, X.; Gao, S. World water tower: An atmospheric perspective. Geophys. Res. Lett. 2008, 35, L20815. [Google Scholar] [CrossRef]
- Yao, T.; Thompson, L.G.; Mosbrugger, V.; Zhang, F.; Ma, Y.; Luo, T.; Xu, B.; Yang, X.; Joswiak, D.R.; Wang, W.; et al. Third Pole Environment (TPE). Environ. Dev. 2012, 3, 52–64. [Google Scholar] [CrossRef]
- Yang, K.; Wu, H.; Qin, J.; Lin, C.; Tang, W.; Chen, Y. Recent climate changes over the Tibetan Plateau and their impacts on energy and water cycle: A review. Glob. Planet. Change 2014, 112, 79–91. [Google Scholar] [CrossRef]
- Gao, Y.; Xiao, L.; Chen, D.; Chen, F.; Xu, J.; Xu, Y. Quantification of the relative role of land-surface processes and large-scale forcing in dynamic downscaling over the Tibetan Plateau. Clim. Dyn. 2017, 48, 1705–1721. [Google Scholar] [CrossRef]
- Bookhagen, B.; Burbank, D.W. Towards a complete Himalayan hydrological budget: The spatiotemporal distribution of 1 snowmelt and rainfall and their impact on river discharge. J. Geophys. Res. 2010, 115, F03019:03011–F03019:03023. [Google Scholar] [CrossRef]
- Liu, X.; Chen, B. Climatic warming in the Tibetan Plateau during recent decades. Int. J. Climatol. 2000, 20, 1729–1742. [Google Scholar] [CrossRef]
- You, Q.; Min, J.; Zhang, W.; Pepin, N.; Kang, S. Comparison of multiple datasets with gridded precipitation observations over the Tibetan Plateau. Clim. Dyn. 2015, 45, 791–806. [Google Scholar] [CrossRef]
- Tang, G.; Clark, M.P.; Papalexiou, S.M.; Ma, Z.; Hong, Y. Have satellite precipitation products improved over last two decades? A comprehensive comparison of GPM IMERG with nine satellite and reanalysis datasets. Remote Sens. Environ. 2020, 240, 111697. [Google Scholar] [CrossRef]
- Sun, Q.; Miao, C.; Duan, Q.; Ashouri, H.; Sorooshian, S.; Hsu, K.L. A Review of Global Precipitation Data Sets: Data Sources, Estimation, and Intercomparisons. Rev. Geophys. 2017, 56, 79–107. [Google Scholar] [CrossRef]
- Kidd, C.; Levizzani, V. Status of satellite precipitation retrievals. Hydrol. Earth Syst. Sci. 2011, 15, 1109–1116. [Google Scholar] [CrossRef]
- Pei, Y. Optical design for multichannel scanning radiometer onboard FY-2 goestationary meteorological satellite. Proc. SPIE 3505 Imaging Syst. Technol. Remote Sens. 1998. [Google Scholar] [CrossRef]
- Zhang, P.; Gu, S.; Chen, L.; Shang, J.; Lin, M.; Zhu, A.; Yin, H.; Wu, Q.; Shou, Y.; Sun, F.; et al. FY-3G Satellite Instruments and Precipitation Products: First Report of China’s Fengyun Rainfall Mission In-Orbit. J. Remote Sens. 2023, 3, 0097. [Google Scholar] [CrossRef]
- Zhao, R.; Wang, K.; Xu, X. Global precipitation from FY-3 polar orbit satellites. Sci. Bull. 2024, 69, 2688–2692. [Google Scholar] [CrossRef] [PubMed]
- Zhang, P.; Hu, X.; Sun, L.; Xu, N.; Chen, L.; Zhu, A.; Lin, M.; Lu, Q.; Yang, Z.; Yang, J.; et al. The On-Orbit Performance of FY-3E in an Early Morning Orbit. Bull. Am. Meteorol. Soc. 2024, 105, E144–E175. [Google Scholar] [CrossRef]
- Ushio, T.; Sasashige, K.; Kubota, T.; Shige, S.; Okamoto, K.i.; Aonashi, K.; Inoue, T.; Takahashi, N.; Iguchi, T.; Kachi, M.; et al. A Kalman Filter Approach to the Global Satellite Mapping of Precipitation (GSMaP) from Combined Passive Microwave and Infrared Radiometric Data. J. Meteorol. Soc. Jpn. Ser. II 2009, 87A, 137–151. [Google Scholar] [CrossRef]
- Kubota, T.; Shige, S.; Hashizume, H.; Aonashi, K.; Takahashi, N.; Seto, S.; Hirose, M.; Takayabu, Y.N.; Ushio, T.; Nakagawa, K.; et al. Global Precipitation Map Using Satellite-Borne Microwave Radiometers by the GSMaP Project: Production and Validation. IEEE Trans. Geosci. Remote Sens. 2007, 45, 2259–2275. [Google Scholar] [CrossRef]
- Mega, T.; Ushio, T.; Takahiro, M.; Kubota, T.; Kachi, M.; Oki, R. Gauge-Adjusted Global Satellite Mapping of Precipitation. IEEE Trans. Geosci. Remote Sens. 2019, 57, 1928–1935. [Google Scholar] [CrossRef]
- Huffman, G. Algorithm Theoretical Basis Document (ATBD) Version 4.4 for the NASA Global Precipitation Measurement (GPM) Integrated Multi-Satellite Retrievals for GPM (I-MERG); NASA: Washington, DC, USA, 2014; pp. 1–30. [Google Scholar]
- Huffman, G.J.; Bolvin, D.T.; Braithwaite, D.; Hsu, K.-L.; Joyce, R.J.; Kidd, C.; Nelkin, E.J.; Sorooshian, S.; Stocker, E.F.; Tan, J.; et al. Integrated Multi-Satellite Retrievals for the Global Precipitation Measurement (GPM) Mission (IMERG). In Satellite Precipitation Measurement: Volume 1; Levizzani, V., Kidd, C., Kirschbaum, D.B., Kummerow, C.D., Nakamura, K., Turk, F.J., Eds.; Springer International Publishing: Cham, Switzerland, 2020; pp. 343–353. [Google Scholar]
- Hamada, A.; Takayabu, Y.N. Improvements in Detection of Light Precipitation with the Global Precipitation Measurement Dual-Frequency Precipitation Radar (GPM DPR). J. Atmos. Ocean. Technol. 2016, 33, 653–667. [Google Scholar] [CrossRef]
- Derin, Y.; Anagnostou, E.N.; Berne, A.; Borga, M.; Boudevillain, B.; Buytaert, W.; Chang, C.-H.; Chen, H.; Delrieu, G.; Hsu, Y.-C.; et al. Evaluation of GPM-era Global Satellite Precipitation Products over Multiple Complex Terrain Regions. Remote Sens. 2019, 11, 2936. [Google Scholar] [CrossRef]
- Maggioni, V.; Massari, C. On the performance of satellite precipitation products in riverine flood modeling: A review. J. Hydrol. 2018, 558, 214–224. [Google Scholar] [CrossRef]
- Shige, S.; Kida, S.; Ashiwake, H.; Kubota, T.; Aonashi, K. Improvement of TMI Rain Retrievals in Mountainous Areas. J. Appl. Meteorol. Climatol. 2013, 52, 242–254. [Google Scholar] [CrossRef]
- Dinku, T.; Ceccato, P.; Grover-Kopec, E.; Lemma, M.; Connor, S.J.; Ropelewski, C.F. Validation of satellite rainfall products over East Africa’s complex topography. Int. J. Remote Sens. 2007, 28, 1503–1526. [Google Scholar] [CrossRef]
- Prakash, S.; Mitra, A.K.; Pai, D.S.; AghaKouchak, A. From TRMM to GPM: How well can heavy rainfall be detected from space? Adv. Water Resour. 2016, 88, 1–7. [Google Scholar] [CrossRef]
- Gebregiorgis, A.S.; Kirstetter, P.E.; Hong, Y.; Gourley, J.J.; Huffman, G.J.; Petersen, W.A.; Xue, X.; Schwaller, M.R. To What Extent is the Day 1 GPM IMERG Satellite Precipitation Estimate Improved as Compared to TRMM TMPA-RT? J. Geophys. Res. Atmos. 2018, 123, 1694–1707. [Google Scholar] [CrossRef]
- Immerzeel, W.W.; Wanders, N.; Lutz, A.F.; Shea, J.M.; Bierkens, M.F.P. Reconciling high-altitude precipitation in the upper Indus basin with glacier mass balances and runoff. Hydrol. Earth Syst. Sci. 2015, 19, 4673–4687. [Google Scholar] [CrossRef]
- Wang, Y.; Wang, L.; Li, X.; Zhou, J.; Hu, Z. An integration of gauge, satellite, and reanalysis precipitation datasets for the largest river basin of the Tibetan Plateau. Earth Syst. Sci. Data 2020, 12, 1789–1803. [Google Scholar] [CrossRef]
- Xu, R.; Tian, F.; Yang, L.; Hu, H.; Lu, H.; Hou, A. Ground validation of GPM IMERG and TRMM 3B42V7 rainfall products over southern Tibetan Plateau based on a high-density rain gauge network. J. Geophys. Res. Atmos. 2017, 122, 910–924. [Google Scholar] [CrossRef]
- Ma, Y.; Yang, Y.; Han, Z.; Tang, G.; Maguire, L.; Chu, Z.; Hong, Y. Comprehensive evaluation of Ensemble Multi-Satellite Precipitation Dataset using the Dynamic Bayesian Model Averaging scheme over the Tibetan plateau. J. Hydrol. 2018, 556, 634–644. [Google Scholar] [CrossRef]
- He, Q.S.; Yang, J.P.; Chen, H.J.; Liu, J.; Ji, Q.; Wang, Y.X.; Tang, F. Evaluation of Extreme Precipitation Based on Three Long-Term Gridded Products over the Qinghai-Tibet Plateau. Remote Sens. 2021, 13, 3010. [Google Scholar] [CrossRef]
- Tan, A.; Li, M.; Liu, H.; Chen, L.; Wang, T.; Yang, B.; Wan, M.; Shi, Y. Evaluation of the Accuracy and Applicability of Reanalysis Precipitation Products in the Lower Yarlung Zangbo Basin. Remote Sens. 2025, 17, 2396. [Google Scholar] [CrossRef]
- Dogra, A.; Thakur, J.; Tandon, A. Do satellite-based products suffice for rainfall observations over data-sparse complex terrains? Evidence from the North-Western Himalayas. Remote Sens. Environ. 2023, 299, 113855. [Google Scholar] [CrossRef]
- Zhou, C.; Zhou, L.; Du, J.; Yue, J.; Ao, T. Accuracy evaluation and comparison of GSMaP series for retrieving precipitation on the eastern edge of the Qinghai-Tibet Plateau. J. Hydrol. Reg. Stud. 2024, 56, 102017. [Google Scholar] [CrossRef]
- Chen, H.; Yong, B.; Gourley, J.J.; Liu, J.; Zhang, J. Impact of the Crucial Geographic and Climatic Factors on the Input Source Errors of GPM-based Global Satellite Precipitation Estimates. J. Hydrol. 2019, 575, 1–16. [Google Scholar] [CrossRef]
- Lin, Z.Q.; Yao, X.P.; Du, J.; Zhou, Z.B. Refined Evaluation of Satellite Precipitation Products against Rain Gauge Observations along the Sichuan-Tibet Railway. J. Meteorol. Res. 2022, 36, 779–797. [Google Scholar] [CrossRef]
- Chen, C.; Chen, Q.; Duan, Z.; Zhang, J.; Mo, K.; Li, Z.; Tang, G. Multiscale Comparative Evaluation of the GPM IMERG v5 and TRMM 3B42 v7 Precipitation Products from 2015 to 2017 over a Climate Transition Area of China. Remote Sens. 2018, 10, 944. [Google Scholar] [CrossRef]
- Prakash, S.; Mitra, A.K.; AghaKouchak, A.; Liu, Z.; Norouzi, H.; Pai, D.S. A preliminary assessment of GPM-based multi-satellite precipitation estimates over a monsoon dominated region. J. Hydrol. 2018, 556, 865–876. [Google Scholar] [CrossRef]
- Beck, H.E.; Vergopolan, N.; Pan, M.; Levizzani, V.; Dijk, A.I.J.M.v.; Weedon, G.P.; Brocca, L.L.; Pappenberger, F.; Huffman, G.J.; Wood, E.F. Global-Scale Evaluation of 22 Precipitation Datasets Using Gauge Observations and Hydrological Modeling. Adv. Glob. Change Res. 2017, 21, 6201–6217. [Google Scholar] [CrossRef]
- Mahmoud, M.T.; Al-Zahrani, M.A.; Sharif, H.O. Assessment of global precipitation measurement satellite products over Saudi Arabia. J. Hydrol. 2018, 559, 1–12. [Google Scholar] [CrossRef]
- Duan, Z.; Liu, J.; Tuo, Y.; Chiogna, G.; Disse, M. Evaluation of eight high spatial resolution gridded precipitation products in Adige Basin (Italy) at multiple temporal and spatial scales. Sci. Total Environ. 2016, 573, 1536–1553. [Google Scholar] [CrossRef]
- Liu, J.; Shangguan, D.; Liu, S.; Ding, Y.; Wang, S.; Wang, X. Evaluation and comparison of CHIRPS and MSWEP daily-precipitation products in the Qinghai-Tibet Plateau during the period of 1981–2015. Atmos. Res. 2019, 230, 104634. [Google Scholar] [CrossRef]
- Jiang, S.-H.; Zhou, M.; Ren, L.-L.; Cheng, X.-R.; Zhang, P.-J. Evaluation of latest TMPA and CMORPH satellite precipitation products over Yellow River Basin. Water Sci. Eng. 2016, 9, 87–96. [Google Scholar] [CrossRef]
- Lu, D.; Yong, B. Evaluation and Hydrological Utility of the Latest GPM IMERG V5 and GSMaP V7 Precipitation Products over the Tibetan Plateau. Remote Sens. 2018, 10, 2022. [Google Scholar] [CrossRef]
- He, Z.; Yang, L.; Tian, F.; Ni, G.; Hou, A.; Lu, H. Intercomparisons of Rainfall Estimates from TRMM and GPM Multisatellite Products over the Upper Mekong River Basin. J. Hydrometeorol. 2017, 18, 413–430. [Google Scholar] [CrossRef]
- Mei, Y.; Anagnostou, E.N.; Nikolopoulos, E.I.; Borga, M. Error Analysis of Satellite Precipitation Products in Mountainous Basins. J. Hydrometeorol. 2014, 15, 1778–1793. [Google Scholar] [CrossRef]
- Zhang, X.; Tang, Q. Combining satellite precipitation and long-term ground observations for hydrological monitoring in China. J. Geophys. Res. Atmos. 2015, 120, 6426–6443. [Google Scholar] [CrossRef]
- Bartsotas, N.S.; Nikolopoulos, E.I.; Anagnostou, E.N.; Solomos, S.; Kallos, G. Moving toward Subkilometer Modeling Grid Spacings: Impacts on Atmospheric and Hydrological Simulations of Extreme Flash Flood–Inducing Storms. J. Hydrometeorol. 2017, 18, 209–226. [Google Scholar] [CrossRef]
- Su, F.; Zhang, L.; Ou, T.; Chen, D.; Yao, T.; Tong, K.; Qi, Y. Hydrological response to future climate changes for the major upstream river basins in the Tibetan Plateau. Glob. Planet. Change 2016, 136, 82–95. [Google Scholar] [CrossRef]
- Wang, B.; Bao, Q.; Hoskins, B.; Wu, G.; Liu, Y. Tibetan Plateau warming and precipitation changes in East Asia. Geophys. Res. Lett. 2008, 35, L14702. [Google Scholar] [CrossRef]
- Yang, J.; Zhang, Z.; Wei, C.; Lu, F.; Guo, Q. Introducing the New Generation of Chinese Geostationary Weather Satellites, Fengyun-4. Bull. Am. Meteorol. Soc. 2017, 98, 1637–1658. [Google Scholar] [CrossRef]
- Min, M.; Wu, C.; Li, C.; Liu, H.; Xu, N.; Wu, X.; Chen, L.; Wang, F.; Sun, F.; Qin, D.; et al. Developing the science product algorithm testbed for Chinese next-generation geostationary meteorological satellites: Fengyun-4 series. J. Meteorol. Res. 2017, 31, 708–719. [Google Scholar] [CrossRef]
- Beck, H.E.; Pan, M.; Roy, T.; Weedon, G.P.; Pappenberger, F.; van Dijk, A.I.J.M.; Huffman, G.J.; Adler, R.F.; Wood, E.F. Daily evaluation of 26 precipitation datasets using Stage-IV gauge-radar data for the CONUS. Hydrol. Earth Syst. Sci. 2019, 23, 207–224. [Google Scholar] [CrossRef]
- Chen, F.; Li, X. Evaluation of IMERG and TRMM 3B43 Monthly Precipitation Products over Mainland China. Remote Sens. 2016, 8, 472. [Google Scholar] [CrossRef]
- Derin, Y.; Yilmaz, K.K. Evaluation of Multiple Satellite-Based Precipitation Products over Complex Topography. J. Hydrometeorol. 2014, 15, 1498–1516. [Google Scholar] [CrossRef]
- Farr, T.G.; Rosen, P.A.; Caro, E.; Crippen, R.; Duren, R.; Hensley, S.; Kobrick, M.; Paller, M.; Rodriguez, E.; Roth, L.; et al. The Shuttle Radar Topography Mission. Rev. Geophys. 2007, 45, 1–33. [Google Scholar] [CrossRef]
- Keikhosravi-Kiany, M.S.; Balling, R.C. Evaluation of GPM IMERG Early, Late, and Final Run in Representing Extreme Rainfall Indices in Southwestern Iran. Remote Sens. 2024, 16, 2779. [Google Scholar] [CrossRef]
- Gan, F.; Gao, Y.; Xiao, L. Comprehensive validation of the latest IMERG V06 precipitation estimates over a basin coupled with coastal locations, tropical climate and hill-karst combined landform. Atmos. Res. 2021, 249, 105293. [Google Scholar] [CrossRef]
- Gan, F.; Zhang, Y.; Diao, X.; Cao, G.; Tan, K.; Zhong, X.; Gao, Y. Performance evaluation of IMERG products based on the extremely heavy rainstorm event (2021) once in a thousand years in Henan, China. Atmos. Res. 2023, 285, 106639. [Google Scholar] [CrossRef]
- Popovych, V.F.; Dunaieva, I.A. Assessment of the GPM IMERG and CHIRPS precipitation estimations for the steppe part of the Crimea. Meteorol. Hydrol. Water Manag. 2021, 9, 1–13. [Google Scholar] [CrossRef]
- Sutton, J.R.P.; Kirschbaum, D.; Stanley, T.; Orland, E. Evaluating Precipitation Events Using GPM IMERG 30-Minute Near-Real-Time Precipitation Estimates. J. Hydrometeorol. 2024, 25, 991–1006. [Google Scholar] [CrossRef]
- Wang, Y.; Li, Z.; Gao, L.; Zhong, Y.; Peng, X. Comparison of GPM IMERG Version 06 Final Run Products and Its Latest Version 07 Precipitation Products across Scales: Similarities, Differences and Improvements. Remote Sens. 2023, 15, 5622. [Google Scholar] [CrossRef]
- Panday, P.K.; Frey, K.E.; Ghimire, B. Detection of the timing and duration of snowmelt in the Hindu Kush-Himalaya using QuikSCAT, 2000–2008. Environ. Res. Lett. 2011, 6, 024007. [Google Scholar] [CrossRef]
- Palash, W.; Bajracharya, S.R.; Shrestha, A.B.; Wahid, S.; Hossain, M.S.; Mogumder, T.K.; Mazumder, L.C. Climate Change Impacts on the Hydrology of the Brahmaputra River Basin. Climate 2023, 11, 18. [Google Scholar] [CrossRef]
- Yin, Z.-Y.; Zhang, X.; Liu, X.; Colella, M.; Chen, X. An Assessment of the Biases of Satellite Rainfall Estimates over the Tibetan Plateau and Correction Methods Based on Topographic Analysis. J. Hydrometeorol. 2008, 9, 301–326. [Google Scholar] [CrossRef]
- Ding, Y.; Wang, F.; Lu, Z.; Sun, P.; Wei, R.; Zhou, L.; Ao, T. Assessments of various precipitation product performances and disaster monitoring utilities over the Tibetan Plateau. Sci. Rep. 2024, 14, 19740. [Google Scholar] [CrossRef]
- Cheng, Y.; Zhang, X.; Wang, K.; Zhang, Y.; Guo, Y.; Shen, Y.-J. Multidimensional evaluation of satellite-based and reanalysis-based precipitation datasets in the Tibetan Plateau. J. Hydrol. 2025, 660, 133364. [Google Scholar] [CrossRef]
- Nepal, B.; Shrestha, D.; Sharma, S.; Shrestha, M.S.; Aryal, D.; Shrestha, N. Assessment of GPM-Era Satellite Products’ (IMERG and GSMaP) Ability to Detect Precipitation Extremes over Mountainous Country Nepal. Atmosphere 2021, 12, 254. [Google Scholar] [CrossRef]
- Tang, X.; Li, H.; Qin, G.; Huang, Y.; Qi, Y. Evaluation of Satellite-Based Precipitation Products over Complex Topography in Mountainous Southwestern China. Remote Sens. 2023, 15, 473. [Google Scholar] [CrossRef]
- Maggioni, V.; Nikolopoulos, E.I.; Anagnostou, E.N.; Borga, M. Modeling Satellite Precipitation Errors Over Mountainous Terrain: The Influence of Gauge Density, Seasonality, and Temporal Resolution. IEEE Trans. Geosci. Remote Sens. 2017, 55, 4130–4140. [Google Scholar] [CrossRef]
- Ma, J.; Wang, G.; Li, H. A variance-upscaling quantile mapping method for gridded precipitation bias correction. J. Hydrol. 2024, 632, 130959. [Google Scholar] [CrossRef]
- Yang, M.; Zhang, W. Orographic Effects of Geomorphology on Precipitation in a Pluvial Basin of the Eastern Tibetan Plateau. Water 2019, 11, 250. [Google Scholar] [CrossRef]


Disclaimer/Publisher’s Note: The statements, opinions and data contained in all publications are solely those of the individual author(s) and contributor(s) and not of MDPI and/or the editor(s). MDPI and/or the editor(s) disclaim responsibility for any injury to people or property resulting from any ideas, methods, instructions or products referred to in the content. |
© 2025 by the authors. Licensee MDPI, Basel, Switzerland. This article is an open access article distributed under the terms and conditions of the Creative Commons Attribution (CC BY) license.