Highlights
What are the main findings?
- This study presents, to the best of our knowledge, the first absolute radiometric calibration of CAS500-1/AEISS-C via two methods: (1) reflectance-based vicarious calibration and (2) cross-calibration with Sentinel-2/MSI (applying SBAF and MODIS MCD43A1-based BCF). Both methods yielded strong linear fits (R2 = 0.70–0.97 for vicarious calibration; R2 = 0.90–0.98 for cross-calibration).
- Since CAS500-1/AEISS-C employs a TDI CCD sensor, gain values were resolved for each seasonally varying TDI mode as follows: vicarious calibration (Blue, Green, Red, NIR, PAN)—0.08, 0.07, 0.10, 0.10, 0.08 (TDI mode 1)/0.21, 0.15, 0.19, 0.12, 0.16 (TDI mode 2); cross-calibration (Blue, Green, Red, NIR)—0.08, 0.06, 0.10, 0.07 (TDI mode 1)/0.21, 0.10, 0.18, 0.08 (TDI mode 2).
What are the implications of the main findings?
- This on-orbit absolute radiometric calibration of CAS500-1/AEISS-C highlights the need for continued coefficient updates and performance monitoring throughout the satellite’s operational period to ensure consistent image accuracy and reliability.
- For TDI CCD-based satellite sensors, absolute radiometric calibration should incorporate TDI in the derivation of coefficients.
Abstract
The absolute radiometric calibration of a satellite sensor is an essential process that determines the coefficients required to convert the radiometric quantities of satellite images. This procedure is crucial for ensuring the applicability and enhancing the reliability of optical sensors onboard satellites. This study performs the absolute radiometric calibration of the Compact Advanced Satellite 500-1 (CAS500-1) Advanced Earth Imaging Sensor System-C (AEISS-C), a low Earth orbit satellite developed independently by Republic of Korea for precise ground observation. Field campaign using a tarp, an Analytical Spectral Devices FieldSpecIII spectroradiometer, and a MicrotopsII sunphotometer was conducted. Additionally, reflectance-based vicarious calibration was performed using observational data and the MODerate resolution atmospheric TRANsmission model (version 6) radiative transfer model (RTM). Cross-calibration was also performed using data from the Sentinel-2 MultiSpectral Instrument, RadCalNet observations, and MODIS Bidirectional nReflectance Distribution Function (BRDF) products (MCD43A1) to account for differences in spectral response functions, viewing/solar geometry, and atmospheric conditions between the two satellites. From these datasets, two correction factors were derived: the Spectral Band Adjustment Factor and the BRDF Correction Factor. CAS500-1/AEISS-C acquires satellite imagery using two Time Delay Integration (TDI) modes, and the absolute radiometric calibration coefficients were derived considering these TDI modes. The coefficient of determination (R2) ranged from 0.70 to 0.97 for the reflectance-based vicarious calibration and from 0.90 to 0.99 for the cross-calibration. For reflectance-based vicarious calibration, aerosol optical depth was identified as the primary source of uncertainty among atmospheric factors. For cross-calibration, the reference satellite and RTMs were the primary sources of uncertainty. The results of this study will support the monitoring of CAS500-1/AEISS-C, which produces high-resolution imagery with a spatial resolution of 2 m, and can serve as foundational material for absolute radiometric calibration procedures for other CAS500 satellites.
1. Introduction
Absolute radiometric calibration is the process of converting the digital numbers (DNs) captured by satellite sensors into physical units, such as radiance or reflectance. This is critical for generating reliable satellite products, such as the normalized difference vegetation index, and for ensuring the accuracy and reliability of satellite imagery [1]. Although absolute radiometric calibration coefficients are typically measured in laboratory settings before launch [2], environmental factors, such as differences between ground-based laboratory conditions and the space environment, can cause variations in these coefficients after launch. Factors such as extreme temperature fluctuations, solar radiation exposure in space, and sensor performance degradation over time can further alter the absolute radiometric calibration coefficients of satellite sensors, necessitating periodic post-launch radiometric calibration to maintain consistent image quality.
Three primary methods are used for on-orbit radiometric calibration: onboard calibration, vicarious calibration, and cross-calibration. The Landsat series, beginning with Landsat-1, which was launched in 1972, and continuing with Landsat-9, which was launched on 27 September 2021, has employed onboard radiometric calibration using lamps since its inception [3,4]. This onboard calibration system has enabled the radiometric calibration of the Multi-Spectral Scanner (MSS) and Thematic Mapper (TM) onboard Landsat, ensuring the delivery of high-quality satellite imagery over an extended period. However, onboard systems increase the overall cost and complexity of satellite design and operation, and the gradual performance degradation of calibration lamps over time presents additional challenges. Furthermore, issues such as noise in the MSS [5], line-drop and scan-correlated level shift [6], and calibration issues with the Landsat-5 TM’s calibration pulse [7] have been identified.
Vicarious calibration has been recognized as an effective method for calibrating satellite optical sensors since its introduction by the Remote Sensing Group in the 1980s [8]. It has been widely applied in various studies, including for the Advanced Very High Resolution Radiometer [9], Landsat 5 TM [10,11], Landsat 7 Enhanced Thematic Mapper Plus [1], Landsat 8 Operational Land Imager [12], Korea Multi-Purpose Satellite (KOMPSAT)-3/3A [2,13,14,15], Beijing-1 micro-satellite [16], HJ-1A/1B [17], SuperView-1 [18], and ZY3-02 Multi-Spectral Imager [19,20]. Vicarious calibration requires field or airborne data to simulate the at-sensor radiance using radiative transfer models (RTMs), a process that requires significant time and resources.
Cross-calibration compares satellite sensors with well-calibrated reference satellites that have onboard calibration systems, making it a simpler and more practical approach [2,13,14,16,18,19,21]. However, differences in the spatial resolution, viewing geometry, spectral response functions (SRFs), and imaging times between the reference and target satellites can introduce errors and require careful attention.
As part of the Republic of Korea’s mid- to long-term space development plan, the Korean government aims to provide continuous high-resolution satellite imagery through the Compact Advanced Satellite (CAS) 500 program. The first satellite of the CAS500 program, CAS500-1, was developed under the leadership of the Korean government to establish a standard platform for 500 kg-class CAS500 and to independently develop a medium-sized satellite for high-precision Earth observation. Development began in March 2015 under the supervision of the Korea Aerospace Research Institute (KARI) and culminated in a successful launch on 22 March 2021. Prior to the launch of CAS500-1, the Republic of Korea relied heavily on imports for most key satellite components. However, through the CAS500 program, the country successfully achieved domestic development and production of major components for both the satellite bus and payload, marking a significant milestone in the advancement of Korea’s independent satellite technology.
The high-resolution imagery captured by CAS500-1, with a ground sampling distance (GSD) of 0.5 m for panchromatic (PAN) and 2 m for multispectral (MS) images, can support a wide range of applications, including map generation, land cover classification, land use monitoring, agriculture, vegetation analysis, environmental monitoring, and disaster response. However, to fully utilize CAS500-1’s capabilities and ensure consistent image quality, accurate radiometric calibration is essential to convert satellite image data into physical units, thereby improving the reliability of the satellite imagery. As mentioned above, CAS500-1 is built on a 500 kg-class standard platform and lacks an onboard calibration system, unlike larger satellites such as Landsat-8/9, which launch masses exceeding 2500 kg, or Sentinel-2A/B, each with a launch mass of 1140 kg. Therefore, the absolute radiometric calibration of CAS500-1 Advanced Earth Imaging Sensor System-C (AEISS-C) must be performed using vicarious calibration or cross-calibration methods rather than an onboard calibration system. This study presents the initial findings on the absolute radiometric calibration of CAS500-1/AEISS-C, providing a foundation for the operation of CAS500-2, a twin satellite of CAS500-1, scheduled for launch in 2025. To achieve this, rather than introducing novel or unconventional methods, this study applied well-established, highly accurate approaches: reflectance-based vicarious calibration using field measurements and cross-calibration utilizing the Sentinel-2A/B MultiSpectral Instrument (MSI) to perform the absolute radiometric calibration of CAS500-1/AEISS-C.
This paper is organized as follows: Section 2 introduces CAS500-1/AEISS-C, Sentinel-2/MSI, the field campaign sites, the Radiometric Calibration Network (RadCalNet), the absolute radiometric calibration methods, and the MODTRAN RTM. Section 3 presents and compares the absolute radiometric calibration result of CAS500-1/AEISS-C obtained using each method, along with their associated uncertainties. Section 4 summarizes the study, draws conclusions, and provides insights into future research directions and prospects.
2. Materials and Methods
2.1. CAS500-1/AEISS-C and Sentinel-2/MSI
The CAS500-1 satellite was developed under the leadership of KARI, with support from the Ministry of Science and Information and Communications Technology and the Ministry of Land, Infrastructure, and Transport. CAS500-1 is a high-resolution optical Earth observation satellite designed to acquire imagery for various applications, including land monitoring, environmental assessment, and disaster response.
The satellite is equipped with AEISS-C, which acquires high-resolution imagery with a GSD of 0.5 m for PAN and 2.0 m for MS images from an orbit of approximately 500 km. AEISS-C includes five spectral bands: blue, green, red, near-infrared (NIR), and PAN. Its structure is similar to that of AEISS-A onboard KOMPSAT-3A, ensuring continuity in sensor performance and data characteristics.
The signal-to-noise ratio (SNR) of AEISS-C exceeds 100 at Level 0, indicating high radiometric quality comparable to that of other high-resolution Earth observation satellites, such as KOMPSAT-3A and Sentinel-2 [22]. The modulation transfer function (MTF) is greater than 8% for the PAN band and greater than 12% for the MS bands, ensuring high spatial resolution for detailed feature detection. Additionally, MTF compensation improves these values to more than 13% for PAN and 19% for MS, further enhancing image sharpness and contrast. Compared to commercial satellites such as WorldView-3, which has an MTF of approximately 15% for PAN [23], CAS500-1 provides competitive image quality suitable for various remote sensing applications. The sensor has a radiometric resolution of 12 bits and a swath width exceeding 12 km at an orbital altitude of 500 km. CAS500-1 operates in a Sun-synchronous orbit with an inclination angle of 97.4°. Detailed specifications of AEISS-C are presented in Table 1, and the SRF of each band is illustrated in Figure 1.

Table 1.
Specifications of the Compact Advanced Satellite 500-1 (CAS500-1) Advanced Earth Imaging Sensor System-C (AEISS-C) and Sentinel-2 MultiSpectral Instrument (MSI). NIR: near-infrared; PAN: panchromatic; MS: MultiSpectral.
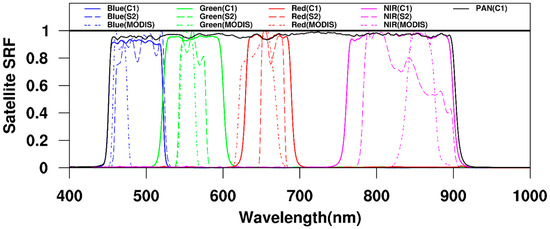
Figure 1.
Comparison of the spectral response functions (SRFs) for CAS500-1/AEISS-C, Sentinel-2/MSI, and MODIS. C1: CAS500-1/AEISS-C; S2: Sentinel-2/MSI.
For this study, CAS500-1/AEISS-C Level 1R (L1R) satellite images were utilized. L1R satellite imagery is generated by applying radiometric and geometric corrections to the raw imagery, ensuring that only the essential processing required for user applications is performed. The satellite’s orbit and attitude determination data are used to establish the image’s position. The accompanying XML file includes metadata such as view/solar geometry, acquisition time, and the latitude/longitude coordinates of the satellite imagery at the time of capture, allowing users to access essential spatial and temporal information.
Time Delay Integration (TDI) is a technique that electronically synchronizes charge transfer with image motion on the focal plane caused by the satellite’s movement, effectively increasing the integration time and thereby improving SNR performance [24,25]. Before the launch of CAS500-1, the optical satellite imagery from Korea’s previous satellites, KOMPSAT-3 and KOMPSAT-3A, had their TDI levels adjusted to ensure that DN values were neither too low in dark regions nor too high in bright regions. For this reason, Jin et al. [15] derived absolute radiometric calibration coefficients for the two TDI modes observed in KOMPSAT-3A. Similarly, CAS500-1/AEISS-C also applies two different TDI modes for satellite image acquisition. The primary user of CAS500-1 is the Ministry of Land, Infrastructure, and Transport of Korea, which utilizes its imagery for national land monitoring, resource management, and disaster response. Since the radiance incident on the satellite sensor varies significantly with solar elevation, CAS500-1/AEISS-C operates with two distinct TDI modes: Mode 1 from October to March and Mode 2 from April to September, ensuring optimal image quality throughout the year. Therefore, similar to Jin et al. [15], this study performed absolute radiometric calibration for the two TDI modes of CAS500-1/AEISS-C.
Jin et al. [15] identified significant uncertainties in satellite images with a viewing zenith angle (VZA) exceeding 15° and, therefore, used only images with a VZA within 15°. However, in this study, satellite images with a VZA greater than 15° were also included in both reflectance-based vicarious calibration and cross-calibration. This approach was intended to provide insights for CAS500-2, scheduled for launch in 2025, by analyzing CAS500-1/AEISS-C results under a wider range of conditions.
For the cross-calibration of CAS500-1/AEISS-C, we used Sentinel-2/MSI as the reference satellite. Operated by the European Space Agency, Sentinel-2 consists of Sentinel-2A and Sentinel-2B, which were launched in 2015 and 2017, respectively. The satellite has a high revisit frequency (five days) and provides Earth observation imagery with spatial resolutions of 10, 20, and 60 m [26]. Although Sentinel-2/MSI has 13 bands, we used the blue, green, red, and NIR bands (B02, B03, B04, and B08, respectively) corresponding to those of CAS500-1/AEISS-C (Table 1). Sentinel-2/MSI also features an onboard calibration system, the calibration and shutter mechanism, which uses a full-field/full-pupil diffuser integrated with the MSI to ensure high-quality radiometric calibration [27]. This ensures that Sentinel-2/MSI provides highly accurate data, with an uncertainty of less than 5% [28,29]. The high spatial resolution of Sentinel-2 is particularly well suited for cross-calibration with CAS500-1/AEISS-C due to its ability to observe a 48 m × 48 m gravel target at the Baotou site.
2.2. Reflectance-Based Vicarious Calibration
Numerous studies have derived absolute radiometric calibration coefficients for satellites using large, uniform areas, such as deserts, or using consistent reflectance targets, such as tarps, as performed in this study [2,13,14,15,18,30,31,32,33,34,35]. Vicarious calibration methods can be categorized into three types: reflectance-, radiance-, and irradiance-based. As previously described, this study applies a standard reflectance-based vicarious calibration approach to derive the on-orbit radiometric calibration coefficients for CAS500-1/AEISS-C. It does not employ experimental or novel methods. Instead, it applies the well-established and highly accurate reflectance-based vicarious calibration method, which has been widely adopted in previous studies. A schematic of the reflectance-based vicarious calibration for CAS500-1/AEISS-C used in this study is illustrated in Figure 2.
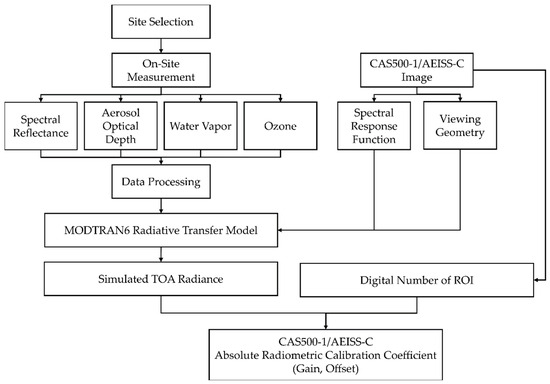
Figure 2.
Schematic diagram illustrating reflectance-based vicarious calibration. MODTRAN6: MODerate resolution atmospheric TRANsmission model version 6; TOA: top-of-atmosphere; ROI: region of interest.
Field campaigns for the absolute radiometric calibration of CAS500-1/AEISS were conducted at multiple locations, including KARI (36.37°N, 127.35°E), the Ulsan National Institute of Science and Technology (UNIST; 35.57°N, 129.19°E), Jeju (33.56°N, 126.77°E), and Zuunmod in Mongolia (47.71°N, 106.99°E), as shown in Figure 3. In total, nine field campaigns were conducted (Table 2).
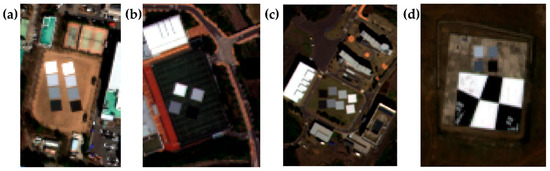
Figure 3.
CAS500-1/AEISS-C RGB color composite image of (a) the Korea Aerospace Research Institute (KARI) on 20 March 2024, (b) Ulsan National Institute of Science and Technology (UNIST) on 17 June 2022, (c) Jeju on 21 October 2023, and (d) Zuunmod on June 8, 2024.
Table 2.
Geometric and atmospheric conditions of CAS500-1 during the field campaigns. WV: water vapor; AOD: aerosol optical depth.
Unlike typical radiometric calibration field sites, which are often located in deserts due to their high surface reflectance (SR), large homogeneous areas, and minimal atmospheric interference, Korea lacks such desert environments. Additionally, Korea experiences distinct seasonal changes, leading to significant variations in surface conditions. To mitigate this issue, this study employed four tarps with distinct reflectance values (0.52, 0.34, 0.22, and 0.035) that remain stable across different wavelengths (Figure 4a). These tarps are radiometrically homogeneous and exhibit strong reflectance contrast relative to the surrounding terrain, ensuring that the target can be clearly distinguished from nearby surfaces. This characteristic, widely leveraged in numerous studies for reflectance-based vicarious calibration of optical satellite sensors, helps minimize adjacency effects and supports consistent reflectance measurements throughout different seasons. Tang et al. [19] explored the use of colored tarps, such as red and blue, to improve absolute radiometric calibration accuracy. The inclusion of such tarps in future research may further refine calibration methodologies.
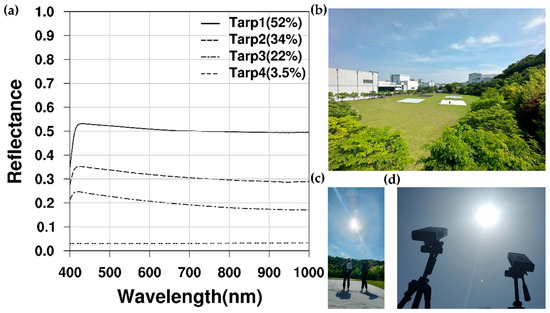
Figure 4.
(a) Tarp reflectance measured using the ASD FieldSpecIII during field campaign; (b) tarps deployed at the KARI site; (c) researcher measuring surface reflectance on a tarp using the Analytical Spectral Devices (ASD) FieldSpecIII; and (d) MicrotopsII aimed at the Sun.
Since Korea’s summer is affected by monsoons, the field campaign was primarily conducted in spring and autumn to avoid excessive cloud cover and precipitation. The field campaign was planned based on satellite orbit simulations and conducted on clear days according to weather forecasts. However, due to high cloud variability, SR and atmospheric data affected by clouds were filtered out through post-processing. Cases in which clouds were detected in satellite imagery of the field campaign were excluded.
For the reflectance-based vicarious calibration method, four 15 m × 15 m tarps were deployed in the field campaigns (Figure 4b). SR was measured 30 min before and after the satellite’s overpass using the Analytical Spectral Devices (ASD) FieldSpec III (Analytical Spectral Devices Inc., Boulder, CO, USA) (Figure 4c). The ASD FieldSpec III provides high-accuracy SR measurements across the 350–2500 nm wavelength range and has been widely used in previous studies [2,30,31,32] for reflectance-based vicarious calibration of optical satellite sensors. Each tarp was evenly divided into nine points for spatially uniform measurements, and five spectral samples were collected at each point, yielding a total of 90 spectral SR measurements before and after the satellite overpass. To ensure accurate calibration, the ASD FieldSpec III was referenced using RS3 software and a Spectralon® panel (Labsphere, Inc., North Sutton, NH, USA), which exhibits nearly 99% Lambertian reflectance. The sensor was oriented nadir to assume a Lambertian surface, and any resulting errors were considered negligible [36]. Researchers wore dark clothing during observations to minimize stray reflections. To further reduce adjacency effects from the surroundings, SR measurements were conducted slightly inward from the outer edges of each tarp. This ensured that all SR data represented the homogeneous central area of the tarp, consistent with the pixels later extracted from the satellite imagery.
To obtain accurate atmospheric condition data, portable Sun photometers, such as the MicrotopsII (Solar Light Company Inc., Glenside, PA, USA), were used to measure aerosol optical depth (AOD), water vapor (WV), and ozone (O3) during the field campaigns. While fixed instruments, such as those in the AERONET network, provide higher accuracy, they are not always available at field sites. The MicrotopsII has been widely used in previous studies [2,30,33,34,35] due to its portability and ability to measure atmospheric parameters with an accuracy of 1–2%. However, its accuracy can be influenced by cloud cover and operator experience. To minimize these uncertainties, observations were performed with the device mounted on a tripod (Figure 4d), and a total of 10 measurements were taken at 10 min intervals to assess the atmospheric variability during the observation period.
Field measurements were also conducted at locations with fixed atmospheric monitoring instruments to cross-check MicrotopsII readings. While KARI and UNIST were not ideal field sites due to their urban locations and proximity to major roads, they were selected because of their accessibility and the presence of fixed observation instruments. In contrast, Jeju is located on Jeju Island, distant from urban areas, making it a more suitable site for fieldwork. However, its low elevation and proximity to the ocean increase its susceptibility to atmospheric influences, such as sea salt aerosols. Zuunmod, located approximately 20 km from Ulaanbaatar, Mongolia, is situated at an elevation of 1527 m in a semi-arid region characterized by barren land and grasslands. This site features an edge target jointly established by KARI and Information and Research Institute of Meteorology, Hydrology and Environment to enhance satellite image sharpness, making it an optimal location for radiometric calibration (Figure 3d).
To derive the absolute radiometric calibration coefficient, it is essential to use field-measured data, such as SR, AOD, O3, and WV, along with theoretical radiative transfer simulations. An RTM enables the simulation of radiation transmission, scattering, and re-emission as it passes through an atmospheric medium. In this study, MODerate resolution atmospheric TRANsmission model version 6 (MODTRAN6) (Spectral Sciences Inc., Burlington, MA, USA) [37], an RTM that offers high flexibility in simulating radiative fluxes with high spectral resolution and various observation geometries, was employed to simulate top-of-atmosphere (TOA) radiance. MODTRAN6 incorporates high-resolution absorption line data for atmospheric gases, with precise treatments of line-broadening effects caused by temperature, pressure, molecular motion, and collision-induced Lorentz broadening.
For the reflectance-based vicarious calibration method used in this analysis, the surface was assumed to be a uniform Lambertian reflector and the atmosphere horizontally homogeneous. TOA radiance can be expressed as follows in Equations (1) and (2) [18]:
where represents the spectral radiance received by the sensor; is the path radiance; indicates the SR; denotes the atmospheric spherical albedo; and and are the cosine of the solar zenith angle (SZA) and the VZA, respectively. and represent the transmittance from the Sun to the surface and from the surface to the sensor, respectively. is the CAS500-1/AEISS-C band TOA radiance. signifies the SRF of CAS500-1/AEISS-C band . and represent the minimum and maximum wavelengths within the effective wavelength range of band , respectively. The parameters used for the MODTRAN6 simulations are listed in Table 3.
Table 3.
Summary of the MODTRAN6 input parameters used to simulate TOA radiance for reflectance-based vicarious calibration method.
To extract the DN corresponding to the tarp in the satellite image, a representative value was determined by averaging the region with the smallest standard deviation within a 5 × 5 (color) or 20 × 20 (panchromatic) pixel area. This approach accounted for the tarp’s size (approximately 15 m × 15 m) and the spatial resolution of CAS500-1/AEISS-C (2.0 m for MS, 0.5 m for PAN). Consistent with the SR measurements, pixels at the outer edges of the tarps were excluded to minimize adjacency effects.
The absolute radiometric calibration coefficients, gain () and offset (), representing the linear relationship between the satellite image DN and TOA radiance (), are expressed by Equation (3):
where the subscript i represents the corresponding satellite band.
2.3. Cross-Calibration with Sentinel-2/MSI
Unlike reflectance-based vicarious calibration, cross-calibration does not require field campaigns. It uses a well-calibrated sensor on another satellite (in this case, Sentinel-2/MSI) operating in the same wavelength region to derive the TOA radiance. The linear relationship between the DN values of the CAS500-1/AEISS-C image and the TOA radiance of the reference satellite is then used to calculate the absolute radiometric calibration coefficients, as described in Equation (3) [12,14,18,19]. The cross-calibration process for CAS500-1/AEISS-C used in this study is depicted in Figure 5.
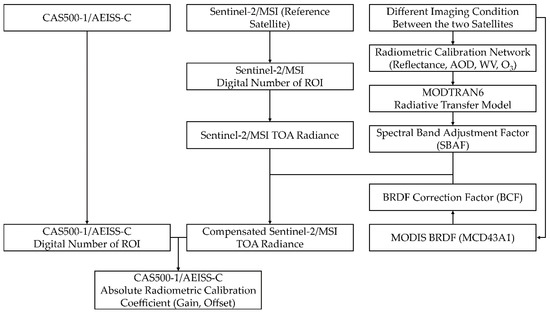
Figure 5.
Schematic diagram illustrating cross-calibration. MODTRAN6: MODerate resolution atmospheric TRANsmission model version 6; TOA: top-of-atmosphere; ROI: region of interest.
We selected satellite images of the Baotou gravel target, part of RadCalNet (Figure 6), for the cross-calibration of CAS500-1/AEISS-C. RadCalNet is designed to deliver continuous radiometric calibration data for optical sensors operating across the visible to shortwave infrared wavelength range (400–2500 nm). It automatically monitors SR, AOD, O3, and WV, providing these measurements every 30 min from 9 a.m. to 3 p.m. local time. Additionally, RadCalNet provides the uncertainty associated with each observation and the simulated TOA reflectance, which can be utilized for satellite sensor monitoring, comparison, and calibration [39]. RadCalNet provides observational data from five locations: Railroad valley, Nevada, USA (38.497°N, 244.310°E); Baotou, China (40.851°N, 109.629°E) and its nearby desert site, Baotou Sand (40.866°N, 109.616°E); La Crau, France (43.559°N, 4.864°E); and Gobabeb, Namibia (−23.600°N, 15.120°E).
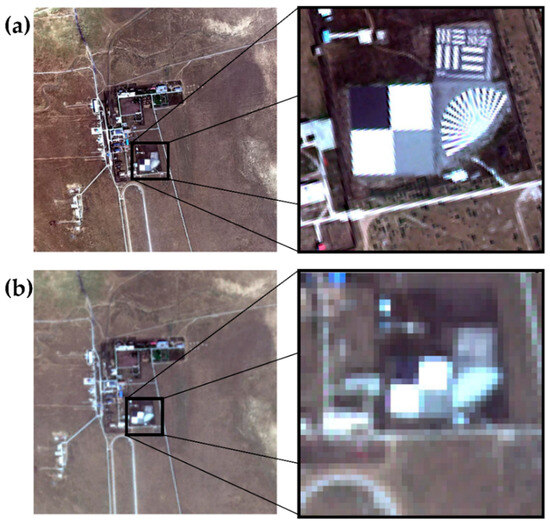
Figure 6.
(a) CAS500-1/AEISS-C and (b) Sentinel-2/MSI RGB color composite images of the Baotou grayscale gravel target, captured on 13 September 2023.
In a previous study [40], the uncertainty in the TOA reflectance at Baotou and Baotou Sand was reported to be 7% and 4–5%, respectively. This suggests that the data can be effectively used to derive absolute radiometric calibration coefficients in the visible and NIR regions. In our study, we used SR, AOD, O3, and WV data provided by RadCalNet at the Baotou gravel target to simulate TOA radiance for calculating the spectral band adjustment factor (SBAF), which was applied for cross-calibration.
Many previous studies have conducted cross-calibration using satellite imagery acquired over desert-based Pseudo-Invariant Calibration Sites (PICS) [14,15,21]. However, performing cross-calibration using PICS requires a sufficient number of satellite images. Considering the need for timely cross-calibration during the early operational stage of CAS500-1, Baotou, characterized by its well-defined gravel target, was selected as the reference site. In many previous studies, SR and atmospheric parameters were obtained through direct field measurements to achieve more accurate cross-calibration [18,41].
Planning cross-calibration using deserts and fieldworks requires predicting the synchronized overpass times of the satellites when both the reference satellite and the target satellite (CAS500-1 in this study) pass over the same location within a similar timeframe. Consequently, planning and conducting field campaigns for cross-calibration typically requires more time than field measurements for reflectance-based vicarious calibration, as the latter involves only a single satellite. However, as previously stated, considering the importance of presenting absolute radiometric calibration results for CAS500-1/AEISS-C, this study employed the automated observational dataset from RadCalNet, which provides SR and atmospheric parameters. As previously described, RadCalNet has four sites. Even at arid/semi-arid RadCalNet sites, Baotou and Railroad valley sites may experience snowfall and rainfall during winter, leading to variations in SR. Therefore, using observational data and satellite imagery from Railroad valley and Baotou sand for cross-calibration was considered challenging. In contrast, the artificial Baotou gravel target, with three different reflectance levels, exhibits minimal variation in reflectance even under snowfall and rainfall conditions, making it suitable for deriving absolute radiometric calibration coefficients, similar to reflectance-based vicarious calibration. Thus, in this study, cross-calibration of CAS500-1/AEISS-C was performed using the three reflectance levels of the Baotou gravel target, with Sentinel-2/MSI as the reference satellite.
The Baotou site is located approximately 50 km from the Baotou urban area and consists of flat terrain of approximately 300 km2, consisting of sand and bare ground. The surrounding environment is radiometrically uniform and exhibits strong contrast relative to the gravel targets, thereby minimizing adjacency effects and allowing the gravel targets to be clearly distinguished from the background. A grayscale gravel target with consistent reflectance values of 56%, 18%, and 7% is installed in the area. Measuring 48 m × 48 m, the Baotou gravel target is at least five times larger than the spatial resolutions of CAS500-1/AEISS-C (2 m) and Sentinel-2/MSI (10 m), making Sentinel-2/MSI particularly suitable as the reference satellite for cross-calibration. As noted earlier, Sentinel-2/MSI was selected due to its finer spatial resolution compared to that of Landsat-8/OLI (30 m), ensuring more precise cross-calibration over the gravel target area.
For cross-calibration, co-located pixels between CAS500-1/AEISS-C and Sentinel-2/MSI were identified over the homogeneous Baotou gravel target. For both satellites, the mean DN values were extracted from the same interior region of each 48 m × 48 m gravel target to minimize potential adjacency effects from the surrounding area.
The SRFs of the two satellite sensors used for cross-calibration did not match perfectly, and there was a time difference of 20–40 min between the satellite images, leading to an SZA difference of 1.5–3.6° (Table 4). This can introduce uncertainty in the cross-calibration process [41]. To compensate for the differences in SRF, previous studies have used an SBAF to calculate the absolute radiometric calibration coefficients through cross-calibration [14,16,18,19,21,41,42]. Furthermore, cosine correction has been applied to account for variations in SZA due to variations in sensing times [14,41]. In accordance with Wang et al. [42], who showed that considering the geometry of each satellite can help reduce BRDF-related uncertainties, the SBAF in this study was also computed by incorporating the geometry of each satellite.
Table 4.
Geometric conditions of CAS500-1/AEISS-C and Sentinel-2/MSI satellite images for cross-calibration.
In this study, dates that met the following criteria were selected to calculate the SBAF (Equation (4); Table 4) [19]:
- The satellite images from both CAS500-1/AEISS-C and Sentinel-2/MSI had to be captured over the Baotou site on the same day.
- Observational data from Baotou needed to be available within one hour of the satellite overpass.
In Equation (4), and represent the spectral TOA radiance of CAS500-1/AEISS-C and Sentinel-2/MSI, respectively, simulated using MODTRAN6 and RadCalNet data, accounting for the viewing/solar geometry of each satellite image. and denote the SRFs for each band of CAS500-1/AEISS-C and Sentinel-2/MSI, respectively. Using Equation (4), the RadCalNet data represent the atmospheric and surface conditions at the time of the satellite overpass, accounting for the solar and viewing geometry specific to each satellite. Consequently, uncertainties arising from SRF differences between the sensors, variations in SZA due to time gaps between overpasses, and atmospheric changes are compensated for using the SBAF.
As shown in Table 4, even for satellite images capturing the Baotou gravel target on the same date, differences in solar/viewing geometry occur due to an approximate 20 min difference in satellite overpass times and variations in satellite orbit. In particular, the VZA can differ by up to approximately 17°, which may lead to uncertainties due to the BRDF. The BRDF describes how surface reflectance varies as a function of illumination and observation angles. Many previous studies have used MODIS to derive a BRDF model for correcting such effects [43,44,45]. To mitigate this, the study additionally utilized the MODIS BRDF product, MCD43A1, which provides BRDF parameters derived from multi-angle surface observations over a 16-day period. Specifically, bands corresponding to CAS500-1/AEISS-C and Sentinel-2/MSI, namely, B3 (blue), B4 (green), B1 (red), and B2 (NIR), were selected (Figure 1). The MCD43A1 product offers BRDF parameters based on the semi-empirical RossThick–LiSparseReciprocal model (Equation (5)):
In this model, the parameters , , and represent the isotropic, volumetric, and geometric scattering components of SR, respectively, while and are the corresponding RossThick and LiSparseReciprocal kernels, respectively. , , and represent the SZA, VZA, and relative azimuth angle (viewing–solar). Using the viewing and solar geometries at each satellite’s overpass time and the BRDF parameters from MCD43A1, the modeled SR (R) was computed to represent the bottom-of-atmosphere (BOA) reflectance for each satellite. The ratio of the MODIS-based reflectances between CAS500-1/AEISS-C and Sentinel-2/MSI was used to derive the BRDF correction factor (BCF). In this study, the MODIS MCD43A1 BRDF parameters were used to compensate for viewing and solar geometry differences between the two satellites, rather than to represent the intrinsic BRDF characteristics of the gravel target itself. The BCF is defined as follows:
where and represent the BOA reflectances simulated using the MCD43A1 BRDF parameter and the viewing and solar geometries of the two satellites.
This approach minimizes the uncertainty in converting the Sentinel-2/MSI TOA radiance () to the CAS500-1/AEISS-C () radiance, as shown in Equation (7):
This study addressed the issue by carefully examining the physical and geometric characteristics of the site. The Baotou gravel target is an artificial, non-vegetated surface composed of uniformly distributed gravel, designed to provide consistent reflectance properties for satellite calibration. Its relatively flat topography and stable surface material suggest minimal anisotropic reflectance behavior compared to that of natural or vegetated surfaces. Indeed, Tang et al. [19] reported that reflectance-based vicarious calibration using this target showed uncertainties within 2%, which implies high uniformity. However, despite these favorable characteristics, this study aimed to minimize any residual geometric effects by incorporating BRDF correction using the MODIS MCD43A1 product.
Although MCD43A1 has a coarse spatial resolution (500 m) relative to the 48 m × 48 m Baotou target, the spatial homogeneity and well-defined geometry of the target allowed for its effective application. BRDF parameters from MCD43A1 were used to simulate BOA reflectance under the specific solar and viewing geometry of each satellite, from which the BCF was derived. This correction was subsequently applied to compensate for directional reflectance differences between CAS500-1/AEISS-C and Sentinel-2/MSI, thereby enhancing the robustness of the cross-calibration.
2.4. Sensitivity Analysis of Input Data for Absolute Radiometric Calibration Coefficients
In the reflectance-based vicarious calibration method, band TOA radiances were simulated using MODTRAN6 with field-observed data, including AOD, O3, WV, and SR. However, uncertainties, such as measurement inaccuracies, can affect the accuracy of the derived coefficients. Therefore, this study analyzed the sources of uncertainty. The MicrotopsII, used for measuring AOD, O3, and WV, had an accuracy of 1–2%, with assumed uncertainties of up to 2% for these parameters. The uncertainty in SR was defined as the standard deviation of the 90 spectral SR measurements collected before and after the satellite overpass. Additionally, the uncertainty in the TOA solar irradiance (R0) was calculated using the six R0 options available in MODTRAN6 [38,46,47,48,49,50,51]. Finally, the uncertainty in the band TOA radiance simulations using MODTRAN5 (RTM), the previous version of MODTRAN6, was assumed to be approximately 2% [37].
For the cross-calibration method, the absolute radiometric calibration coefficients were calculated using the reference satellite image and MODTRAN6. The error due to differences in imaging time and sensor SRF was compensated for using the SBAF derived from MODTRAN6. The total uncertainty of the coefficients was calculated by incorporating the 2% uncertainty in MODTRAN6 along with the uncertainties in the input data (AOD, WV, O3, and SR) provided by RadCalNet. The uncertainty of Sentinel-2/MSI has been reported to be less than 5% [28,29]. As Baotou’s artificial targets were sufficiently large, potential mismatches in satellite imagery were not considered.
It should also be noted that differences in atmospheric conditions and surface characteristics across calibration cases inherently lead to variations in the propagated uncertainties once the calibration coefficients are derived. Such variability reflects physical differences in observation conditions rather than limitations of the calibration methodologies themselves, and therefore, does not undermine the robustness of either the reflectance-based vicarious calibration or the cross-calibration approach.
The uncertainty for each factor was calculated as the standard deviation of the set of coefficients derived from each variable () divided by the average of these values, as shown in Equation (8), with the total uncertainty expressed in Equation (9):
3. Results
3.1. Results of Reflectance-Based Vicarious Calibration
A total of nine field campaigns were conducted for the absolute radiometric calibration of CAS500-1/AEISS-C. The SR and atmospheric parameters observed during the campaigns were input into MODTRAN6 to simulate TOA radiance, and the absolute radiometric calibration gain coefficients for each campaign were derived based on the linear relationship between the simulated TOA radiance and the DN values extracted from the satellite imagery (Table 5).
Table 5.
Reflectance-based vicarious calibration results (Gain, Offset, and R2) for each field campaign, representing the linear relationship between the digital number (DN) observed by CAS500-1/AEISS-C and the top-of-atmosphere (TOA) radiance simulated using MODTRAN6, along with the associated total uncertainty (u*) (%).
Regardless of the band or case, R2 ranged from 0.97 to 1.00, indicating an extremely strong linear relationship. As mentioned earlier, CAS500-1/AEISS-C operates with two TDI modes to adjust the amount of incident light received according to changes in solar elevation angle. Among the nine field campaigns, Mode 1 was used in five cases, while Mode 2 was used in four cases. Although the gain values showed little variation within the same TDI mode, there was a clear distinction in gain values between the two TDI modes.
In Table 5, both gain and offset values exhibit noticeable variation across different field campaigns. Specifically, for TDI Mode 1, the gain values were 0.09–0.18 (Blue), 0.09–0.12 (Green), 0.11–0.17 (Red), 0.09–0.12 (NIR), and 0.09–0.10 (PAN), while the Offset values varied between −41.98 and −104.13 (Blue), −40.57 and −91.33 (Green), −23.01 and −64.99 (Red), −37.49 and −64.56 (NIR), and −40.09 and −83.14 (PAN). For TDI Mode 2, the gain values were 0.20–0.32 (Blue), 0.14–0.18 (Green), 0.18–0.24 (Red), 0.10–0.13 (NIR), and 0.16–0.19 (PAN), while the Offset values ranged between −66.97 and −95.90 (Blue), −63.90 and −88.20 (Green), −42.97 and −81.78 (Red), −90.38 and −133.90 (NIR), and −59.24 and −106.40 (PAN).
The variations in calibration coefficients between sites, and occasionally within the same site, arise primarily from differences in the atmospheric and environmental conditions at the time of each field campaign (Table 2). Although the calibration coefficients of a satellite sensor are expected to remain stable over short time periods, the coefficients naturally fluctuate in response to atmospheric conditions and solar/viewing geometry. The offset term, which reflects the combined contribution of atmospheric path radiance and surface–atmosphere scattering, also varied accordingly. Despite these influences, particularly at the Korean sites where heterogeneous surroundings, low elevation, and seasonal atmospheric variability are unavoidable, the uncertainties remained within 2.15–5.20%, demonstrating that reliable and sufficiently accurate calibration coefficients could still be obtained.
Clear differences are observed between the two field campaigns conducted at Zuunmod (Table 5). Although this site offers highly homogeneous terrain with minimal adjacency effects and nearly identical measured atmospheric parameters on 7 June 2024 and 8 June 2024, the derived calibration coefficients differed. Field observations indicated intermittent thin cirrus on 7 June, whereas 8 June remained completely clear. Because the radiative transfer simulations assume ideal cloud-free conditions, even weak subvisible clouds can modify the diffuse-to-direct irradiance ratio in ways not captured by ground-based AOD, water vapor, or ozone measurements. This atmospheric discrepancy explains the elevated Gain observed on 7 June relative to 8 June, despite the similarity in measured atmospheric parameters. In contrast, cases with stronger cloud contamination typically exhibited substantially higher offsets due to enhanced path radiance; the comparatively low offset on 7 June suggests that cloud influence was weak but still sufficient to affect gain. These findings indicate that the observed variations in gain and offset primarily reflect differences in atmospheric and geometric conditions during each field campaign, rather than sensor instability or ground–atmosphere coupling effects.
The absolute radiometric calibration coefficients for the TDI modes of CAS500-1/AEISS-C were derived using all fieldwork data corresponding to each TDI mode (Table 6, Figure 7 and Figure 8). While the linear relationship between DN values from satellite images and TOA radiance derived from field measurement data showed a general linear trend, R2 varied significantly from 0.70 to 0.97, in contrast to the results from individual campaigns.
Table 6.
Reflectance-based vicarious calibration results (Gain, Offset, and R2) for each TDI mode, representing the linear relationship between the digital number (DN) observed by CAS500-1/AEISS-C and the top-of-atmosphere (TOA) radiance simulated using MODTRAN6.
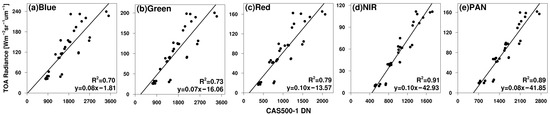
Figure 7.
Scatterplots of the reflectance-based vicarious calibration method using all cases of CAS500-1/AEISS-C Mode 1. (a) Blue, (b) Green, (c) Red, (d) NIR, and (e) PAN.
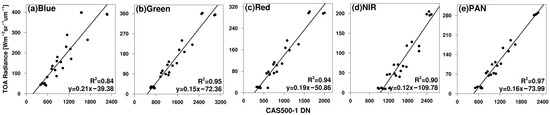
Figure 8.
Scatterplots of the reflectance-based vicarious calibration method using all cases of CAS500-1/AEISS-C Mode 2. (a) Blue, (b) Green, (c) Red, (d) NIR, and (e) PAN.
Mode 1 generally exhibited lower R2 values, ranging from 0.70 to 0.91, whereas Mode 2 showed relatively higher values, ranging from 0.84 to 0.97. In particular, all bands in Mode 2, except the Blue band, exhibited R2 values above 0.90, indicating a strong linear relationship (Figure 8). In contrast, Mode 1 displayed weaker linearity, with R2 values below 0.80 for the Blue, Green, and Red bands, while NIR and PAN maintained higher linearity (Figure 7).
Unlike Zuunmod, which is located at a high elevation, surrounded by terrain with stable reflectance, and free from nearby buildings, the KARI, UNIST, and Jeju sites are at lower elevations and surrounded by buildings, making them more susceptible to influences from surrounding terrain and atmospheric effects. Notably, Mode 2 included two field campaigns conducted at Zuunmod, whereas Mode 1 did not include any Zuunmod cases, which may explain the relatively lower R2 values observed for Mode 1. Additionally, the satellite images used for Mode 1 field campaigns may have contained thin cirrus or cirrostratus clouds that were not visually detected, which could have further contributed to the lower R2 values.
The uncertainty in the reflectance-based vicarious calibration ranged from 2.97% to 4.25% (Table 7). In this method, both Mode 1 and Mode 2 exhibited the highest uncertainties in the Blue band and the lowest in the NIR band. The SR, RTM, R0, AOD, WV, and O3 contributed, in that order, to the smallest uncertainties (Table 7). Among the input data obtained from field measurements, AOD and SR exhibited the greatest uncertainties, excluding RTM and R0. Using MicrotopsII, the AODs at 440 nm and 675 nm were measured, and the AOD at 550 nm was calculated for input into MODTRAN6 [2]. However, the aerosol types and vertical profiles were not obtained with MicrotopsII. Therefore, to calculate the TOA radiance, the aerosol type and vertical profile were used for the urban/maritime/rural aerosol types and the default aerosol vertical profile in MODTRAN6.
Table 7.
Sources of uncertainty in reflectance-based vicarious calibration. SR: Surface reflectance; AOD: Aerosol Optical Depth; WV: Water Vapor; O3: Total Ozone Column; R0: top-of-atmosphere solar irradiance; RTM: MODTRAN6 radiative transfer model.
In a previous study, when the AOD exceeded 0.1, the uncertainty based on the assumed aerosol type could be large [20]. The AOD in this study was 0.06–0.45, demonstrating a substantial deviation according to the region, and a high AOD in the city was confirmed. The use of MicrotopsII for AOD measurements and the lack of aerosol types or vertical profile data contributed to these uncertainties. The maximum AOD uncertainty (0.99%) was observed for the 17 June 2022 UNIST case, which was higher than the maximum value of 0.67% reported by Liu et al. [18].
SR measurements using the ASD FieldSpecIII exhibited uncertainties between 1.99% and 3.16%, primarily due to factors such as human error and variations in the SZA, similar to the 1.66–2.35% reported by Liu et al. [18]. Therefore, more precise SR measurements are required for reflectance-based vicarious calibration methods during fieldwork. In addition, the Lambertian assumption was adopted in the uncertainty analysis, as all SR measurements were conducted under nadir-viewing geometry. Although potential errors resulting from this assumption were not explicitly modeled and were thus neglected—as in Chen et al. [36]—previous studies have reported that uncertainties arising from the Lambertian assumption of calibration targets are typically minor, approximately 1.5% [19] and 2% [20].
3.2. Results of Cross-Calibration with Sentinel-2/MSI
In this study, Sentinel-2/MSI was used as the reference satellite for the cross-calibration of CAS500-1/AEISS-C. To compensate for differences in SRF and solar/viewing geometry between CAS500-1/AEISS-C and Sentinel-2/MSI, as well as changes in atmospheric and surface conditions due to the time gap between image acquisitions, the SBAF was calculated using RadCalNet data and satellite metadata.
While the Baotou gravel target ensures that SR remains relatively stable, atmospheric conditions at the Baotou site can change rapidly, even in a semi-arid region. As shown in Table 8, SBAF varied by band and case, with the red and NIR bands consistently showing values below one. In contrast, the blue and green bands exhibited values either above or below one, depending on the case. Due to differences in satellite geometry, SRF, and sudden atmospheric changes, SBAF can vary even within the same spectral band. Therefore, by applying the SBAF calculated for each case using RadCalNet observational data, the uncertainty in cross-calibration can be minimized, leading to more accurate absolute radiometric calibration coefficients for CAS500-1/AEISS-C.
Table 8.
Spectral band adjustment factor (SBAF) used to compensate for differences in band spectral response functions (SRFs), satellite sensing times, and atmospheric/surface conditions between CAS500-1/AEISS-C and Sentinel-2/MSI at Boutou.
Wang et al. [42] simulated TOA radiance using MODTRAN5 by incorporating the geometry of both satellites to calculate SBAF, aiming to reduce the effects of BRDF caused by these differences. In this study, the same approach was applied, and SBAF was calculated as shown in Table 8. As mentioned earlier, SBAF varies depending on the band and individual cases.
To further mitigate geometric discrepancies between CAS500-1/AEISS-C and Sentinel-2/MSI, the BCF was calculated using the BRDF parameters from the MODIS MCD43A1 product and the geometry of each satellite for each case. As shown in Table 9, the BCF values were generally close to unity across most bands and dates, which reflects the relatively consistent geometry and directional reflectance behavior over the Baotou gravel target. These stable values indicate that the BRDF effects due to geometry differences between the two sensors were modest in many cases. However, in scenes where the sensor relative zenith angle exceeded 10°, noticeable inter-band variations were observed. Notably, the NIR band often deviated from the patterns observed in the visible bands. This behavior may be attributed to the larger differences in SRFs between CAS500-1/AEISS-C, Sentinel-2/MSI, and MODIS in the NIR range, as illustrated in Figure 1. Although BRDF effects were corrected using MCD43A1, mismatches in SRFs between sensors can still contribute to the residual uncertainty in the BRDF correction.
Table 9.
BRDF correction factor (BCF) used to compensate for differences in solar/viewing geometry between CAS500-1/AEISS-C and Sentinel-2/MSI at Boutou.
Similar to the reflectance-based vicarious calibration method, the absolute radiometric calibration coefficients for CAS500-1/AEISS-C were derived for each TDI mode (Table 10 and Table 11, Figure 9 and Figure 10). First, cross-calibration was performed for the four gravel targets at Baotou for each case. The R2 values for each case ranged from 0.97 to 1.00, showing similarly high values as in the previous reflectance-based vicarious calibration. The gain values were generally similar to those from the reflectance-based vicarious calibration, although a relatively larger difference was observed in the Green band. The R2 values for cross-calibration ranged from 0.90 to 0.98, which were higher than those obtained from the reflectance-based vicarious calibration. This strong linear relationship is visually confirmed in Figure 9 and Figure 10. Additionally, similar to the reflectance-based vicarious calibration, a clear variation in calibration coefficients according to the TDI mode was observed. This indicates that absolute radiometric calibration should be performed separately for each TDI mode of CAS500-1/AEISS-C, with the corresponding calibration coefficients provided accordingly.
Table 10.
Cross-calibration results (Gain, Offset, and R2) for each case, representing the linear relationship between the digital number (DN) observed by CAS500-1 and the Sentinel-2/MSI top-of-atmosphere (TOA) radiance, compensated for by using the spectral band adjustment factor (SBAF) and the BRDF correction factor (BCF), along with their associated total uncertainty (u*) (%).
Table 11.
Cross-calibration results (Gain, Offset, and R2) for each TDI mode, representing the linear relationship between the digital number (DN) observed by CAS500-1 and the top-of-atmosphere (TOA) radiance from Sentinel-2/MSI, compensated for by using the spectral band adjustment factor (SBAF) and the BRDF correction factor (BCF).
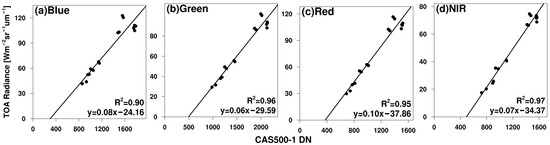
Figure 9.
Scatterplots of the cross-calibration method using all cases of CAS500-1/AEISS-C Mode 1. (a) Blue, (b) Green, (c) Red, and (d) NIR.
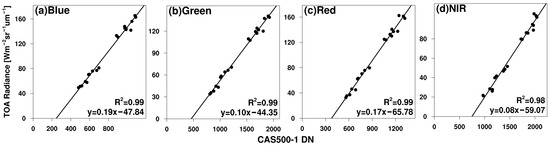
Figure 10.
Scatterplots of the cross-calibration method using all cases of CAS500-1/AEISS-C Mode 2. (a) Blue, (b) Green, (c) Red, and (d) NIR.
Although the Baotou site is located in an arid to semi-arid region approximately 50 km from the urban area and consists of about 300 km2 of flat terrain composed primarily of sand and bare ground, noticeable case-to-case differences in the calibration coefficients were still observed within the same TDI mode (Table 10). These variations are consistent with the behavior observed in the reflectance-based vicarious calibration results at Zuunmod, where differences in calibration coefficients were identified despite nearly identical atmospheric conditions due to the influence of thin cirrus. The Mode 1 cases on 13 October and 23 October show noticeably higher gain and offset values compared with other Mode 1 cases, even though no significant differences in AOD, WV, or O3 were observed between the cases. This suggests that thin cirrus, which is often difficult to detect in satellite imagery and is not fully captured by routine atmospheric observations, may have contributed to these elevated coefficient values. In particular, the higher offset observed on 13 October 2023 is consistent with the expected increase in path radiance under thin cirrus conditions.
In this study, the uncertainty in the cross-calibration method ranged from 5.88% to 6.51% (Table 12), which is higher than that of the reflectance-based vicarious calibration method. As shown in Table 12, this increased uncertainty is attributed to the uncertainties in the MODTRAN6 RTM [37] and Sentinel-2/MSI [28,29]. If the uncertainties from MODTRAN6 and Sentinel-2/MSI were assumed to be negligible, the uncertainty associated with AOD, WV, O3, and SR would range from 1.89% to 3.30%. This indicates that using RadCalNet observational data from automated measurement systems to calculate SBAF yields low uncertainties, with a maximum value of 3.30%. This is consistent with the results of Liu et al. [18], who derived SBAF using field-measured SR, AOD, WV, and O3. In their study, the uncertainties in SR, AOD, WV, and O3 were below 1.00%, similar to the low values found in this study: 0.01–0.41% for AOD, 0.00–0.51% for WV, and 0.01–0.34% for O3. However, SR exhibited higher uncertainties of 1.83–3.36%, in contrast to the maximum of 0.08% reported by Liu et al. [18]. This difference is attributed to the use of SR provided by RadCalNet in this study, unlike Liu et al. [18], who directly measured SR using a spectroradiometer.
Table 12.
Sources of uncertainty in cross-calibration with Sentinel-2/MSI. SR: Surface reflectance; AOD: Aerosol Optical Depth; WV: Water Vapor; O3: Total Ozone Column; RTM: MODTRAN6 radiative transfer model; S2: Sentinel-2/MSI.
4. Discussion
This study shows that the calibration coefficients derived from the reflectance-based vicarious calibration exhibit noticeable variations across different field campaigns. These variations primarily reflect differences in the atmospheric conditions at each site, including AOD, WV, and solar/viewing geometry, rather than sensor instability. In particular, the two Zuunmod field campaigns demonstrated that even when measured atmospheric parameters were nearly identical, the presence of thin cirrus, which may not be detectable in the satellite imagery, can influence the radiance–DN relationship. This resulted in differences in the derived calibration coefficients, emphasizing that subtle atmospheric conditions can affect vicarious calibration even in homogeneous and ideal surface environments. A similar pattern was observed in the cross-calibration with Sentinel-2/MSI. Although the Baotou gravel target is located in a flat arid to semi-arid region with highly uniform surface characteristics, case-to-case differences in calibration coefficients were still detected within the same TDI mode. The lack of significant differences in measured AOD, WV, or O3 between these cases suggests that thin cirrus or subvisible cloud layers may have contributed to these variations. Such clouds affect the diffuse and direct radiance components but are not captured by routine atmospheric measurements. These findings indicate that both calibration approaches are sensitive to subtle atmospheric conditions.
Despite these variations, the overall uncertainty associated with the reflectance-based vicarious calibration remained within 2.15 to 5.20 percent, demonstrating stable and reliable performance. The cross-calibration exhibited slightly higher uncertainties, ranging from 5.88 to 6.51 percent, due to additional uncertainties arising from the RTM and the Sentinel-2/MSI reference sensor. These uncertainty levels are comparable to those reported in previous studies and fall within the expected range when both vicarious and cross-calibration methods are applied. Previous studies that conducted both reflectance-based vicarious and cross- calibration have reported comparable discrepancies between the two methods, with gain differences ranging from 2.43 to 6.67% (Tang et al. [19]), 19.69 to 31.83% (Liu et al. [18]), and 0.04 to 21.38% (Ahn et al. [14]). The gain difference observed in this study fall within these ranges, indicating that the results are consistent with previous findings and confirm the reliability of the calibration coefficients. Overall, this study provides the initial absolute radiometric calibration results for CAS500-1/AEISS-C, demonstrating the feasibility of both reflectance-based vicarious calibration and cross-calibration approaches.
RadCalNet provides high-accuracy observational data for SR and atmospheric parameters through automated measurement systems. In this study, since planning and conducting field campaigns for cross-calibration posed significant challenges, RadCalNet data were used to perform cross-calibration for CAS500-1/AEISS-C. Using Sentinel-2/MSI as the reference satellite, cross-calibration achieved R2 values ranging from 0.90 to 0.98, enabling the derivation of highly accurate absolute radiometric calibration coefficients. However, since the cross-calibration in this study was performed over a single homogeneous land cover, the high R2 may partly reflect the site’s radiometric uniformity rather than surface variability. This highlights the importance of evaluating cross-calibration performance over different land covers to further assess the robustness and general applicability of the CAS500-1/AEISS-C calibration framework. This relatively higher uncertainty, compared to that of the reflectance-based vicarious calibration, is attributed to the use of RTM and the characteristics of the reference satellite. This suggests that if the uncertainties in the RTM and the reference satellite are sufficiently minimized, cross-calibration using RadCalNet’s automated observation data can achieve high accuracy. For cross-calibration, this study selected the Baotou gravel target as the region of interest and explicitly accounted for BRDF effects through BCF correction derived from MODIS MCD43A1 data.
These results also have important implications for future missions in the CAS500 series. Once CAS500-2 is launched, its early-phase absolute radiometric calibration can benefit directly from the calibration coefficients established in this study. Previous work by Mann et al. demonstrated that simultaneous observations from two satellites viewing a target at the same geometry can minimize uncertainties associated with BRDF effects. Although this study focused on CAS500-1/AEISS-C, the high radiometric accuracy established here provides a valuable reference for the upcoming CAS500-2 mission. Once CAS500-2 is launched, coordinated observations between the two satellites, including early-phase opportunities similar to the “Underfly” strategy demonstrated by Mann et al. [52], can be planned to support an accurate on-orbit absolute radiometric calibration of CAS500-2.
5. Conclusions
In this study, absolute radiometric calibration coefficients for CAS500-1/AEISS-C were derived using both reflectance-based vicarious calibration through field campaigns and cross-calibration with Sentinel-2/MSI. The calibration coefficients obtained from the reflectance-based vicarious calibration exhibited strong linearity, with R2 ranging from 0.97 to 1.00 across all bands and cases. Nonetheless, noticeable variations in Gain and Offset were observed between the field campaigns, primarily due to differences in atmospheric and geometric conditions at the time of acquisition. In particular, the two field campaigns conducted at Zuunmod demonstrated that even when atmospheric parameters such as AOD, water vapor, and ozone were nearly identical, the presence of thin cirrus, undetectable in satellite imagery, could alter the diffuse-to-direct irradiance ratio and lead to distinguishable differences in the derived calibration coefficients. Similar case-dependent variations were also identified in the cross-calibration results at Baotou, indicating that thin cirrus can influence both calibration approaches despite the homogeneous surface characteristics of the gravel targets. Field-measured SR, AOD, O3, and WV were used as input parameters in MODTRAN6 to calculate the calibration coefficients, while RadCalNet observations and BRDF correction based on MODIS MCD43A1 parameters improved the geometric consistency of the cross-calibration. Sensitivity analysis further showed that accurate observations of AOD and SR are critical in reflectance-based vicarious calibration, whereas the accuracy of cross-calibration is influenced more by the reference satellite, radiative transfer modeling, and the correction of directional reflectance effects through BRDF parameters. Considering the potential degradation of sensor performance over time [1,53], continuous calibration will be required to maintain the radiometric accuracy of CAS500-1/AEISS-C.
This study performed the absolute radiometric calibration of CAS500-1/AEISS-C using well-established, classical approaches rather than novel or experimental techniques. Beyond presenting calibration results, the findings provide several important insights, including the significant dependence of calibration coefficients on TDI mode, differences in uncertainty levels between field campaigns, and the demonstrated applicability of RadCalNet data for optical satellite calibration.
Furthermore, if the calibration results presented here are utilized for the joint operation of CAS500-1 and its twin satellite CAS500-2, scheduled for launch in 2025, they could support the establishment of a high spatial/temporal resolution Earth observation system comparable to those of Landsat-8/9 and Sentinel-2A/B. If both satellites achieve consistent radiometric performance, their 180-degree phase difference, maximum roll angle of 30 degrees, and sub-meter spatial resolution (0.5 m for PAN and 2 m for MS) will enable advanced applications requiring multi-angle and multi-temporal observations. Potential fields include agriculture, forestry, land development, land-cover mapping, and retrieval of surface physical parameters. These combined capabilities are expected to contribute significantly to the development of diverse industrial applications using high-precision Earth observation data from CAS500-1/AEISS-C.
Author Contributions
Conceptualization, K.-B.C., D.-H.C. and Y.G.L.; Methodology, K.-B.C., K.-W.J. and Y.G.L.; Software, K.-B.C.; Validation, K.-B.C.; Formal analysis, K.-B.C., K.-W.J. and Y.G.L.; Investigation, D.-H.C., J.-H.C., Y.-H.J., K.-N.K., G.-B.K., H.-Y.S., J.-Y.L. and E.-Y.K.; Resources, K.-W.J.; Data curation, K.-B.C., K.-W.J., J.-H.C., Y.-H.J., K.-N.K., G.-B.K., H.-Y.S., J.-Y.L. and E.-Y.K.; Writing—original draft preparation, K.-B.C. and Y.G.L.; Writing—review and editing, Y.G.L.; Visualization, K.-B.C.; Supervision, Y.G.L.; Project administration, K.-W.J. and D.-H.C.; Funding acquisition, Y.G.L. All authors have read and agreed to the published version of the manuscript.
Funding
This study was funded by the “Development of Application Support System for Satellite Information Big Data (RS-2022-00165154)” of the Korea Aerospace Administration and by the Korea Meteorological Institute (Grant No. RS-2025-02221093).
Data Availability Statement
Data can be provided upon reasonable request to the corresponding author.
Conflicts of Interest
The authors declare no conflicts of interest.
References
- Thome, K. Absolute radiometric calibration of Landsat 7 ETM+ using the reflectance-based method. Remote Sens. Environ. 2001, 78, 27–38. [Google Scholar] [CrossRef]
- Yeom, J.-M.; Ko, J.; Hwang, J.; Lee, C.-S.; Choi, C.-U.; Jeong, S. Updating Absolute Radiometric Characteristics for KOMPSAT-3 and KOMPSAT-3A Multispectral Imaging Sensors Using Well-Characterized Pseudo-Invariant Tarps and Microtops II. Remote Sens. 2018, 10, 697. [Google Scholar] [CrossRef]
- Thomas, V.L. Generation and Physical Characteristics of the Landsat 1 and 2 MSS Computer Compatible Tapes; NASA Goddard Speace Flight Center: Greenbelt, MD, USA, 1975. [Google Scholar]
- Mishra, N.; Helder, D.; Barsi, J.; Markham, B. Continuous Calibration Improvement: Landsat 5 through Landsat 8. Remote Sens. Environ. 2016, 185, 7–15. [Google Scholar] [CrossRef] [PubMed]
- Tilton, J.C.; Markham, B.L.; Alford, W.L. Landsat-4 and Landsat-5 MSS Coherent Noise: Characterization and Removal. Photogramm. Eng. Remote Sens. 1985, 51, 1263–1279. [Google Scholar]
- Metzler, M.D.; Malila, W.A. Characterization and comparison of Landsat-4 and Landsat-5 Thematic Mapper data. Photogramm. Eng. Remote Sens. 1985, 51, 1315–1330. [Google Scholar]
- Singh, A. Thematic Mapper radiometric correction research and development results and performance. Photogramm. Eng. Remote Sens. 1985, 51, 1379–1383. [Google Scholar]
- Slater, P.; Biggar, S.; Holm, R.; Jackson, R.; Mao, Y.; Moran, M.; Palmer, J.; Yuan, B. Reflectance-and radiance-based methods for the in-flight absolute calibration of multispectral sensors. Remote Sens. Environ. 1987, 22, 11–37. [Google Scholar] [CrossRef]
- Teillet, P.; Slater, P.; Ding, Y.; Santer, R.; Jackson, R.; Moran, M. Three methods for the absolute calibration of the NOAA AVHRR sensors in-flight. Remote Sens. Environ. 1990, 31, 105–120. [Google Scholar] [CrossRef]
- Thome, K.; Crowther, B.; Biggar, S. Reflectance-and irradiance-based calibration of Landsat-5 Thematic Mapper. Can. J. Remote Sens. 1997, 23, 309–317. [Google Scholar] [CrossRef]
- Thome, K.; Markham, B.; Barker, J.; Slater, P.; Biggar, S. Radiometric calibration of Landsat. Photogramm. Eng. Remote Sens. 1997, 63, 853–858. [Google Scholar]
- Czapla-Myers, J.; McCorkel, J.; Anderson, N.; Thome, K.; Biggar, S.; Helder, D.; Aaron, D.; Leigh, L.; Mishra, N. The Ground-Based Absolute Radiometric Calibration of Landsat 8 OLI. Remote Sens. 2015, 7, 600–626. [Google Scholar] [CrossRef]
- Ahn, H.Y.; Shin, D.Y.; Kim, J.S.; Seo, D.C.; Choi, C.U. Absolute Radiometric Calibration of KOMPSAT-3A. ISPRS-Int. Arch. Photogramm. Remote Sens. Spat. Inf. Sci. 2016, XLI-B1, 271–274. [Google Scholar] [CrossRef]
- Ahn, H.; Shin, D.; Lee, S.; Choi, C. Absolute Radiometric Calibration for KOMPSAT-3 AEISS and Cross Calibration Using Landsat-8 OLI. J. Korean Soc. Surv. Geod. Photogramm. Cartogr. 2017, 35, 291–302. [Google Scholar]
- Jin, C.; Ahn, H.; Seo, D.; Choi, C. Radiometric Calibration and Uncertainty Analysis of KOMPSAT-3A Using the Reflectance-Based Method. Sensors 2020, 20, 2564. [Google Scholar] [CrossRef]
- Chen, Z.; Zhang, B.; Zhang, H.; Zhang, W. Vicarious Calibration of Beijing-1 Multispectral Imagers. Remote Sens. 2014, 6, 1432–1450. [Google Scholar] [CrossRef]
- Li, J.; Chen, X.; Tian, L.; Feng, L. Tracking radiometric responsivity of optical sensors without on-board calibration systems-case of the Chinese HJ-1A/1B CCD sensors. Opt. Express 2015, 23, 1829–1847. [Google Scholar] [CrossRef]
- Liu, Y.K.; Ma, L.L.; Wang, N.; Qian, Y.G.; Zhao, Y.G.; Qiu, S.; Gao, C.X.; Long, X.X.; Li, C.R. On-orbit radiometric calibration of the optical sensors on-board SuperView-1 satellite using three independent methods. Opt. Express 2020, 28, 11085–11105. [Google Scholar] [CrossRef]
- Tang, H.; Xie, J.; Tang, X.; Chen, W.; Li, Q. On-Orbit Absolute Radiometric Calibration and Validation of ZY3-02 Satellite Multispectral Sensor. Sensors 2022, 22, 2066. [Google Scholar] [CrossRef] [PubMed]
- Tang, H.; Xie, J.; Chen, W.; Zhang, H.; Wang, H. Absolute Radiometric Calibration of ZY3-02 Satellite Multispectral Imager Based on Irradiance-Based Method. Remote Sens. 2023, 15, 448. [Google Scholar] [CrossRef]
- Li, S.; Ganguly, S.; Dungan, J.L.; Wang, W.; Nemani, R.R. Sentinel-2 MSI Radiometric Characterization and Cross-Calibration with Landsat-8 OLI. Adv. Remote Sens. 2017, 06, 147–159. [Google Scholar] [CrossRef]
- Pampanoni, V.; Fascetti, F.; Cenci, L.; Laneve, G.; Santella, C.; Boccia, V. Analysing the Relationship between Spatial Resolution, Sharpness and Signal-to-Noise Ratio of Very High Resolution Satellite Imagery Using an Automatic Edge Method. Remote Sens. 2024, 16, 1041. [Google Scholar] [CrossRef]
- Cantrell, S.J.; Christopherson, J.; Anderson, C.; Stensaas, G.L.; Chandra, S.N.R.; Kim, M.; Park, S. System Characterization Report on the WorldView-3 Imager; 2331-1258; US Geological Survey: Reston, VA, USA, 2021.
- Lepage, G.; Bogaerts, J.; Meynants, G. Time-Delay-Integration Architectures in CMOS Image Sensors. IEEE Trans. Electron. Devices 2009, 56, 2524–2533. [Google Scholar] [CrossRef]
- Heo, H.-P.; Ra, S.-W. Reducing Motion Blur by Adjusting Integration Time for Scanning Camera with TDI CMOS. Int. J. Signal Process. Syst. 2014, 3, 172–176. [Google Scholar] [CrossRef]
- Drusch, M.; Del Bello, U.; Carlier, S.; Colin, O.; Fernandez, V.; Gascon, F.; Hoersch, B.; Isola, C.; Laberinti, P.; Martimort, P.; et al. Sentinel-2: ESA’s Optical High-Resolution Mission for GMES Operational Services. Remote Sens. Environ. 2012, 120, 25–36. [Google Scholar] [CrossRef]
- Bouzinac, C.; Lafrance, B.; Pessiot, L.; Touli, D.; Jung, M.; Massera, S.; Neveu-VanMalle, M.; Espesset, A.; Francesconi, B.; Clerc, S. Sentinel-2 level-1 calibration and validation status from the mission performance centre. In Proceedings of the IGARSS 2018-2018 IEEE International Geoscience and Remote Sensing Symposium, Valencia, Spain, 22–27 July 2018; pp. 4347–4350. [Google Scholar]
- Gascon, F.; Bouzinac, C.; Thépaut, O.; Jung, M.; Francesconi, B.; Louis, J.; Lonjou, V.; Lafrance, B.; Massera, S.; Gaudel-Vacaresse, A.; et al. Copernicus Sentinel-2A Calibration and Products Validation Status. Remote Sens. 2017, 9, 584. [Google Scholar] [CrossRef]
- Revel, C.; Lonjou, V.; Marcq, S.; Desjardins, C.; Fougnie, B.; Coppolani-Delle Luche, C.; Guilleminot, N.; Lacamp, A.-S.; Lourme, E.; Miquel, C.; et al. Sentinel-2A and 2B absolute calibration monitoring. Eur. J. Remote Sens. 2019, 52, 122–137. [Google Scholar] [CrossRef]
- Teillet, P.; Fedosejevs, G.; Gauthier, R.; O’neill, N.; Thome, K.J.; Biggar, S.F.; Ripley, H.; Meygret, A. A generalized approach to the vicarious calibration of multiple Earth observation sensors using hyperspectral data. Remote Sens. Environ. 2001, 77, 304–327. [Google Scholar] [CrossRef]
- Biggar, S.F.; Thome, K.J.; Wisniewski, W. Vicarious radiometric calibration of eo-1 sensors by reference to high-reflectance ground targets. IEEE Trans. Geosci. Remote Sens. 2003, 41, 1174–1179. [Google Scholar] [CrossRef]
- Devries, C.; Danaher, T.; Denham, R.; Scarth, P.; Phinn, S. An operational radiometric calibration procedure for the Landsat sensors based on pseudo-invariant target sites. Remote Sens. Environ. 2007, 107, 414–429. [Google Scholar] [CrossRef]
- Thome, K.J.; Arai, K.; Tsuchida, S.; Biggar, S.F. Vicarious Calibration of ASTER via the Reflectance-Based Approach. IEEE Trans. Geosci. Remote Sens. 2008, 46, 3285–3295. [Google Scholar] [CrossRef]
- Liu, C.C.; Kamei, A.; Hsu, K.H.; Tsuchida, S.; Huang, H.M.; Kato, S.; Nakamura, R.; Wu, A.M. Vicarious Calibration of the Formosat-2 Remote Sensing Instrument. IEEE Trans. Geosci. Remote Sens. 2010, 48, 2162–2169. [Google Scholar] [CrossRef]
- Sridhar, V.; Mehta, K.B.; Prajapati, R.; Babu, K.; Suthar, N.; Shukla, A. Absolute vicarious calibration of OCM2 and AWiFS sensors using a reflectance-based method over land sites in the Rann of Kutch, Gujarat. Int. J. Remote Sens. 2013, 34, 5690–5708. [Google Scholar] [CrossRef]
- Chen, W.; Yan, L.; Li, Z.; Jing, X.; Duan, Y.; Xiong, X. In-flight absolute calibration of an airborne wide-view multispectral imager using a reflectance-based method and its validation. Int. J. Remote Sens. 2012, 34, 1995–2005. [Google Scholar] [CrossRef]
- Berk, A.; Hawes, F. Validation of MODTRAN®6 and its line-by-line algorithm. J. Quant. Spectrosc. Radiat. Transf. 2017, 203, 542–556. [Google Scholar] [CrossRef]
- Fontenla, J.; Stancil, P.; Landi, E. Solar spectral irradiance, solar activity, and the near-ultra-violet. Astrophys. J. 2015, 809, 157. [Google Scholar] [CrossRef]
- Bouvet, M.; Thome, K.; Berthelot, B.; Bialek, A.; Czapla-Myers, J.; Fox, N.; Goryl, P.; Henry, P.; Ma, L.; Marcq, S.; et al. RadCalNet: A Radiometric Calibration Network for Earth Observing Imagers Operating in the Visible to Shortwave Infrared Spectral Range. Remote Sens. 2019, 11, 2401. [Google Scholar] [CrossRef]
- Ma, L.; Zhao, Y.; Woolliams, E.R.; Dai, C.; Wang, N.; Liu, Y.; Li, L.; Wang, X.; Gao, C.; Li, C.; et al. Uncertainty Analysis for RadCalNet Instrumented Test Sites Using the Baotou Sites BTCN and BSCN as Examples. Remote Sens. 2020, 12, 1696. [Google Scholar] [CrossRef]
- Teillet, P.M.; Fedosejevs, G.; Thome, K.J.; Barker, J.L. Impacts of spectral band difference effects on radiometric cross-calibration between satellite sensors in the solar-reflective spectral domain. Remote Sens. Environ. 2007, 110, 393–409. [Google Scholar] [CrossRef]
- Wang, Y.; Liu, Y.; Zhao, W.; Zeng, J.; Wang, H.; Wang, R.; Xu, Z.; Han, Q. Time-Series Cross-Radiometric Calibration and Validation of GF-6/WFV Using Multi-Site. Remote Sens. 2024, 16, 1287. [Google Scholar] [CrossRef]
- Zhou, X.; Chen, Y.; Xie, Y.; Han, J.; Shao, W. Radiometric Cross-Calibration of HJ-2A/CCD3 Using the Random Forest Algorithm and a Spectral Interpolation Convolution Method with Sentinel-2/MSI. Remote Sens. 2024, 16, 4337. [Google Scholar] [CrossRef]
- Han, J.; Tao, Z.; Xie, Y.; Li, H.; Guan, X.; Yi, H.; Shi, T.; Wang, G. Radiometric cross-calibration of GF-6/WFV sensor using MODIS images with different BRDF models. IEEE Trans. Geosci. Remote Sens. 2022, 60, 5409311. [Google Scholar] [CrossRef]
- Liu, L.; Shi, T.; Gao, H.; Zhang, X.; Han, Q.; Hu, X. Long-term cross calibration of HJ-1A CCD1 and Terra MODIS reflective solar bands. Sci. Rep. 2021, 11, 7386. [Google Scholar] [CrossRef]
- Kurucz, R. The solar irradiance by computation. In Proceedings of the 17th Annual Review Conference on Atmospheric Transmission Models, Bedford, MA, USA, 8–9 June 1994; pp. 333–334. [Google Scholar]
- Kurucz, R.L. High resolution irradiance spectrum from 300 to 1000 nm. arXiv 2006, arXiv:astro-ph/0605029. [Google Scholar] [CrossRef]
- Thuillier, G.; Hersé, M.; Simon, P.C.; Labs, D.; Mandel, H.; Gillotay, D. Observation of the UV solar spectral irradiance between 200 and 350 nm during the Atlas I mission by the SOLSPEC spectrometer. Sol. Phys. 1997, 171, 283–302. [Google Scholar] [CrossRef]
- Thuillier, G.; Hersé, M.; Simon, P.C.; Labs, D.; Mandel, H.; Gillotay, D.; Foujols, T. The visible solar spectral irradiance from 350 to 850 nm as measured by the SOLSPEC spectrometer during the ATLAS I mission. Sol. Phys. 1998, 177, 41–61. [Google Scholar] [CrossRef]
- Cebula, R.; Thuillier, G.; VanHoosier, M.E.; Hilsenrath, E.; Hersé, M.; Brueckner, G.; Simon, P. Observations of the solar irradiance in the 200–350 nm interval during the ATLAS-1 Mission: A comparison among three sets of measurements-SSBUV, SOLSPEC, and SUSIM. Geophys. Res. Lett. 1996, 23, 2289–2292. [Google Scholar] [CrossRef]
- Chance, K.V.; Spurr, R.J. Ring effect studies: Rayleigh scattering, including molecular parameters for rotational Raman scattering, and the Fraunhofer spectrum. Appl. Opt. 1997, 36, 5224–5230. [Google Scholar] [CrossRef]
- Mann, J.; Maddox, E.; Shrestha, M.; Irwin, J.; Czapla-Myers, J.; Gerace, A.; Rehman, E.; Raqueno, N.; Coburn, C.; Byrne, G. Landsat 8 and 9 Underfly International Surface Reflectance Validation Collaboration. Remote Sens. 2024, 16, 1492. [Google Scholar] [CrossRef]
- Rao, C.N.; Chen, J.; Sullivan, J.; Zhang, N. Post-launch calibration of meteorological satellite sensors. Adv. Space Res. 1999, 23, 1357–1365. [Google Scholar] [CrossRef]
Disclaimer/Publisher’s Note: The statements, opinions and data contained in all publications are solely those of the individual author(s) and contributor(s) and not of MDPI and/or the editor(s). MDPI and/or the editor(s) disclaim responsibility for any injury to people or property resulting from any ideas, methods, instructions or products referred to in the content. |
© 2026 by the authors. Licensee MDPI, Basel, Switzerland. This article is an open access article distributed under the terms and conditions of the Creative Commons Attribution (CC BY) license.