Highlights
What are the main findings?
- A hybrid D-LM algorithm is proposed that abandons traditional discrete spectral library searching, instead employing a “global search–local optimization” architecture to dynamically generate reference spectra based on real-time environmental parameters (temperature, humidity, and distance).
- Validation in high-humidity field environments demonstrates that the method outperforms the LASSO algorithm, reducing spectral fitting residuals by approximately 57% and improving the methane feature extraction correlation coefficient from 0.75 to 0.87.
What are the implications of the main findings?
- By establishing a continuous physical optimization space, the method fundamentally resolves the “library mismatch” issue inherent in static matching, enabling precise descriptions of spectral variations caused by atmospheric parameter changes.
- The approach effectively overcomes strong water vapor interference at the edge of the atmospheric window, extending the applicability of passive remote sensing to complex, high-humidity environments where signal distortion typically compromises accuracy.
Abstract
Fourier transform infrared (FTIR) spectroscopy-based gas remote sensing has been widely applied for long-range atmospheric composition analysis. However, when deployed for longwave infrared methane detection, spectral features of methane are significantly interfered by water vapor variations at the edge of atmospheric window, which compromises detection performance. To address the spectral fitting degradation caused by relative changes between methane and water vapor signals, this study incorporates temperature, relative humidity, and sensing distance into the cost function, establishing a continuous optimization space with concentration path lengths (CLs) as variables, which are the product of the concentration and path length. A hybrid differential evolution and Levenberg–Marquardt (D-LM) algorithm is developed to enhance parameter estimation accuracy. Combined with a three-layer atmospheric model for real-time reference spectrum generation, the algorithm identifies the optimal spectral combination that provides the best match to the measured data. Algorithm performance is validated through two experimental configurations: Firstly, adaptive detection using synthetic spectra covering various humidity–methane concentration combinations is conducted; simulation results demonstrate that the proposed method significantly reduces the mean squared error (MSE) of fitting residuals by 95.8% compared to the traditional LASSO method, effectively enhancing methane spectral feature extraction under high-water-vapor conditions. Then, a continuous monitoring of controlled methane releases over a 500 m open path under high-outdoor-humidity conditions is carried out to validate outdoor performance of the proposed algorithm; field measurement analysis further confirms the method’s robustness, achieving a reduction in fitting residuals of approximately 57% and improving spectral structure fitting. The proposed approach provides a reliable technical pathway for adaptive gas cloud detection under complex atmospheric conditions.
1. Introduction
With the growing global demand for greenhouse gas emission monitoring, accurate detection and quantitative analyses have become increasingly important for key emission sources, including energy production, agricultural activities, and waste management. Among various greenhouse gases, methane has attracted particular attention due to its global warming potential, which is approximately 28 times that of carbon dioxide over a 100-year time frame [1].
Current field methane remote sensing technologies primarily encompass infrared remote sensing methods [2] and laser spectroscopy approaches [3], with typical applications including Fourier transform infrared spectroscopy (FTIR) [4], shortwave infrared satellite monitoring [5], and lidar systems [3]. Laser-based lidar encounters challenges in field environments due to sparse spatial sampling resulting from methane dispersion and dilution, affecting detection precision. Shortwave infrared satellite monitoring relies on solar-reflected radiation, leading to degraded observational capability during nighttime and low-light conditions, thus limiting continuous monitoring effectiveness.
In contrast, FTIR demonstrates distinctive advantages. Leveraging the high-transmittance characteristics of the longwave infrared atmospheric window [6], FTIR enables direct passive remote sensing of gases with absorption features located within this spectral region, with performance independent of observation time or spatial sampling distribution. However, when deployed for longwave infrared methane detection, the spectral features of methane are significantly interfered by water vapor variations, particularly at the edge of the atmospheric window. As illustrated in Figure 1, the presence of high humidity drastically alters the spectral topology. Under low-humidity conditions, methane absorption peaks are sharp and well-defined. In contrast, under high-humidity conditions, the strong water vapor continuum and absorption lines induce a nonlinear masking effect. Specifically, in the primary feature range of 1300–1310 cm−1, the characteristic methane peaks are heavily obscured and distorted. Consequently, this presents significant challenges for methane feature extraction.
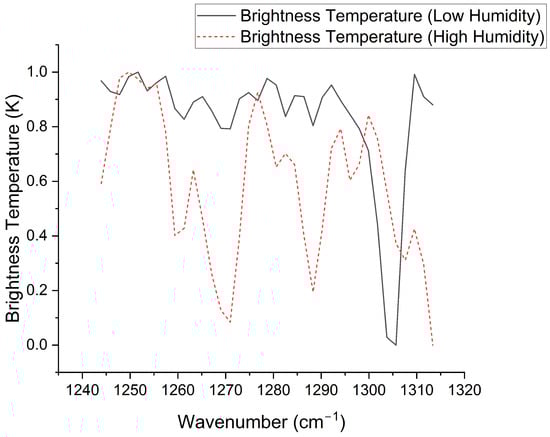
Figure 1.
Comparison of normalized simulated brightness temperature spectra under different humidity conditions with identical methane concentration. The black solid line represents the spectrum under low humidity (), exhibiting clear absorption features. The red dash–dot line represents the spectrum under high humidity (). Note that in the 1300–1310 cm−1 wavenumber range, the characteristic absorption peaks of methane are significantly obscured and distorted by the strong interference of water vapor, rendering traditional feature extraction difficult.
Addressing the spectral overlap between methane and water vapor at window edges, early research primarily relied on radiative transfer theory, separating target signals through multi-component joint retrieval [7] or differential background spectrum methods [8]. However, due to environmental complexity, these approaches depend on accurate a priori background information. The difficulty in obtaining pure background spectra in field measurements limits their practical application effectiveness.
To reduce dependence on prior information, different technical approaches have emerged. Brightness temperature-based detection methods [9,10] assume that gas absorption features linearly superimpose on the background baseline, achieving detection through background spectrum reconstruction. Machine learning methods [11,12] utilize feature learning capabilities to automatically identify spectral discriminative information. However, brightness temperature methods assume thin gas clouds, experiencing performance degradation under thick cloud conditions. Neural network approaches are limited by training data, showing restricted generalization capability, and their inherent black-box nature results in physically non-interpretable decision processes.
With the development of Least Absolute Shrinkage and Selection Operator (LASSO) in data mining, Li et al. introduced it to spectral data processing [13]. This method automatically selects optimal combinations from pre-computed reference spectral libraries, maintaining linear model effectiveness under thick cloud conditions. Despite advances with LASSO, it essentially remains a static selection mode based on discrete spectral libraries, requiring high reference spectrum quality without fully considering the real-time influences of atmospheric parameters, such as temperature and humidity. Detection accuracy decreases when preset spectral libraries deviate from actual environmental conditions, as illustrated in Figure 2.
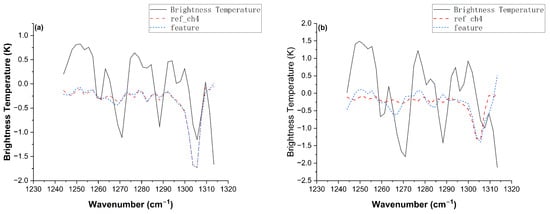
Figure 2.
Comparison of methane feature extraction performance using the LASSO method under different humidity conditions with a fixed methane concentration. (a) Low-humidity scenario (RH = 5%). (b) High-humidity scenario (RH = 70%). The black solid line represents the simulated brightness temperature spectrum, the red dashed line indicates the reference spectrum selected by the LASSO algorithm, and the blue dashed line denotes the extracted methane feature. The detection accuracy, quantified by the correlation coefficient () calculated according to the method described in [13], significantly degrades from 0.98 in the low-humidity case to 0.80 in the high-humidity case due to the spectral distortion caused by water vapor interference.
To overcome the intrinsic limitations of discrete search mechanisms utilized in previous studies, this study establishes a continuous parameter space optimization framework that integrates real-time environmental measurements. Unlike static library matching, this approach incorporates temperature, humidity, and sensing distance directly into the forward modeling process, thereby eliminating dependence on pre-computed spectral datasets. Within this framework, a hybrid optimization strategy is adopted: The differential evolution (DE) algorithm is selected as the global search engine due to its robust capability to navigate complex, multi-modal cost surfaces and its rapid convergence speed [14,15,16]. To further resolve the issue of limited precision near the optimal solution, the Levenberg–Marquardt (LM) algorithm is introduced for local fine-tuning [17,18,19]. By synergizing the global exploration of DE with the local gradient exploitation of LM, this hybrid strategy (referred to as the D-LM method) ensures both the reliability of the global solution and the precision of parameter estimation, offering a distinct advantage over traditional discrete methods in handling the non-linear coupling of water vapor interference.
Based on the aforementioned “global search-local optimization” framework, this research develops the D-LM adaptive detection algorithm. By coupling the global exploration advantages of DE with the local fine-tuning capabilities of LM, the dynamic collaborative retrieval of methane concentrations and background radiation is achieved. Research demonstrates that compared to LASSO, this algorithm exhibits smaller fitting residuals and stronger adaptive capability under window-edge and complex high-water-vapor-interference transmission conditions.
2. Theory
2.1. Brightness Temperature Remote Sensing and Synthetic Reference Spectrum Method
Brightness temperature remote sensing serves as a critical technique for detecting pollution gas clouds. Based on radiative transfer theory, this technique abstracts the complex atmosphere-target-background system into a three-layer model (as illustrated in the schematic diagram in Figure 1 of [13]). The total radiance received by the spectrometer results from background radiation after absorption, scattering, and emission through each layer, which is converted to the equivalent brightness temperature according to Planck’s radiation law.
It is important to note that this study focuses specifically on near-surface natural gas leakage monitoring under ambient atmospheric conditions. Consequently, atmospheric pressure is assumed to be constant at approximately 1 atm. Under these conditions, effects such as pressure-induced line shifting and variations in pressure broadening are negligible compared to the spectral deformation caused by water vapor interference.
Let represent the common temperature of the pollution gas cloud layer and atmosphere, let represent the background temperature in the field of view, and let represent the temperature difference between the environment and background. denotes the measured brightness temperature spectrum, which is transformed from radiance using the inverse Planck law [13]. Consequently, represents the brightness temperature spectral feature of the target pollution cloud. According to radiative transfer theory, the spectral feature is proportional to cloud emissivity. By adopting the Beer–Lambert law to rigorously describe transmittance, the spectral model is established as follows:
The pollution gas cloud transmittance can be expressed as follows:
where represents the absorption cross-section, and represents the concentration path length. With known absorption coefficient for the pollution gas, the target gas brightness temperature spectral feature is obtained by subtracting the field-of-view background and atmospheric interference from the measured brightness temperature spectra. Combined with the measured brightness-temperature-spectrum temperature difference , values can be estimated according to Equation (1).
However, brightness temperature theory relies on an assumption: All gaseous components in the optical path are thin plumes. This assumption is unreasonable in many practical application scenarios. Therefore, a scaling coefficient is introduced to extend the linear model to thick cloud scenarios by proportional scaling:
Based on the improved brightness temperature remote sensing theory, the LASSO adaptive detection algorithm utilizes MODTRAN 4.0 software to generate a set of reference spectra at typical concentrations, representing spectral groups within similar regions using single spectra:
Based on this modified theory, the LASSO method constructs a reference spectral library containing different values, selecting optimal reference spectral combinations through variable selection mechanisms to achieve the precise fitting of measured spectra.
However, the LASSO method exhibits inherent limitations in methane detection. The core assumption of this method is that the pre-constructed reference spectral library can adequately cover the variation range of target gases and background components in actual environments, essentially belonging to discrete, static feature selection models. Under high-humidity conditions, methane absorption peaks are located at window edges and susceptible to water vapor spectral interference, while the discrete spectral library of LASSO struggles to precisely describe the continuous effects of atmospheric parameters such as humidity, temperature, and pressure on spectral characteristics. When measured environmental parameters deviate from the calculation conditions of preset spectral libraries, mismatch between reference spectra and actual spectra leads to decreased detection accuracy.
2.2. Limitations of Discrete Search for Synthetic Reference Spectra
To reveal the limitations of LASSO’s discrete search mechanism, simulation experiments were designed to observe methane spectral response characteristics under high-humidity conditions. Based on the three-layer model with standard environmental parameters (atmospheric temperature of 25 °C, cloud temperature of 25 °C, background temperature of 30 °C, and sensing distance of 200 m), simulated brightness temperature spectra were generated for 30% methane transmittance and 70% relative humidity. Subsequently, following Equation (11) in [13], the simulated data were fitted and backgrounds were reconstructed, with methane features extracted through differencing simulated spectra and backgrounds. Fitting precision was evaluated using the mean squared error (MSE) of the fitting residuals, which quantifies the average squared deviation between the brightness temperature spectrum and the fitted spectrum. Meanwhile, feature extraction effectiveness was measured using Pearson correlation coefficients between the standard methane reference spectra and the extracted methane feature spectra.
The constructed LASSO reference spectral library contained 30 groups of methane spectra with different values and corresponding water vapor spectra. To avoid extreme cases, both methane transmittance and relative water vapor humidity were distributed logarithmically within the 10–90% range. It is important to emphasize that while this library utilizes the rigorous Beer–Lambert law (Equation (2), ) rather than the simplified ‘thin-plume’ approximation to account for thick cloud conditions, a fundamental structural limitation persists.
The limitation stems from the mismatch between the continuous physical variation and the discrete static dictionary. In the actual atmospheric environment, the transmittance spectrum varies continuously and non-linearly with concentration path length () and humidity. LASSO, however, relies on a linear combination of fixed reference spectra from a pre-computed discrete grid. Even with a high-density library (e.g., 30 × 30), using a static linear basis to approximate the continuous non-linear evolution of the exponential function inevitably introduces discretization errors. This ’grid mismatch’ prevents LASSO from perfectly matching the measured spectrum when the true environmental parameters lie between the pre-set grid points, inevitably resulting in systematic residuals.
The simulation’s experimental results in Figure 3 and Figure 4 demonstrate that the LASSO algorithm exhibits deficiencies under high-humidity conditions: Within the 1300–1310 cm−1 wavenumber interval, portions of methane absorption features obscured by water vapor are incorrectly identified as background components, leading to effective signal attenuation and decreased feature extraction precision. It is important to clarify that this signal attenuation is unrelated to the dynamic range limitations of the FTIR sensor. Instead, the fundamental cause of this phenomenon lies in LASSO’s static selection strategy based on discrete spectral libraries being unable to adapt to complex and variable atmospheric environments. Algorithm performance degrades when measurement conditions deviate from the calculation assumptions of preset reference spectra.
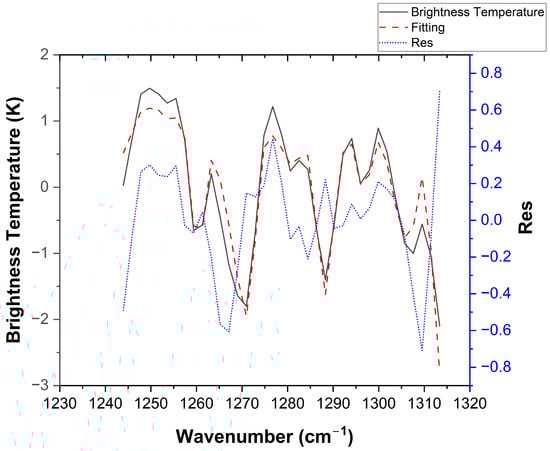
Figure 3.
Spectral fitting results of the proposed method. The left vertical axis displays the brightness temperature, corresponding to the black solid line (simulated measurement spectrum) and the red dashed line (fitted spectrum). The right vertical axis indicates the fitting residual (blue dashed line, labeled as Res), which is calculated as the difference between the simulated and fitted spectra (i.e., ). The use of a dual-axis scale allows for a clear visualization of the low-magnitude residuals against the high-magnitude spectral baseline.
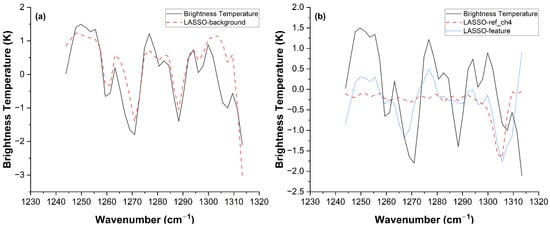
Figure 4.
Feature extraction results of the proposed method under simulated conditions. The curves represent the following: background (the fitted atmospheric and instrumental baseline), ref-CH4 (the standard methane reference spectrum), and extracted feature (the methane spectral signature extracted by the algorithm). Note that these curve definitions and legend notations are consistent throughout the manuscript unless otherwise specified. (a) LASSO method background reconstruction. (b) LASSO method reference spectrum and feature extraction, = 0.65.
2.3. Improved Reference Brightness Temperature Spectrum Selection Method
To overcome the insufficient adaptability of discrete spectral libraries to variable atmospheric conditions, this study proposes a continuous parameter space dynamic optimization strategy. This method breaks free from preset spectral library constraints, iteratively optimizing and synchronously updating values for both methane and water vapor. Using measured environmental parameters (temperature, humidity, and sensing distance) as optimization boundary constraints, combined with the three-layer model, reference spectra matching current environments are generated in real time.
Assume that the initial guess value combination quantity is N, with each combination containing D values. In the search space, generate initial guess value combination set , where each individual is . The initialization formula is as follows [20]:
where and represent the lower and upper boundaries of the jth value, respectively. Water vapor values are calculated based on sensing distance and environmental relative humidity, obtaining theoretical upper boundary values of concentration path length through saturated vapor pressure and the ideal gas equation:
where represents the relative air humidity, represents the saturated vapor pressure at the ambient temperature (in this study, 25 °C is used as a representative value consistent with our experimental conditions), P represents the total pressure, and d represents the sensing distance.
Methane values are used to calculate upper threshold values according to Equation (5) in [13], with this study adopting corresponding values under 30% transmittance conditions as fixed boundary parameters. rand(0, 1) represents random numbers on the closed interval [0, 1]. In this paper, is a two-dimensional vector corresponding to water vapor and methane values.
For the ith combination, the mutation operation formula is as follows:
where represents the current optimal value combination, and are two randomly selected different combinations, and F is the mutation factor controlling differential vector scaling.
After mutation, the mutation vector is crossed with the target vector to generate trial vector , which is mathematically expressed as follows:
where represents crossover probability, randj(0, 1) represents the jth output of the random number generator within interval [0, 1], and represents a randomly selected index ensuring that trial vectors contain at least one component from mutation vectors.
After completing mutation and crossover operations, the DE algorithm follows a greedy strategy, comparing trial vectors with target vectors in the current combination set and selecting vectors with superior cost function values to influence next-generation initialization vectors. The selection formula is as follows:
where f represents the cost function, and t represents the iteration count. When the iteration count reaches the preset maximum value or the cost function change falls below the convergence threshold, the algorithm terminates iteration and outputs the optimal value solution, combining atmospheric parameters (measured temperature, sensing distance, air relative humidity, and pressure) to calculate simulated brightness temperature spectra. Since DE is an optimization method for finding minimum values, the negative Pearson correlation coefficient between simulated and measured brightness temperature spectra is calculated, ranging from [−1, 0].
Upon DE iteration completion, the obtained value combination serves as the initial guess values inputted into the LM algorithm. In traditional least squares problem-solving, gradient descent and Gauss–Newton methods are two important parameter optimization approaches. The LM algorithm combines these optimization methods, with its optimization iteration formula expressed as follows [19]:
where I is the identity matrix, J is the Jacobian matrix, is the residual vector, is the damping parameter, and is the two-dimensional parameter vector containing values for methane and water vapor.
After iteration completion, values for each gas component are obtained. At this point, reference spectral combinations conforming to measured environments can be calculated according to Equation (1).
To validate the effectiveness of the proposed improved reference spectrum selection method, a set of simulation value retrieval experiments was designed. The experiments established standard conditions of 200 m path length and 25 °C atmospheric temperature, with methane transmittance and relative humidity both taking five typical values of 10%, 30%, 50%, 70%, and 90% within the 10–90% range, forming 25 test scenarios. Based on these parameters, theoretical brightness temperature spectra were calculated, with both LASSO and the proposed method performing retrieval to quantitatively evaluate value retrieval accuracy.
Figure 5 visualizes the retrieval error surfaces over the two-dimensional parameter space defined by methane transmittance and relative humidity. The results demonstrate that the LASSO method produces systematic bias and severe instability. According to the calculation defined in Equation (11), the methane transmittance retrieval yields an average error of 123.68% and a maximum error of 485.89%; similarly, the water vapor relative humidity shows average and maximum errors of 99.20% and 99.79%, respectively. This substantial bias originates from the intrinsic mismatch between the discrete spectral library and the continuous variations in actual atmospheric states. In the retrieval of trace gases, the absorption features of methane follow a continuous non-linear evolution based on concentration and environmental parameters. However, LASSO is constrained to approximate this continuous change using a linear combination of fixed, discrete reference spectra. Under high-humidity conditions, where the characteristic structures of methane are heavily masked and distorted by water vapor, this “discretization gap” becomes critical. The algorithm is forced to select an incorrect combination of reference spectra (e.g., a wrong methane concentration coupled with a specific water vapor baseline) to mathematically minimize the fitting residual. This leads to pseudo-optimal solutions where the fitted spectral shapes appear reasonable due to error cancellation, but the estimated physical quantities deviate significantly from the ground truth.
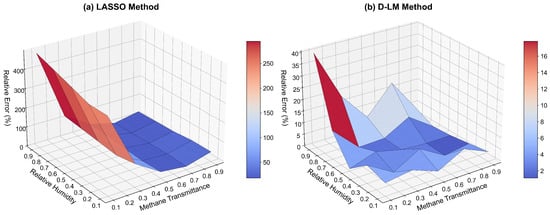
Figure 5.
Due to the large error magnitude difference between methods, separate color scales are employed. Error surfaces of methane transmittance retrieval over the discrete simulation grid formed by methane transmittance and relative humidity. (a) The error surface of the LASSO method, exhibiting high-amplitude peaks and a rugged landscape due to local convergence. (b) The error surface of the D-LM method, showing a consistently flat and low-error profile, demonstrating global search stability.
In contrast, the D-LM method maintains a consistently flat and smooth error surface across the entire parameter space (Figure 5b). The improved method effectively avoids local convergence problems through the “global search-local optimization” strategy and physically constrained dynamic reference spectrum generation. The statistical results show a significant improvement in accuracy: The average and maximum errors for methane transmittance decrease to 6.41% and 39.85%, representing reductions of 94.8% and 91.8%, respectively. Similarly, the average and maximum errors for water vapor relative humidity decrease to 6.80% and 24.98%, representing reductions of 93.1% and 75.0%. These results demonstrate the method’s superior robustness and its capability to identify the global optimum even under weak signal conditions and high water vapor interference.
These results indicate that reasonable dynamic reference spectrum generation and parameter iteration mechanisms are key to improving passive spectral retrieval accuracy. By adaptively searching for approximately optimal combinations in parameter space and incorporating physical consistency constraints, low bias can be maintained under window-edge and high-water-vapor background conditions, achieving robust multi-component gas concentration retrieval and providing reliable technical pathways for quantitative atmospheric trace gas analysis in complex scenarios.
2.4. D-LM Detection Algorithm
Based on the aforementioned improved reference spectrum selection method, this study constructs the D-LM detection algorithm (Figure 6) to address gas detection challenges under window-edge and high-water-vapor environments. The algorithm incorporates measured atmospheric parameters, dynamically optimizing to search for reference spectral combinations that best match the measured conditions.
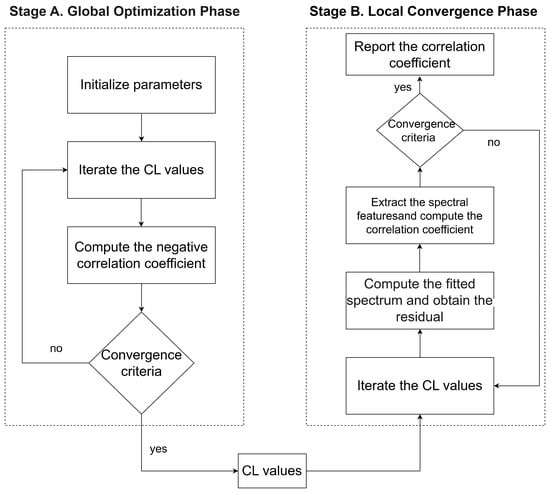
Figure 6.
Flowchart of the D-LM algorithm. The process comprises two stages: Stage A represents the global search using the differential evolution (DE) algorithm, and stage B represents the local fine-tuning using the Levenberg–Marquardt (LM) algorithm.
The algorithm employs broad Gaussian functions for brightness temperature spectrum baseline modeling, combining with dynamically updated target gas and atmospheric reference spectral combinations to construct real-time reference matrix , where p represents the spectral dimension and l represents the reference spectrum quantity. Adopting the matrix composition framework described in [13], the reference spectra in consist of three categories: target spectra, atmospheric background spectra, and baseline fitting functions (modeled by broad Gaussian functions). However, unlike the static spectral library used in [13], the gas and atmospheric components in A are dynamically generated in this study. They are calculated in real time using the forward physical model (Equation (1)) based on the specific concentration path length (CL) and humidity parameters optimized at each iteration. Based on this matrix, Ordinary least squares (OLS) [13] can be adopted to achieve precise background spectrum reconstruction and quantitative target gas feature extraction.
The algorithm flow is as follows:
STAGE A. Global Optimization Phase
- Parameter Initialization: Initialize mutation factor F’s interval range to [0.5, 1], and fix crossover probability at 0.7 [20]. Additionally, set the maximum iteration count to 200 to ensure adequate population iteration, set the convergence threshold to 0.01, and set the population size to 30.
- Input atmospheric parameters. Calculate the water vapor value’s upper limit based on relative humidity, saturated vapor pressure, and the ideal gas equation, with the methane value’s upper limit fixed at the value corresponding to 30% transmittance. Utilize atmospheric parameters and current values to calculate simulated brightness temperature spectra [13], using negative Pearson correlation coefficients between simulated and measured spectra as the cost function, aiming to find value combinations closest to the measured data.
- Terminate iteration when the algorithm reaches the convergence condition or maximum iteration count.
STAGE B. Local Convergence Phase
- Use value combinations obtained from the DE algorithm as initial guess values, maintaining the same value range constraints as the DE phase.
- Calculate target gas cloud component reference spectra in real time based on value combinations, combining broad Gaussian function baseline fitting to construct complete reference matrix . Each iteration replaces target and atmospheric spectra in reference matrix, generating new reference matrices.
- Reconstruct background spectra using atmospheric and baseline references in . Extract target feature signals by subtracting reconstructed background spectra from the measured spectra. Calculate the Pearson correlation coefficients, , between target features and target reference spectra from step 2 as cost function and gas identification evaluation metrics.
- Calculate the least-squares-fitted spectra [13], subtracting them with the measured spectra to form residual terms as a standard for evaluating algorithm fitting effectiveness.
3. Experiments and Discussion
To validate the D-LM algorithm’s effectiveness, two experimental groups were conducted. The first group comprised simulation experiments evaluating the algorithm’s adaptive detection performance under different water vapor concentration conditions; the second group validated the algorithm’s practical application capability in complex transmission environments through controlled methane releases in the field.
The experiments compared two detection methods: LASSO based on discrete search mechanisms and D-LM based on continuous parameter space dynamic optimization. A unified threshold of = 0.85 was established for methane gas detection determination. This threshold was empirically determined based on the statistical analysis of correlation coefficients observed during the controlled gas release periods.
To ensure robust detection stability against sensor noise, we specifically selected the spectral window ranging from 1243.95 to 1313.37 cm−1 (as shown in Figure 7). Although the central peak exhibits the strongest absorption, relying solely on a narrow peak makes the inversion highly susceptible to high-frequency noise and baseline drift. In contrast, the selected broad window captures a continuous spectral structure, including both the primary peak and the characteristic side-lobes. This multi-feature morphological constraint allows the fitting algorithm to distinguish the target methane signal from random noise and background interferences more effectively, thereby enhancing the inversion accuracy.
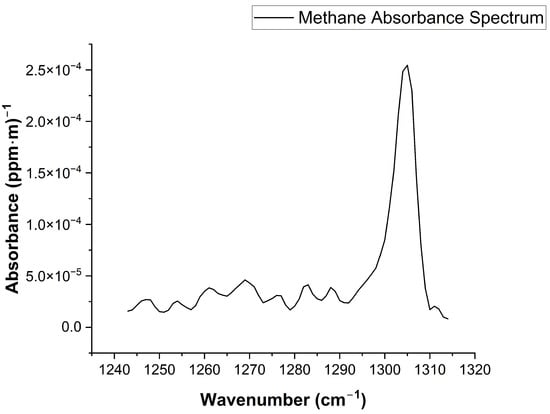
Figure 7.
The selected spectral window for methane retrieval (1243.95–1313.37 cm−1). The plotted standard methane spectrum is derived from the HITRAN database and convolved with the instrument line shape (ILS) of the spectrometer to match the experimental resolution. This continuous range encompasses both the strong absorption peak and the adjacent weak absorption features, providing a robust structural reference for spectral fitting.
3.1. Methane Simulation Experiments
To quantitatively evaluate algorithm performance, multi-variable combination simulation experiments were constructed. Using methane transmittance and air relative humidity as variables, each equally divided into 100 discrete intervals within the 10–90% range, 10,000 test samples were generated through grid combinations, calculating values and the MSE of fitting residuals (as shown in Figure 8). To explicitly isolate the impact of relative concentration changes between methane and water vapor, factors such as baseline drift, instrument line shape (ILS), and random noise were excluded from this simulation.
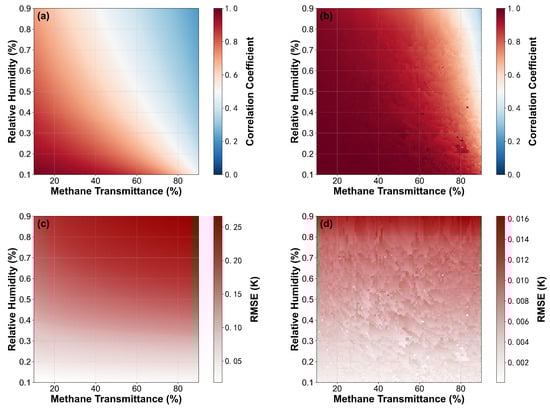
Figure 8.
(a) LASSO method correlation coefficient heatmap. (b) D-LM method correlation coefficient heatmap. (c) LASSO method residual MSE heatmap. (d) D-LM method residual MSE heatmap.
The experimental results demonstrate that the D-LM algorithm exhibits advantages under high-water-vapor interference conditions. Although fitting residuals increase with humidity for all methods, the D-LM algorithm maintains lower overall residual levels with improved correlation coefficients. Under simulation conditions identical to Section 2.2, the D-LM method’s MSE decreased from LASSO’s 0.191 to 0.008, a reduction of 95.8% (Figure 9). This improvement is directly reflected in background reconstruction precision: D-LM method’s fitted spectra generated through dynamic value optimization highly coincide with measured spectra, elevating values to 0.95 (Figure 10).
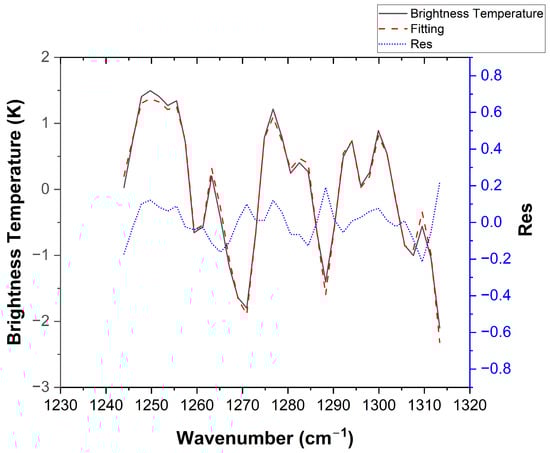
Figure 9.
Spectral fitting results of the D-LM method under the same simulated conditions as Figure 3. The curve definitions and dual-axis layout are consistent with Figure 3: The black solid line (simulated measurement spectrum) and red dashed line (fitted spectrum) correspond to the left vertical axis (brightness temperature), while the blue dashed line (fitting residual) corresponds to the right vertical axis. Compared to Figure 2, the fitting residuals are significantly reduced, demonstrating the method’s superior ability to reconstruct spectral features.
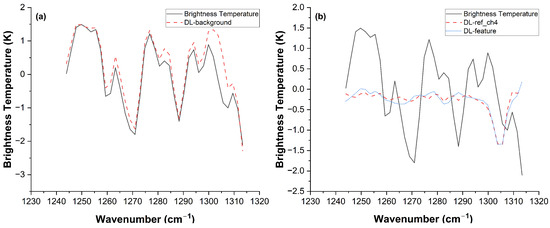
Figure 10.
(a) D-LM method background reconstruction. (b) D-LM method reference spectrum and feature extraction, = 0.95.
Analyses reveal that the LASSO method’s limitations originate from its dependence on discrete spectral libraries. When the measured environmental values deviate from preset databases, or when water vapor–methane combinations outside the database occur, systematic mismatches between the reference spectra and observational data lead to residual accumulation, ultimately manifesting as decreased detection sensitivity. In contrast, the D-LM algorithm incorporates environmental parameters into continuous optimization frameworks, retrieving reference spectral combinations that match current scenarios in real time and effectively overcoming static spectral library adaptability and insufficiency problems.
3.2. Field Methane Experiments
In field environments, controlled methane release detection processes are affected by atmospheric conditions on open paths. To systematically evaluate the proposed adaptive spectral retrieval algorithm’s applicability and robustness in real scenarios, outdoor controlled methane release experiments were conducted under high-humidity conditions.
The field trial setup is illustrated in Figure 11. To simulate a sudden leakage event while strictly adhering to safety and environmental regulations, a balloon-bursting method was employed. Pure methane was injected into a white balloon with a diameter of approximately 70 cm, which was then ruptured to generate an instantaneous gas cloud against a building background under windless conditions. Although actual industrial scenarios typically involve larger-scale continuous emissions, this controlled instantaneous release provides a safe and valid testbed for evaluating the algorithm’s response to high-concentration methane bursts.
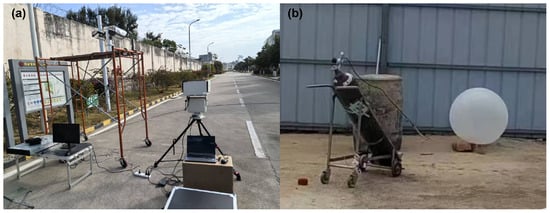
Figure 11.
Field trial setup for the controlled methane release experiment. (a) Deployment of the FTIR spectrometer for open-path methane detection against a building background. (b) The white balloon (diameter ≈ 70 cm) is filled with pure methane and used to simulate the leakage source. Note: An instantaneous release via balloon rupture was selected over continuous emission to ensure operational safety and minimize environmental impact, acting as a proxy for industrial leakage scenarios.
The experiments were conducted on open paths, with methane release points located 500 m from the infrared spectrometer. Environmental relative humidity was monitored in real time through high-precision humidity sensors, fluctuating around approximately 70% during experiments. For data acquisition, the spectral resolution was configured at 4 cm−1. This selection represents an optimal trade-off between resolving spectral features and maintaining a high signal-to-noise ratio (SNR) for rapid temporal response, as higher spectral resolutions typically degrade the SNR or require extended integration times to achieve comparable sensitivity [21]. The spectrometer continuously acquired brightness temperature data at 1 s intervals.
The experimental analysis results shown in Figure 12 indicate that the D-LM algorithm’s fitting exhibited a residual root mean square error of approximately 0.69, while the LASSO algorithm exhibited approximately 1.58, with the former representing only 43% of the latter. This difference validates the D-LM algorithm’s superior fitting precision under complex transmission conditions. However, it is worth noting that the MSE levels in the field trials are notably higher than those in simulation experiments. This increase is primarily attributed to real-world factors, specifically the instrument line shape (ILS) deviations and environmental noise, which introduce additional residuals not present in the idealized simulations.
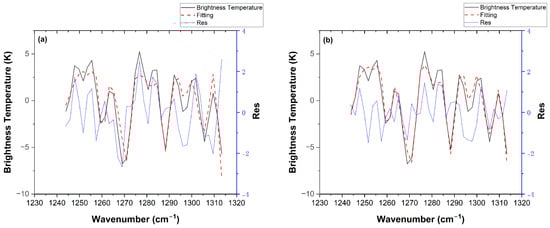
Figure 12.
Algorithm fitting performance comparison; all spectra are offset for clarity. (a) LASSO algorithm fitting results. (b) D-LM algorithm fitting results.
From background reconstruction and feature extraction effectiveness perspectives (Figure 13 and Figure 14), when reference spectrum simulation conditions do not match measurement conditions, the LASSO algorithm’s background reconstruction precision decreases, with methane feature signal extraction experiencing interference, achieving values of only 0.75. In contrast, the D-LM algorithm explicitly embeds atmospheric parameters, including temperature, humidity, pressure, and path length, into cost functions, achieving dynamic optimization transitions from static library matching to the scenario-synchronized evolution of reference spectra, elevating values to 0.87. The experimental results confirm the D-LM algorithm’s stronger adaptive capability with respect to complex transmission effects, including high-humidity disturbances and window-edge obscuration in open-path remote sensing.
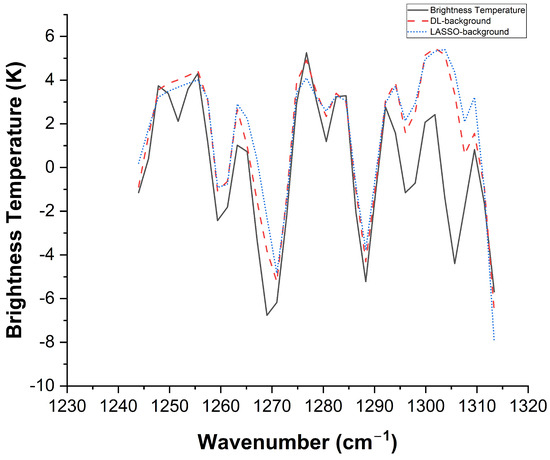
Figure 13.
Background reconstruction comparison.
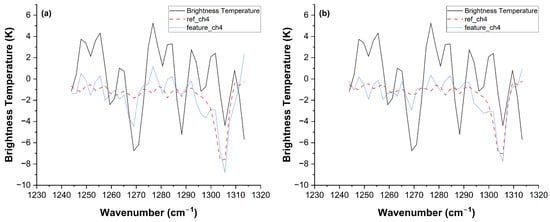
Figure 14.
Algorithm feature extraction and standard reference spectrum comparison. (a) LASSO algorithm’s selected reference spectrum and extracted methane features, = 0.75. (b) D-LM algorithm’s selected reference spectrum and extracted methane features, = 0.87.
3.3. Discussion
It is worth noting that alternative strategies for continuous spectral representation exist, such as directly embedding high-fidelity radiative transfer models (e.g., MODTRAN) into the optimization loop or applying interpolation within the discrete LASSO framework. However, both approaches encounter significant practical bottlenecks compared to the proposed D-LM method. Firstly, although MODTRAN is a mature commercial software package, integrating it with the existing spectral processing system is difficult due to limiting factors such as software architecture and licensing. In contrast, the method proposed in this paper has been demonstrated to achieve satisfactory results without the need for MODTRAN support. Therefore, MODTRAN was not employed in the real-time iteration process. Secondly, regarding the interpolation of reference libraries, although it could theoretically approximate continuous spectra, achieving a resolution comparable to the D-LM method would require constructing a high-density grid across multi-dimensional variables (temperature, humidity, and path length). This would lead to a combinatorial explosion in library size and search complexity, severely compromising retrieval efficiency. In contrast, the D-LM algorithm adopts a more efficient pathway: It utilizes a simplified analytical model for rapid forward calculation and achieves ’infinite resolution’ through continuous parameter evolution. This avoids both the computational burden of heavy radiative transfer models and the storage/search redundancy of massive interpolated libraries, thereby enabling efficient and accurate feature extraction.
Furthermore, the D-LM algorithm demonstrates advantages in both algorithm design and experimental validation. In terms of algorithm design, by constraining optimization variables to methane and water vapor values, a two-dimensional search space is constructed, reducing computational complexity compared to traditional multi-dimensional spectral library searches. Quantitatively, the average processing time per spectrum is reduced from approximately 2.28 s (LASSO) to 0.30 s (D-LM) under the same hardware conditions, significantly enhancing its potential applicability to near-real-time monitoring scenarios. The core innovation lies in eliminating dependence on preset reference spectral libraries and adopting a “global search-local optimization” dual-layer strategy that dynamically generates reference spectra that match current environments based on measured atmospheric parameters.
Experimental validation shows that the D-LM algorithm achieves smaller fitting residuals and higher correlation coefficients under complex transmission conditions. This improvement is primarily attributed to the algorithm’s comprehensive modeling of atmospheric parameters, including temperature, humidity, and pressure, as well as the dynamic reference spectrum selection mechanism based on physical models. The algorithm exhibits particularly strong robustness in window-edge detection under high-water-vapor interference conditions.
However, the algorithm has certain limitations. When environmental parameters change drastically over short time periods, pre-input atmospheric parameters may exhibit deviations, affecting the algorithm’s performance. To mitigate this effect, future work will focus on integrating high-frequency synchronous meteorological sensors to update environmental-state parameters in real time, thereby stabilizing retrieval accuracy under dynamic weather conditions. Additionally, although computational efficiency has improved, further optimization remains necessary for applications requiring extremely high real-time performance.
Moreover, whereas the present framework treats the ILS as time-invariant within each retrieval cycle, temporally varying ILS—arising from thermal drift or scanner aging—can induce the subtle broadening or spectral shifting of absorption lines. These ILS perturbations constitute an additional correlated error term. Incorporating either a real-time ILS monitoring channel or a parametric ILS convolution into the D-LM cost function is expected to suppress this residual error without materially increasing the computational load.
4. Conclusions
This study addresses the accuracy degradation problem of traditional brightness temperature detection methods under complex transmission conditions caused by preset spectral library limitations, proposing a D-LM adaptive detection algorithm that integrates differential evolution global optimization with LM nonlinear local convergence. This method overcomes the insufficient adaptability of discrete spectral libraries to variable atmospheric conditions through continuous parameter space dynamic optimization.
Simulation and field experiment results demonstrate that the D-LM algorithm enhances background reconstruction accuracy and weak methane signal detection capability. Under complex transmission conditions, algorithm fitting residuals are reduced by approximately 57% compared to the LASSO method, with improved correlation coefficients. This validates the effectiveness of adaptive spectrum generation and dynamic optimization strategies based on measured environmental parameters in improving gas detection accuracy, providing a reliable technical pathway for greenhouse gas monitoring under complex atmospheric conditions. Furthermore, the proposed framework is not limited to methane detection under high-humidity conditions. It possesses broad applicability and can be readily extended to other spectral retrieval scenarios involving multi-component gas mixtures. Specifically, for gas combinations where absorption features are significantly overlapped and relative concentrations fluctuate dynamically, this method offers a generalized solution that eliminates reliance on extensive discrete spectral libraries, thereby enhancing trace gas detection capabilities in complex atmospheric environments.
Author Contributions
Conceptualization, J.W.; Methodology, Y.L. (Yunze Li), J.W. and F.C.; Software, Y.L. (Yunze Li); Validation, W.X. and D.L.; Formal analysis, Y.L. (Yunze Li) and J.W.; Investigation, Y.L. (Yunze Li) and A.W.; Resources, A.W.; Data curation, Y.L. (Yunze Li); Writing—original draft, Y.L. (Yunze Li); Writing—review & editing, J.W. and F.C.; Visualization, Y.L. (Yunze Li); Supervision, D.L., Y.L. (Yangyu Li) and F.C.; Project administration, D.L. and Y.L. (Yangyu Li); Funding acquisition, W.X. All authors have read and agreed to the published version of the manuscript.
Funding
This research was funded by the National High-resolution Earth Observation System Major Project, grant number 52-L10D01-0613-20/22, and the High-Tech Project, grant number XM20252213116-WX.
Data Availability Statement
The data presented in this study are available on request from the corresponding author. The data are not publicly available due to privacy.
Conflicts of Interest
The authors declare no conflict of interest.
References
- IPCC. Climate Change 2021: The Physical Science Basis. Contribution of Working Group I to the Sixth Assessment Report of the Intergovernmental Panel on Climate Change; Cambridge University Press: Cambridge, UK, 2021. [Google Scholar] [CrossRef]
- Manolakis, D. Signal processing algorithms for hyperspectral remote sensing of chemical plumes. In Proceedings of the IEEE International Conference on Acoustics, Speech and Signal Processing, Las Vegas, NV, USA, 31 March–4 April 2008; pp. 1857–1860. [Google Scholar]
- Charlton, C.M.; Mizaikoff, B. Sensing trace gases with quantum cascade lasers. Photon. Spectra 2006, 40, 64. [Google Scholar]
- Mlawer, E.J.; Taubman, S.J.; Brown, P.D.; Iacono, M.J.; Clough, S.A. Radiative transfer for inhomogeneous atmospheres: RRTM, a validated correlated-k model for the longwave. J. Geophys. Res. 1997, 102, 16663–16682. [Google Scholar] [CrossRef]
- Rouet-Leduc, B.; Hulbert, C. Automatic detection of methane emissions in multispectral satellite imagery using a vision transformer. Nat. Commun. 2024, 15, 3801. [Google Scholar] [CrossRef] [PubMed]
- Harries, J.E. Atmospheric radiation and atmospheric humidity. Q. J. R. Meteorol. Soc. 1997, 123, 2173–2186. [Google Scholar] [CrossRef]
- Harig, R.; Matz, G.; Rusch, P.; Gerhard, J.H.; Schäfer, K.; Jahn, C.; Schwengler, P.; Beil, A. Remote detection of methane by infrared spectrometry for airborne pipeline surveillance: First results of ground-based measurements. In Proceedings of the Remote Sensing of Clouds and the Atmosphere VIII, Barcelona, Spain, 8–12 September 2003; Volume 5235, pp. 435–446. [Google Scholar] [CrossRef]
- Bouffard, F.; Thériault, J.M. Background contributions in direct and differential Fourier transform LWIR measurements: A comparative analysis. Int. J. High Speed Electron. Syst. 2008, 18, 263–276. [Google Scholar] [CrossRef]
- Yang, Z.; Yu, C.; Zhang, W.; Zheng, W.; Wang, H.; Lei, Z.; Zhang, P. Remote sense for environment pollution gases in wide infrared spectral range. In Proceedings of the AOPC 2019: Optical Spectroscopy and Imaging, Beijing, China, 7–9 July 2019; Volume 11337. [Google Scholar] [CrossRef]
- Beil, A.; Daum, R.; Harig, R.; Matz, G. Remote sensing of atmospheric pollution by passive FTIR spectrometry. In Proceedings of the Spectroscopic Atmospheric Environmental Monitoring Techniques, Barcelona, Spain, 21–25 September 1998; Volume 3493, pp. 32–43. [Google Scholar]
- Chowdhury, M.A.Z.; Oehlschlaeger, M.A. Deep learning for gas sensing via infrared spectroscopy. Sensors 2024, 24, 1873. [Google Scholar] [CrossRef] [PubMed]
- Hesham, A.; Zeyad, L.; ElZahraa, F.; ElGamal, A.; Mohammed, P.; Sakr, M.; Sabry, Y.M. Deep learning enabling analysis of exhaled breath using Fourier transform spectroscopy in the mid-infrared. In Proceedings of the 2021 Tenth International Conference on Intelligent Computing and Information Systems (ICICIS), Cairo, Egypt, 5–7 December 2021; pp. 124–129. [Google Scholar]
- Li, D.; Cui, F.; Wang, A.; Li, Y.; Wu, J.; Qiao, Y. Adaptive detection algorithm for hazardous clouds based on infrared remote sensing spectroscopy and the LASSO method. IEEE Trans. Geosci. Remote Sens. 2020, 58, 8649–8664. [Google Scholar] [CrossRef]
- Chakraborty, S.; Saha, A.K.; Ezugwu, A.E.; Agushaka, J.O.; Zitar, R.A.; Abualigah, L. Differential Evolution and Its Applications in Image Processing Problems: A Comprehensive Review. Arch. Comput. Methods Eng. 2023, 30, 985–1040. [Google Scholar] [CrossRef] [PubMed]
- Li, X.; Wang, G. Optimal band selection for hyperspectral data with improved differential evolution. J. Ambient Intell. Humaniz. Comput. 2015, 6, 675–688. [Google Scholar] [CrossRef]
- Zhang, F.; Xu, H.; Wang, Z. Spectral design methods for multi-channel LED light sources based on differential evolution. Appl. Opt. 2016, 55, 7771–7781. [Google Scholar] [CrossRef] [PubMed]
- Bi, Y.; Xie, Q.; Peng, S.; Tang, L.; Hu, Y.; Tan, J.; Zhao, Y.; Li, C. Dual stacked partial least squares for analysis of near-infrared spectra. Anal. Chim. Acta 2013, 792, 19–27. [Google Scholar] [CrossRef] [PubMed]
- Wu, Y.; Peng, S.; Xie, Q.; Xu, P. Nonlinear least squares with local polynomial interpolation for quantitative analysis of IR spectra. Spectrochim. Acta A Mol. Biomol. Spectrosc. 2018, 206, 147–153. [Google Scholar] [CrossRef] [PubMed]
- Fischer, A.; Izmailov, A.F.; Solodov, M.V. The Levenberg–Marquardt method: An overview of modern convergence theories and more. Comput. Optim. Appl. 2024, 89, 33–67. [Google Scholar] [CrossRef]
- Storn, R.; Price, K. Differential evolution–a simple and efficient heuristic for global optimization over continuous spaces. J. Glob. Optim. 1997, 11, 341–359. [Google Scholar] [CrossRef]
- Harig, R. Passive remote sensing of pollutant clouds by Fourier-transform infrared spectrometry: Signal-to-noise ratio as a function of spectral resolution. Appl. Opt. 2004, 43, 4603–4610. [Google Scholar] [CrossRef] [PubMed]
Disclaimer/Publisher’s Note: The statements, opinions and data contained in all publications are solely those of the individual author(s) and contributor(s) and not of MDPI and/or the editor(s). MDPI and/or the editor(s) disclaim responsibility for any injury to people or property resulting from any ideas, methods, instructions or products referred to in the content. |
© 2026 by the authors. Licensee MDPI, Basel, Switzerland. This article is an open access article distributed under the terms and conditions of the Creative Commons Attribution (CC BY) license.