Highlights
What are the main findings?
- ICESat-2 (ATL08/ATL24) accurately measures mangrove vertical structure, with a validation against airborne lidar showing a 1.63 m RMSE for canopy height and 0.25 m RMSE for bathymetry for 10 m segments.
- A major algorithmic conflict exists between the land (ATL08) and bathymetry (ATL24) products that prevents the reliable, integrated mapping of topography, water, and bathymetry under dense canopies using the standard products.
What are the implications of the main findings?
- ICESat-2 is well suited for global mangrove assessment, especially as the laser photon counting system excels in short-stature vegetation. This study finds most mangroves fall into this category.
- A new, unified algorithm for labeling vegetation, water surface, topography, and bathymetry will be required to unlock ICESat-2 full potential, allowing for detecting water and bathymetric surfaces in the presence of canopy cover.
Abstract
NASA’s ICESat-2 mission offers potential for coastal monitoring by combining its land/vegetation (ATL08) and nearshore bathymetry (ATL24) products. However, the combined performance of these products in environments where both canopy and bathymetry are present, such as mangroves, has not been explored. This work assesses ATL08 and ATL24 over mangroves using a dual approach: (1) a detailed regional validation in Everglades National Park against high-resolution airborne lidar (ALS), and (2) a global analysis characterizing mangrove structure. The regional validation found strong accuracies, with a root mean square error (RMSE) of 1.63 m for ATL08 canopy height and 0.25 m for ATL24 bathymetry for 10 m segments. In this comparison, using 30 m segments, ICESat-2 (RMSE 1.37 m) demonstrated superior performance to GEDI (RMSE 1.51 m) when measuring the same mangrove canopies. The global analysis confirmed that the majority of mangroves are short-stature (<10 m), a structural range where ICESat-2 demonstrates optimal performance. Despite these strengths, disagreements in photon labels between the ATL08 and ATL24 algorithms limit the ability to identify differences between topography, bathymetry, and water surface in these intertidal areas. While ICESat-2 has potential to accurately measure canopy height and bathymetry in mangroves, the integrated mapping beneath dense canopies is not yet feasible with standard products.
1. Introduction
In April 2025, NASA released a new global, along-track coastal and nearshore bathymetry dataset derived from the Ice, Cloud, and land Elevation Satellite-2 (ICESat-2) mission (ATL24). This data product represents a major advancement in space-based mapping of shallow water environments and leverages ICESat-2’s photon-counting lidar to retrieve bathymetric profiles when water conditions are favorable. Paired with ATL08, the along-track land and vegetation product, ICESat-2 offers a unique capability for simultaneous and seamless measurements of terrestrial and underwater coastal features.
While these products have been used independently to characterize vegetation and coastal geomorphology, their combined performance in coastal zones is untested. Understanding the continuity of ATL08 and ATL24 is essential for realizing the full potential of ICESat-2 as a tool for integrated coastal monitoring, and assessing this potential is particularly important as ICESat-2 is the only current spaceborne sensor capable of directly measuring canopy height and bathymetry. To explore this capability, mangrove forests were selected as a globally distributed test case as they grow in coastal intertidal zones.
Mangrove forests are among the most productive and ecologically valuable ecosystems on Earth. These salt-tolerant trees and shrubs are characterized by their specialized, water-immersed root systems which anchor the vegetation to the wet soil [1]. Mangroves play critical roles in shoreline and storm surge protection and carbon sequestration as well as providing critical habitat to many aquatic species [2,3,4,5,6,7]. Mangrove forests are among the most carbon-dense ecosystems with below ground storage accounting for 71% to 98% of total carbon stock [8]. Additionally, approximately 25% of the global human population lives within 50 km of coasts [9]. Despite their ecological importance, mangrove ecosystems have declined at rates between 1 and 2% annually due to urbanization and coastal development [10,11]. They are also vulnerable to increasing storm intensity, sea-level rise, and other climate-related stressors [12,13].
The overlap of terrestrial and aquatic environments in mangrove zones presents unique challenges for traditional remote sensing approaches, especially when estimating biomass in areas where vegetation interacts directly with tidal water. Even when mangrove prop roots are submerged during tidal cycles, they remain part of the aboveground biomass because they originate above the sediment surface and contribute substantial structural biomass [14,15]. This complexity underscores the need for remote sensing approaches capable of characterizing both above-water and submerged mangrove structures.
Multispectral and hyperspectral remotely sensed data have been utilized to capture the spatial 2D distribution of mangrove forests globally. Previously, a circa 2000 30 m resolution global mangrove product was derived from Landsat imagery revealing that approximately 42% of mangrove extent is found in Asia, followed by Africa (20%), North and Central America (15%), Oceana (12%), and South America (11%) totaling 137,760 km2 [16]. Although the extent of mangrove coverage has stabilized or increased recently, these ecosystems were estimated to have covered more than 200,000 km2 along tropical coastlines and have been declining at a rate ranging between 1 and 2% per year [8]. Bunting et al. (2018) developed an automated mapping methodology that produced annual mangrove extent maps from 1996 to 2016 using ALOS PALSAR and Landsat which found net losses in some regions that were offset by gains in others [17]. More recently, Jia et al. (2023) created a 10 m resolution global mangrove canopy height map based on Sentinel-2 imagery using a random forest classification and object-based image analysis totaling 145,068 km2 with an increase in extent attributed to conservation efforts [18]. Although these multispectral based estimates of global mangroves are useful to quantify the extent and potential trends, they lack information on canopy structure which is a key indicator for carbon sequestration. This limitation has motivated the development of mapping approaches using active remote sensing technologies.
2.5 D mangrove products have been developed through the fusion of multispectral imagery and data from space-based waveform lidar missions like ICESat/GLAS and GEDI (Global Ecosystem Dynamics Investigation) which have significantly advanced the representation of mangrove vegetation structure at the global scale [19,20]. Simard et al. [19] utilized the SRTM 30 m DEM and heights from ICESat/GLAS to produce global mangrove canopy height and structure products representing the year 2000. This analysis provided the first synoptic representation of mangrove forests which indicates that canopy heights are largely driven by temperature, precipitation, and cyclone frequency. This global mangrove canopy height dataset was added to the ArcGIS Living Atlas of the World [21]. Fatoyinbo et al. (2008) worked with SAR (Synthetic Aperture Radar) interferometry for mangrove biomass estimation and demonstrated that L-band ALOS PALSAR could estimate canopy height [22]. Fatoyinbo and Simard (2013) extended these methods to map African mangrove biomass [23].
Most recently, Simard et al. (2025) produced a 12 m resolution global mangrove height map derived from TanDEM-X data and calibrated with GEDI L2B footprint level RH98 canopy height [20]. As a byproduct of their research, Simard et al. [20] released both their 12 m mangrove height product and the high quality, filtered GEDI data available through Oak Ridge National Laboratory (ORNL).
While these missions have been pivotal for mapping global forest canopies, ICESat’s relatively large footprint (35 to 70 m diameter) limited its ability to capture fine-scale canopy structure. Similarly, GEDI with its long laser pulse width is optimized for measuring canopy taller than 5 m which leads to difficulty capturing canopy heights for short vegetation (e.g., <5 m) [24]. Additionally, both of these missions utilized a near-infrared wavelength that precludes any penetration of water, leaving any submerged vegetation structure, as in the case of inundated mangrove forests, out of the overall assessment of canopy height. Although GEDI has been used to assess vegetation in mangroves and other intertidal zones, previous studies often do not directly account for the impacts of partially submerged vegetation [20,25].
Conversely, ICESat-2’s green laser, photon-counting capabilities offer the potential to penetrate water and resolve fine-scale vertical vegetation structure. Previous studies have assessed ICESat-2 canopy height retrievals in mangrove regions such as Australia [26] and evaluated ATL24 accuracy in measuring shallow water bathymetry at the photon-rate [27]. However, these studies have generally analyzed vegetation or bathymetry in isolation. There is currently no prior work that has examined the mission’s ability to integrate canopy and bathymetry in these coastal forests. Furthermore, previous bathymetric assessments have focused on photon-level accuracy versus segment-level accuracy, which is a more standard format for measuring elevations and canopy heights and is essential for scalable data fusion.
This work contributes the first simultaneous validation and analysis of the ATL08 and ATL24 products in a common study area.
To fill current gaps in integrated coastal monitoring with ICESat-2, this study pursues the following primary research objectives:
- Quantify the vertical accuracy of ICESat-2’s land/vegetation product (ATL08) and near-shore bathymetric product (ATL24) at 10 m and 30 m segments through validation against topobathymetry ALS data of the Everglades National Park.
- Characterize global mangrove structure using ATL08 and ATL24 data at 10 m and 30 m segment resolutions and compare 30 m ICESat-2 mangrove canopy height segments to GEDI globally.
This analysis addresses the feasibility of using ICESat-2 to characterize both the bathymetric and vegetation components of mangroves, as well as to provide a broad characterization of mangroves globally.
2. Materials and Methods
To investigate ICESat-2’s capacity for accurately characterizing mangrove canopy heights, two approaches were formed. The first approach was a regional analysis to validate the combined use of ICESat-2 ATL08/ATL24 for regional-scale canopy heights in the Everglades National Park using airborne lidar reference data. The second approach focused on global scale analyses for mangrove canopy heights with the goals of understanding both the mangrove coverage of ICESat-2 and the comparison of height retrievals to GEDI canopy heights and the most recent global mangrove gridded dataset.
2.1. Regional Validation
2.1.1. Study Area
For this work, the Everglades National Park, Florida, USA was selected to test the performance of the ATL08 vegetation product and the ATL24 bathymetric height product. The Everglades National Park contains over 1.5 million acres of both palustrine and estuarine protected wetlands, composed of a diversity of ecosystem landforms including fresh-water marshes, cypress swamps, hardwood hammocks, pinelands, and importantly for this work, mangroves. Florida’s mangroves are concentrated along the southern coastline and cover approximately 2500 sq km. They mainly comprise three species: red mangroves, black mangroves, and white mangroves, which typically grow to heights of 6 to 15 m [28]. A defining characteristic of mangroves is their existence in the intertidal zone. Mangroves in the Everglades National Parks were selected for two main reasons: (1) these protected mangroves have minimal anthropogenic impacts serving as a good benchmark for other natural mangrove sites and (2) the availability of temporally coincident topobathymetry airborne lidar data, with topobathy representing a continuous surface between above water topography and underwater bathymetry.
2.1.2. ALS Data
Airborne Lidar Scanner (ALS) data used in this work was collected by the USGS between 2 March 2019 and 4 July 2019, using a RIEGL VQ880-G dual green and near-infrared laser lidar system (RIEGL Laser Measurement Systems GmbH, Horn, Austria), capturing both the topographic and submerged surfaces [29]. The dataset was composed of dense point clouds, consisting of 1000 m by 1000 m tiles with approximately 2601 tiles total. The dataset has an aggregate nominal pulse density of four to eight pulses per square meter, with a maximum of seven returns per pulse. The reported vertical accuracy is 6.8 cm root mean square error (RMSE) for non-vegetated terrain surfaces, and 18.5 cm vertical RMSE for bathymetric surfaces.
The lidar measurements label classifications include Ground (2), bathymetry (40), water surface (41), water columns (45), noise (7), high noise (18). All other measurements are assigned to unclassified (1), which largely include vegetation photons for this area, and for this work were treated as vegetation photons. The data were provided in the NAD83 (2011) horizontal datum and NAVD88 (Geoid12B) vertical datum, which were converted to WGS84 ellipsoid coordinates to match the reference ICESat-2 data used for this work. The temporal differences between ALS acquisition (2019) and the ICESat-2 data (2018–2020) are considered minimal, though temporal differences are a potential source of error.
2.1.3. ICESat-2 Data
The accuracy assessment for ICESat-2 data was conducted with ATL08 REL 006 and ATL24 REL 001 photon classifications assigned to their corresponding ATL03 REL 006 geolocated photons [30]. ATL03 are the ICESat-2 Level 2a along-track geolocated photons at the native, 0.7 m resolution. Each photon has a geodetic latitude, longitude and elevation. The subsequent signal finding and classification occurs in the Level 3a product algorithms. ATL08 delineates signal from noise and then identifies ground photons (1), canopy photons (2), and high canopy photons (3), with all other photons assigned to unclassified (0), which typically correspond to errant noise photons. ATL24 has its own signal finding approach and identifies photons that are either bathymetry (40), or water surface (41), with unclassified photons also labeled as unclassified (0). ICESat-2 data for this validation was collected between 13 October 2018 and 31 December 2020, roughly within a year of the collection of ALS data.
2.1.4. Comparison Datasets
To help contextualize the fidelity of ICESat-2 canopy accuracy in mangroves, estimated relative canopy heights are compared to GEDI relative height measurements, as well as raster products derived from imagery and spaceborne laser altimetry sources. In particular, two datasets were used: a mangrove height product published in 2018 derived from SRTM DEM and ICESat/GLAS and the 2025 mangrove height product derived from TanDEM-X and GEDI [19,20]. Each product retains the resolution of the SAR derived component of 30 m and 12 m, respectively. These raster datasets provide continuous estimates of canopy heights in mangroves globally. For the GEDI data, a set of filtered global GEDI L2B from the Simard et al. [20] dataset was used, which includes GEDI RH measurements in mangroves.
2.1.5. Methods for Accuracy Assessment
Coincident ATL03, ATL08, and ATL24 granules were accessed via EarthDataSearch. ATL08 and ATL24 photon classifications that are indexed to specific ATL03 photons separately. Each set of classifications were then combined into a unified classification set. Here, each photon was assigned an ATL08 and ATL24 classification. If a photon was classified (non-zero) by both algorithms, the ATL24 classification was prioritized in order to retrain water surface and bathymetry classifications. Next, the ATL03 granules were aggregated into 10 m and 30 m segments. Within each segment, the median terrain (topographic) height, median bathymetric height relative to the WGS84 ellipsoid was calculated. In addition, for canopy height, the 98th percentile canopy height relative to terrain was calculated.
The ICESat-2 ALS validation was initiated by identifying all ALS tiles that intersect an ICESat-2 track and filtering out all ALS measurements outside of a 6 m radius—the effective laser footprint radius of ICESat-2. The filtering created a comparable ALS transect to the ICESat-2 observation. The ALS transect was aggregated into corresponding 10 m and 30 m segments using the same aggregation steps with the goal of achieving comparable canopy heights, and a continuous topobathymetric surface in order to assess ICESat-2 topography and bathymetry measurements irrespective of tidal stage or water level at the time of the measurement. Error residuals were then calculated by differencing corresponding ALS and ICESat-2 segments, treating the ALS data as the “truth” dataset. The RMSE, mean absolute error (MAE), and mean error were then calculated. The RMSE represents the standard deviation of the residuals (prediction errors), quantifying the spread of the data around the line of best fit, while the Mean Absolute Error (MAE) measures the average magnitude of the errors in a set of predictions, without considering their direction. The mean error was calculated as the mean of the residuals.
To compare to GEDI data, ICESat-2 30 m segments with a center point within a 30 m radius of a GEDI footprint center were identified. ICESat-2 relative canopy heights were compared to the GEDI relative canopy height (RH). To compare GEDI to ALS data, a 30 m diameter ALS data around the GEDI center point was filtered, then the 98th percentile canopy height relative to the terrain was calculated.
For the gridded mangrove datasets, the coincident pixels to ICESat-2 and ALS measurements were identified and compared to ALS and ICESat-2 terrain and canopy heights. For the 2018 mangrove gridded product, the ICESat-2 30 m segments were used, with the 10 m ICESat-2 data used to compare the 2025 mangrove gridded product. This was to improve the correspondence between the 2018 mangrove gridded product pixel resolution of 30 m and the 2025 mangrove gridded product pixel resolution of 12.5 m.
2.2. Global Analysis
To explore ICESat-2 capabilities for mangrove canopy height retrievals at the global scale, ATL08 and ATL24 datasets were evaluated both independently and combined. The independent assessments were to determine global ATL08 and ATL24 metrics across six biogeographic Regions of Interest (ROIs): Atlantic Americas & Caribbean (98°W to 30°W, 25°S to 35°N), Pacific Americas (−75°W to −125°W, 30°N to −5°S), West & Central Africa (30°W to 20°E, 10°S to 20°N), East Africa & Middle East (20°E to 65°E, 25°S to 30°N), South & Southeast Asia (65°E to 125°E, 10°S to 25°N), and Australasia (110°E to 180°E, −5°S to −60°S). This regionalization scheme was adapted from Duke et al. [1], and the distribution of ICESat-2 data over these regions is shown in Figure 1.
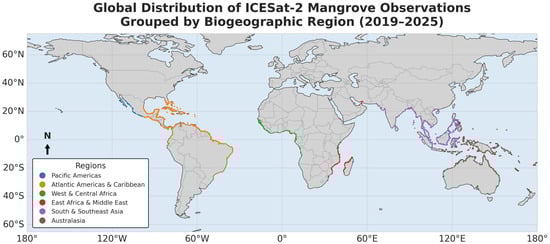
Figure 1.
Mangrove distribution classified by biogeographic region: Atlantic Americas & Caribbean, Pacific Americas, West & Central Africa, East Africa & Middle East, South & Southeast Asia, and Australasia. The regions are defined following Duke et al. [1] based on species composition, diversity, and historical biogeography. These six areas are bounded between approximately 30°N and 30°S.
2.2.1. ICESat-2 Data Access
To acquire the data for global analysis, this work leveraged the SlideRule API [31]. SlideRule is a cloud-based service that provides on-demand processing of ICESat-2 data and allows for a scalable global analysis. The USGS global mangrove distribution mask was used to obtain data acquired over mangrove forests. Using SlideRule, ATL08 REL 006 [32] and ATL24 REL001 [33] photon classifications were assigned to ATL03 REL 006 data at both 10 m and 30 m resolutions. The data spanned from October 2018 to April 2025.
2.2.2. Coverage and Data Quality Assessment
The global analysis started with an assessment of the ATL08 and ATl24 data products to establish a baseline for sensor performance. The ATL08 dataset (approximately 2.2 million data segments) was evaluated to characterize its spatial and temporal coverage, structural metrics, and photon quality over mangrove regions. Canopy height distributions were calculated using the h_canopy (98th percentile relative height) parameter.
The work also investigated several acquisition parameters like weak/strong beam, day/night, and wet/dry season to evaluate sensor performance and the subsequent data quality.
The ATL24 dataset, consisting of approximately 1.8 million segments, was investigated to see its capability for bathymetry detection in the shallow water coastal environment of mangrove forests. Only high-confidence returns (confidence value > 0.6) were used when analyzing coastal depth to better avoid false-positive bathymetry classifications [33]. Table 1 shows the overall global analysis approach. For depth, we considered the instantaneous water depth, that is, measuring the distance between detected water surface and bathymetric surface as measured at that moment by ICESat-2. This way, water depth can be estimated, irrespective of tidal stage.

Table 1.
Global Analysis Approach.
2.2.3. Comparison with Global Mangrove Canopy Height Map and GEDI
ICESat-2 canopy height data obtained via SlideRule was compared with the 2025 global mangrove canopy height map [20] and the GEDI data used for TanDEM-X calibration. The 98th percentile canopy heights from ICESat-2 ATL08 (h_canopy) were matched against Simard et al. [20] gridded heights and GEDI canopy heights (RH). ICESat-2 segments at 10 m resolution were paired with the 12 m gridded canopy heights of the Global Mangrove Canopy Height Map. For the GEDI comparison, ICESat-2 30 m segments were compared to GEDI measurements from the same year. ICESat-2 30 m segments were used as they are similar in size to GEDI’s approximately 25 m footprint diameter. In addition, ICESat-2 and GEDI measurements were often resampled to 30 m pixel resolution of Landsat and other Earth-observing missions. The comparison was evaluated using root mean square difference (RMSD), mean absolute difference (MAD), mean difference, and Pearson’s correlation coefficient (r). RMSD and MAD are used as metrics of comparison instead of RMSE and MAE as these are measures of accuracy. These metrics were computed for the full dataset, across biogeographic regions, and within discrete canopy vertical height bins.
2.2.4. Detection of Potential Submerged Vegetation
Prop roots can contribute 10–25% of total aboveground biomass and extend 0.5–2 m vertically from the sediment surface [14]. At high tide, a substantial portion of this biomass may be submerged, representing a component that traditional remote sensing may fail to capture. To see if this component of biomass can be measured, a combined global vegetation and bathymetry dataset was generated. Using the global 10 m dataset, ATL08 and ATL24 segments were matched along coincident reference ground track, cycle, and footprint.
3. Results
3.1. Everglades National Park Validation
3.1.1. Examining ATL08 and ATL24 at the Photon Level
Examining ATL08 and ATL24 classifications at the ATL03 photon level resolution largely represents vegetation and bathymetric characteristics in this environment. The canopy and top of canopy classifications from ATL08 capture vegetation at varying heights. However, REL 006 ATL08 sometimes struggles differentiating between true ground and dense foliage, resulting in underestimates of canopy heights. In addition, the ATL08 algorithm often confuses water surface for ground, since the difference between flat ground and water surface can be difficult to determine, even upon visual inspection, and especially in the presence of vegetation. Similarly, the ATL24 algorithm can detect water surface and bathymetric surfaces, though given the complicated structure of mangroves this algorithm also confuses ground with water surface or bathymetry when the ground is in the presence of dense vegetation. In certain regions, lower vegetation photons are labeled by the ATL24 algorithm as water surface.
Photons that are classified by both the ATL08 and ATL24 highlight the disconnect between these two algorithms, as seen in Figure 2, and in this work, describing these photons with positive classifications from ATL08 and ATL24 as contested photons. These contested photons are most commonly found on the ground or water surface, but occasionally low vegetation photons can be classified by both algorithms. In particular, those that appear to be water surface are often classified by ATL08 as terrain, while also being classified as water surface by ATL24. In areas that appear to have dense vegetation, ATL24 will classify photons as water surface or bathymetry, while these same photons may be classified as terrain or vegetation by ATL08.
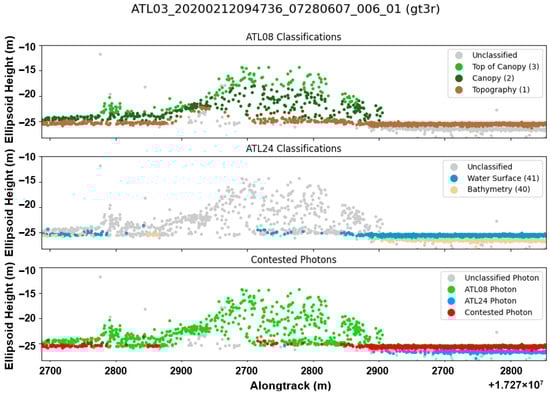
Figure 2.
Demonstration of ATL08 (top) and ATL24 (middle) classifications at ATL03 photon-rate. Contested photons (bottom) are identified, which are photons that have classifications from both ATL08 and ATL24. Here, they are mainly manifested as either ATL08 terrain photons being contested with ATL24 bathymetry or water surface classifications.
The ATL08 and ATL24 labeled ATL03 photons were compared with processed ALS transects to assess ATLAS performance. This comparison confirmed instances in which ATLAS successfully measured vegetation, water surface, and bathymetry within the same area, demonstrating its ability to detect and quantify partially submerged vegetation. In some of these cases, the ATL08 and ATL24 algorithms correctly identified photons corresponding to vegetation, the water surface, and the bathymetric surface. An example of this can be seen in Figure 3.
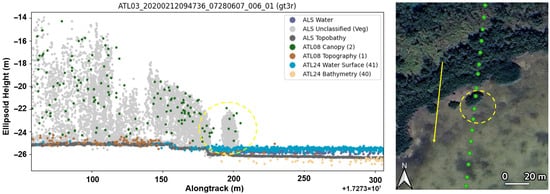
Figure 3.
Example of ICESat-2 detecting partially submerged vegetation, with ATLAS detecting the vegetation, water surface, and bathymetric surface. In this example, the ATL08 and ATL24 algorithms accurately resolve the vegetation canopy, water surface, and underlying bathymetry. For the map in the right, the green dots represent the path of the ICESat-2 ground track, with the yellow arrow representing the alongtrack direction. The dashed yellow circle in both the left and right figure identify the same partially submerged tree.
At the same time, some instances can be more ambiguous to determine effective classification, even with the assistance of ALS. In Figure 4, a portion of ICESat-2 was measured that was either ground, shallow water, or highly turbid water in the presence of vegetation. Examples like this illustrate the difficulty of determining the difference between ground surface, water surface, and bathymetric surface, given the intertidal nature of mangroves, compounded by being composed largely of dense, shrubby vegetation.
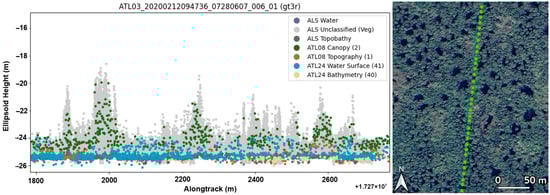
Figure 4.
Example of ICESat-2 data in an ambiguous location, where it is unclear if the surface is truly ground, water, or bathymetric surface. For the map in the right, the green dots represent the path of the ICESat-2 ground track.
3.1.2. Assessment of Topography and Bathymetry
The study compared the accuracy of ICESat-2 ATL08 terrain, ATL24 bathymetry to ALS data topobathy surface. For ATL24 bathymetry, strong-beam, night-time ICESat-2 data performed best within USGS-defined mangroves, achieving an RMSE of 0.25 m for 10 m segments and 0.31 m for 30 m segments.
For ATL08 terrain, weak-beam, day-time data performed best in USGS-defined mangroves when compared to ALS data. However, this combination had the fewest samples and could be the result of only high-confident terrain surfaces being identified and classified. Nevertheless, within USGS mangroves, the strong-beam night-time acquisition reported an RMSE of 0.29 m for 10 m data and 0.42 m for 30 m, which is comparable with other works that examined the accuracy of ATL08 classifications when compared to ALS data [26]. The ALS comparison results can be found in Table 2 for ATL08 terrain, ATL24 bathymetry validation, and ATL08 canopy validation.
Table 2.
Table outlining error metrics of ICESat-2 ATL08 terrain, ATL24 bathymetry, and ATL08 canopy. The best performance on ICESat-2 data was from strong-beam night-time, with a RMSE of 0.42 m for terrain elevation, a RMSE of 0.31 m for bathymetry elevation, and RMSE of 1.26 m for canopy height for 30 m segments. Bolded rows highlight the strong-beam, night time measurements, which are considered the best quality.
3.1.3. Accuracy Assessment of Relative Canopy Heights to ALS and Other Products
Normalized canopy heights were calculated for both the ALS data and ICESat-2 data. The 98th percentile relative canopy height was calculated to assess the accuracy of relative canopy heights. When compared to the ALS topobathy surface, for 10 m ICESat-2 h_canopy had an RMSE of 1.63 m and 1.37 m for 30 m strong-beam night-time within USGS defined mangroves. ICESat-2 h_canopy also outperformed the gridded mangrove height products, observing an overestimation of canopy heights in the Gridded Mangrove Heights (2018) and an underestimation of canopy heights in this area, possibly due to differences in spaceborne laser altimetry missions used for each product. Table 3 shows the accuracy assessment of relative canopy heights to the ALS dataset.
Table 3.
Relative Canopy Height Accuracy compared to ALS data.
To examine the performance of ICESat-2 data to the gridded products and GEDI, only 30 m ICESat-2 measurements within 30 m of filtered GEDI canopy heights were examined. The ICESat-2 relative canopy heights outperformed both of the gridded mangrove height products examined, with the 2018 mangrove canopy height product having an RMSE of 5.23 m and the 2025 mangrove canopy height product having an RMSE of 3.98 m. In addition, the ICESat-2 strong-beam night-time canopy height measurements outperformed GEDI 98th percentile canopy height measurements, which had an RMSE of 1.542 m. Table 4 outlines the performance of ICESat-2 and GEDI canopy heights relative to ALS data stratified over different height ranges.
Table 4.
Filtered ICESat-2 vs. filtered GEDI canopy height error metrics relative to ALS stratified by relative height.
3.1.4. Conflicted Photons Analysis
“Contested photons” were also examined. Contested photons are photons classified by both the ATL08 and ATL24 algorithms—across all data in the mangrove areas. The analysis revealed a significant overlap between the two products. Over half of all photons examined (54.59%) were contested, receiving a classification label from both ATL08 and ATL24. In contrast, 29.36% of photons were only labeled by ATL08, 1.30% were only labeled by ATL24, and 14.74% remained unlabeled (Table 5).
Table 5.
Percentage of photons with conflicting or contested photon classifications in mangroves in the Florida Everglades National Park data.
When examining the percentage of contested photons within each specific class, the conflict was most pronounced for water surfaces. Nearly all (98.73%) of photons classified as ATL24 Water Surface (41) were contested, most commonly being confused with ATL08 Terrain (1) photons. ATL24 Bathymetry (40) photons also showed a high rate of conflict, with 54.72% being contested, also frequently confused with ATL08 terrain. Correspondingly, 66.87% of all ATL08 Terrain photons were contested. The ATL08 Canopy classifications (2, 3) were the most distinct, with only 22.69% of those photons being contested by the ATL24 algorithm (Table 6).
Table 6.
Percentage of contested photons by classification in mangroves in the Florida Everglades National Park data.
3.2. Global Analysis Results
3.2.1. Global Coverage and Characterization
The global dataset contains 142,796 km2 of mangrove forest ICESat-2 data across the six biogeographic regions: Atlantic Americas & Caribbean, Pacific Americas, West & Central Africa, East Africa & Middle East, South & Southeast Asia, and Australasia. Using the 10 m ATL08 vegetation-classified dataset, comprising approximately 2.2 million segments, the average measured canopy height was 8.29 m, and the largest concentration of heights was between 0.5 and 10 m, indicating shorter and shrubbier trees. Figure 5 represents the distribution of canopy heights.
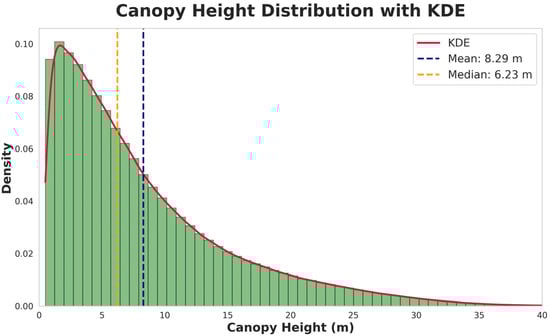
Figure 5.
Global canopy height distribution for mangroves observed by ICESat-2 along with the kernel density estimate (KDE). The distribution is right-skewed (skewness = 1.41), with a mean height of 8.29 m and a median height of 6.23 m. The kurtosis value of 2.02 indicates a distribution with more extreme tree height values compared to a normal distribution.
There was canopy variability across the different ROIs. The shortest measured heights were in the Pacific Americas and West and Central Africa with their median heights being around 5 m. The Atlantic Americas and Caribbean, Australasia, and South and Southeast Asia had median heights closer to 10 and had large variations in canopy height. Figure 6 shows the distribution of canopy heights for each ROI.
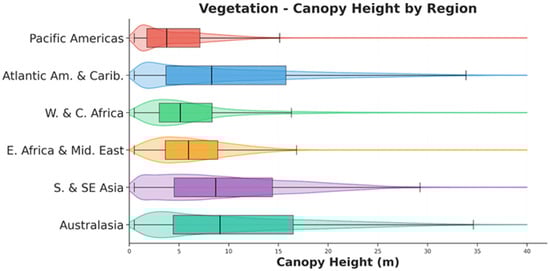
Figure 6.
Stratified canopy heights for mangroves observed by ICESat-2. Australasia has the tallest canopies (mean 11.19 m, median 9.11 m), followed by Atlantic Americas & Caribbean (mean 10.61 m) and South & Southeast Asia (mean 9.95 m). Pacific Americas shows the shortest (mean 4.85 m, median 3.76 m). All regions are right-skewed (0.77–2.54) with short stands with occasional taller forests. West & Central Africa shows highest kurtosis (9.28), indicating extreme variability.
For the vegetation data, night-time, strong-beam data produced the most robust measurements. The night-strong beams reported the most samples of any other combination, the greatest canopy heights, and the greatest number of ground photons measured. Strong beams generally reported the most canopy photons, though the strong-beam day time had marginally more average photon counts. Table 7 contains ICESat-2 vegetation and ground results grouped by acquisition type. When identifying seasonal variation impacts on vegetation heights, there were no major differences between the wet and dry seasons.
Table 7.
ICESat-2 acquisitions and their vegetation estimates. Weak-beam day-time acquisitions performed the poorest, registering the lowest mean canopy height (4.77–4.90 m across all regions), representing a possible underestimation of over 50% compared to the night-time strong-beam. The range of values represents the minimum and maximum mean value between all regions.
To assess bathymetry within the mangrove forests, the 10 m ATL24 dataset was utilized, comprising approximately 1.8 million high-confidence (>0.6) returns. The Atlantic Americas and Caribbean as well as Australasia had larger median depths (approaching 1 m) with wider variability. Figure 7 shows the global biogeographic region depths.
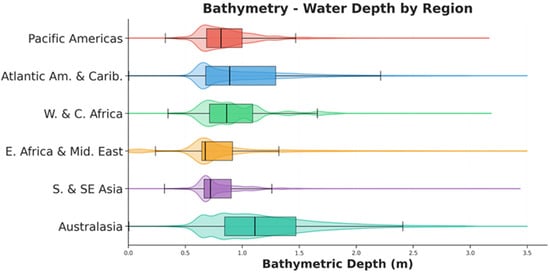
Figure 7.
Bathymetry instantaneous depths (surface_h − ortho_h) for each biogeographic region; Australasia has the deepest water penetration (mean = 1.21 m, median = 1.11 m). All regions have right-skewed distributions (skewness: 1.06–1.76) and distributions with heavy tails (kurtosis: 0.98–5.04) which indicates shallow measurements with occasional deeper values.
When investigating acquisition and beam strength’s effect on bathymetry detection, there were consistent shallow-water detections, with average measured depths spanning 0.96 m to 1.08 m across all groupings as shown in Table 8. Minimal seasonal differences were observed, with wet (rainy) season measurements (0.96–1.08 m) averaging slightly lower depths than dry season measurements (1.04–1.08 m).
Table 8.
ICESat-2 acquisitions and mean instantaneous depth. Mean depth range is the minimum and maximum of the mean regional depths.
3.2.2. Comparison with Global Mangrove Height Map and GEDI
The comparison between the 30 m ATL08 dataset’s 98th-percentile canopy heights and the GEDI L2B canopy heights revealed varying performances across height ranges. When comparing the difference between ICESat-2 and GEDI, the root mean squared difference (RMSD), mean absolute difference (MAD), and mean difference were used, as opposed to RMSE, MAE, and mean error, since these metrics were being used to examine the differences between these two systems and were not meant to assert accuracy. Through RMSD, MAD, and mean difference at different vertical height bins, ICESat-2 had a positive mean difference of 0.388 m relative to GEDI canopy heights. Across the larger vertical height bins, the mean difference switched from positive to negative. Table 9 contains comparison metrics of ICESat-2 and GEDI below 5 m, between 5 and 10 m, 10 and 20 m, and at canopy heights greater than 20 m.
Table 9.
Comparison of ICESat-2 and GEDI global mangrove canopy heights stratified by vertical height bins.
ICESat-2 increasingly underestimated heights compared to GEDI as overall canopy height increased. The mean difference increased from −0.199 m at 5–10 m to −2.467 m for the 10–20 m range and −6.349 m for canopies exceeding 20 m. The difference in metrics (RMSD and MAD) also increased greatly with canopy height.
When comparing GEDI with just the optimal acquisition setup—night-time strong- beam—the ICESat-2 and GEDI mangrove height comparison improved. For canopies >20 m, the RMSD was nearly halved, dropping from 11.45 m to 5.58 m. ICESat-2’s systematic underestimation at higher canopy heights was reduced by over 70%, decreasing from −6.349 m to −1.816 m. From 5–10 m to 10–20 m, the mean difference shifted from negative to positive. Table 10 shows the improved comparison. The strong-beam, night time measurements account for 23.9% of the total measurements.
Table 10.
Comparison of ICESat-2 (strong-beam night-time) and GEDI global mangrove canopy heights stratified by vertical height bins.
Compared to the initial height comparison, the strong-beam night-time acquisition had a better correlation, smaller RMSD, and smaller mean difference. Figure 8 shows plots with all ICESat-2 returns and just the optimal acquisition compared to GEDI.
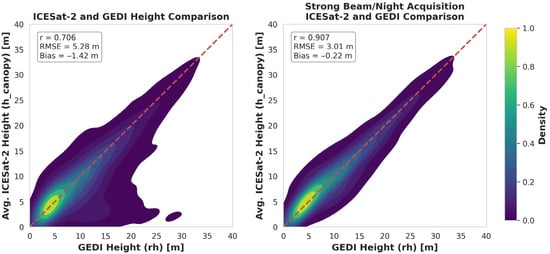
Figure 8.
Comparison of ICESat-2 vs. GEDI canopy height for all data and just the strong beam and night acquisitions. Density represents the normalized density with higher values denoting greater concentrations of co-located GEDI and ICESat-2 canopy height measurements. The strong beam/night time measurements account for 23.9% of the total measurements.
Taking just the strong-beam night-time ICESat-2 returns and comparing them with the gridded 12 m resolution data from Simard et al. [20], there were roughly 700,000 data points. There was an RMSD of 4.57 m and a MAD of 3.17 m globally. Figure 9 shows the RMSD and R2 between the two datasets for each biogeographic region.
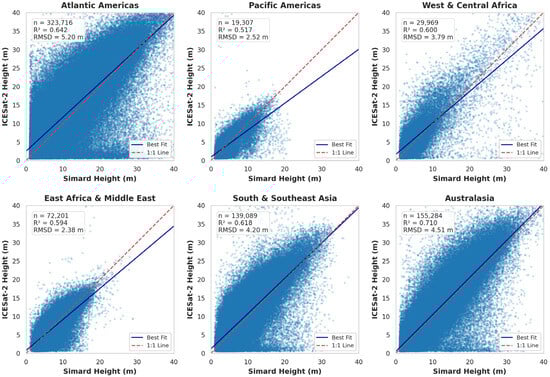
Figure 9.
Scatter plot comparison for ICESat-2 and Simard et al. [20] mangrove canopy heights grouped by ROI.
3.2.3. Potential Submerged Vegetation Detection Results
After matching the ATL08 and ATL24 data, ~50,000 matched vegetation/bathymetry data pairs (~2.5% of total data pre-filtering) remained. The mean canopy height (98th percentile) of the matched segments was 3.02 m, substantially shorter than the global mean of 8.29 m for all ATL08 segments. Figure 10 and Figure 11 show the global distribution and metrics of matched mangrove canopy and bathymetry. The small number of co-located canopy and bathymetric measurements from ATL08 and ATL24 could be due to the filtering of ATL24, which potentially exhibit low-confidence in complex, mangrove environments, in addition to false negative misclassifications of bathymetry.
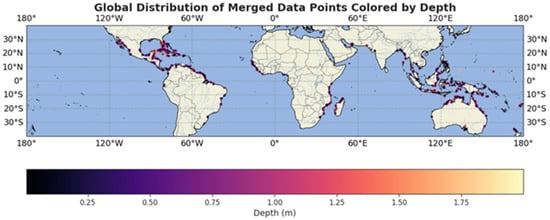
Figure 10.
Distribution of matched ICESat-2 canopy height and depths.
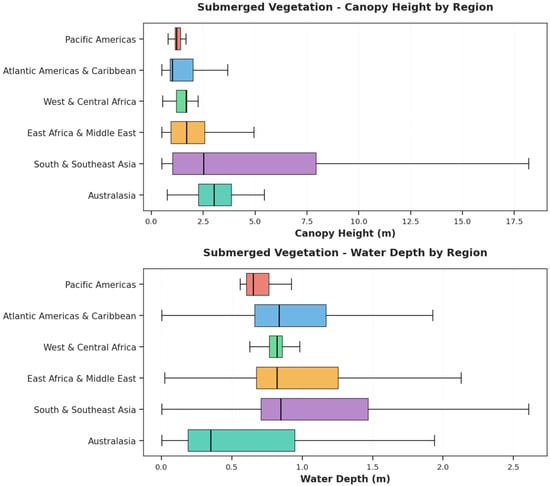
Figure 11.
Distribution of matched canopy heights and depths for each biogeographic region.
4. Discussion
4.1. ATL08 and ATL24 Performance
Results indicate that ICESat-2 can characterize terrain, bathymetry, and canopy in mangroves as well as it can in other environments, especially using strong-beam night-time data, yielding low error for bathymetry (RMSE 0.31 m for 30 m segments) and terrain (RMSE 0.42 m for 30 m segments) [27,34,35,36,37]. For the bathymetry component, bathymetric accuracies are similar to those found in nearby Marquesas Keys, Florida and Marathon, Florida found by Parrish et al. (2025), with RMSE of high-confidence photons of 0.36 m and 0.38 m, respectively [27]. This work conducted comparisons of ICESat-2 measurements and ALS by aggregating segments, while Parrish et al. [27] conducted their analysis on a per-photon basis.
The reported vertical accuracy of the reference ALS data (6.8 cm for terrain, 18.5 cm for bathymetry) is approximately an order of magnitude smaller than the retrieved ICESat-2 RMSE values (0.25–1.63 m). This accuracy gap confirms that the ALS dataset serves as a robust benchmark and that the reported errors are dominated by ICESat-2 retrieval uncertainties rather than reference data noise.
The terrain and canopy height results found in particular agree with those reported by Yu et al. (2021) that explicitly examined mangroves in Australia [26]. In their work, they found RMSEs of 0.69 m for terrain, and 2.18 m for canopy using 100 m ATL08. The improvement seen in the RMSE for vegetation could be due to improvements in the ATL08 classification algorithm between ATL08 Version 4 used in their work and ATL08 Version 6 used in this work, or possibly due to different characteristics of vegetation structure seen in the different mangroves.
4.2. Algorithmic Conflicts and “Contested Photons”
While the measured RMSE for bathymetry and terrain is low, the current ATL08 and ATL24 algorithms do not clearly differentiate between terrain, water surface, and bathymetry. This leads to a large number of contested photons, that is, photons that were classified both by the ATL08 and ATL24 algorithms. With the high number of contested photons between the ATL08 and ATL24 classifications, it is difficult to positively ascertain the difference between terrain, water surface, and bathymetry.
This may be due to insufficient algorithm tuning in these areas, lack of cross-product communication, and the complexity of mangrove environments. In particular, ATL24 was primarily trained and validated in coastal regions without mangroves. Meanwhile, ATL08 has been known to misclassify water surfaces as terrain and has not been explicitly trained to differentiate between water and terrain in all instances. In highly complex ecosystems such as mangroves, these algorithms struggle to clearly identify changes between terrain and water surface in these relatively flat intertidal zones. This is compounded by both products operating independently of each other, resulting in many contested photons, especially for terrain and water. This ambiguity prevents accurate water depth detection under canopy and could potentially be a cause of this work’s finding of the low 2.5% co-location rate of water under mangrove forest canopies.
4.3. Global Insights: ICESat-2 and GEDI
This study found that ICESat-2 can characterize terrain, bathymetry, and canopy structure in global mangrove ecosystems with patterns that both reinforce and extend findings from the Everglades National Park validation. The canopy metrics obtained as night-time, strong beam acquisitions were the most robust globally with highest canopy heights and number of ground photons, indicating good canopy penetration. This is consistent with the Florida analysis. Coastal bathymetry detection yielded consistent shallow water estimates globally around 1 m mean depth. The shallow depth range obtained is not solely dependent on sensor penetration limits. The mangrove mask restricted bathymetric observations to nearshore and mangrove adjacent areas, and these areas can be especially turbid.
One finding of this work is that ICESat-2 outperformed GEDI when measuring relative canopy heights in the Florida Everglades. Previous research has also established ICESat-2’s superior performance in shorter, shrubby forests in other ecosystems [38]. This may be due to ICESat-2 photon counting approach, smaller footprint and higher sensitivity to short vegetation compared to GEDI’s large-footprint waveform, which struggles to resolve short canopies from the ground signal. The global analysis of mangrove canopy heights also found they are mostly short in stature. Globally, mangroves are predominantly short stature, with a mean height of 8.29 m, a median height of 6.23 m, and the largest concentration between 0.5 and 10 m. This height distribution indicates ICESat-2 can be well-suited for mangrove applications. This work suggests that ICESat-2 should be used instead of or in combination with GEDI for certain ecosystems where shorter stature vegetation is present.
This work also demonstrates the limited potential to characterize partially submerged vegetation. While ICESat-2 has been used for surface water monitoring [39,40], there is less work for incorporating the bathymetric component in these ecosystems. The global investigation attempted to assess ICESat-2’s ability to determine submerged mangrove root structure; however, only a small number of matched segments (~2.5%) were found with the matched segments being substantially lower canopy heights (3.04 m vs. 8.29 98th percentile heights). The low matching rate could indicate that the current ATL24 algorithm and its confidence filter detects bathymetry predominantly in sparse/low vegetation. In the Florida Everglades validation, for segments with co-located data, the terrain-normalized canopy height (using the ATL08 ground) and the estimated topobathy-normalized canopy height (using the ATL24 bathymetric surface when available) was nearly identical. This suggests that these retrievals occurred in very shallow water, collections coincided with low-tide events, or result from conflicting photon classifications from ATL08 and ATL24.
4.4. Limitations
While this study demonstrates the potential of ICESat-2 for mangrove characterization, several limitations must be considered when interpreting the results, particularly regarding geographic generalizability and tidal dynamics.
First, the regional validation was confined to the Everglades National Park, a decision necessitated by the lack of publicly available, high-resolution topobathymetric airborne lidar in other mangrove regions. The Everglades is a micro-tidal environment with carbonate-based substrates and relatively clear water, representing a “best-case” scenario for bathymetric lidar retrieval. Consequently, the reported accuracy metrics (e.g., 0.25 m bathymetric RMSE) may serve as a benchmark but likely represent an upper bound on performance. Accuracy may degrade in more complex environments common to the Indo-Pacific, which are characterized by macro-tidal regimes, high turbidity, and siliciclastic sediments. Future work should prioritize validation in these diverse settings as coincident topobathymetric lidar or detailed field plots become available.
Second, this analysis did not explicitly model tidal dynamics. For the validation component, ICESat-2 bathymetric elevations were compared directly to the ALS topobathymetric surface relative to the WGS84 ellipsoid. Since bathymetric elevation (the vertical position of the seafloor) is static, the tidal stage does not directly bias this specific validation metric. However, it is important to contextualize the reported bathymetric RMSE of 0.25 m relative to the local tidal regime. The mean tidal range in the study area is approximately 0.76 m [41]. While ATL24 accounts for the instantaneous sea surface, the lack of explicit tidal modeling means that derived water depths (surface minus refraction-corrected bottom) contain unquantified uncertainty related to the tidal stage at the moment of acquisition. Future studies would benefit from integrating regional tidal models to validate sea surface elevations and refine water depth estimates.
Finally, the potential for detecting submerged vegetation and the detection of prop roots requires cautious framing. In the global analysis, the low rate of co-located bathymetry and canopy data (~2.5%) and the shallow mean depths of matched segments suggest that successful detection is currently limited to sparse canopies in optimal conditions. In other words, the ATL24 classification may be biased to measure water or bathymetry in mangrove forests where it is easier to measure these features, such as mangroves with lower vegetation densities. It is not yet feasible to reliably map submerged structures beneath dense, taller mangrove stands using standard products.
4.5. Future Work
Refining the ATL08 and ATL24 algorithms in determining the difference between water surface, topographic and bathymetric surfaces will greatly enhance accuracy for measuring other characteristics in mangroves, as well as allow for the use of ICESat-2 to detect water and water depths under forest canopies. Differentiating between water surface and terrain will also be useful in other coastal ecosystems where the divide between land and water surface can sometimes be less certain. Identification of the land-water divide could improve shoreline estimates, even in the presence of vegetation. This study represents a first-order assessment, but our findings highlight that the ATL08 and ATL24 algorithms are not yet fully integrated. Resolving the “contested photons” (Figure 2) and developing a unified land-water-bathymetry classification algorithm are the critical next steps.
Finally, findings with ICESat-2 outperforming GEDI in canopy height estimation suggest more accurate gridded canopy height models. The addition of ICESat-2 and GEDI could provide more accurate maps in addition to providing more high-quality measurements to model training and validation. In the ALS validation, ICESat-2 slightly outperformed GEDI canopy height measurements, while performing comparably to each other in the global analysis. Future global gridded mangrove products using both GEDI and ICESat-2 could benefit both from the inclusion of slightly more accurate canopy height measurements for shorter stature canopies, in addition to the added number of canopy height samples.
5. Conclusions
This initial assessment of ICESat-2’s capabilities in mangrove forests, at both a local (Florida, Everglades) and global scale, offers several key insights. First, demonstrated through regional validation against airborne lidar, ICESat-2’s standard products can accurately measure mangrove structure, with strong-beam, night-time retrievals yielding excellent accuracies for both ATL08 terrain (RMSE 0.42 m) and ATL24 bathymetry (RMSE 0.31 m). Globally, this makes ICESat-2 a valuable tool for characterizing mangrove heights, particularly for the world’s predominant short-stature canopies (<10 m) where the analysis shows it can outperform GEDI. However, this study provides the first quantitative evidence that simultaneous retrievals of canopy and bathymetry are rare, occurring in only 2.5% of segments and confined to sparse, low-canopy areas. This low co-location rate, driven by canopy occlusion and algorithmic conflicts, demonstrates that while ICESat-2 is a powerful tool for independent ecosystem monitoring, achieving integrated topobathymetric mapping beneath dense mangrove canopies is not yet feasible with the standard ATL08 and ATL24 products. Future work must focus on developing unified land-water-vegetation algorithms to unlock the full potential of ICESat-2 for integrated coastal monitoring.
Author Contributions
Conceptualization, M.R., E.G., L.M. and A.N.; methodology, M.R. and E.G.; writing—original draft preparation, M.R. and E.G.; writing—review and editing, L.M. and A.N. All authors have read and agreed to the published version of the manuscript.
Funding
This research was funded by NASA Grants 80NSSC23K044 and 80NSSC23K0976.
Data Availability Statement
The original data presented in this study are openly available at the following sources: ATL03 REL 006, ATL08 REL 006, and ATL24 REL 001 for the Everglades data analysis were accessed through NASA’s EarthDataSearch (https://search.earthdata.nasa.gov/search) (accessed on 10 January 2025). The ALS data used for the validation were accessed through NOAA’s Data Access Viewer (https://coast.noaa.gov/dataviewer/#/) (accessed on 10 January 2025). The ATL08 REL 006 and ATL24 REL 001 for the global analysis was accessed using the Sliderule platform (https://slideruleearth.io/) (accessed on 29 June 2025) and are originally distributed by NASA’s National Snow and Ice Data Center (NSIDC).
Acknowledgments
The authors would like to thank the research staff at the Center for Space Research for their support. They would also like to thank the scientists and engineers from ICESat-2. Additionally, the authors thank the anonymous reviewers for their comments.
Conflicts of Interest
The authors declare no conflicts of interest.
References
- Duke, N. Mangrove Floristics and Biogeography. In Tropical Mangrove Ecosystems; American Geophysical Union: Washington, DC, USA, 1992; pp. 63–100. [Google Scholar] [CrossRef]
- Montgomery, J.M.; Bryan, K.R.; Coco, G. The Role of Mangroves in Coastal Flood Protection: The Importance of Channelization. Cont. Shelf Res. 2022, 243, 104762. [Google Scholar] [CrossRef]
- Blankespoor, B.; Dasgupta, S.; Lange, G.-M. Mangroves as a Protection from Storm Surges in a Changing Climate. Ambio 2017, 46, 478–491. [Google Scholar] [CrossRef]
- Menéndez, P.; Losada, I.J.; Torres-Ortega, S.; Narayan, S.; Beck, M.W. The Global Flood Protection Benefits of Mangroves. Sci. Rep. 2020, 10, 4404. [Google Scholar] [CrossRef] [PubMed]
- Alongi, D.M. Carbon Sequestration in Mangrove Forests. Carbon Manag. 2012, 3, 313–322. [Google Scholar] [CrossRef]
- Lee, S.Y.; Primavera, J.H.; Dahdouh-Guebas, F.; McKee, K.; Bosire, J.O.; Cannicci, S.; Diele, K.; Fromard, F.; Koedam, N.; Marchand, C.; et al. Ecological Role and Services of Tropical Mangrove Ecosystems: A Reassessment. Glob. Ecol. Biogeogr. 2014, 23, 726–743. [Google Scholar] [CrossRef]
- Zhang, K.; Liu, H.; Li, Y.; Xu, H.; Shen, J.; Rhome, J.; Smith, T.J. The Role of Mangroves in Attenuating Storm Surges. Estuar. Coast. Shelf Sci. 2012, 102–103, 11–23. [Google Scholar] [CrossRef]
- Donato, D.C.; Kauffman, J.B.; Murdiyarso, D.; Kurnianto, S.; Stidham, M.; Kanninen, M. Mangroves among the Most Carbon-Rich Forests in the Tropics. Nat. Geosci. 2011, 4, 293–297. [Google Scholar] [CrossRef]
- Cosby, A.G.; Lebakula, V.; Smith, C.N.; Wanik, D.W.; Bergene, K.; Rose, A.N.; Swanson, D.; Bloom, D.E. Accelerating Growth of Human Coastal Populations at the Global and Continent Levels: 2000–2018. Sci. Rep. 2024, 14, 22489. [Google Scholar] [CrossRef]
- Duke, N.C.; Meynecke, J.-O.; Dittmann, S.; Ellison, A.M.; Anger, K.; Berger, U.; Cannicci, S.; Diele, K.; Ewel, K.C.; Field, C.D.; et al. A World Without Mangroves? Science 2007, 317, 41–42. [Google Scholar] [CrossRef]
- Valiela, I.; Bowen, J.L.; York, J.K. Mangrove Forests: One of the World’s Threatened Major Tropical Environments: At Least 35% of the Area of Mangrove Forests Has Been Lost in the Past Two Decades, Losses That Exceed Those for Tropical Rain Forests and Coral Reefs, Two Other Well-Known Threatened Environments. BioScience 2001, 51, 807–815. [Google Scholar] [CrossRef]
- Lovelock, C.E.; Cahoon, D.R.; Friess, D.A.; Guntenspergen, G.R.; Krauss, K.W.; Reef, R.; Rogers, K.; Saunders, M.L.; Sidik, F.; Swales, A.; et al. The Vulnerability of Indo-Pacific Mangrove Forests to Sea-Level Rise. Nature 2015, 526, 559–563. [Google Scholar] [CrossRef]
- Gilman, E.L.; Ellison, J.; Duke, N.C.; Field, C. Threats to Mangroves from Climate Change and Adaptation Options: A Review. Aquat. Bot. 2008, 89, 237–250. [Google Scholar] [CrossRef]
- Komiyama, A.; Ong, J.E.; Poungparn, S. Allometry, Biomass, and Productivity of Mangrove Forests: A Review. Aquat. Bot. 2008, 89, 128–137. [Google Scholar] [CrossRef]
- Saenger, P.; Snedaker, S.C. Pantropical Trends in Mangrove Above-Ground Biomass and Annual Litterfall. Oecologia 1993, 96, 293–299. [Google Scholar] [CrossRef]
- Giri, C.; Ochieng, E.; Tieszen, L.L.; Zhu, Z.; Singh, A.; Loveland, T.; Masek, J.; Duke, N. Status and Distribution of Mangrove Forests of the World Using Earth Observation Satellite Data. Glob. Ecol. Biogeogr. 2011, 20, 154–159. [Google Scholar] [CrossRef]
- Bunting, P.; Rosenqvist, A.; Lucas, R.M.; Rebelo, L.-M.; Hilarides, L.; Thomas, N.; Hardy, A.; Itoh, T.; Shimada, M.; Finlayson, C.M. The Global Mangrove Watch—A New 2010 Global Baseline of Mangrove Extent. Remote Sens. 2018, 10, 1669. [Google Scholar] [CrossRef]
- Jia, M.; Wang, Z.; Mao, D.; Ren, C.; Song, K.; Zhao, C.; Wang, C.; Xiao, X.; Wang, Y. Mapping Global Distribution of Mangrove Forests at 10-m Resolution. Sci. Bull. 2023, 68, 1306–1316. [Google Scholar] [CrossRef]
- Simard, M.; Rivera-Monroy, V.H.; Mancera-Pineda, J.E.; Castañeda-Moya, E.; Twilley, R.R. A Systematic Method for 3D Mapping of Mangrove Forests Based on Shuttle Radar Topography Mission Elevation Data, ICEsat/GLAS Waveforms and Field Data: Application to Ciénaga Grande de Santa Marta, Colombia. Remote Sens. Environ. 2008, 112, 2131–2144. [Google Scholar] [CrossRef]
- Simard, M.; Fatoyinbo, L.; Thomas, N.M.; Stovall, A.E.; Parra, A.; Barenblitt, A.; Bunting, P.; Hajnsek, I. A New Global Mangrove Height Map with a 12 Meter Spatial Resolution. Sci. Data 2025, 12, 15. [Google Scholar] [CrossRef] [PubMed]
- VanGraafeiland, K. NASA Global Mangrove Layer Now in the ArcGIS Living Atlas of the World; ArcGIS Blog: Redlands, CA, USA, 2025. [Google Scholar]
- Fatoyinbo, T.E.; Simard, M.; Washington-Allen, R.A.; Shugart, H.H. Landscape-scale Extent, Height, Biomass, and Carbon Estimation of Mozambique’s Mangrove Forests with Landsat ETM+ and Shuttle Radar Topography Mission Elevation Data. J. Geophys. Res. 2008, 113, 2007JG000551. [Google Scholar] [CrossRef]
- Fatoyinbo, T.E.; Simard, M. Height and Biomass of Mangroves in Africa from ICESat/GLAS and SRTM. Int. J. Remote Sens. 2013, 34, 668–681. [Google Scholar] [CrossRef]
- Duncanson, L.; Kellner, J.R.; Armston, J.; Dubayah, R.; Minor, D.M.; Hancock, S.; Healey, S.P.; Patterson, P.L.; Saarela, S.; Marselis, S.; et al. Aboveground Biomass Density Models for NASA’s Global Ecosystem Dynamics Investigation (GEDI) Lidar Mission. Remote Sens. Environ. 2022, 270, 112845. [Google Scholar] [CrossRef]
- Powell, E.; Dubayah, R.; Tully, K.; Laurent, K.S.; Duncanson, L.; Fatoyinbo, L. Spaceborne Lidar Observations Reveal Impacts of Inundation on Coastal Forest Structure across the U.S. Mid-Atlantic. Estuar. Coast. Shelf Sci. 2025, 323, 109372. [Google Scholar] [CrossRef]
- Yu, J.; Nie, S.; Liu, W.; Zhu, X.; Lu, D.; Wu, W.; Sun, Y. Accuracy Assessment of ICESat-2 Ground Elevation and Canopy Height Estimates in Mangroves. IEEE Geosci. Remote Sens. Lett. 2021, 19, 1–5. [Google Scholar] [CrossRef]
- Parrish, C.E.; Magruder, L.A.; Perry, J.; Holwill, M.; Swinski, J.P.; Kief, K. Analysis and Accuracy Assessment of a New Global Nearshore ICESat-2 Bathymetric Data Product. Earth Space Sci. 2025, 12, e2025EA004391. [Google Scholar] [CrossRef]
- Mangrove Species Profiles. Available online: https://www.floridamuseum.ufl.edu/southflorida/habitats/mangroves/species/ (accessed on 6 November 2025).
- OCM Partners. 2019 USGS Topobathy Lidar: West Everglades National Park, FL from 2010-06-15 to 2010-08-15; OCM Partners: Charleston, SC, USA, 2025. [Google Scholar]
- Neumann, T.; Brenner, A.; Hancock, D.; Robbins, J.; Gibbons, A.; Lee, J.; Harbeck, K.; Saba, J.; Luthcke, S.; Rebold, T. ATLAS/ICESat-2 L2A Global Geolocated Photon Data, 6th ed.; National Snow and Ice Data Center: Boulder, CO, USA, 2023. [Google Scholar]
- Shean, D.; Swinski, J.P.; Smith, B.; Sutterley, T.; Henderson, S.; Ugarte, C.; Lidwa, E.; Neumann, T. SlideRule: Enabling Rapid, Scalable, Open Science Forthe NASA ICESat-2 Mission and Beyond. J. Open Source Softw. 2023, 8, 4982. [Google Scholar] [CrossRef]
- Neuenschwander, A.; Pitts, K.; Jelley, B.; Robbins, J.; Markel, J.; Popescu, S.; Nelson, R.; Harding, D.; Pederson, D.; Klotz, B.; et al. ATLAS/ICESat-2 L3A Land and Vegetation Height, 6th ed.; National Snow and Ice Data Center: Boulder, CO, USA, 2023. [Google Scholar]
- Magruder, L.A.; Parrish, C.E.; Perry, J.; Swinski, J.P.; Holwill, M.; Kief, K.; Corcoran, F. ATLAS/ICESat-2 L3A Along Track Coastal and Nearshore Bathymetry, 1st ed.; National Snow and Ice Data Center: Boulder, CO, USA, 2025. [Google Scholar]
- Anil Kumar, G.; Chandra, R.; Narender, B. Validation of ICESat-2 ATLAS Data Using Airborne LiDAR Over Godavari River Basin. In Proceedings of the 2024 IEEE India Geoscience and Remote Sensing Symposium (InGARSS), Goa, India, 2–5 December 2024; pp. 1–4. [Google Scholar]
- Zhu, X.; Nie, S.; Wang, C.; Xi, X.; Li, D.; Li, G.; Wang, P.; Cao, D.; Yang, X.; Zhu, X.; et al. Estimating Terrain Slope from ICESat-2 Data in Forest Environments. Remote Sens. 2020, 12, 3300. [Google Scholar] [CrossRef]
- Neuenschwander, A.; Guenther, E.; White, J.C.; Duncanson, L.; Montesano, P. Validation of ICESat-2 Terrain and Canopy Heights in Boreal Forests. Remote Sens. Environ. 2020, 251, 112110. [Google Scholar] [CrossRef]
- Feng, T.; Duncanson, L.; Montesano, P.; Hancock, S.; Minor, D.; Guenther, E.; Neuenschwander, A. A Systematic Evaluation of Multi-Resolution ICESat-2 ATL08 Terrain and Canopy Heights in Boreal Forests. Remote Sens. Environ. 2023, 291, 113570. [Google Scholar] [CrossRef]
- Zhu, X.; Nie, S.; Zhu, Y.; Chen, Y.; Yang, B.; Li, W. Evaluation and Comparison of ICESat-2 and GEDI Data for Terrain and Canopy Height Retrievals in Short-Stature Vegetation. Remote Sens. 2023, 15, 4969. [Google Scholar] [CrossRef]
- Jasinski, M.; Stoll, J.; Hancock, D.; Robbins, J.; Nattala, J.; Morison, J.; Jones, B.; Ondrusek, M.; Pavelsky, T.; Parrish, C.; et al. ATLAS/ICESat-2 L3A Inland Water Surface Height, 2nd ed.; National Snow and Ice Data Center: Boulder, CO, USA, 2019. [Google Scholar]
- Renshaw, M.; Magruder, L.A. Advancing Scalable Methods for Surface Water Monitoring: A Novel Integration of Satellite Observations and Machine Learning Techniques. Geosciences 2025, 15, 255. [Google Scholar] [CrossRef]
- NOAA Tides & Currents: South Port Everglades, FL—Station ID: 8722956. Available online: https://tidesandcurrents.noaa.gov/stationhome.html?id=8722956#info (accessed on 19 December 2025).
Disclaimer/Publisher’s Note: The statements, opinions and data contained in all publications are solely those of the individual author(s) and contributor(s) and not of MDPI and/or the editor(s). MDPI and/or the editor(s) disclaim responsibility for any injury to people or property resulting from any ideas, methods, instructions or products referred to in the content. |
© 2025 by the authors. Licensee MDPI, Basel, Switzerland. This article is an open access article distributed under the terms and conditions of the Creative Commons Attribution (CC BY) license.