Abstract
The hydrological cycle in the Tibetan Plateau is experiencing notable changes in recent decades under a changing climate. The hydrological changes, however, are not well investigated due to the limitations in the availability of ground-based observations. In this study, by incorporating satellite-based observations into a hydrological modeling framework, seasonal and inter-annual dynamics of water balance for lakes in the northwest Tibetan Plateau are examined systematically for the period of 1990 to 2022. Satellite-based observations, including lake water area and water level, have been used to calibrate the hydrological model and to estimate lake water storage. The hydrological model performs satisfactorily, with the Nash–Sutcliffe efficiency coefficient (NSE) exceeding 0.5 for all 15 studied lakes. It is found that inflow contributes over 70% of annual water gain for most lakes, while percolation accounts for a larger portion (>60%) of total water loss than evaporation. The studied lakes have expanded substantially, with regional average increasing rates in lake level and water storage of 0.38 m/a and 3.12 × 10⁸ m3/a, respectively. Some lakes transitioned from shrinking to expanding around 1999, and expansion in most lakes has further accelerated since around 2012, primarily because of increased precipitation over the lake catchments, leading to greater inflow to the lakes. These findings provide important insights into understanding and predicting responses of lake water balance to climate change as well as for developing adaptative strategies.
1. Introduction
Lakes play a crucial role in biogeochemical processes and are irreplaceable in ensuring water resource security, maintaining ecological service functions, and protecting biodiversity [1,2]. Lakes, however, are highly sensitive to climate and hydrological changes, and are considered as sentinels, integrators, and regulators of environmental change [3,4,5]. Monitoring and modeling hydrological dynamics of lakes under changing climate and intensifying human activities are essential in sustaining human society and freshwater ecosystems worldwide.
The Tibetan Plateau is the highest and most lake-rich region in the world with a total lake area of about 50,000 km2 and 1424 lakes larger than 1 km2 [6]. The region is known as the Water Tower of Asia, serving as the source water of most of the largest rivers in Asia [7,8,9]. With the ongoing process of global warming, the Tibetan Plateau has become one of the most visibly affected regions in the world, with significant increases in temperature and precipitation [10,11,12]. This has profoundly impacted the regional hydrological cycle, leading to significant alterations in lake water balance in recent decades [13,14,15,16], which in turn affects the regional climate system, influencing plateau biomes, ecosystem functions, and human activities [17,18].
Despite increasing research efforts to understand changes in the hydrological cycle on the Tibetan Plateau, these changes remain insufficiently explored primarily due to limitations in ground-based observations. Consequently, satellite-based observations are increasingly vital for investigating hydrological dynamics in the region, particularly with recent advances in algorithms for retrieving hydrological variables (e.g., lake surface water extent and water level) and publicly available datasets [19,20,21,22,23]. For instance, satellite-based observations of lake area and level have been widely used in monitoring long-term changes in the terrestrial freshwater landscape on the Tibetan Plateau [24,25,26,27,28].
Additionally, remotely sensed datasets are increasingly utilized as model inputs, parameters, or observational references for calibrating and validating hydrological models [29,30]. Considerable research efforts have been dedicated to developing novel modeling frameworks that integrate satellite-based observations with hydrological models [31,32,33,34,35]. These integrated frameworks have proven to be powerful and valuable for regional hydrological research, particularly in data-scarce regions, as they enable the estimation of key hydrological variables that are not directly observable from remote sensing and facilitate the evaluation of their responses to external drivers [36,37,38,39,40].
The northwest Tibetan Plateau is characterized by harsh natural conditions and sparse population distribution. Due to limited data availability and the region’s poor accessibility, hydrological changes in lakes within this area are largely less known compared to those in the eastern Tibetan Plateau. Existing studies primarily relied on direct use of remote sensing data to examine changes in lake water levels or surface areas, often focusing on a limited number of lakes [41,42,43,44,45,46]. More systematic studies are expected to explore the dynamics of lake water balance in this region by integrating remote sensing observations with hydrological modeling.
This study aims to explore seasonal and inter-annual dynamics of water balance for lakes in the northwest Tibetan Plateau under a changing climate. A monthly hydrological model is formulated and calibrated for each lake against satellite-based observations to reconstruct the long-term time series of key water balance components for the period of 1990 to 2022. Seasonal and inter-annual variations of the water balance components are then investigated. The findings of this research are conducive to understanding the hydrological impacts of climate change in the Tibetan Plateau, informing the development of regional adaptative strategies.
2. Materials
2.1. Study Area
The study area (78°E–84°E, 32°N–36°N) is located in the northwest Tibetan Plateau and the southern slope of the western Kunlun Mountains, bordering Kashmir (Figure 1). The region has an average elevation of about 4840 m and receives less than 300 mm of annual precipitation, resulting in harsh living conditions. The lack of meteorological stations makes it a typical data-scarce region. The area includes 15 lakes with an area above 5 km2, the physical properties of which are given in Table 1. The surface area of these lakes ranges from 9 to 467 km2, with corresponding catchment areas varying from 543 to 25,306 km2.
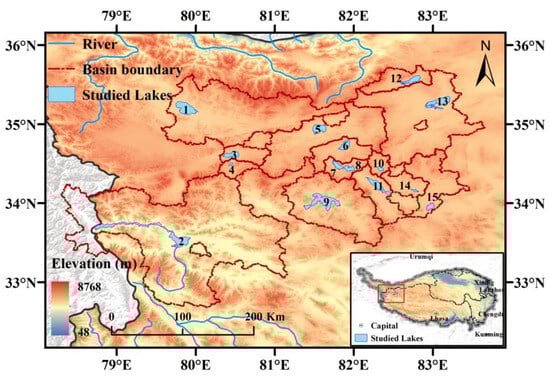
Figure 1.
Location of the study area and the studied lakes. The lake numbers correspond to the IDs in Table 1.

Table 1.
Characteristics of the lakes considered in this study. Altitude and lake areas are long-term means for the period of January 1990 to December 2022 based on satellite observations. Long-term mean annual precipitation, temperature, and potential evapotranspiration (PET) are estimated based on ERA5-Land for the period 1990–2022.
The cold and dry climate conditions in the region have led to a dense distribution of glaciers in the region. Using glacier boundaries from the Second Glacier Inventory Dataset of China (https://www.tpdc.ac.cn/home (accessed on 17 January 2024)), the lakes are classified based on the presence of glaciers within their corresponding catchments. It is found that except for Qagong Co, Xiajian Lake, and Katiao Co, the remaining lakes are all glacier-fed. All the 15 studied lakes are endorheic (closed basin) lakes with no surface outflow to the downstream.
2.2. Satellite-Observed Lake Area and Lake Level
Lake surface extent is a critical variable for estimating water storage. In this study, the lake surface extent is obtained from the Global Surface Water Explorer (GSWE) dataset developed by the European Commission’s Joint Research Centre [47]. This dataset, generated from over 3 million 30 m resolution Landsat satellite images, maps the location and temporal distribution of water surfaces at the global scale for the period of 1984 to 2020 on a monthly and annual basis. The monthly water history dataset used in this study (https://developers.google.cn/earth-engine/datasets/catalog/JRC_GSW1_4_MonthlyHistory (accessed on 6 November 2023)) is available on Google Earth Engine (GEE). This dataset classifies each pixel as either water or non-water. Since efficiency in identifying the water pixel can be affected when lakes are frozen, in this study, only lake areas of the largely ice-free months (May to October) are estimated. In addition, with the consideration of the influence of snow cover and cloud contamination, the Median Absolute Deviation (MAD) method is applied to exclude outliers, which are data points deviating more than three times the MAD value from the median [48].
The lake level data product used in this study is the High-space-coverage Lake Level Change Datasets on the Tibetan Plateau for the period of 2002 to 2021 (TPLL) [49]. This product provides water level above sea level change sequences for 364 lakes larger than 10 km2 on the Tibetan Plateau from 2002 to 2021 by processing and merging data from eight different altimetry missions. The dataset is found to be highly consistent (R2 > 0.97) with the lake level dataset (Hydroweb, https://hydroweb.theia-land.fr/ (accessed on 21 October 2023)) provided by the Laboratory for Spatial Geophysical and Oceanographic Studies (LEGOS), as evaluated with 37 common lakes over the entire Tibetan Plateau. The average lake level of a lake for each specific month is calculated as the mean of water level of all data points within the lake for that month.
2.3. Climate Forcings from ERA5-Land
The lake water balance model used in this study requires temperature, precipitation, and potential evaporation as inputs, which are obtained from the ERA5-Land dataset in this study. The ERA5-Land dataset is a high-resolution reanalysis product released by the European Centre for Medium-Range Weather Forecasts (ECMWF) [50]. This product was developed based on the land surface component of the ERA5 reanalysis, spanning from 1950 to the present. The spatial resolution of the ERA5-Land dataset is 0.1° × 0.1°, and the temporal resolution is 1 h. The gridded hourly data are aggregated to provide daily catchment or lake-wide mean temperature, precipitation, and potential evaporation for the full years from 1990 to 2020.
Considering possible uncertainties induced by climate forcings, the CMFD dataset [51,52] is also used in this study. The CMFD dataset is a gridded reanalysis dataset with a spatial resolution of 0.1° and a temporal resolution of 3 h. The CMFD dataset was produced by fusing station data, remote sensing products, and reanalysis datasets. It includes meteorological variables such as precipitation, temperature, air pressure, specific humidity, wind speed, shortwave radiation, and longwave radiation. Similarly, the dataset is aggregated for providing daily-catchment mean meteorological inputs for hydrological modeling for comparison.
3. Methods
In this study, a monthly hydrological model is developed together with a water storage model to estimate key water balance components of the studied lakes for the period 1990–2022. The components include two state variables (i.e., relative lake water storage and water level), two water gain items (i.e., lake-top precipitation and inflow), and two water loss items (lake evaporation and percolation). Lake level and surface area retrieved from multiple remote sensing data sources are used to determine the hypsometric curve of the lakes, which is then used to estimate relative water storage. Satellite-observed lake level was employed to calibrate and validate the hydrological model. For each lake, complete monthly time series of water balance components for the period 1990–2022 are reconstructed using the calibrated hydrological model and climate inputs from ERA5-Land. Seasonal and inter-annual dynamics of lake water balance are then investigated based on the reconstructed time series. Figure 2 illustrates the overall framework developed in this study, with specific details explained in the following sections.

Figure 2.
The overall framework for modeling dynamics of lake water balance.
3.1. Modeling the Monthly Lake Water Balance
The monthly hydrological model introduced in Wu et al. [53] is used in this study to simulate hydrological processes of the lakes in the northwest Tibetan Plateau for the period of 1990 to 2022. The model extends the monthly watershed water balance model proposed by Zhang et al. [54] by incorporating modules for glacial, snow, and lake water balance processes tailored to the hydrological characteristics of lakes in the Tibetan Plateau. The model has been successfully applied to Nam Co [53], which is the largest lake in the Tibetan Plateau.
For the water balance of the lake, it can be expressed as follows:
where represents the change in lake water level (mm), is lake-top precipitation (mm), is lake surface evaporation (mm), and are the catchment area and lake area (km2), and and refer to the lake inflow (mm) and outflow (mm). Here, is equal to the catchment runoff . is the ratio of lake area to total catchment area, which is used to convert catchment runoff depth to lake water inflow depth. Since all the studied lakes are endorheic, percolation to the groundwater () is considered as the only outflow loss of the lake system. According to Darcy’s law, percolation is estimated as follows [55,56]:
where is the hydraulic conductivity depending on the permeability of the soil or rock beneath the lake. The water level () is assumed to be equivalent to the water head in Darcy’s law. Lake evaporation is considered equal to potential evapotranspiration during the ice-free season and is assumed to be zero during the frozen season [57,58]. Equation (1) mechanistically links lake water level dynamics to catchment hydrology and in-lake processes. This critical linkage ensures that the model captures both catchment-scale water generation (via snow/glacier melt and runoff) and lake-specific water balance drivers. Further details about the model can be found in [53].
The required inputs of the model include monthly temperature (), precipitation (), and potential evaporation () for the simulation periods, all sourced from the ERA5-Land dataset. The model outputs include lake water level and water balance components such as inflow runoff, evaporation, and percolation. The model has 8 parameters to be calibrated. Due to the lack of ground-based observations of streamflow or lake level for calibration, satellite-observed monthly lake level together with a reliable lake level estimated based on the hypsometric curve (described in Section 3.2) are used to calibrate the hydrological model. The objective function used in model calibration is the Nash–Sutcliffe efficiency coefficient (NSE) [59], expressed as follows:
where is the satellite-observed lake water level, is the simulated lake water level, refers to the simulated or reconstructed value at time , and is the mean of the reconstructed values over the entire period. The NSE ranges from −∞ to 1, with a value greater than 0.5 indicating satisfactory model performance [60]. The model is validated using the monthly lake level series derived from satellite-based observation, and the evaluation metrics include R2, RMSE, and relative error percentage (REP) which is expressed as follows:
where and are the maximum and minimum lake water level observed by satellites during the studied period. The REP indicates the simulation error in relation to the fluctuation range of the water level. The REP defined here is with the consideration that water levels of the lakes in the Tibetan Plateau are all above 4000 m, which can lead to a very low percentage bias if it is not normalized.
3.2. Estimating Relative Lake Water Volume
The hydrological model produces lake water level as an output but does not directly simulate lake water volume. The simulated lake water level, however, can be used to estimate relative lake water volume, which is lake water storage relative to water storage at the first month of the simulation period, expressed as follows [61,62]:
where is lake water storage between the reference lake water level (i.e., water level at the first month) and the lake water level (Lt) at time . denotes the corresponding lake area as a function of lake water level. The function describes the hypsometric curve of a lake and is determined based on the remotely sensed lake area from GSWE and lake level from TPLL dataset for the period of 1990 to 2020.
The shape of a hypsometric curve generally can be approximated by linear, polynomial, exponential, logarithmic, or power functions [63,64]. With known hypsometric curves, relative lake water volume can be estimated by integrating Equation (5), resulting in volume–water level relationships (i.e., V-L function). Table 2 shows polynomial functions of hypsometric curves and their corresponding V-L functions. For the studied lakes, polynomial regression is conducted to find the best fitted hypsometric curves, with results shown in Table 3. It can be seen that the hypsometric curves are reliable, with R2 mostly above 0.5, and are statistically significant at the 0.05 level. It should be noted that, in developing the hypsometric curves, outliers have been removed by using the Cook’s distance method [65].
Table 2.
Function of hypsometric curve and the corresponding formula in estimating relative lake water storage.
Table 3.
The area–level relationship of the studied lakes.
4. Results
4.1. Model Performance
Figure 3 shows the performance of the hydrological model during the calibration phase by comparing the simulated monthly lake water level against that reconstructed lake level (including both satellite-observed lake water level and that reconstructed based on the hypsometric curves). The model performs well in most lakes with NSE above 0.5, while 12 out of the 15 lakes have an NSE above 0.7. Overall, the model performs better in lakes with larger catchment or lake area (e.g., HSN and LMJD) than in smaller lakes or catchments (e.g., LMC and XJL). One of the possible reasons for this can be because the lake level reconstructed based on hypsometric curves may have a relative lower quality for smaller lakes due to the limitations in spatial resolution and revisiting frequency of the sensors.
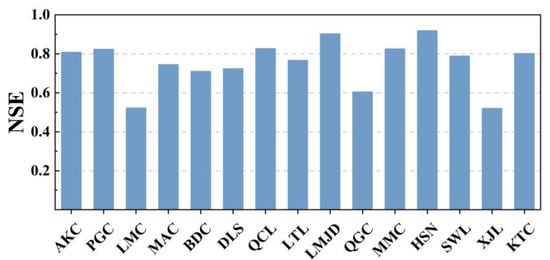
Figure 3.
Comparison of reconstructed and simulated lake levels during the model calibration phase.
The monthly time series of simulated and satellite-observed lake water levels for the studied lakes are shown in Figure 4. Overall, the satellite-based observations align well with the simulated lake water levels, with all lakes showing a coefficient of determination (R2) greater than 0.7, and as many as 12 lakes exhibiting R2 values exceeding 0.8. However, for some lakes, a few satellite observations exhibit significant deviations in specific values despite matching the general trends of the simulations such as AKC (RMSE = 2.96, REP = 45.08%) and KTC (RMSE = 5.01, REP = 36.12%), which show anomalously significant water level changes. The results indicate that the model may have limitations in capturing dramatic shifts in lake water levels caused by extreme hydroclimatic events or some satellite observations may have systematic bias needing to be corrected. Therefore, to better integrate remotely sensed data into hydrological modeling, it is essential to implement a strict quality check of the data to identify and filter out outliers that could significantly impact model calibration and validation. The filtering of the outliers, however, should be based on deep understanding of hydrological processes in the region and limitations in the remotely sensed data.

Figure 4.
Comparison of satellite-observed and simulated monthly lake levels for studied lakes for the period 1990–2022.
4.2. Seasonal Dynamics of Lake Water Balance
Based on the hydrological model and the model estimating relative water storage, monthly time series of water balance components are obtained for the period 1990–2022. These components include two state variables (water level L and relative water storage Vr), two water gain variables (lake-top precipitation P and inflow Q), and two water loss variables (lake evaporation ET and percolation PER). Long-term means of each component are calculated for each calendar month to demonstrate the seasonal dynamics of water balance of the studied lakes, presented in Figure 5 and Figure 6.
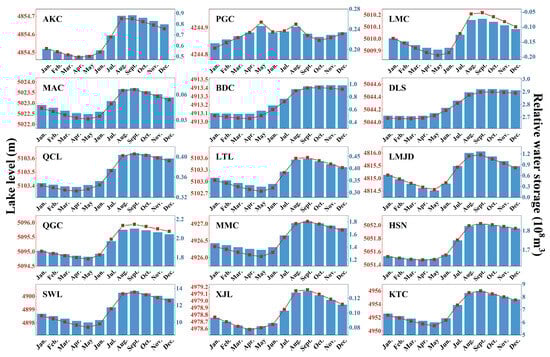
Figure 5.
Intra-annual variations in water level and relative water storage of the studied lakes. The red axis represents lake water level, corresponding to the red line; the blue axis represents relative water storage, corresponding to the blue bars.

Figure 6.
Intra-annual variation in water balance components of the studied lakes. Water gain components include lake-top precipitation and inflow (or catchment runoff). Water loss components considered include lake evaporation and percolation.
Figure 5 shows seasonal dynamics of the long-term mean monthly water level and relative water storage. Except for PGC, most studied lakes exhibit the highest water level and water storage in September or October while having the lowest level and storage around April or May. Among the studied lakes, the one with the largest intra-annual fluctuation in water level is KTC, with the highest water level at 4956.0 m in September and the lowest at 4950.8 m in May. Correspondingly, the relative water storage is 8.5 × 10⁸ m3 and 6.0 × 10⁸ m3, respectively. The strong fluctuation in water level and storage indicates intense water exchange and high renewability of the water in the lake. The PGC located at the lowest elevation but with the largest lake and catchment area has substantial different seasonal variation in lake level and water storage as compared with the other lakes. The water level of PGC reaches its highest in May and August (4244.9 m) but is at the lowest in January (4244.8 m), with fluctuation ranges within 0.1 m. The results are consistent with the findings of Zhaxi et al. [66]. This suggests that PGC maintains a much closer balance between water gain and loss throughout the year. The peak water level or storage observed in May can be because of contributions from glaciers and snowmelt.
Intra-annual variation of the water gain and loss components is illustrated in Figure 6, where the long-term monthly mean of each component is calculated based on the output of the hydrological model. For the two water gain components (lake-top precipitation and inflow, i.e., catchment runoff), the results show that they both peak between July and August in most catchments. The lake with the largest intra-annual fluctuation in inflow is KTC, partially explaining its water level fluctuations. For most lakes, inflow accounts for a large portion (>70%) of water gain throughout the year, particularly for AKC, LMC, BDC, and SWL. Inflow contributions typically peak during the wet months (May to October). However, for PGC, inflow is more evenly distributed throughout the year compared to most other lakes, which helps explain the relatively weaker fluctuations in its water level and storage.
The two main water loss components, lake evaporation and percolation, both peak in August, largely coinciding with the peak in water gain for most studied lakes. Among them, KTC has the highest evaporation (169 mm) and percolation (5069 mm) losses, while BDC has the lowest evaporation (17 mm) loss, and DLS has the lowest percolation (184 mm) loss. Percolation accounts for a larger portion (>60%) of total water loss than evaporation in most lakes. It is worth noting that percolation losses exhibit much slighter intra-annual variation than lake evaporation. In warmer summer months, in lakes such as PGC and DSL, evaporation contributes more than half of the monthly water losses.
4.3. Long-Term Changes in Lake Water Balance
Changes in estimated annual mean relative water storage and water level of the studied lakes for the period 1990–2022 are detected by the Mann–Kendall test [67] with a change rate calculated by the Theil–Sen approaches [68]. As shown in Figure 7, all the 15 lakes have experienced significant increase both in relative water storage and water level. Mean annual water storage of the 15 lakes has increased at a rate of 3.12 × 10⁸ m3/a, with a mean increase rate in water level of 0.38 m/a. Spatially, lakes located in the northeastern part of the study area generally experienced higher increase rates in water storage as compared to those in the southwestern part. On an annual scale, lakes with the largest increase rate in water storage are SWL (1.00 × 10⁸ m3/a), KTC (0.66 × 10⁸ m3/a), and BDC (0.43 × 10⁸ m3/a), while MAC has the lowest increase rate (0.005 × 10⁸ m3/a).

Figure 7.
Long-term trends of lake water storage and water level of the studied lakes for the period 1990–2022. The plot on the (left) shows the annual water storage change rate; the plot on the (right) shows the monthly time series of lake-wide mean water storage and water level, where the red axis represents lake water level corresponding to the red line, and the blue axis represents relative water storage corresponding to the blue line.
It is noted that changes in lake water storage and water level are not necessarily linear or with a constant change rate throughout the period (Figure 8). Turning points of the annual lake water storage and water level are identified by the piecewise linear regression approach [69]. Results have shown that lakes such as AKC, PGC, LMC, MAC, BDC, QCL, LMJD, and XJL exhibit a transition from a shrinking to an expanding trend around 1999—earliest in 1996 (e.g., PGC) and latest in 2000 (e.g., AKC). It indicates that these lakes may have experienced a negative water surplus (i.e., water gains smaller than water loss) before the turning point but positive water surplus thereafter. Since around 2012, the increase in water storage and water level has accelerated in most of the studied lakes, including AKC, LMC, MAC, BDC, QCL, LTL, QGC, MMC, HSN, SWL, and KTC, approximately following a power law. Meanwhile, the increasing trend is slowing down in MAC, LMJD, and XJL in recent years, particularly since 2018.

Figure 8.
Long-term changes in lake water storage and water level of the studied lakes for the period 1990–2022. The blue axis represents relative water storage, the red axis represents lake water level, and the color of the text labels for the rate of change corresponds to the respective axes. The green lines indicate the detected turning years.
The increasing trends in lake water storage and water level are primarily determined by increases in annual inflow to the lakes (Figure 9). Lakes with pronounced increases in inflow include BDC, SWL, and KTC, all with an increment rate above 30 mm/a. Though lakes such as XJL, MMC, and LTL have a significant increasing trend in lake-top precipitation, the increasing rate is around 2 mm/a. However, it is worth noting that a large portion of the inflow increase can be attributed to increased precipitation across the entire lake catchment, indicating considerable impacts of climatic change. For water loss components, except for KTC, SWL, and BDC, the increase in evaporation is much higher than that in percolation. Lakes with significant increase in evaporation such as XJL, LMJD, and LTL have an increasing rate above 1.25 mm/a. The increasing rate, however, is much lower than that of inflow and lake-top precipitation.

Figure 9.
Inter-annual variation of water budget components of lakes in the northwest Tibetan Plateau. Light blue represents precipitation, dark blue represents inflow, light green represents evaporation, and dark green represents percolation.
5. Discussion
5.1. Comparison with Existing Studies
Several existing studies have investigated long-term changes in lake area or water level within the study region based on remote sensing data though they have not systematically examined changes in lake water balance [42,44,45]. To further validate our findings, in this study, we have generated a complete monthly time series of water areas for the studied lakes based on simulated water levels and the hypsometric curves derived. Long-term trends of water area for each lake are then identified and compared against those reported in the existing studies. The results of this study are found to be consistent with existing studies, demonstrating the reliability of the methods used in this study. For example, the expansion rate of LMJD for the period 2001–2012 is 3.1 km2/a, which is 0.6 km2/a lower than that reported in [44]. Meanwhile, the expansion rate of AKC during 1996–2005 is around 6.2 km2/a, which is 1.0 km2/a higher than that reported in [42]. In addition, the water level change rate for MMC during 2016–2019 is estimated to be 0.65 m/a in this study, close to the 0.80 m/a reported in [45]. The difference between our simulation results and those of existing studies, however, suggests inherent uncertainties due to the methods and data used.
Existing studies [70,71] have examined changes in water storage for four lakes within our study region, including AKC, DLS, LMJD, and SWL. The results from [70] were based on estimated water storage for the years 2005, 2010, and 2015, while the results from [71] provided annual relative water storage for the period of 2002 to 2015. For comparison, we considered water storage changes over three periods: 2010 vs. 2005, 2015 vs. 2010, and 2015 vs. 2005. As shown in Figure 10, our results align more closely with those from Yao [71]. While there is a strong correlation between our findings and those of Zhang [70], Zhang’s estimates tend to show a higher rate of change, even when compared to Yao’s results. This suggests that the results derived from more complete and continuous time series are likely more reliable than those based on time-slice data, which may be more susceptible to biases introduced by outliers.

Figure 10.
Comparison of changes in relative lake water storage with existing studies. The results represented on the horizontal axis are from Yao [71], and those on the left (vertical) axis are from Zhang [70].
5.2. Uncertainty from Climate Data and Satellite-Based Observations
There are certain uncertainties in this study, due to the reliability of climate data and the satellite-based observations used. To examine the uncertainty introduced by meteorological data, we have compared the modeling results of LMJD, driven by two widely used climate datasets (ERA5-Land and CMFD) for hydroclimate research in the Tibetan Plateau. Figure 11 shows the two products have higher consistency in temperature (R2 = 0.95) and potential evaporation (R2 = 0.81) than in precipitation (R2 = 0.58). ERA5-Land generally reports higher precipitation than CMFD. The inconsistency in the two climate datasets has led to slight differences in model performance. With CMFD as input, the NSE of the modeled water level at LMJD is around 0.93, outperforming modeling results based on ERA5-Land (NSE = 0.902). It can be observed that modeling results based on the two climate datasets are highly consistent, with an R2 value of 0.91. However, it is important to note that the simulated lake levels using ERA5-Land are generally higher than those from CMFD, owing to the higher precipitation in ERA5-Land.

Figure 11.
Comparison of monthly precipitation (a), potential evaporation (b), temperature (c), and simulated lake water level (d) between ERA5-Land and CMFD for Lumajiangdong Co (LMJD) during 1990–2018. In panel (d), the right axis represents satellite-observed lake water level.
It is important to note that uncertainties may also arise from the satellite-derived lake water levels and hypsometric curves. Since lake level observations are used to calibrate and validate the hydrological model, their quality can significantly influence model performance and simulation outcomes. Together with lake area data, the quality of lake level observations also affects the robustness of the fitted hypsometric curves, thereby introducing uncertainty into the estimation of lake water storage. Although the satellite-based datasets used in this study have demonstrated high reliability, careful quality control remains essential before applying them to assess water balance dynamics in a specific lake. In the future, the establishment of ground observation stations in key lake regions, combined with remote sensing data, could improve the accuracy of lake level and water volume monitoring, further optimizing the model calibration. Additionally, the use of multi-source remote sensing data (such as SAR, InSAR, and high-precision satellite altimetry data) will help improve the accuracy of lake boundary and water level extraction, reducing the uncertainty introduced by a single data source.
5.3. Applicability and Limitations of the Modeling Framework
In the recent two decades, substantial expansion of lakes has been observed in the Tibetan Plateau [46,72] owing to changes in lake water balance, which, however, has not been well investigated, particularly for regions with limited ground-based hydrological observations. In this study, a monthly hydrological model was developed and calibrated against satellite-based observations. The modeling framework performs satisfactorily in generating complete and continuous monthly time series of key water balance components, including lake water storage, water level, inflow, evaporation, and percolation. It enables the exploration of lake water balance dynamics under a changing climate in the northwestern Tibetan Plateau and across the entire plateau.
However, the current hydrological model is designed specifically for endorheic lakes. To apply it to exorheic lakes, modifications would be necessary, particularly to account for lake outflows. Additionally, due to data limitations, certain hydrological processes, such as lake evaporation and lake–groundwater interactions, are simplified in the present model. In the future, integrating this model with a lake energy balance model and a groundwater model could enhance its ability to quantify lake water balance dynamics.
6. Conclusions
This study investigates the dynamics of water balance of lakes in data-scarce regions such as the northwest Tibetan Plateau by incorporating a hydrological model with observations from multiple satellites. Satellite-based observations, including lake water area and water level, have been used to calibrate the hydrological model and to formulate the water storage model. The hydrological model performs satisfactorily, with an NSE exceeding 0.5 for all 15 lakes. This provides a robust foundation for investigating seasonal and inter-annual variations in lake water balance.
It is found that most studied lakes reach their highest water level and water storage in September and October, while the lowest level and storage is reached in April and May. Inflow contributes over 70% of annual water gain for most lakes, peaking during the wet months (May to October). Percolation accounts for a larger portion (>60%) of total water loss than evaporation in most lakes, but with lower seasonal variation. For the period 1990–2022, lakes in the northwest Tibetan Plateau generally exhibit a significant expansion trend, with an average increasing rate of 0.38 m/a in lake level and 3.12 × 10⁸ m3/a in water volume. Spatially, lakes in the northeastern part of the study area show higher increase rates compared to those in the southwestern part. Some lakes transitioned from shrinking to expanding around 1999, and expansion in most lakes has further accelerated since around 2012. Analysis of water budget components reveals that the increasing trends in lake water storage and level are primarily driven by increases in annual inflow, largely attributed to increased precipitation across the lake catchments, highlighting the considerable impact of climate change.
The method developed in this study provides important support for future research on assessing lake responses to a changing climate, though with uncertainties inherited from the model and satellite-based observations. By combining climate projection data with the improved model, the future changes in lake water balance can be predicted, providing scientific guidance for the development of climate change adaptation and ecological protection strategies.
Author Contributions
Conceptualization, Y.W.; Data curation, J.Y.; Funding acquisition, Y.W.; Investigation, H.C. and X.T.; Methodology, J.Y. and Y.W.; Software, J.Y. and Y.W.; Supervision, Y.W.; Validation, Y.R. and S.Z.; Visualization, J.Y. and Y.R.; Writing—original draft, J.Y.; Writing—review and editing, Y.W. All authors have read and agreed to the published version of the manuscript.
Funding
This work was supported by the Natural Science Foundation of China under Grant 42371142 and the National Key R&D Program of China (Grant No. 2024YFF0808302).
Data Availability Statement
The original contributions presented in this study are included in the article. Further inquiries can be directed to the corresponding author.
Acknowledgments
We gratefully acknowledge the European Centre for Medium-range Weather Forecasts for providing the long-term reanalysis datasets, which are public and available at https://cds.climate.copernicus.eu/ (accessed on 14 January 2024).
Conflicts of Interest
The authors declare no conflicts of interest.
Abbreviations
The following abbreviations are used in this manuscript:
| CMFD | China Meteorological Forcing Dataset |
| GSWE | Global Surface Water Explorer |
| NSE | Nash-Sutcliffe efficiency coefficient |
| REP | Percentage relative error |
| TTPL | The High-space-coverage Lake Level Change Data Sets on the Tibetan Plateau for the period 2002 to 2021 |
References
- Huang, S.X.; Zhang, K.; Lin, Q.; Liu, J.B.; Shen, J. Abrupt ecological shifts of lakes during the Anthropocene. Earth-Sci. Rev. 2022, 227, 103981. [Google Scholar] [CrossRef]
- Messager, M.L.; Lehner, B.; Grill, G.; Nedeva, I.; Schmitt, O. Estimating the volume and age of water stored in global lakes using a geo-statistical approach. Nat. Commun. 2016, 7, 13603. [Google Scholar] [CrossRef] [PubMed]
- Jeppesen, E.; Brucet, S.; Naselli-Flores, L.; Papastergiadou, E.; Stefanidis, K.; Noges, T.; Noges, P.; Attayde, J.L.; Zohary, T.; Coppens, J.; et al. Ecological impacts of global warming and water abstraction on lakes and reservoirs due to changes in water level and related changes in salinity. Hydrobiologia 2015, 750, 201–227. [Google Scholar] [CrossRef]
- Tranvik, L.J.; Downing, J.A.; Cotner, J.B.; Loiselle, S.A.; Striegl, R.G.; Ballatore, T.J.; Dillon, P.; Finlay, K.; Fortino, K.; Knoll, L.B.; et al. Lakes and reservoirs as regulators of carbon cycling and climate. Limnol. Oceanogr. 2009, 54, 2298–2314. [Google Scholar] [CrossRef]
- Williamson, C.E.; Saros, J.E.; Schindler, D.W. Sentinels of Change. Science 2009, 323, 887–888. [Google Scholar] [CrossRef]
- Zhu, L.; Zhang, G.; Yang, R.; Liu, C.; Yang, K.; Qiao, B.; Han, B. Lake Variations on Tibetan Plateau of Recent 40 Years and Future Changing Tendency. Bull. Chin. Acad. Sci. 2019, 34, 1254–1263. [Google Scholar] [CrossRef]
- Immerzeel, W.W.; van Beek, L.P.H.; Bierkens, M.F.P. Climate Change Will Affect the Asian Water Towers. Science 2010, 328, 1382–1385. [Google Scholar] [CrossRef]
- Qiu, J. China: The third pole. Nature 2008, 454, 393–396. [Google Scholar] [CrossRef]
- Zhang, G.Q.; Chen, W.F.; Xie, H.J. Tibetan Plateau’s Lake Level and Volume Changes from NASA’s ICESat/ICESat-2 and Landsat Missions. Geophys. Res. Lett. 2019, 46, 13107–13118. [Google Scholar] [CrossRef]
- Gao, Q.Z.; Guo, Y.Q.; Xu, H.M.; Ganjurjav, H.; Li, Y.; Wan, Y.F.; Qin, X.B.; Ma, X.; Liu, S. Climate change and its impacts on vegetation distribution and net primary productivity of the alpine ecosystem in the Qinghai-Tibetan Plateau. Sci. Total Environ. 2016, 554, 34–41. [Google Scholar] [CrossRef]
- Niu, T.; Chen, L.X.; Zhou, Z.J. The characteristics of climate change over the Tibetan Plateau in the last 40 years and the detection of climatic jumps. Adv. Atmos. Sci. 2004, 21, 193–203. [Google Scholar] [CrossRef]
- Zhang, B.; Wu, Y.H.; Lei, L.P.; Li, J.S.; Liu, L.L.; Chen, D.M.; Wang, J.B. Monitoring changes of snow cover, lake and vegetation phenology in Nam Co Lake Basin (Tibetan Plateau) using remote SENSING (2000–2009). J. Great Lakes Res. 2013, 39, 224–233. [Google Scholar] [CrossRef]
- Barnett, T.P.; Adam, J.C.; Lettenmaier, D.P. Potential impacts of a warming climate on water availability in snow-dominated regions. Nature 2005, 438, 303–309. [Google Scholar] [CrossRef] [PubMed]
- Li, Y.K.; Liao, J.J.; Guo, H.D.; Liu, Z.W.; Shen, G.Z. Patterns and Potential Drivers of Dramatic Changes in Tibetan Lakes, 1972–2010. PLoS ONE 2014, 9, e111890. [Google Scholar] [CrossRef]
- Song, C.Q.; Huang, B.; Ke, L.H.; Richards, K.S. Seasonal and abrupt changes in the water level of closed lakes on the Tibetan Plateau and implications for climate impacts. J. Hydrol. 2014, 514, 131–144. [Google Scholar] [CrossRef]
- Wu, Y.H.; Guo, L.N.; Zheng, H.X.; Zhang, B.; Li, M.R. Hydroclimate assessment of gridded precipitation products for the Tibetan Plateau. Sci. Total Environ. 2019, 660, 1555–1564. [Google Scholar] [CrossRef]
- Li, B.Q.; Zhang, J.Y.; Yu, Z.B.; Liang, Z.M.; Chen, L.; Acharya, K. Climate change driven water budget dynamics of a Tibetan inland lake. Glob. Planet. Change 2017, 150, 70–80. [Google Scholar] [CrossRef]
- Zhang, G.Q.; Duan, S.Q. Lakes as sentinels of climate change on the Tibetan Plateau. All Earth 2021, 33, 161–165. [Google Scholar] [CrossRef]
- Mert, A.; Tavuç, I.; Özdemir, S.; Ulusan, M.D. Future Responses of the Burdur Lake to Climate Change and Uncontrolled Exploitation. J. Indian Soc. Remote Sens. 2025, 53, 1025–1036. [Google Scholar] [CrossRef]
- Zahribanhesari, M.; Nunziata, F.; Migliaccio, M.; Dabboor, M. Dual-Polarimetric Sar Imaging Modes to Monitor Lake Extent. In Proceedings of the IEEE International Geoscience and Remote Sensing Symposium (IGARSS), Athens, Greece, 7–12 July 2024; pp. 673–676. [Google Scholar]
- Bai, B.X.; Mu, L.X.; Ma, C.Y.; Chen, G.; Tan, Y.M. Extreme water level changes in global lakes revealed by altimetry satellites since the 2000s. Int. J. Appl. Earth Obs. Geoinf. 2024, 127, 103694. [Google Scholar] [CrossRef]
- Domgaard, M.; Kjeldsen, K.; How, P.; Bjork, A. Altimetry-based ice-marginal lake water level changes in Greenland. Commun. Earth Environ. 2024, 5, 365. [Google Scholar] [CrossRef]
- Liu, Z.; Chao, N.F.; Chen, G.; Zhang, G.Q.; Wang, Z.T.; Li, F.P.; Ouyang, G.C. Changes in monthly surface area, water level, and storage of 194 lakes and reservoirs in the Yangtze River Basin during 1990-2021 using multisource remote sensing data. Sci. Total Environ. 2024, 944, 173840. [Google Scholar] [CrossRef] [PubMed]
- Li, X.D.; Long, D.; Huang, Q.; Han, P.F.; Zhao, F.Y.; Wada, Y. High-temporal-resolution water level and storage change data sets for lakes on the Tibetan Plateau during 2000-2017 using multiple altimetric missions and Landsat-derived lake shoreline positions. Earth Syst. Sci. Data 2019, 11, 1603–1627. [Google Scholar] [CrossRef]
- Luo, S.X.; Song, C.Q.; Zhan, P.F.; Liu, K.; Chen, T.; Li, W.K.; Ke, L.H. Refined estimation of lake water level and storage changes on the Tibetan Plateau from ICESat/ICESat-2. Catena 2021, 200, 105177. [Google Scholar] [CrossRef]
- Zhang, G.; Wang, M.; Zhou, T.; Chen, W. Progress in remote sensing monitoring of lake area, water level, and volume changes on the Tibetan Plateau. Natl. Remote Sens. Bull. 2022, 26, 115–125. [Google Scholar] [CrossRef]
- Chen, C.T.; Li, X.Q.; Zhu, J.H.; Peng, H.L.; Xue, Y.H.; Zhai, W.L.; Lin, M.S.; Zhang, Y.F.; Liu, J.J.; Zhao, Y.L. Research on the Algorithm of Lake Surface Height Inversion in Qinghai Lake Based on Sentinel-3A Altimeter. Remote Sens. 2025, 17, 647. [Google Scholar] [CrossRef]
- Wu, J.; Ke, C.Q.; Cai, Y.; Duan, Z. Monitoring Multi-Temporal Changes of Lakes on the Tibetan Plateau Using Multi-Source Remote Sensing Data from 1992 to 2019: A Case Study of Lake Zhari Namco. J. Earth Sci. 2024, 35, 1679–1691. [Google Scholar] [CrossRef]
- Ali, M.H.; Popescu, I.; Jonoski, A.; Solomatine, D.P. Remote Sensed and/or Global Datasets for Distributed Hydrological Modelling: A Review. Remote Sens. 2023, 15, 1642. [Google Scholar] [CrossRef]
- Lee, S.; Kim, D.; McCarty, G.W.; Anderson, M.; Gao, F.; Lei, F.N.; Moglen, G.E.; Zhang, X.S.; Yen, H.W.; Qi, J.Y.; et al. Spatial calibration and uncertainty reduction of the SWAT model using multiple remotely sensed data. Heliyon 2024, 10, e30923. [Google Scholar] [CrossRef]
- Trabelsi, R.; Abida, H. Wetland water balance estimation in an arid region using remote sensing technology and hydrological modelling. Hydrol. Sci. J. 2024, 69, 905–922. [Google Scholar] [CrossRef]
- Lubczynski, M.W.; Leblanc, M.; Batelaan, O. Remote sensing and hydrogeophysics give a new impetus to integrated hydrological models: A review. J. Hydrol. 2024, 633, 130901. [Google Scholar] [CrossRef]
- Yoon, H.N.; Marshall, L.; Sharma, A. Evaluating the influence of hydrologic signatures on hydrological modeling using remotely sensed surrogate river discharge. J. Hydrol. 2024, 644, 132049. [Google Scholar] [CrossRef]
- Zheng, D.X.; Zhu, W.B.; Han, Y.; Lv, A.F. A novel remote sensing-based calibration and validation method for distributed hydrological modelling in ungauged basins. J. Hydrol. 2025, 658, 133119. [Google Scholar] [CrossRef]
- Zhou, F.R.; Wu, N.; Luo, Y.N.; Wang, Y.H.; Ma, Y.; Wang, Y.F.; Zhang, K. Improving Flood Streamflow Estimation of Ungauged Small Reservoir Basins Using Remote Sensing and Hydrological Modeling. Remote Sens. 2024, 16, 4399. [Google Scholar] [CrossRef]
- Lei, Y.B.; Yao, T.D.; Bird, B.W.; Yang, K.; Zhai, J.Q.; Sheng, Y.W. Coherent lake growth on the central Tibetan Plateau since the 1970s: Characterization and attribution. J. Hydrol. 2013, 483, 61–67. [Google Scholar] [CrossRef]
- Tong, K.; Su, F.G.; Xu, B.Q. Quantifying the contribution of glacier meltwater in the expansion of the largest lake in Tibet. J. Geophys. Res. Atmos. 2016, 121, 11158–11173. [Google Scholar] [CrossRef]
- Zhou, J.; Wang, L.; Zhang, Y.S.; Guo, Y.H.; Li, X.P.; Liu, W.B. Exploring the water storage changes in the largest lake (Selin Co) over the Tibetan Plateau during 2003–2012 from a basin-wide hydrological modeling. Water Resour. Res. 2015, 51, 8060–8086. [Google Scholar] [CrossRef]
- Zhou, J.; Wang, L.; Zhong, X.Y.; Yao, T.D.; Qi, J.; Wang, Y.W.; Xue, Y.K. Quantifying the major drivers for the expanding lakes in the interior Tibetan Plateau. Sci. Bull. 2022, 67, 474–478. [Google Scholar] [CrossRef]
- Biskop, S.; Maussion, F.; Krause, P.; Fink, M. Differences in the water-balance components of four lakes in the southern-central Tibetan Plateau. Hydrol. Earth Syst. Sci. 2016, 20, 209–225. [Google Scholar] [CrossRef]
- Qiao, B.; Zhu, L. Differences and cause analysis of changes in lakes of different supply types in the north-western Tibetan Plateau. Hydrol. Process. 2017, 31, 2752–2763. [Google Scholar] [CrossRef]
- Qiao, B.J.; Zhu, L.P.; Wang, J.B.; Ju, J.T.; Ma, Q.F.; Liu, C. Estimation of lakes water storage and their changes on the northwestern Tibetan Plateau based on bathymetric and Landsat data and driving force analyses. Quat. Int. 2017, 454, 56–67. [Google Scholar] [CrossRef]
- Liu, Y.T.; Yang, J.; Chen, Y.N.; Fang, G.H.; Li, W.H. The Temporal and Spatial Variations in Lake Surface Areas in Xinjiang, China. Water 2018, 10, 431. [Google Scholar] [CrossRef]
- Deji, Y.; Baima, R.; Baima, Y.; Qiangba, O.; Bian, D. Remote Sensing Monitoring of Lake Surface Changes in Lomachangdongtso Lake in Northwest Tibet in Recent 40 Years. Plateau Mt. Meteorol. Res. 2022, 42, 85–89. [Google Scholar] [CrossRef]
- Lei, Y.B.; Yao, T.D.; Tian, L.D.; Sheng, Y.W.; Lazhu; Liao, J.J.; Zhao, H.B.; Yang, W.; Yang, K.; Berthier, E.; et al. Response of downstream lakes to Aru glacier collapses on the western Tibetan Plateau. Cryosphere 2021, 15, 199–214. [Google Scholar] [CrossRef]
- Xu, F.L.; Zhang, G.Q.; Woolway, R.I.; Yang, K.; Wada, Y.; Wang, J.D.; Crétaux, J.F. Widespread societal and ecological impacts from projected Tibetan Plateau lake expansion. Nat. Geosci. 2024, 17, 516–523. [Google Scholar] [CrossRef]
- Pekel, J.-F.; Cottam, A.; Gorelick, N.; Belward, A.S. High-resolution mapping of global surface water and its long-term changes. Nature 2016, 540, 418–422. [Google Scholar] [CrossRef]
- Hampel, F.R. Influence Curve and Its Role in Robust Estimation. J. Am. Stat. Assoc. 1974, 69, 383–393. [Google Scholar] [CrossRef]
- Chen, J.; Liao, J.; Deng, W.; Shen, G.; Zhang, L.; Wang, C. High-Space-Coverage Lake Level Change Data Sets on the Tibetan Plateau from 2002 To 2021 Using Multiple Altimeter Data; Pangaea Data: San Francisco, CA, USA, 2021. [Google Scholar] [CrossRef]
- Muñoz Sabater, J. ERA5-Land Hourly Data from 1950 to Present. Copernicus Climate Change Service (C3S) Climate Data Store (CDS); European Union: Bruxelles, Belgium, 2019. [Google Scholar] [CrossRef]
- He, J.; Yang, K.; Tang, W.J.; Lu, H.; Qin, J.; Chen, Y.Y.; Li, X. The first high-resolution meteorological forcing dataset for land process studies over China. Sci. Data 2020, 7, 25. [Google Scholar] [CrossRef]
- Yang, K.; He, J.; Tang, W.J.; Lu, H.; Qin, J.; Chen, Y.Y.; Li, X. China Meteorological Forcing Dataset (1979–2018); National Tibetan Plateau/Third Pole Environment Data Center: Beijing, China, 2019. [Google Scholar] [CrossRef]
- Wu, Y.H.; Zheng, H.X.; Zhang, B.; Chen, D.M.; Lei, L.P. Long-Term Changes of Lake Level and Water Budget in the Nam Co Lake Basin, Central Tibetan Plateau. J. Hydrometeorol. 2014, 15, 1312–1322. [Google Scholar] [CrossRef]
- Zhang, L.; Potter, N.; Hickel, K.; Zhang, Y.Q.; Shao, Q.X. Water balance modeling over variable time scales based on the Budyko framework—Model development and testing. J. Hydrol. 2008, 360, 117–131. [Google Scholar] [CrossRef]
- Hipsey, M.R.; Bruce, L.C.; Boon, C.; Busch, B.; Carey, C.C.; Hamilton, D.P.; Hanson, P.C.; Read, J.S.; de Sousa, E.; Weber, M.; et al. A General Lake Model (GLM 3.0) for linking with high-frequency sensor data from the Global Lake Ecological Observatory Network (GLEON). Geosci. Model Dev. 2019, 12, 473–523. [Google Scholar] [CrossRef]
- Jones, R.N.; McMahon, T.; Bowler, J.M. Modelling historical lake levels and recent climate change at three closed lakes, Western Victoria, Australia (c.1840–1990). J. Hydrol. 2001, 246, 159–180. [Google Scholar] [CrossRef]
- Ma, N.; Szilagyi, J.; Niu, G.Y.; Zhang, Y.S.; Zhang, T.; Wang, B.B.; Wu, Y.H. Evaporation variability of Nam Co Lake in the Tibetan Plateau and its role in recent rapid lake expansion. J. Hydrol. 2016, 537, 27–35. [Google Scholar] [CrossRef]
- Qiao, B.J.; Zhu, L.P.; Yang, R.M. Temporal-spatial differences in lake water storage changes and their links to climate change throughout the Tibetan Plateau. Remote Sens. Environ. 2019, 222, 232–243. [Google Scholar] [CrossRef]
- Nash, J.E.; Sutcliffe, J.V. River flow forecasting through conceptual models part I—A discussion of principles. J. Hydrol. 1970, 10, 282–290. [Google Scholar] [CrossRef]
- Moriasi, D.N.; Gitau, M.W.; Pai, N.; Daggupati, P. Hydrologic and Water Quality Models: Performance Measures and Evaluation Criteria. Trans. Asabe 2015, 58, 1763–1785. [Google Scholar]
- Wu, Y.H.; Li, M.R.; Guo, L.N.; Zheng, H.X.; Zhang, H.Y. Investigating Water Variation of Lakes in Tibetan Plateau Using Remote Sensed Data Over the Past 20 Years. IEEE J. Sel. Top. Appl. Earth Obs. Remote Sens. 2019, 12, 2557–2564. [Google Scholar] [CrossRef]
- Zhang, H.; Wu, Y.; Liu, Y.; Guo, L. Water storage variation of the Qinghai Lake in recent decades based on satellite observation. Prog. Geogr. 2018, 37, 823–832. [Google Scholar]
- Busker, T.; de Roo, A.; Gelati, E.; Schwatke, C.; Adamovic, M.; Bisselink, B.; Pekel, J.F.; Cottam, A. A global lake and reservoir volume analysis using a surface water dataset and satellite altimetry. Hydrol. Earth Syst. Sci. 2019, 23, 669–690. [Google Scholar] [CrossRef]
- Schwatke, C.; Dettmering, D.; Seitz, F. Volume Variations of Small Inland Water Bodies from a Combination of Satellite Altimetry and Optical Imagery. Remote Sens. 2020, 12, 1606. [Google Scholar] [CrossRef]
- Kim, C.R. Cook’s distance in spline smoothing. Stat. Probab. Lett. 1996, 31, 139–144. [Google Scholar] [CrossRef]
- Zhaxi, N.; Nanmei, Z.; Fenfei, S.; Basang, G. Simulation of water level change in bangong lake and analysis of influencing factors. Water Resour. Hydropower Eng. 2022, 53, 95–99. [Google Scholar] [CrossRef]
- Mann, H.B. Nonparametric Tests Against Trend. Econometrica 1945, 13, 245–259. [Google Scholar] [CrossRef]
- Theil, H. A Rank-Invariant Method of Linear and Polynomial Regression Analysis, Part I. Indag. Math. 1950, 12, 173. [Google Scholar]
- Wang, X.H.; Piao, S.L.; Ciais, P.; Li, J.S.; Friedlingstein, P.; Koven, C.; Chen, A.P. Spring temperature change and its implication in the change of vegetation growth in North America from 1982 to 2006. Proc. Natl. Acad. Sci. USA 2011, 108, 1240–1245. [Google Scholar] [CrossRef]
- Guoqing, Z. Lake Volume Changes on the Tibetan Plateau During 1976–2020 (>1 km2) v2.0; National Tibetan Plateau/Third Pole Environment Data Center: Beijing, China, 2022. [Google Scholar] [CrossRef]
- Yao, F.; Wang, J.; Yang, K.; Wang, C.; Walter, B.A.; Crétaux, J.-F. High Resolution Data Set of Annual Lake Areas and Water Storage Across the Inner Tibet, 2002–2015; Pangaea Data: San Francisco, CA, USA, 2018. [Google Scholar] [CrossRef]
- Zhang, G.Q.; Yao, T.D.; Xie, H.J.; Yang, K.; Zhu, L.P.; Shum, C.K.; Bolch, T.; Yi, S.; Allen, S.; Jiang, L.G.; et al. Response of Tibetan Plateau lakes to climate change: Trends, patterns, and mechanisms. Earth-Sci. Rev. 2020, 208, 103269. [Google Scholar] [CrossRef]
Disclaimer/Publisher’s Note: The statements, opinions and data contained in all publications are solely those of the individual author(s) and contributor(s) and not of MDPI and/or the editor(s). MDPI and/or the editor(s) disclaim responsibility for any injury to people or property resulting from any ideas, methods, instructions or products referred to in the content. |
© 2025 by the authors. Licensee MDPI, Basel, Switzerland. This article is an open access article distributed under the terms and conditions of the Creative Commons Attribution (CC BY) license (https://creativecommons.org/licenses/by/4.0/).