
Modeling Dynamics of Water Balance for Lakes in the Northwest Tibetan Plateau with Satellite-Based Observations

 and
and
Abstract
1. Introduction
2. Materials
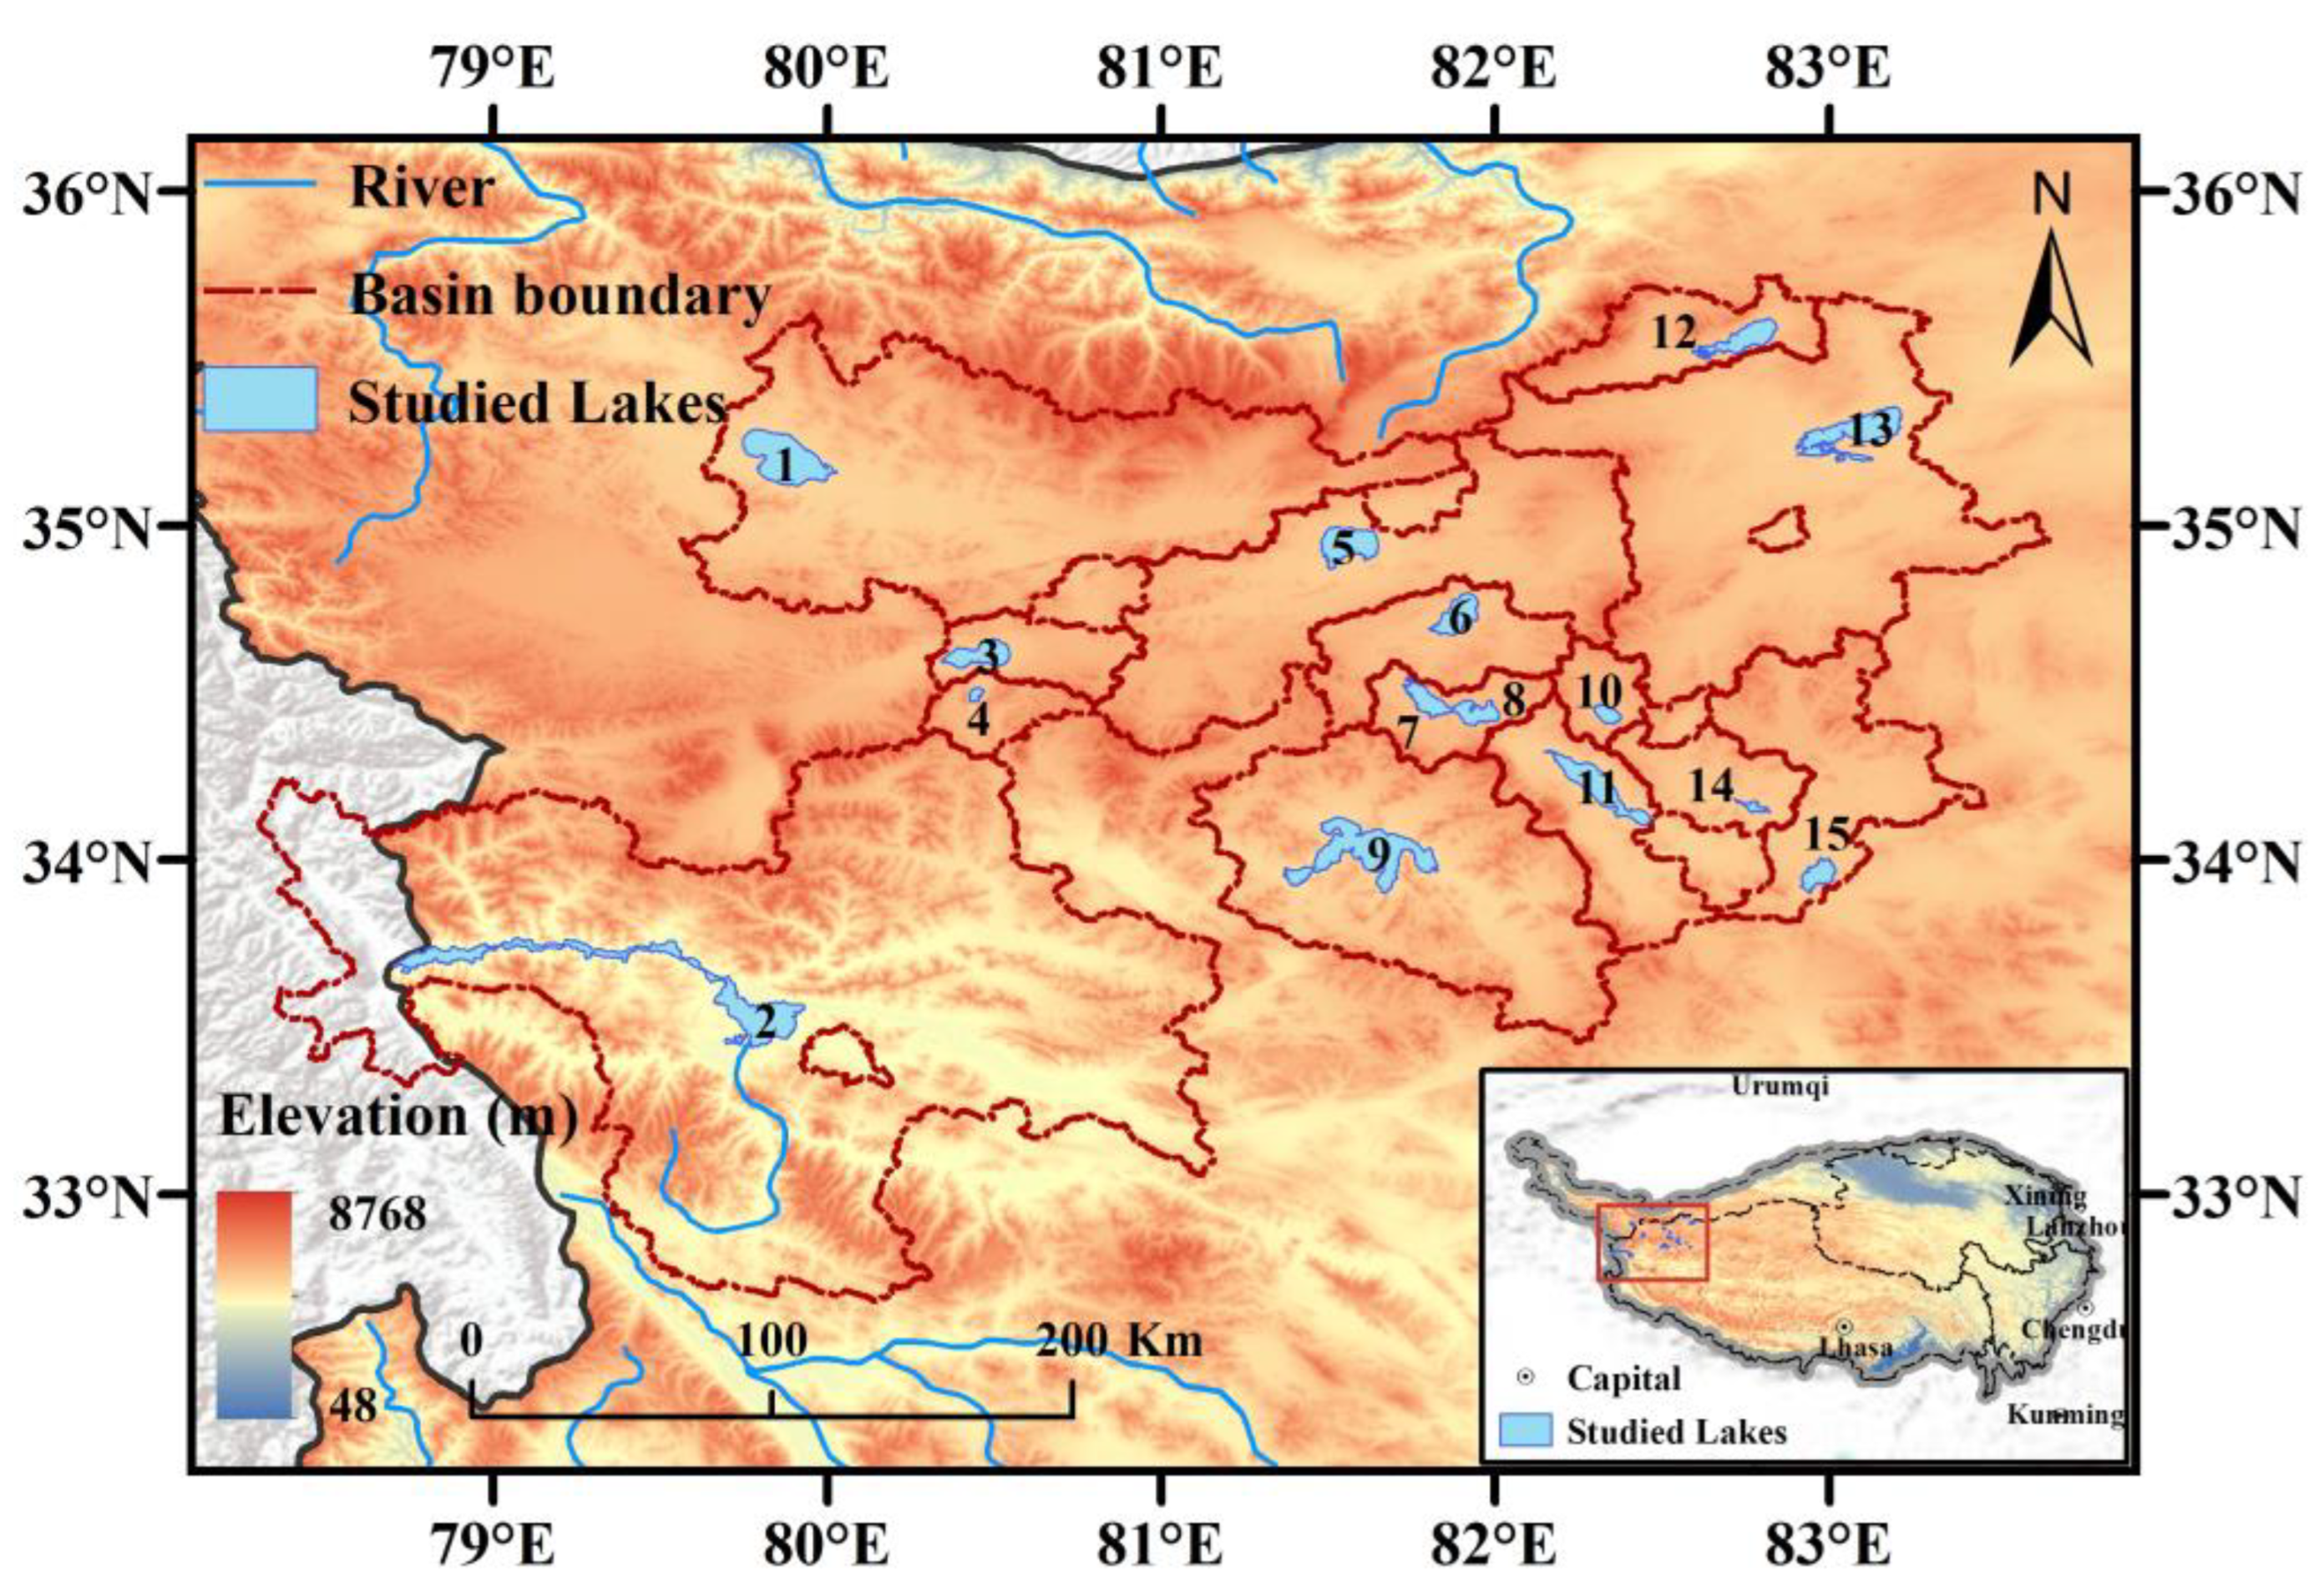
2.1. Study Area
2.2. Satellite-Observed Lake Area and Lake Level
2.3. Climate Forcings from ERA5-Land
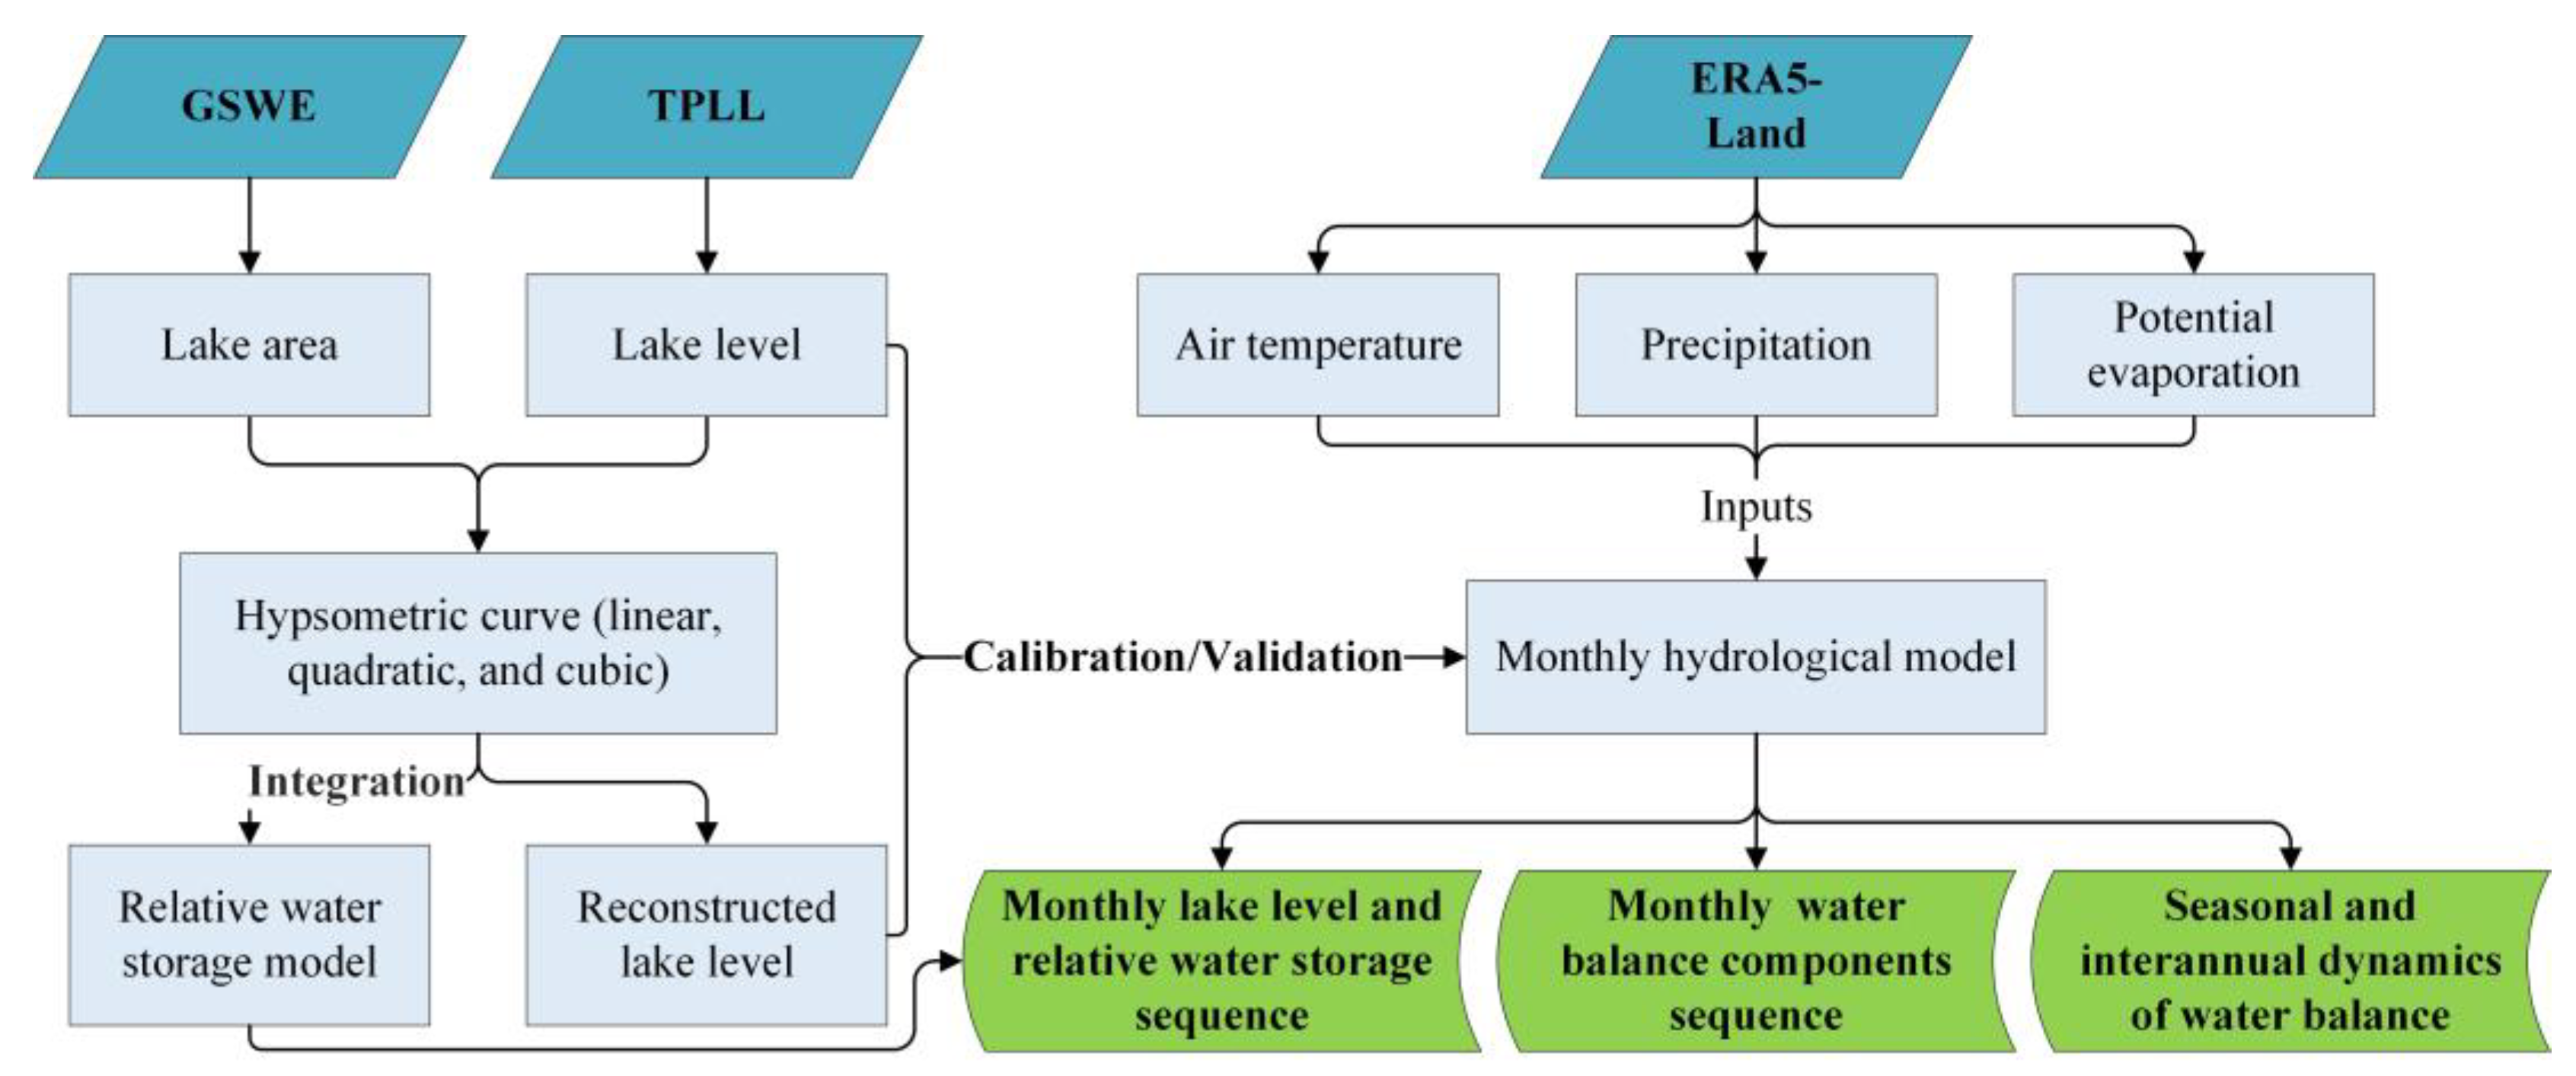
3. Methods
3.1. Modeling the Monthly Lake Water Balance
3.2. Estimating Relative Lake Water Volume
4. Results
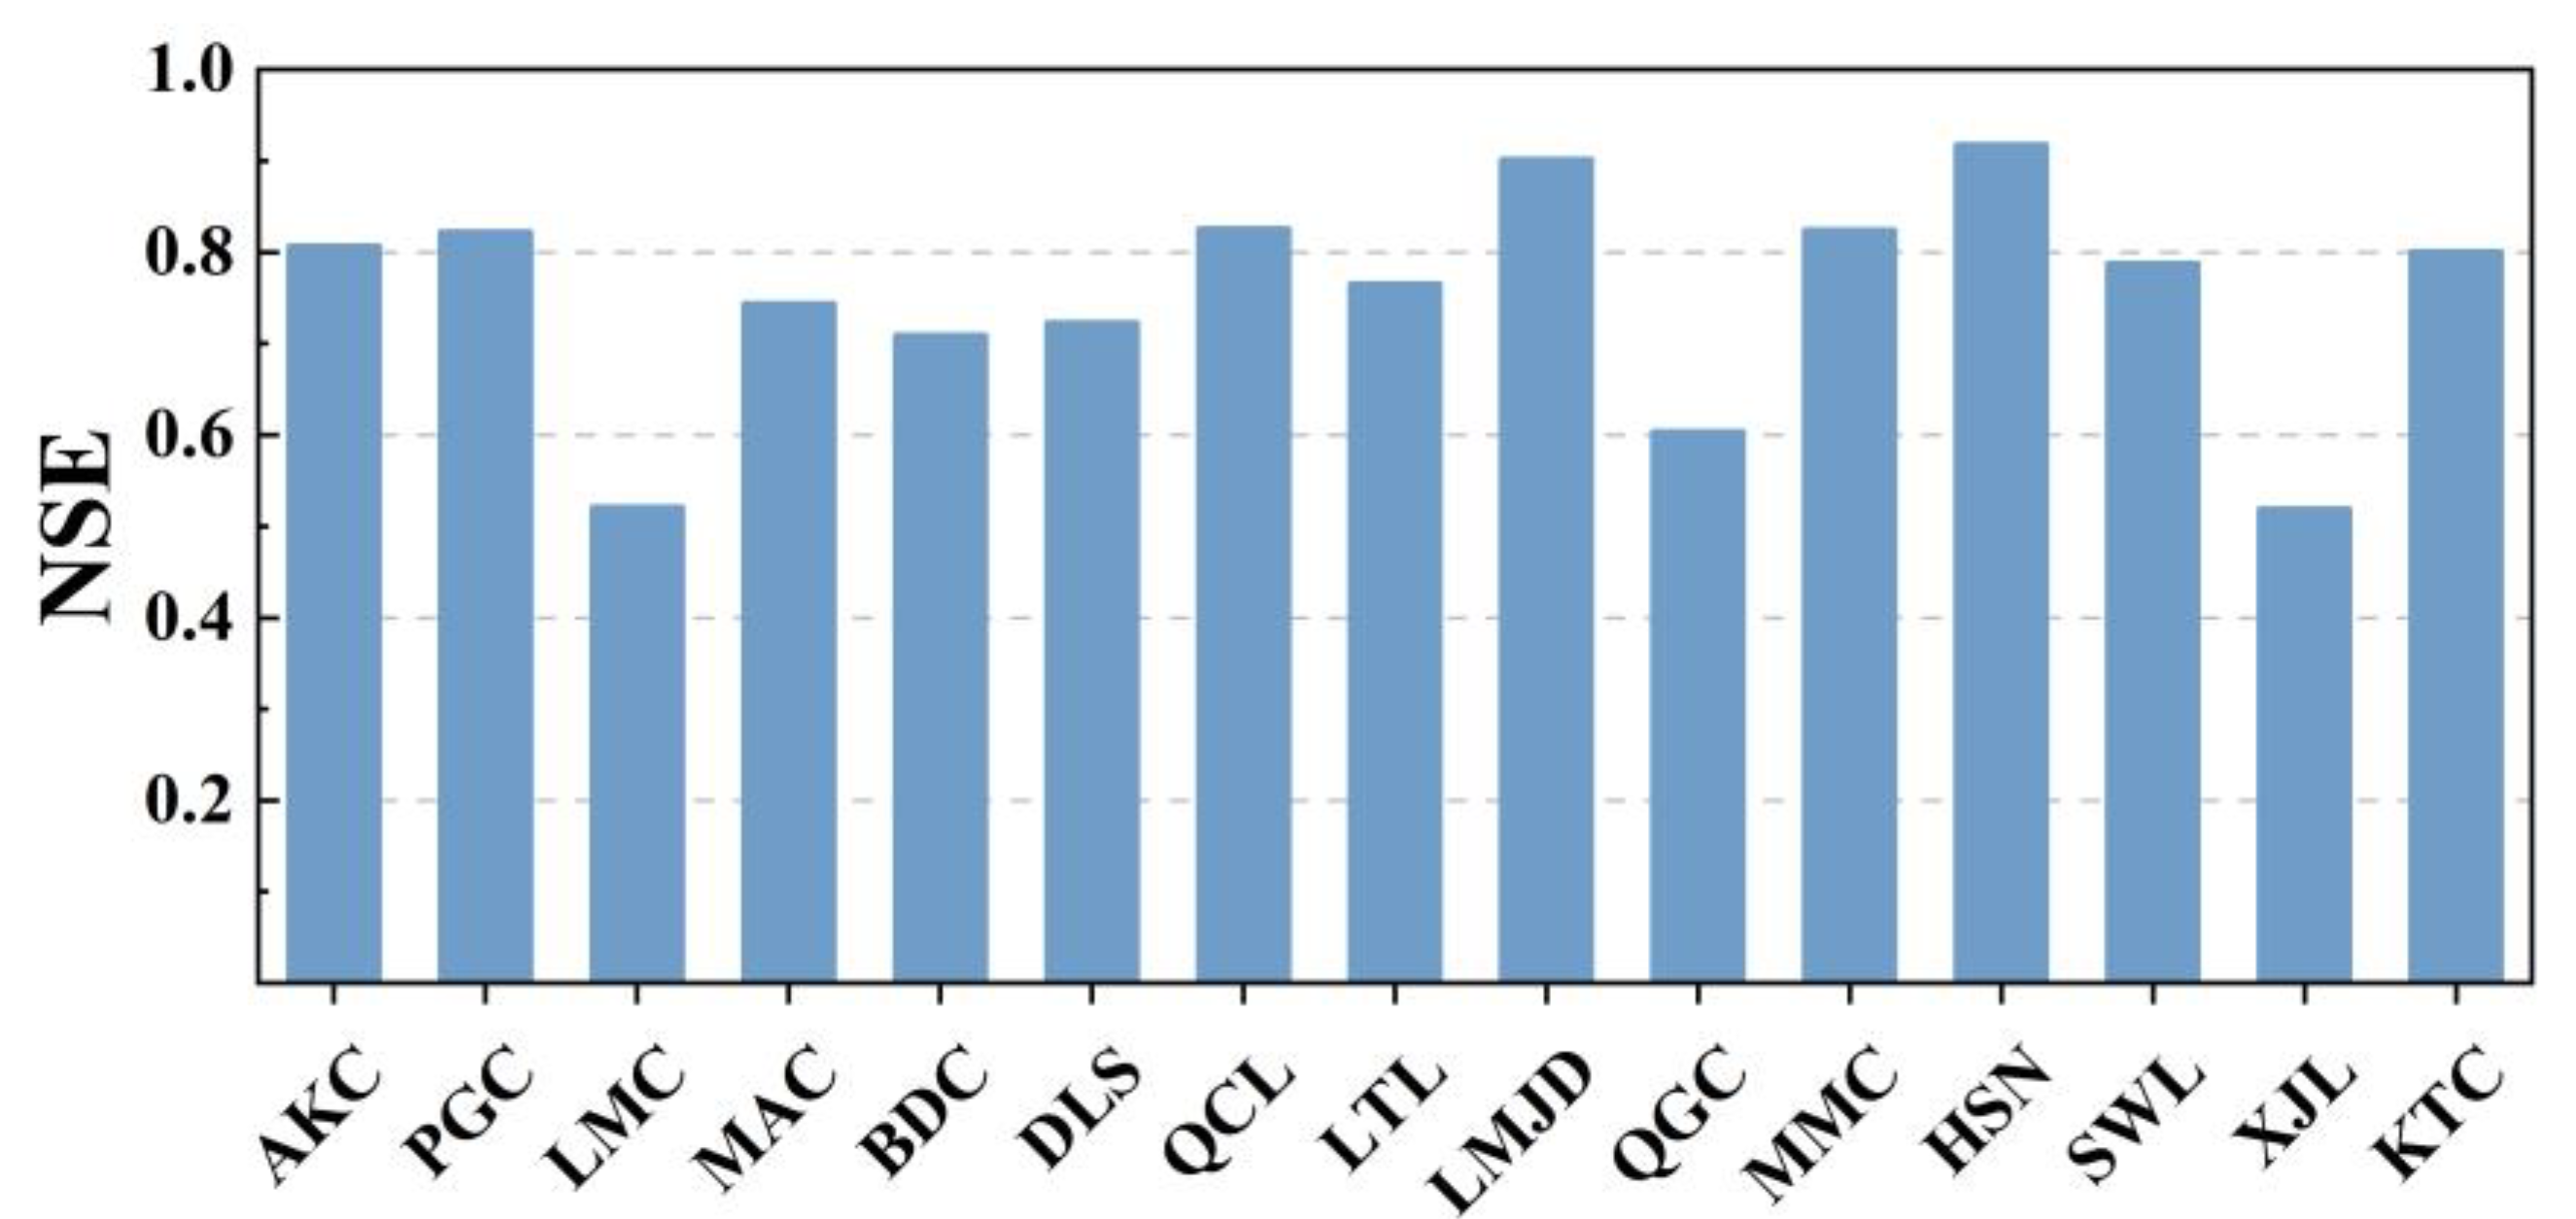
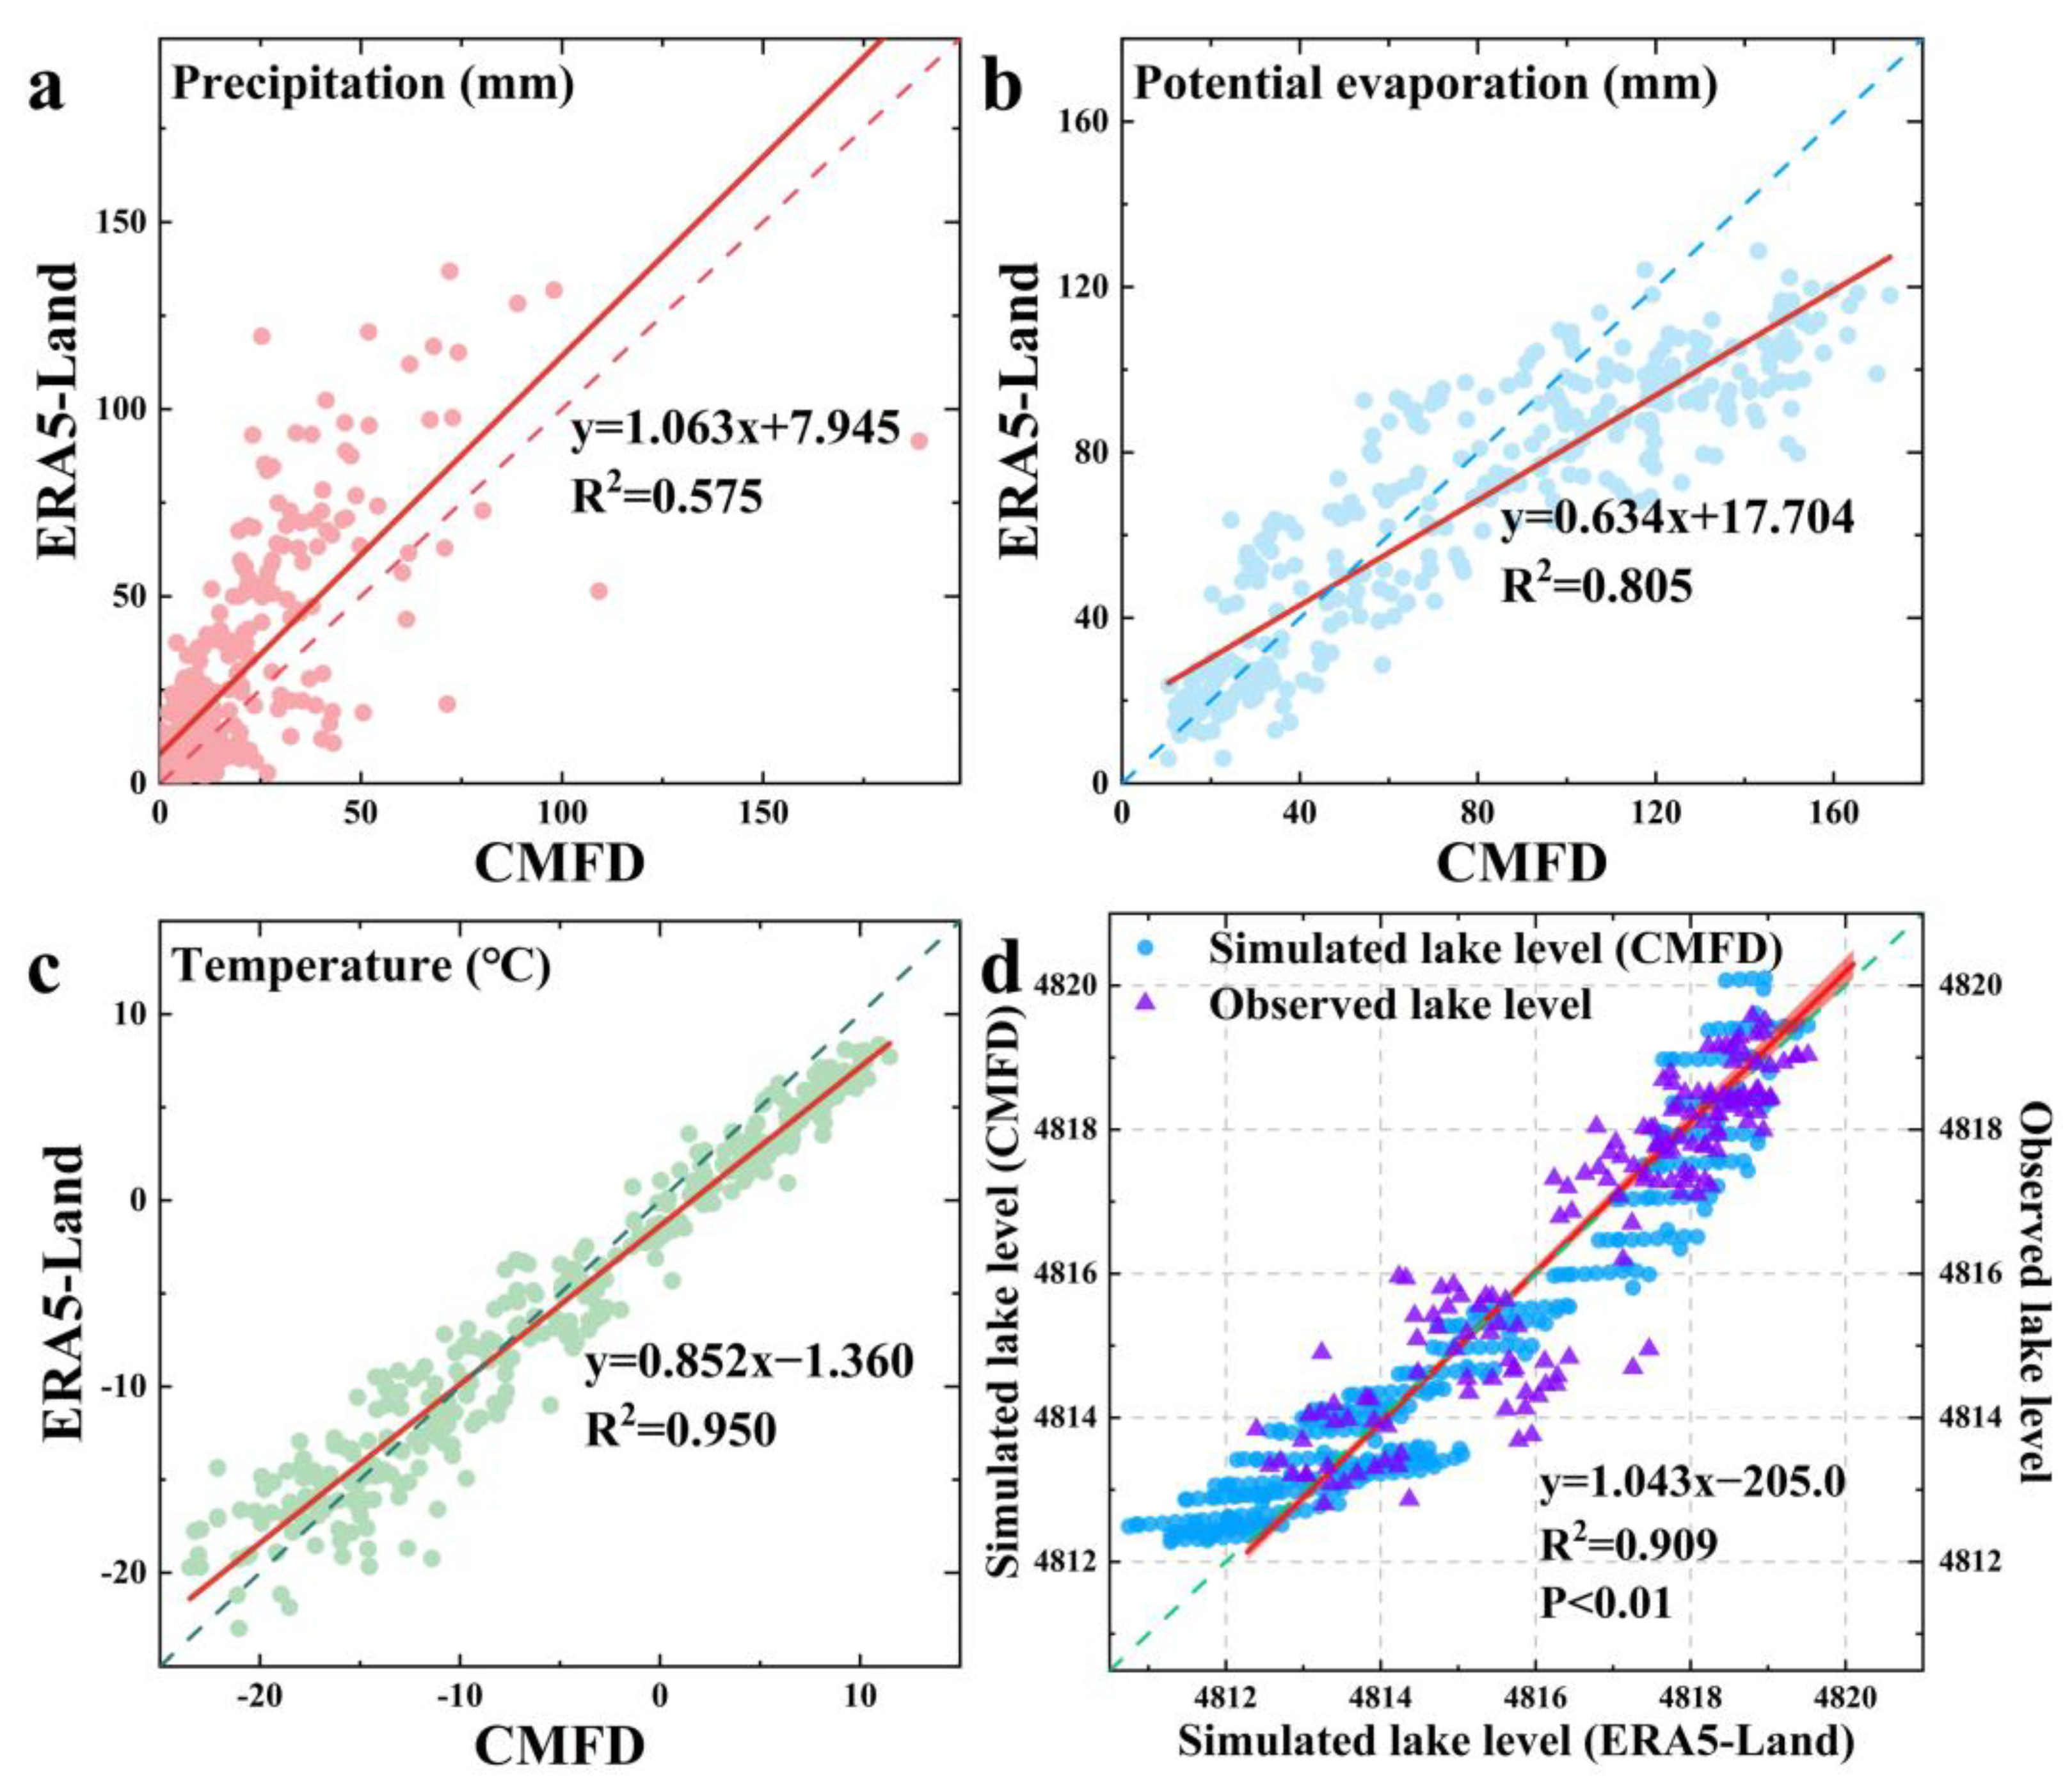
4.1. Model Performance
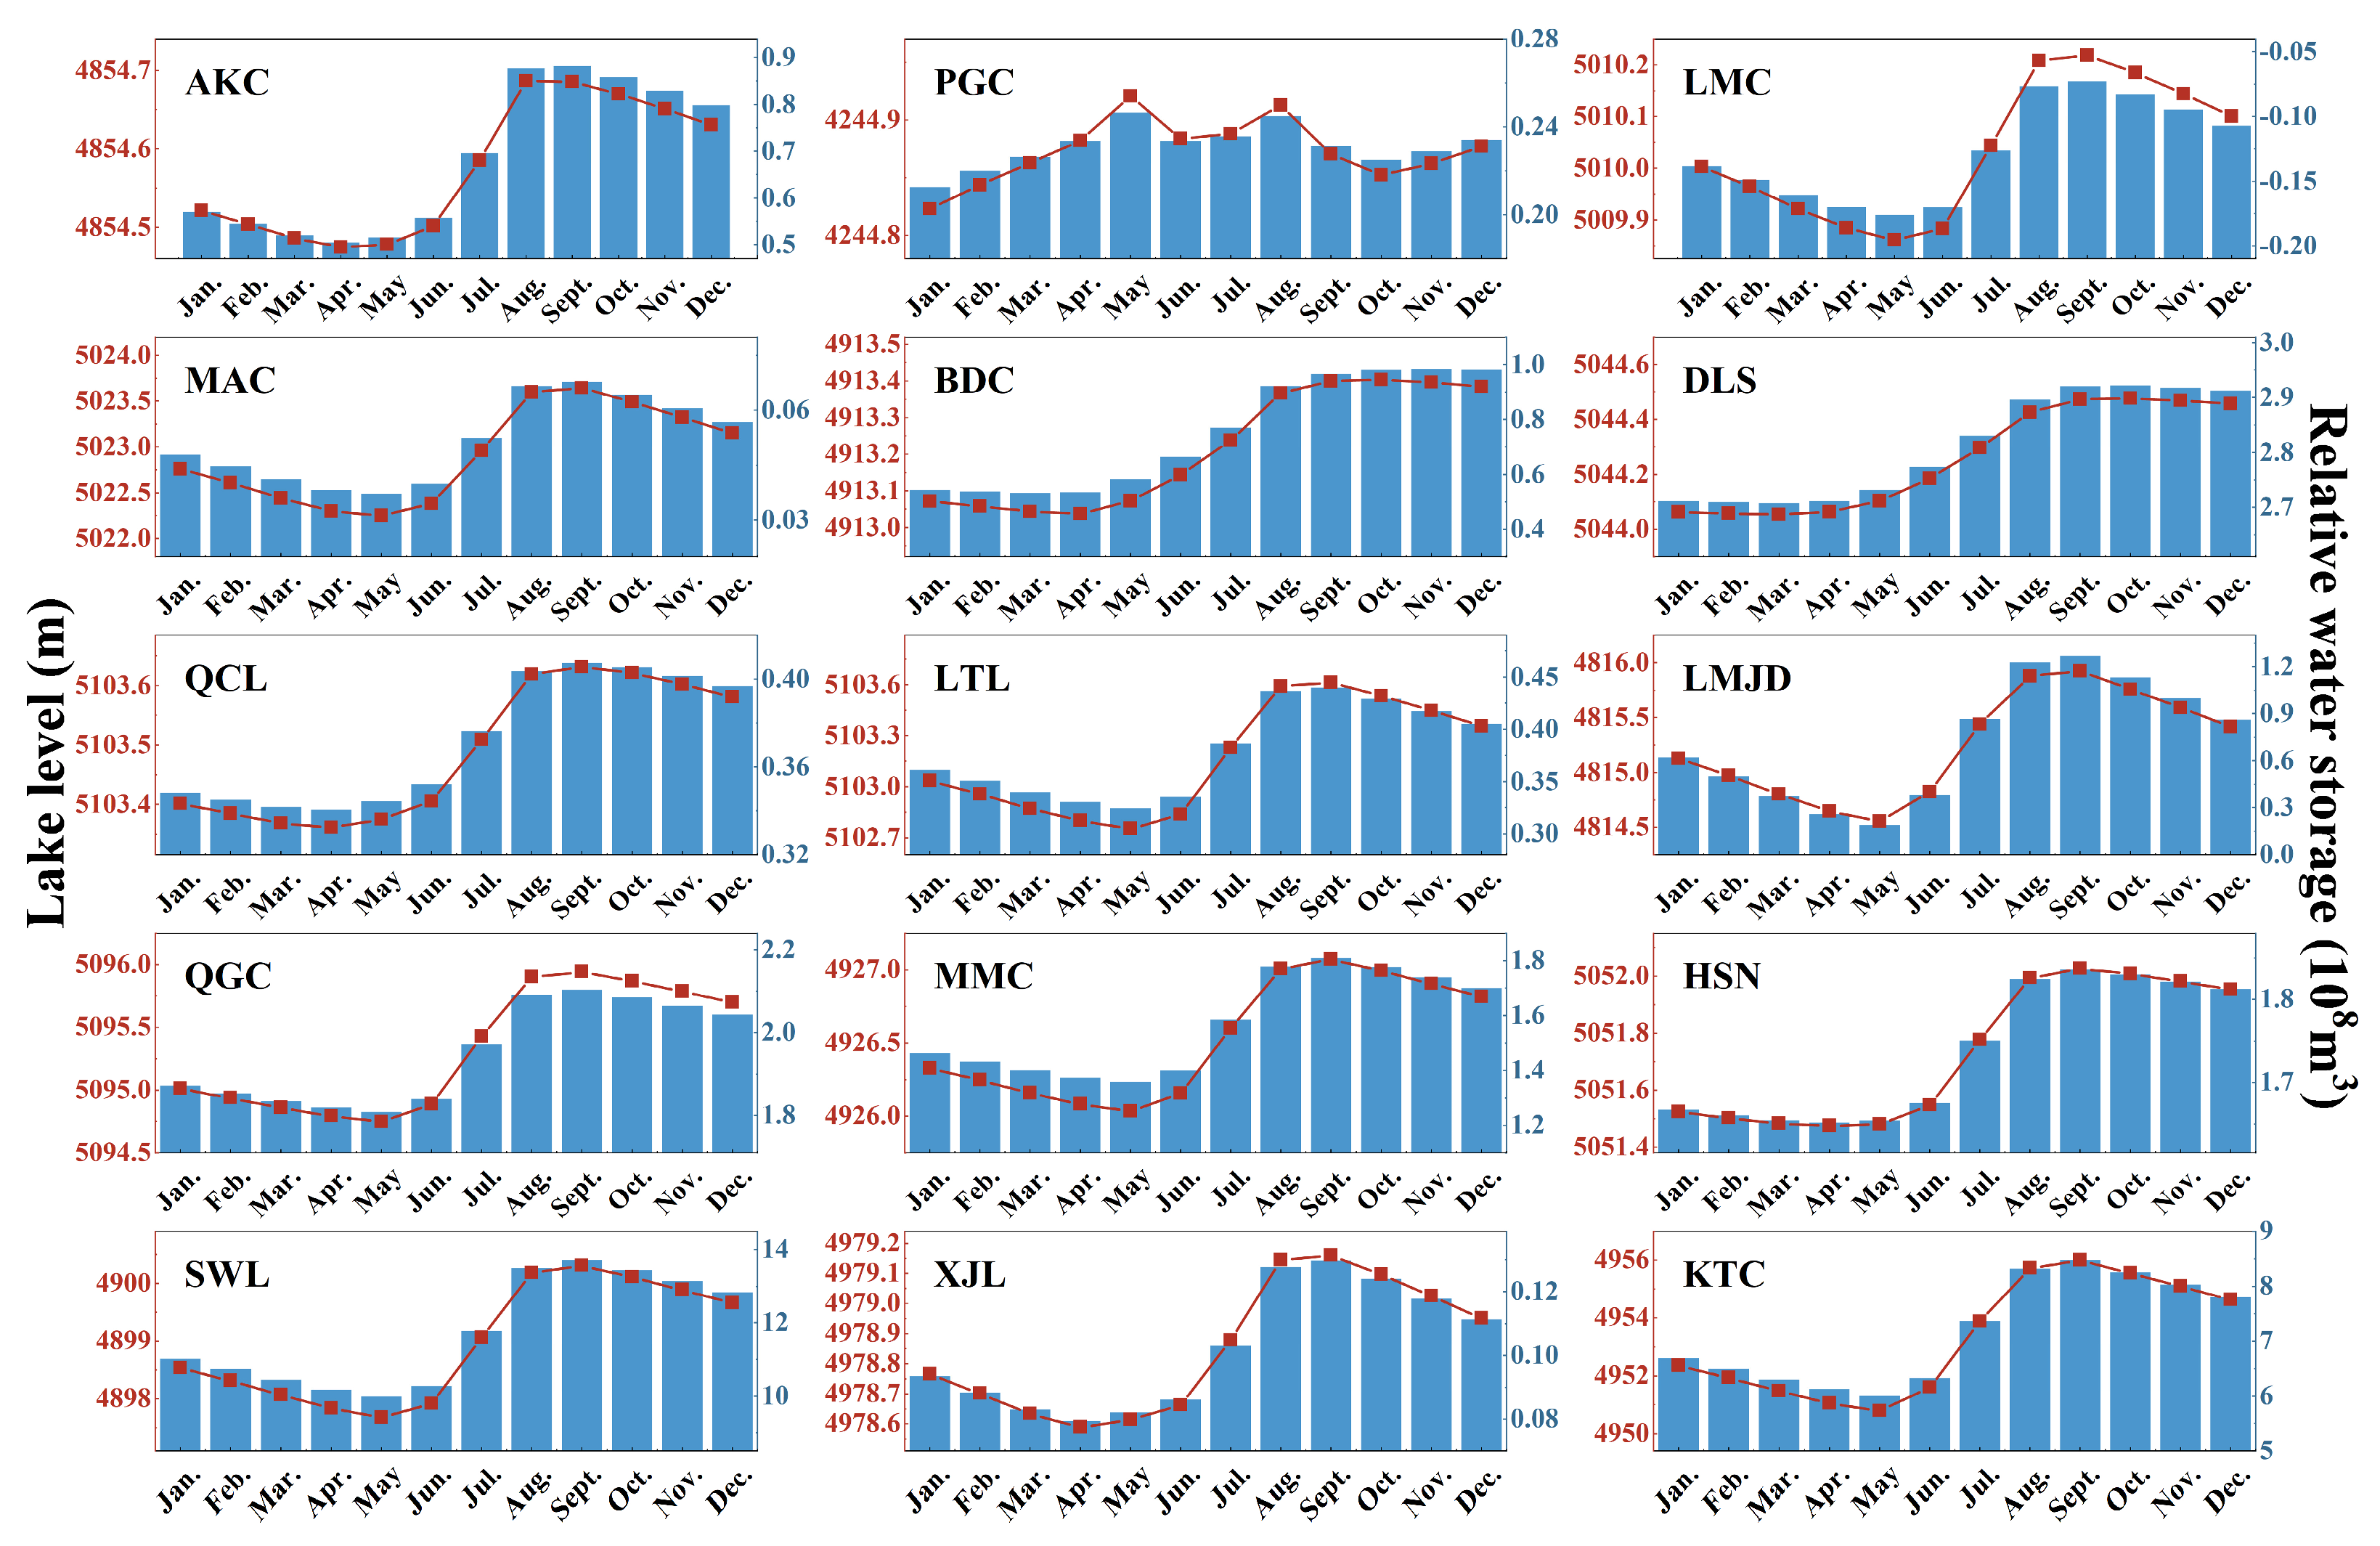
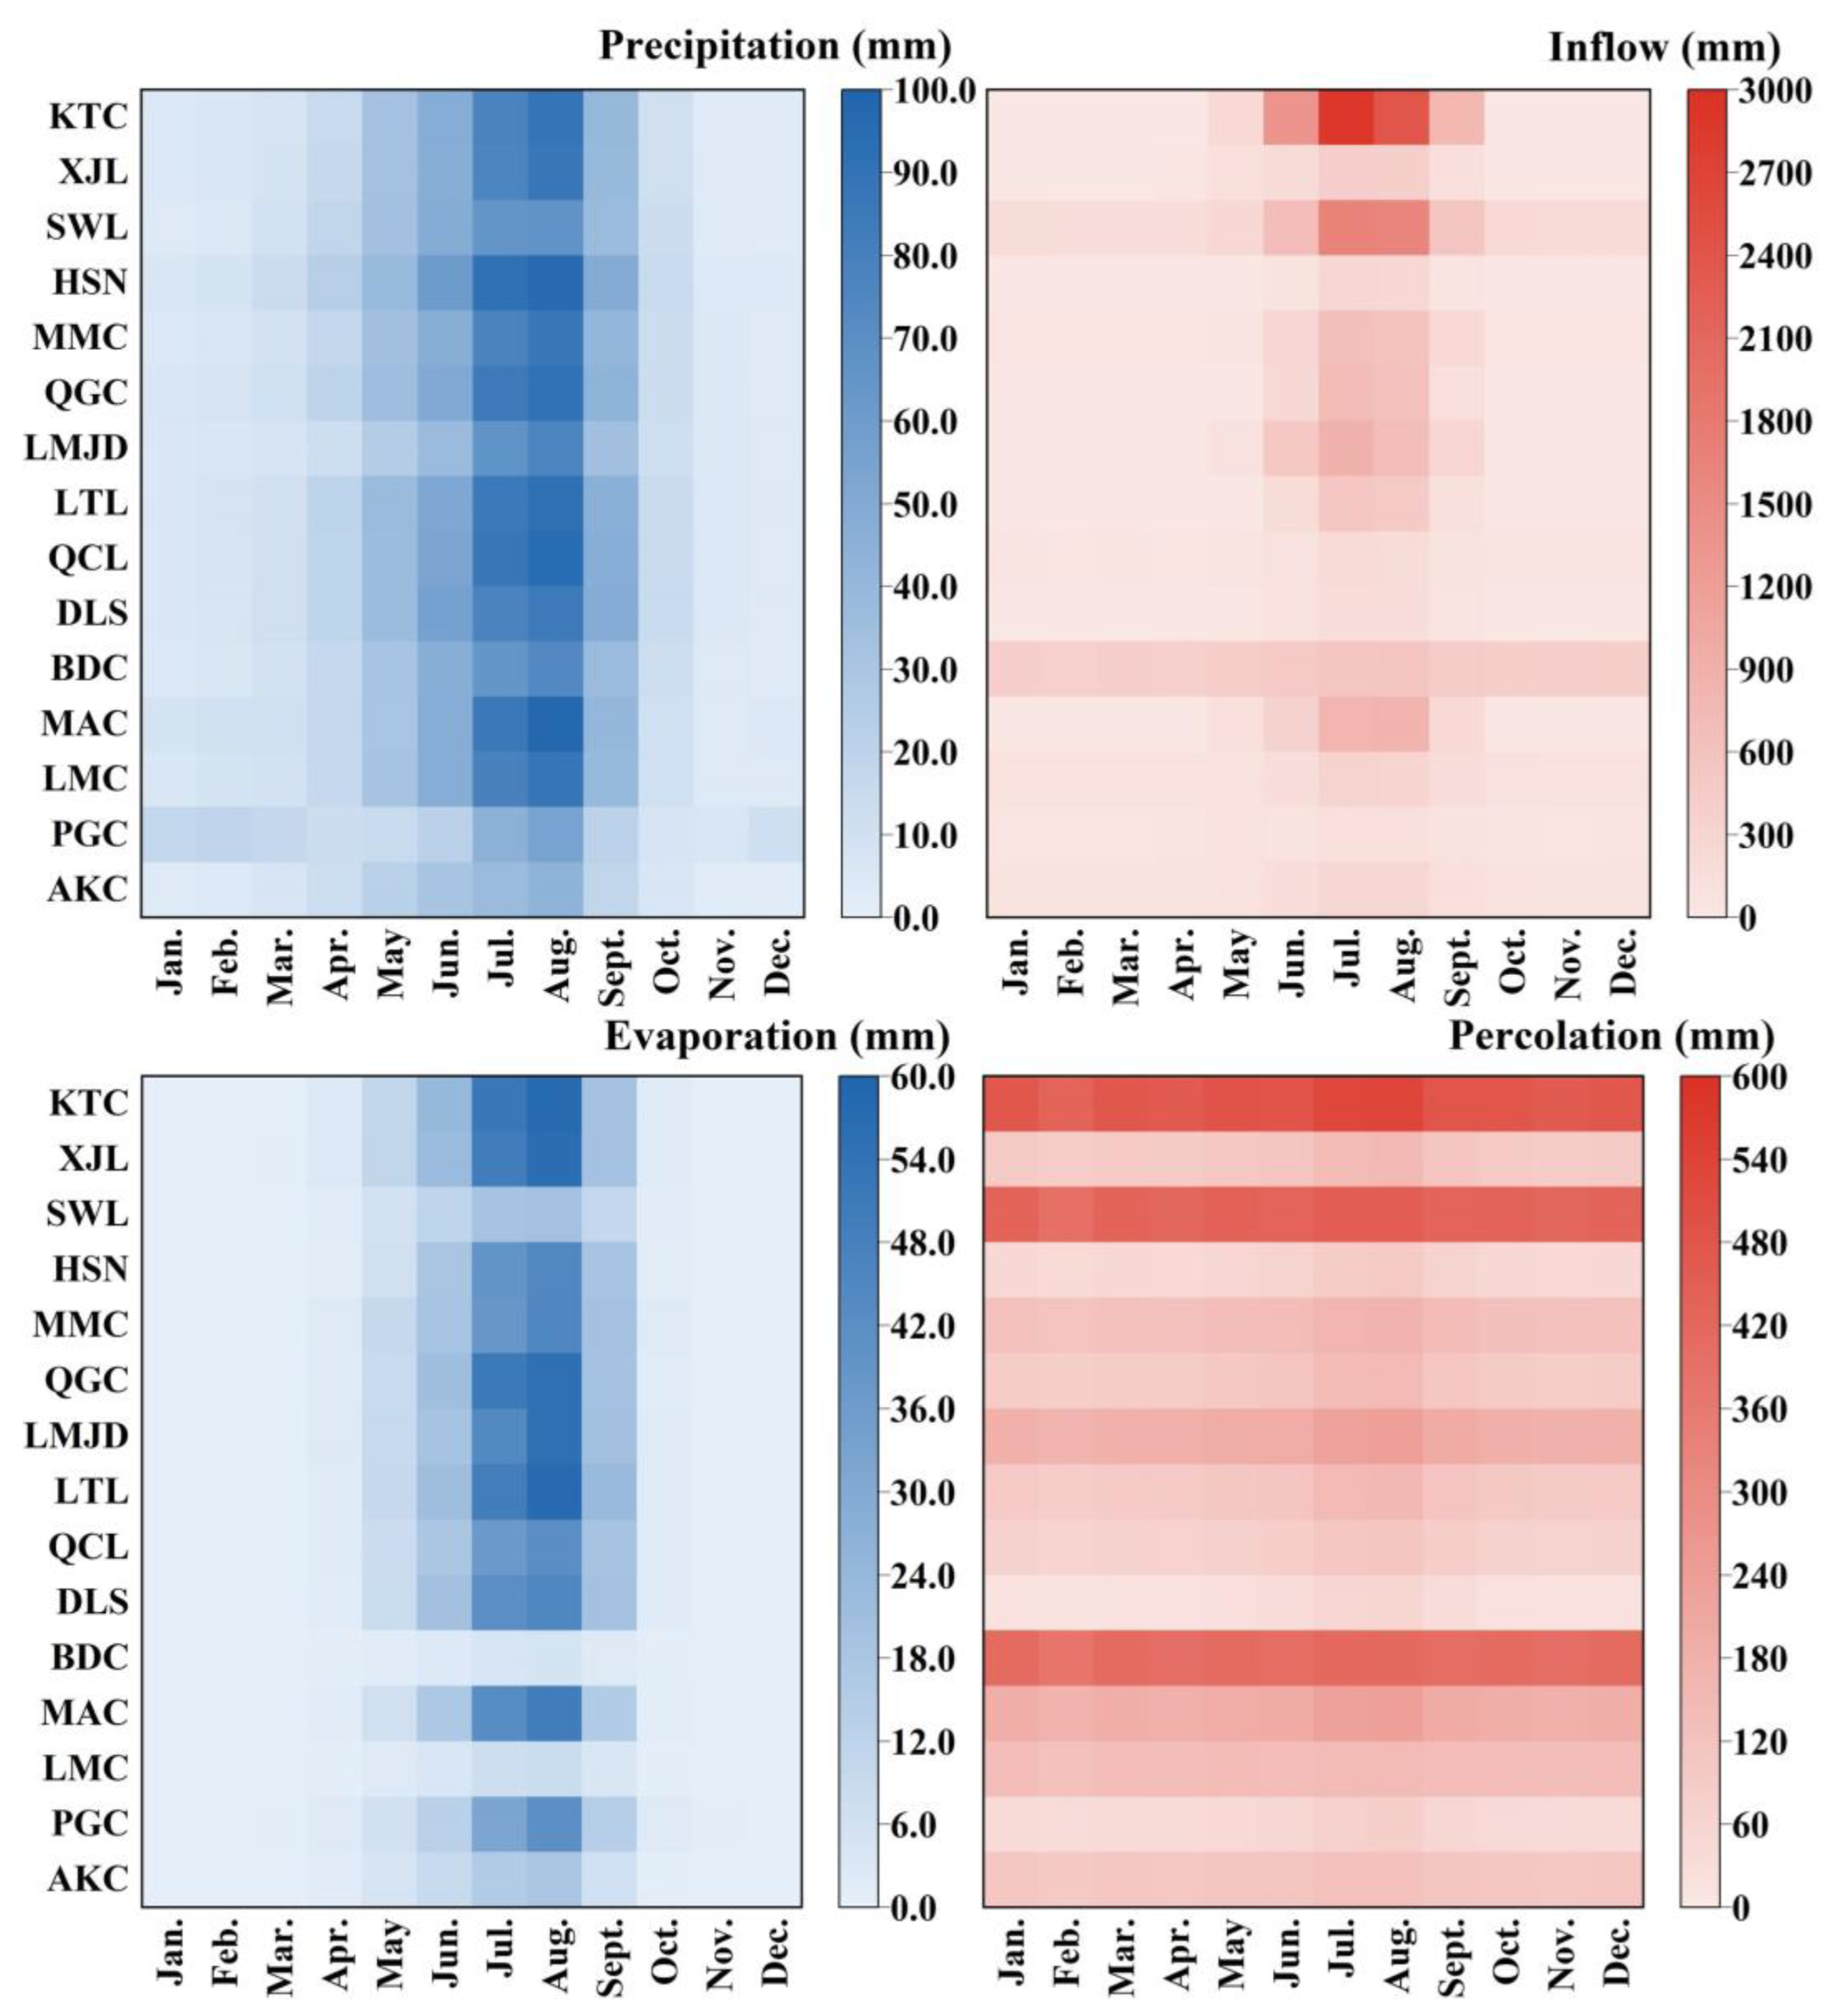
4.2. Seasonal Dynamics of Lake Water Balance
4.3. Long-Term Changes in Lake Water Balance
5. Discussion
5.1. Comparison with Existing Studies
5.2. Uncertainty from Climate Data and Satellite-Based Observations
5.3. Applicability and Limitations of the Modeling Framework
6. Conclusions
Author Contributions
Funding
Data Availability Statement
Acknowledgments
Conflicts of Interest
Abbreviations
| CMFD | China Meteorological Forcing Dataset |
| GSWE | Global Surface Water Explorer |
| NSE | Nash-Sutcliffe efficiency coefficient |
| REP | Percentage relative error |
| TTPL | The High-space-coverage Lake Level Change Data Sets on the Tibetan Plateau for the period 2002 to 2021 |
References
- Huang, S.X.; Zhang, K.; Lin, Q.; Liu, J.B.; Shen, J. Abrupt ecological shifts of lakes during the Anthropocene. Earth-Sci. Rev. 2022, 227, 103981. [Google Scholar] [CrossRef]
- Messager, M.L.; Lehner, B.; Grill, G.; Nedeva, I.; Schmitt, O. Estimating the volume and age of water stored in global lakes using a geo-statistical approach. Nat. Commun. 2016, 7, 13603. [Google Scholar] [CrossRef] [PubMed]
- Jeppesen, E.; Brucet, S.; Naselli-Flores, L.; Papastergiadou, E.; Stefanidis, K.; Noges, T.; Noges, P.; Attayde, J.L.; Zohary, T.; Coppens, J.; et al. Ecological impacts of global warming and water abstraction on lakes and reservoirs due to changes in water level and related changes in salinity. Hydrobiologia 2015, 750, 201–227. [Google Scholar] [CrossRef]
- Tranvik, L.J.; Downing, J.A.; Cotner, J.B.; Loiselle, S.A.; Striegl, R.G.; Ballatore, T.J.; Dillon, P.; Finlay, K.; Fortino, K.; Knoll, L.B.; et al. Lakes and reservoirs as regulators of carbon cycling and climate. Limnol. Oceanogr. 2009, 54, 2298–2314. [Google Scholar] [CrossRef]
- Williamson, C.E.; Saros, J.E.; Schindler, D.W. Sentinels of Change. Science 2009, 323, 887–888. [Google Scholar] [CrossRef]
- Zhu, L.; Zhang, G.; Yang, R.; Liu, C.; Yang, K.; Qiao, B.; Han, B. Lake Variations on Tibetan Plateau of Recent 40 Years and Future Changing Tendency. Bull. Chin. Acad. Sci. 2019, 34, 1254–1263. [Google Scholar] [CrossRef]
- Immerzeel, W.W.; van Beek, L.P.H.; Bierkens, M.F.P. Climate Change Will Affect the Asian Water Towers. Science 2010, 328, 1382–1385. [Google Scholar] [CrossRef]
- Qiu, J. China: The third pole. Nature 2008, 454, 393–396. [Google Scholar] [CrossRef]
- Zhang, G.Q.; Chen, W.F.; Xie, H.J. Tibetan Plateau’s Lake Level and Volume Changes from NASA’s ICESat/ICESat-2 and Landsat Missions. Geophys. Res. Lett. 2019, 46, 13107–13118. [Google Scholar] [CrossRef]
- Gao, Q.Z.; Guo, Y.Q.; Xu, H.M.; Ganjurjav, H.; Li, Y.; Wan, Y.F.; Qin, X.B.; Ma, X.; Liu, S. Climate change and its impacts on vegetation distribution and net primary productivity of the alpine ecosystem in the Qinghai-Tibetan Plateau. Sci. Total Environ. 2016, 554, 34–41. [Google Scholar] [CrossRef]
- Niu, T.; Chen, L.X.; Zhou, Z.J. The characteristics of climate change over the Tibetan Plateau in the last 40 years and the detection of climatic jumps. Adv. Atmos. Sci. 2004, 21, 193–203. [Google Scholar] [CrossRef]
- Zhang, B.; Wu, Y.H.; Lei, L.P.; Li, J.S.; Liu, L.L.; Chen, D.M.; Wang, J.B. Monitoring changes of snow cover, lake and vegetation phenology in Nam Co Lake Basin (Tibetan Plateau) using remote SENSING (2000–2009). J. Great Lakes Res. 2013, 39, 224–233. [Google Scholar] [CrossRef]
- Barnett, T.P.; Adam, J.C.; Lettenmaier, D.P. Potential impacts of a warming climate on water availability in snow-dominated regions. Nature 2005, 438, 303–309. [Google Scholar] [CrossRef] [PubMed]
- Li, Y.K.; Liao, J.J.; Guo, H.D.; Liu, Z.W.; Shen, G.Z. Patterns and Potential Drivers of Dramatic Changes in Tibetan Lakes, 1972–2010. PLoS ONE 2014, 9, e111890. [Google Scholar] [CrossRef]
- Song, C.Q.; Huang, B.; Ke, L.H.; Richards, K.S. Seasonal and abrupt changes in the water level of closed lakes on the Tibetan Plateau and implications for climate impacts. J. Hydrol. 2014, 514, 131–144. [Google Scholar] [CrossRef]
- Wu, Y.H.; Guo, L.N.; Zheng, H.X.; Zhang, B.; Li, M.R. Hydroclimate assessment of gridded precipitation products for the Tibetan Plateau. Sci. Total Environ. 2019, 660, 1555–1564. [Google Scholar] [CrossRef]
- Li, B.Q.; Zhang, J.Y.; Yu, Z.B.; Liang, Z.M.; Chen, L.; Acharya, K. Climate change driven water budget dynamics of a Tibetan inland lake. Glob. Planet. Change 2017, 150, 70–80. [Google Scholar] [CrossRef]
- Zhang, G.Q.; Duan, S.Q. Lakes as sentinels of climate change on the Tibetan Plateau. All Earth 2021, 33, 161–165. [Google Scholar] [CrossRef]
- Mert, A.; Tavuç, I.; Özdemir, S.; Ulusan, M.D. Future Responses of the Burdur Lake to Climate Change and Uncontrolled Exploitation. J. Indian Soc. Remote Sens. 2025, 53, 1025–1036. [Google Scholar] [CrossRef]
- Zahribanhesari, M.; Nunziata, F.; Migliaccio, M.; Dabboor, M. Dual-Polarimetric Sar Imaging Modes to Monitor Lake Extent. In Proceedings of the IEEE International Geoscience and Remote Sensing Symposium (IGARSS), Athens, Greece, 7–12 July 2024; pp. 673–676. [Google Scholar]
- Bai, B.X.; Mu, L.X.; Ma, C.Y.; Chen, G.; Tan, Y.M. Extreme water level changes in global lakes revealed by altimetry satellites since the 2000s. Int. J. Appl. Earth Obs. Geoinf. 2024, 127, 103694. [Google Scholar] [CrossRef]
- Domgaard, M.; Kjeldsen, K.; How, P.; Bjork, A. Altimetry-based ice-marginal lake water level changes in Greenland. Commun. Earth Environ. 2024, 5, 365. [Google Scholar] [CrossRef]
- Liu, Z.; Chao, N.F.; Chen, G.; Zhang, G.Q.; Wang, Z.T.; Li, F.P.; Ouyang, G.C. Changes in monthly surface area, water level, and storage of 194 lakes and reservoirs in the Yangtze River Basin during 1990-2021 using multisource remote sensing data. Sci. Total Environ. 2024, 944, 173840. [Google Scholar] [CrossRef] [PubMed]
- Li, X.D.; Long, D.; Huang, Q.; Han, P.F.; Zhao, F.Y.; Wada, Y. High-temporal-resolution water level and storage change data sets for lakes on the Tibetan Plateau during 2000-2017 using multiple altimetric missions and Landsat-derived lake shoreline positions. Earth Syst. Sci. Data 2019, 11, 1603–1627. [Google Scholar] [CrossRef]
- Luo, S.X.; Song, C.Q.; Zhan, P.F.; Liu, K.; Chen, T.; Li, W.K.; Ke, L.H. Refined estimation of lake water level and storage changes on the Tibetan Plateau from ICESat/ICESat-2. Catena 2021, 200, 105177. [Google Scholar] [CrossRef]
- Zhang, G.; Wang, M.; Zhou, T.; Chen, W. Progress in remote sensing monitoring of lake area, water level, and volume changes on the Tibetan Plateau. Natl. Remote Sens. Bull. 2022, 26, 115–125. [Google Scholar] [CrossRef]
- Chen, C.T.; Li, X.Q.; Zhu, J.H.; Peng, H.L.; Xue, Y.H.; Zhai, W.L.; Lin, M.S.; Zhang, Y.F.; Liu, J.J.; Zhao, Y.L. Research on the Algorithm of Lake Surface Height Inversion in Qinghai Lake Based on Sentinel-3A Altimeter. Remote Sens. 2025, 17, 647. [Google Scholar] [CrossRef]
- Wu, J.; Ke, C.Q.; Cai, Y.; Duan, Z. Monitoring Multi-Temporal Changes of Lakes on the Tibetan Plateau Using Multi-Source Remote Sensing Data from 1992 to 2019: A Case Study of Lake Zhari Namco. J. Earth Sci. 2024, 35, 1679–1691. [Google Scholar] [CrossRef]
- Ali, M.H.; Popescu, I.; Jonoski, A.; Solomatine, D.P. Remote Sensed and/or Global Datasets for Distributed Hydrological Modelling: A Review. Remote Sens. 2023, 15, 1642. [Google Scholar] [CrossRef]
- Lee, S.; Kim, D.; McCarty, G.W.; Anderson, M.; Gao, F.; Lei, F.N.; Moglen, G.E.; Zhang, X.S.; Yen, H.W.; Qi, J.Y.; et al. Spatial calibration and uncertainty reduction of the SWAT model using multiple remotely sensed data. Heliyon 2024, 10, e30923. [Google Scholar] [CrossRef]
- Trabelsi, R.; Abida, H. Wetland water balance estimation in an arid region using remote sensing technology and hydrological modelling. Hydrol. Sci. J. 2024, 69, 905–922. [Google Scholar] [CrossRef]
- Lubczynski, M.W.; Leblanc, M.; Batelaan, O. Remote sensing and hydrogeophysics give a new impetus to integrated hydrological models: A review. J. Hydrol. 2024, 633, 130901. [Google Scholar] [CrossRef]
- Yoon, H.N.; Marshall, L.; Sharma, A. Evaluating the influence of hydrologic signatures on hydrological modeling using remotely sensed surrogate river discharge. J. Hydrol. 2024, 644, 132049. [Google Scholar] [CrossRef]
- Zheng, D.X.; Zhu, W.B.; Han, Y.; Lv, A.F. A novel remote sensing-based calibration and validation method for distributed hydrological modelling in ungauged basins. J. Hydrol. 2025, 658, 133119. [Google Scholar] [CrossRef]
- Zhou, F.R.; Wu, N.; Luo, Y.N.; Wang, Y.H.; Ma, Y.; Wang, Y.F.; Zhang, K. Improving Flood Streamflow Estimation of Ungauged Small Reservoir Basins Using Remote Sensing and Hydrological Modeling. Remote Sens. 2024, 16, 4399. [Google Scholar] [CrossRef]
- Lei, Y.B.; Yao, T.D.; Bird, B.W.; Yang, K.; Zhai, J.Q.; Sheng, Y.W. Coherent lake growth on the central Tibetan Plateau since the 1970s: Characterization and attribution. J. Hydrol. 2013, 483, 61–67. [Google Scholar] [CrossRef]
- Tong, K.; Su, F.G.; Xu, B.Q. Quantifying the contribution of glacier meltwater in the expansion of the largest lake in Tibet. J. Geophys. Res. Atmos. 2016, 121, 11158–11173. [Google Scholar] [CrossRef]
- Zhou, J.; Wang, L.; Zhang, Y.S.; Guo, Y.H.; Li, X.P.; Liu, W.B. Exploring the water storage changes in the largest lake (Selin Co) over the Tibetan Plateau during 2003–2012 from a basin-wide hydrological modeling. Water Resour. Res. 2015, 51, 8060–8086. [Google Scholar] [CrossRef]
- Zhou, J.; Wang, L.; Zhong, X.Y.; Yao, T.D.; Qi, J.; Wang, Y.W.; Xue, Y.K. Quantifying the major drivers for the expanding lakes in the interior Tibetan Plateau. Sci. Bull. 2022, 67, 474–478. [Google Scholar] [CrossRef]
- Biskop, S.; Maussion, F.; Krause, P.; Fink, M. Differences in the water-balance components of four lakes in the southern-central Tibetan Plateau. Hydrol. Earth Syst. Sci. 2016, 20, 209–225. [Google Scholar] [CrossRef]
- Qiao, B.; Zhu, L. Differences and cause analysis of changes in lakes of different supply types in the north-western Tibetan Plateau. Hydrol. Process. 2017, 31, 2752–2763. [Google Scholar] [CrossRef]
- Qiao, B.J.; Zhu, L.P.; Wang, J.B.; Ju, J.T.; Ma, Q.F.; Liu, C. Estimation of lakes water storage and their changes on the northwestern Tibetan Plateau based on bathymetric and Landsat data and driving force analyses. Quat. Int. 2017, 454, 56–67. [Google Scholar] [CrossRef]
- Liu, Y.T.; Yang, J.; Chen, Y.N.; Fang, G.H.; Li, W.H. The Temporal and Spatial Variations in Lake Surface Areas in Xinjiang, China. Water 2018, 10, 431. [Google Scholar] [CrossRef]
- Deji, Y.; Baima, R.; Baima, Y.; Qiangba, O.; Bian, D. Remote Sensing Monitoring of Lake Surface Changes in Lomachangdongtso Lake in Northwest Tibet in Recent 40 Years. Plateau Mt. Meteorol. Res. 2022, 42, 85–89. [Google Scholar] [CrossRef]
- Lei, Y.B.; Yao, T.D.; Tian, L.D.; Sheng, Y.W.; Lazhu; Liao, J.J.; Zhao, H.B.; Yang, W.; Yang, K.; Berthier, E.; et al. Response of downstream lakes to Aru glacier collapses on the western Tibetan Plateau. Cryosphere 2021, 15, 199–214. [Google Scholar] [CrossRef]
- Xu, F.L.; Zhang, G.Q.; Woolway, R.I.; Yang, K.; Wada, Y.; Wang, J.D.; Crétaux, J.F. Widespread societal and ecological impacts from projected Tibetan Plateau lake expansion. Nat. Geosci. 2024, 17, 516–523. [Google Scholar] [CrossRef]
- Pekel, J.-F.; Cottam, A.; Gorelick, N.; Belward, A.S. High-resolution mapping of global surface water and its long-term changes. Nature 2016, 540, 418–422. [Google Scholar] [CrossRef]
- Hampel, F.R. Influence Curve and Its Role in Robust Estimation. J. Am. Stat. Assoc. 1974, 69, 383–393. [Google Scholar] [CrossRef]
- Chen, J.; Liao, J.; Deng, W.; Shen, G.; Zhang, L.; Wang, C. High-Space-Coverage Lake Level Change Data Sets on the Tibetan Plateau from 2002 To 2021 Using Multiple Altimeter Data; Pangaea Data: San Francisco, CA, USA, 2021. [Google Scholar] [CrossRef]
- Muñoz Sabater, J. ERA5-Land Hourly Data from 1950 to Present. Copernicus Climate Change Service (C3S) Climate Data Store (CDS); European Union: Bruxelles, Belgium, 2019. [Google Scholar] [CrossRef]
- He, J.; Yang, K.; Tang, W.J.; Lu, H.; Qin, J.; Chen, Y.Y.; Li, X. The first high-resolution meteorological forcing dataset for land process studies over China. Sci. Data 2020, 7, 25. [Google Scholar] [CrossRef]
- Yang, K.; He, J.; Tang, W.J.; Lu, H.; Qin, J.; Chen, Y.Y.; Li, X. China Meteorological Forcing Dataset (1979–2018); National Tibetan Plateau/Third Pole Environment Data Center: Beijing, China, 2019. [Google Scholar] [CrossRef]
- Wu, Y.H.; Zheng, H.X.; Zhang, B.; Chen, D.M.; Lei, L.P. Long-Term Changes of Lake Level and Water Budget in the Nam Co Lake Basin, Central Tibetan Plateau. J. Hydrometeorol. 2014, 15, 1312–1322. [Google Scholar] [CrossRef]
- Zhang, L.; Potter, N.; Hickel, K.; Zhang, Y.Q.; Shao, Q.X. Water balance modeling over variable time scales based on the Budyko framework—Model development and testing. J. Hydrol. 2008, 360, 117–131. [Google Scholar] [CrossRef]
- Hipsey, M.R.; Bruce, L.C.; Boon, C.; Busch, B.; Carey, C.C.; Hamilton, D.P.; Hanson, P.C.; Read, J.S.; de Sousa, E.; Weber, M.; et al. A General Lake Model (GLM 3.0) for linking with high-frequency sensor data from the Global Lake Ecological Observatory Network (GLEON). Geosci. Model Dev. 2019, 12, 473–523. [Google Scholar] [CrossRef]
- Jones, R.N.; McMahon, T.; Bowler, J.M. Modelling historical lake levels and recent climate change at three closed lakes, Western Victoria, Australia (c.1840–1990). J. Hydrol. 2001, 246, 159–180. [Google Scholar] [CrossRef]
- Ma, N.; Szilagyi, J.; Niu, G.Y.; Zhang, Y.S.; Zhang, T.; Wang, B.B.; Wu, Y.H. Evaporation variability of Nam Co Lake in the Tibetan Plateau and its role in recent rapid lake expansion. J. Hydrol. 2016, 537, 27–35. [Google Scholar] [CrossRef]
- Qiao, B.J.; Zhu, L.P.; Yang, R.M. Temporal-spatial differences in lake water storage changes and their links to climate change throughout the Tibetan Plateau. Remote Sens. Environ. 2019, 222, 232–243. [Google Scholar] [CrossRef]
- Nash, J.E.; Sutcliffe, J.V. River flow forecasting through conceptual models part I—A discussion of principles. J. Hydrol. 1970, 10, 282–290. [Google Scholar] [CrossRef]
- Moriasi, D.N.; Gitau, M.W.; Pai, N.; Daggupati, P. Hydrologic and Water Quality Models: Performance Measures and Evaluation Criteria. Trans. Asabe 2015, 58, 1763–1785. [Google Scholar]
- Wu, Y.H.; Li, M.R.; Guo, L.N.; Zheng, H.X.; Zhang, H.Y. Investigating Water Variation of Lakes in Tibetan Plateau Using Remote Sensed Data Over the Past 20 Years. IEEE J. Sel. Top. Appl. Earth Obs. Remote Sens. 2019, 12, 2557–2564. [Google Scholar] [CrossRef]
- Zhang, H.; Wu, Y.; Liu, Y.; Guo, L. Water storage variation of the Qinghai Lake in recent decades based on satellite observation. Prog. Geogr. 2018, 37, 823–832. [Google Scholar]
- Busker, T.; de Roo, A.; Gelati, E.; Schwatke, C.; Adamovic, M.; Bisselink, B.; Pekel, J.F.; Cottam, A. A global lake and reservoir volume analysis using a surface water dataset and satellite altimetry. Hydrol. Earth Syst. Sci. 2019, 23, 669–690. [Google Scholar] [CrossRef]
- Schwatke, C.; Dettmering, D.; Seitz, F. Volume Variations of Small Inland Water Bodies from a Combination of Satellite Altimetry and Optical Imagery. Remote Sens. 2020, 12, 1606. [Google Scholar] [CrossRef]
- Kim, C.R. Cook’s distance in spline smoothing. Stat. Probab. Lett. 1996, 31, 139–144. [Google Scholar] [CrossRef]
- Zhaxi, N.; Nanmei, Z.; Fenfei, S.; Basang, G. Simulation of water level change in bangong lake and analysis of influencing factors. Water Resour. Hydropower Eng. 2022, 53, 95–99. [Google Scholar] [CrossRef]
- Mann, H.B. Nonparametric Tests Against Trend. Econometrica 1945, 13, 245–259. [Google Scholar] [CrossRef]
- Theil, H. A Rank-Invariant Method of Linear and Polynomial Regression Analysis, Part I. Indag. Math. 1950, 12, 173. [Google Scholar]
- Wang, X.H.; Piao, S.L.; Ciais, P.; Li, J.S.; Friedlingstein, P.; Koven, C.; Chen, A.P. Spring temperature change and its implication in the change of vegetation growth in North America from 1982 to 2006. Proc. Natl. Acad. Sci. USA 2011, 108, 1240–1245. [Google Scholar] [CrossRef]
- Guoqing, Z. Lake Volume Changes on the Tibetan Plateau During 1976–2020 (>1 km2) v2.0; National Tibetan Plateau/Third Pole Environment Data Center: Beijing, China, 2022. [Google Scholar] [CrossRef]
- Yao, F.; Wang, J.; Yang, K.; Wang, C.; Walter, B.A.; Crétaux, J.-F. High Resolution Data Set of Annual Lake Areas and Water Storage Across the Inner Tibet, 2002–2015; Pangaea Data: San Francisco, CA, USA, 2018. [Google Scholar] [CrossRef]
- Zhang, G.Q.; Yao, T.D.; Xie, H.J.; Yang, K.; Zhu, L.P.; Shum, C.K.; Bolch, T.; Yi, S.; Allen, S.; Jiang, L.G.; et al. Response of Tibetan Plateau lakes to climate change: Trends, patterns, and mechanisms. Earth-Sci. Rev. 2020, 208, 103269. [Google Scholar] [CrossRef]


| ID | Name | Abbr. | Latitude | Longitude | Altitude (m) | Lake Area (km2) | Catchment Area (km2) | Precipitation (mm) | Temperature (°C) | PET (mm) |
|---|---|---|---|---|---|---|---|---|---|---|
| 1 | Aksai Chin | AKC | 35.20 | 79.87 | 4854.6 | 201.0 | 8187.4 | 192.0 | −7.6 | 778.7 |
| 2 | Pangong Co | PGC | 33.62 | 79.47 | 4245.2 | 466.6 | 25,305.6 | 250.6 | −4.6 | 756.4 |
| 3 | Longmu Co | LMC | 34.61 | 80.46 | 5009.1 | 107.8 | 1120.2 | 346.4 | −8.2 | 669.5 |
| 4 | Mang Co | MAC | 34.50 | 80.44 | 5023.8 | 12.3 | 725.6 | 368.5 | −8.6 | 847.6 |
| 5 | Bangdag Co | BDC | 34.94 | 81.56 | 4912.9 | 99.8 | 4683.4 | 311.4 | −7.5 | 734.9 |
| 6 | Dulishi Lake | DLS | 34.73 | 81.89 | 5046.3 | 93.2 | 1864.3 | 371.3 | −8.5 | 783.1 |
| 7 | Qingce Lake | QCL | 34.48 | 81.79 | 5103.6 | 64.1 | 957.2 | 387.4 | −7.9 | 751.8 |
| 8 | Luotuo Lake | LTL | 34.44 | 81.94 | 5104.0 | 64.1 | 1007.0 | 380.8 | −7.9 | 697.7 |
| 9 | Lumajiangdong Co | LMJD | 34.02 | 81.61 | 4816.3 | 365.3 | 6806.0 | 296.2 | −5.5 | 802.0 |
| 10 | Qagong Co | QGC | 34.44 | 82.33 | 5096.4 | 25.5 | 542.9 | 372.5 | −7.9 | 892.7 |
| 11 | Memar Co | MMC | 34.22 | 82.31 | 4927.3 | 146.2 | 2013.0 | 348.3 | −6.6 | 829.7 |
| 12 | Heishi North Lake | HSN | 35.56 | 82.74 | 5053.0 | 104.6 | 1591.8 | 413.1 | −9.8 | 587.5 |
| 13 | Salt Water Lake | SWL | 35.28 | 83.07 | 4899.8 | 139.7 | 6472.0 | 308.4 | −7.5 | 826.5 |
| 14 | Xiajian Lake | XJL | 34.16 | 82.77 | 4979.2 | 9.0 | 783.2 | 337.7 | −6.1 | 1045.9 |
| 15 | Katiao Co | KTC | 33.96 | 82.97 | 4950.3 | 40.1 | 2096.9 | 339.1 | −6.2 | 1073.8 |
| Curve Type | Hypsometric Curve | Relative Lake Water Storage |
|---|---|---|
| Linear | ||
| Quadratic | ||
| Cubic |
| Lake | Number of Data Pairs | Relationships | R2 |
|---|---|---|---|
| AKC | 64 | 0.71 | |
| PGC | 43 | 0.81 | |
| LMC | 20 | 0.50 | |
| MAC | 7 | 0.47 | |
| BDC | 34 | 0.69 | |
| DLS | 33 | 0.66 | |
| QCL | 20 | 0.89 | |
| LTL | 22 | 0.86 | |
| LMJD | 41 | 0.94 | |
| QGC | 8 | 0.52 | |
| MMC | 25 | 0.92 | |
| HSN | 39 | 0.85 | |
| SWL | 33 | 0.56 | |
| XJL | 12 | 0.69 | |
| KTC | 10 | 0.90 |
Disclaimer/Publisher’s Note: The statements, opinions and data contained in all publications are solely those of the individual author(s) and contributor(s) and not of MDPI and/or the editor(s). MDPI and/or the editor(s) disclaim responsibility for any injury to people or property resulting from any ideas, methods, instructions or products referred to in the content. |
© 2025 by the authors. Licensee MDPI, Basel, Switzerland. This article is an open access article distributed under the terms and conditions of the Creative Commons Attribution (CC BY) license (https://creativecommons.org/licenses/by/4.0/).
Share and Cite
Yan, J.; Wu, Y.; Ren, Y.; Zheng, S.; Chen, H.; Teng, X. Modeling Dynamics of Water Balance for Lakes in the Northwest Tibetan Plateau with Satellite-Based Observations. Remote Sens. 2025, 17, 1618. https://doi.org/10.3390/rs17091618
Yan J, Wu Y, Ren Y, Zheng S, Chen H, Teng X. Modeling Dynamics of Water Balance for Lakes in the Northwest Tibetan Plateau with Satellite-Based Observations. Remote Sensing. 2025; 17(9):1618. https://doi.org/10.3390/rs17091618
Chicago/Turabian StyleYan, Jiaheng, Yanhong Wu, Yongkang Ren, Siqi Zheng, Hao Chen, and Xuankai Teng. 2025. "Modeling Dynamics of Water Balance for Lakes in the Northwest Tibetan Plateau with Satellite-Based Observations" Remote Sensing 17, no. 9: 1618. https://doi.org/10.3390/rs17091618
APA StyleYan, J., Wu, Y., Ren, Y., Zheng, S., Chen, H., & Teng, X. (2025). Modeling Dynamics of Water Balance for Lakes in the Northwest Tibetan Plateau with Satellite-Based Observations. Remote Sensing, 17(9), 1618. https://doi.org/10.3390/rs17091618