Highlights
In this study, rock glacier identification was integrated with deep learning by constructing three distinct network architectures for semantic segmentation. The methodology was applied in the Hunza River Basin using Sentinel-2 MSI remote sensing imagery, achieving satisfactory rock glacier classification through iterative training. To improve recognition accuracy, geomorphological texture-based feature enhancement techniques were incorporated. Comparative analysis demonstrated that HRnet outperformed DeepLabV3+ in classification accuracy and surpassed U-Net in computational efficiency, making it more suitable for identifying the initiation and termination positions as well as boundaries of rock glaciers. This work presents a more effective approach for large-scale rock glacier identification and provides a reference for further applications of deep learning in cryospheric studies.
What are the main findings?
- Three deep learning based semantic segmentation architectures (HRnet, DeepLabV3+, and U-Net) were constructed and evaluated for automatic rock glacier identification using Sentinel-2 MSI imagery in the Hunza River Basin.
- HRnet achieved the best overall performance, providing higher classification accuracy than DeepLabV3+ and greater computational efficiency than U-Net, particularly in delineating initiation zones, termination areas, and rock glacier boundaries.
What are the main findings?
- The proposed approach offers an effective and scalable workflow for large-scale rock glacier mapping, reducing reliance on manual interpretation.
- This study provides a practical reference for applying deep learning to cryosphere monitoring and supports future automated geo-hazard assessment in high-mountain environments.
Abstract
Rock glaciers have been recognized as key indicators of geomorphic and climatic processes in high mountain environments. In this study, Sentinel-2 MSI imagery and topographic data were integrated to construct enhanced feature sets for rock glacier identification. Three state-of-the-art deep learning models (U-Net, DeepLabV3+, and HRnet) were employed to perform semantic segmentation for extracting rock glacier boundaries in the Hunza River Basin, located in the eastern Karakoram Mountains. The combination of spectral and terrain features significantly improved the differentiation of rock glaciers from surrounding landforms, establishing a robust basis for model training. A series of comparative experiments were conducted to evaluate the performance of each model. The HRnet model achieved the highest overall accuracy, exhibiting superior capabilities in high-resolution feature representations and generalization. Using the HRnet framework, a total of 597 rock glaciers were identified, covering an area of 183.59 km2. Spatial analysis revealed that these rock glaciers are concentrated between elevations of 4000 m and 6000 m, with maximum density near 5000 m, and a predominant south and southwest orientation. These spatial patterns reflect the combined influences of topography, thermal conditions, and snow accumulation on the formation and preservation of rock glaciers. The results confirm the effectiveness of deep learning-based semantic segmentation for large-scale rock glacier mapping. The proposed framework establishes a technical foundation for automated monitoring of alpine landforms and supports future assessments of rock glacier dynamics under climate variability.
1. Introduction
Rock glaciers developed in alpine environments consist of rock debris and interstitial ice, which are influenced by gravity and freeze-thaw cycle, resulting in a tongue-shaped formation [1]. Morphologically, rock glaciers exhibit predominantly lobed and elongated features with distinctive micro-relief geomorphology characterized by transverse ridges and gullies [2,3,4]. The interior of rock glaciers is conceptualized as a dual-fluid system, comprising an internal pore structure and an external layer of rock debris (Figure 1). The former possesses the capacity to store liquid water, while the latter functions as an insulator, which causes a seasonal delay in the melting of ice within rock glaciers [5,6,7]. Since the 1990s, glaciers in the high mountainous regions of Asia have been experiencing retreat and mass losses [8]. Due to their insulating capacity against warm heat, rock debris layers on the surface of rock glaciers play a crucial role as hydrological reservoirs in arid and semi-arid mountain areas, contributing significantly to the overall baseflow of rivers [9,10,11].
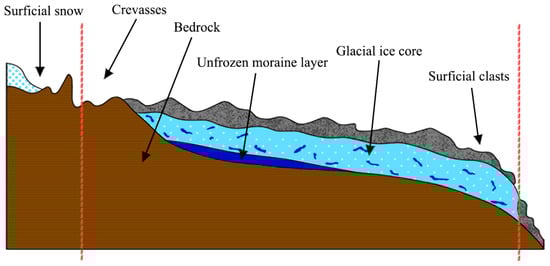
Figure 1.
Internal structure of rock glaciers. (Figure 1 schematically illustrates the general relationship between surface debris, underlying ice, and subglacial moraine material, intended to conceptually show debris insulation and ice preservation processes rather than the exact internal structure of all rock glaciers. The red dashed lines divide the rock glacier into three sections, schematically representing its early, middle, and late developmental stages.).
Early surveys of rock glaciers primarily relied on field investigations and aerial imagery, enabling the collection of detailed quantitative data on rock glacier structures [12,13]. Nevertheless, these approaches are constrained by labor-intensive fieldwork and limited spatial coverage. With the rapid advancement of Earth observation satellite systems, high-resolution satellite images offer richer geospatial information and enhanced feature representation capabilities, providing critical data support for geomorphological investigations in remote and inaccessible regions [14,15,16,17]. For example, Pratima Pandey et al. analyzed the geographical characteristics and hydrological significance of rock glaciers in the northwestern Himalayan region based on high-resolution satellite images from Google Earth Pro through manual visual interpretation [18]. Liu Yong et al. investigated the developmental characteristics and potential formation mechanism of rock glaciers on both sides of the Sangha Gorge in the middle reaches of the Yarlung Tsangpo River, using Gaofen-2 panchromatic imagery and Keyhole black-and-white film imagery [19]. Adrián et al. employed an integrated approach combining Global Navigation Satellite System (GNSS), Terrestrial Laser Scanner (TLS) and Unmanned Aerial Vehicle (UAV) photogrammetry to quantitatively assess rock glacier deformation in the Southern Pyrenees [20]. Levan et al. compiled an inventory of rock glaciers in the Greater Caucasus region based on Google Earth Pro and Sentinel-2 MSI imagery through manual visual interpretation [21].
With the rapid development of deep learning algorithms, particularly Convolutional Neural Networks (CNNs), their superior performance in texture feature extraction and higher recognition accuracy has facilitated widespread adoption in the geosciences [22,23]. For instance, Hu et al. employed the DeepLabV3+ network architecture to analyze rock glacier representations in the West Kunlun Mountains using InSAR data [24]. Erharter et al. proposed a rock glacier mapping approach based on supervised machine learning, integrated with the U-Net image segmentation architecture to improve mapping efficiency [25]. Benjamin et al. combined CNN with object-based image analysis (OBIA) using Sentinel-2 MSI imagery for automatic identification of rock glaciers in regions including the La Laguna Basin in Chilean Andes and the Poqu Basin in central Himalaya [26].
However, compared to other components of the cryosphere, there remains a limited application and implementation of deep learning methods specifically focused on rock glaciers [27]. To address the challenges of heavy workloads [28], long time-consuming, and high subjective uncertainty in remote sensing interpretation of rock glacier boundaries [29], this study proposes a technical framework that combines Sentinel-2 MSI imagery with three state-of-the-art deep learning network models (U-Net, DeepLabV3+, and HRnet) for the automated extraction of rock glacier boundaries. By comparing the performance of these representative network architectures, the accuracy and efficiency of rock glacier identification are quantitatively assessed, thereby providing a methodological reference for regional-scale rock glacier inventory. The objectives of this study are as follows: (1) to develop a feature-fusion approach that integrates spectral and topographic data to enhance textural representation of rock glacier; (2) to quantitatively assess the performance of U-Net, DeepLabV3+, and HRnet models in delineating rock glacier boundaries and to establish the optimal deep learning model; (3) to apply the optimized model to build an inventory of rock glaciers in the Hunza River Basin and analyze its spatial characteristics.
2. Study Area
The Hunza River Basin (35°54′~37°05′N, 74°02′~75°48′E) is situated in the high mountainous region of the central Karakoram in northern Pakistan, with a total area of 13,733 km2 and an elevation ranging from 1409 to 7863 m (Figure 2). It encompasses several peaks exceeding an altitude of 6000 m, such as Lakaposhi Peak (7788 m), Ulta Peak (7388 m), and Ghentgangri Peak (7401 m) [30,31]. Influenced by the topography, the climate within this basin exhibits a distinct vertical zoning pattern. Average annual precipitation ranges from 170–680 mm and progressively increases from northeast to southwest [32,33]. Modern glaciers are widely developed in the basin, with 289 glaciers and a total area of 1916.089 km2 [34]. As an important tributary of the Indus River, the Hunza River primarily receives runoff recharge originating from snow and ice meltwater above an elevation of 3500 m [35]. Additionally, the Hunza River Basin is also an area for rock glaciers and possesses 607 rock glaciers with a total area of 185.78 km2 [36].
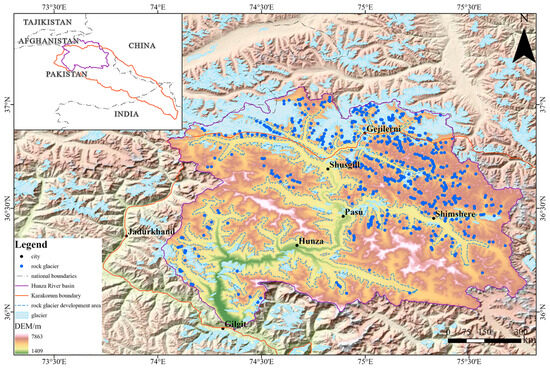
Figure 2.
The Hunza River Basin.
3. Materials
3.1. Sentinel-2 MSI Imagery
The Sentinel-2A satellite, launched by the European Space Agency (ESA) on 23 June 2015, and its successor, the Sentinel-2B satellite launched on 1 July 2017, both carry Multi Spectral Instrument (MSI) sensors that encompass a total of 13 spectral bands. These bands consist of visible (Band2-Band4) and near-infrared (Band8) bands with a spatial resolution of 10 m, vegetation red edge (Band5-Band7, Band8A) and short-wave infrared (Band11-Band12) with a spatial resolution of 20 m, and three other bands (Band1, Band9-Band10) with a spatial resolution of 60 m. The revisit period for each individual satellite is every 10 days while two complementary satellites offer an improved revisit period of every 5 days. Due to their exceptional spatial and temporal resolutions, Sentinel-2 MSI images are extensively utilized in global land observation studies. In this study, we selected and downloaded pre-processed Sentinel-2_MSI_L2A images from the ESA website (https://dataspace.copernicus.eu/). These images have undergone radiometric calibration and atmospheric correction. The specific Sentine-2 MSI images used in this study are shown in Table 1.

Table 1.
Sentinel-2 MSI data used in this study.
3.2. FABDEM
The DEM data selected for this study is FABDEM (Forest And Buildings removed Copernicus DEM), a global open-source dataset derived from the Copernicus Digital Elevation Model (COPDEM) after removing vegetation and buildings [37]. The FABDEM has a spatial resolution of 1 arc second (approximately 30 m) with horizontal accuracy error and vertical accuracy error of 1.12 m and 2.88 m, respectively. The DEM data for the study area was obtained by clipping based on the extent of the Hunza River Basin.
3.3. Inventory of Rock Glaciers in the Hunza River Basin
Hassan et al. compiled the first complete rock glacier inventory for the Hunza River Basin using manual visual interpretation based on high-resolution Google Earth imagery and Planet satellite imagery spanning from 2000 to 2020 [36]. Each rock glacier’s boundary was digitized from the origin (root zone) of the rock glacier to its terminal front slope (foot zone), according to the geomorphological evidence including the front, lateral margins, ridges-and-furrow surface topography, as well as longitudinal and transverse flow structures of rock glaciers.
4. Methodology
The methodology of this study is structured as follows. Firstly, Sentinel-2A/B MSI Level-2A satellite imagery from 2024 was selected as the primary data source. These datasets provide atmospherically corrected surface reflectance products that have undergone orthorectification and geometric correction, ensuring high spatial and radiometric accuracy. To minimise the influence of atmospheric and seasonal variations, all images were screened to include only those with less than 5% cloud cover over the study area. This selection criterion ensured optimal data quality and reduced the likelihood of misclassification caused by cloud or shadow interference. Secondly, the texture and spectral information of rock glacier landforms was enhanced by combining multiple spectral bands to improve feature representation. Thirdly, a deep learning network model was constructed and quantitatively evaluated based on its classification performance [38]. The results were then compared with those of other state-of-the-art semantic segmentation models to identify relative strengths and limitations. The final stage of the research plan involves the application of the optimal model to extract rock glaciers and the analysis of their topographic characteristics within the study area. The research framework underpinning this study has informed the development of a technical roadmap (Figure 3).
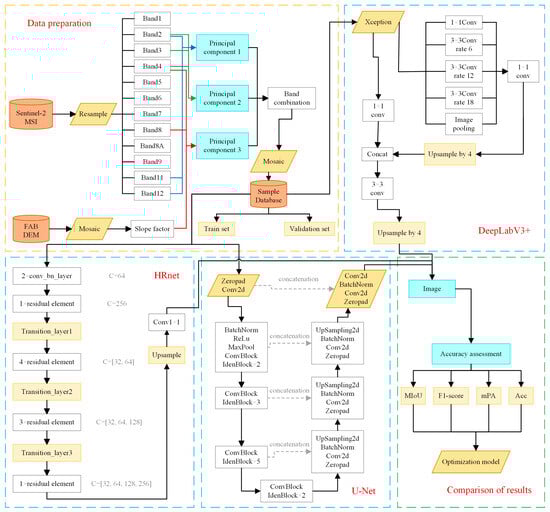
Figure 3.
The research approach. (The yellow dashed box delineates the band-fusion block, the blue dashed box delineates the model-building block, and the green dashed box delineates the accuracy-assessment block).
4.1. Deep Learning Network Models
In order to address the challenges of distinguishing rock glaciers from surrounding terrain, three representative deep learning architectures (U-Net, DeepLabV3+, and HRnet) were selected for comparison based on their feature extraction capabilities and computational efficiency. U-Net is a classical encoder-decoder convolutional neural network designed for pixel-level semantic segmentation [39]. The skip connections enhance feature propagation and spatial detail recovery, enabling effective extraction of multi-scale terrain textures and object boundaries. U-Net has been widely applied in geoscientific mapping as a reliable baseline model for complex landform segmentation. DeepLabV3+ integrates the atrous spatial pyramid pooling (ASPP) module with a decoder module to extract multi-scale contextual features and refine boundary details [40]. The system performs well in heterogeneous environments, capturing both contextual and textural information to improve boundary recognition and reduce misclassification between debris and surrounding terrain [41]. HRnet maintains high-resolution representations by processing multiple scales in parallel and continuously exchanging information across them [42]. This configuration preserves fine spatial details while integrating contextual understanding, resulting in improved performance for precise boundary delineation in remote sensing imagery, albeit with higher computational costs.
Collectively, these three models embody complementary network designs, namely the encoder-decoder (U-Net), multi-scale context extraction (DeepLabV3+), and high-resolution feature maintenance (HRnet). These models provide a balanced comparative framework for evaluating segmentation performance in complex alpine regions.
4.2. Precision Indicators
The mean Pixel Accuracy (mPA), F1-score, Accuracy and Mean Intersection over Union (MIoU) metrics were used as measures to construct an accuracy evaluation system for each model. The mPA represents the proportion of correctly classified pixels for each class individually, while the corresponding precision rates for each class are cumulatively averaged to denote the values of the diagonals in the confusion matrix divided by the sum of each column. The formula is as follows:
where Pi is the pixel accuracy per class and i is the number of classes.
F1-score considers both precision and recall, allowing the maximization of both metrics simultaneously to achieve a harmonious balance. The formula is as follows:
Accuracy is defined as the ratio of correctly classified samples to the total number of samples for a given dataset. The formula is as follows:
where TP and TN are the number of pixels correctly predicted as rock glaciers and correctly predicted as other features, respectively; FP and FN are the number of pixels incorrectly predicted as rock glaciers and incorrectly predicted as other features, respectively.
MIoU is utilized for quantifying the similarity between the predicted results and the actual labels in semantic segmentation tasks. The formula is as follows:
where P and G denote the predicted value and the true value, respectively; k means the total number of classes. The formula indicates that the intersection of the predicted and true values for each class is divided by the concatenation and then averaged.
5. Results and Discussion
5.1. Band Feature Enhancement
In order to enhance the representation of topographic and surface characteristics in remote sensing imagery, this study employed spectral and terrain feature combinations through data selection, processing, and optimization. The feature engineering process comprised three principal components, integrating multispectral and topographic data to improve the accuracy of rock glacier identification [43]. The imagery was resampled to a uniform resolution of 10 m throughout the study. The following description provides a comprehensive overview of the composition and function of each component [44].
The first principal component integrates Shortwave Infrared 1 (Band 11), Shortwave Infrared 2 (Band 12), and the Blue band (Band 2) from Sentinel-2 imagery (Figure 4). This combination enhances the visibility of geological characteristics on rock glacier surfaces by leveraging spectral responses associated with mineral and lithological variations. Bands 11 and 12, located in the shortwave infrared range, are sensitive to rock and mineral composition, with Band 11 responding strongly to schist and sandstone and Band 12 to sandy, clayey or glacial till materials. Band 2 supports the distinction between bare rock, soil, and vegetation. The integration of these bands strengthens the identification of surface lithological heterogeneity while suppressing vegetation interference, providing a clearer characterization of rock glacier material composition [45].
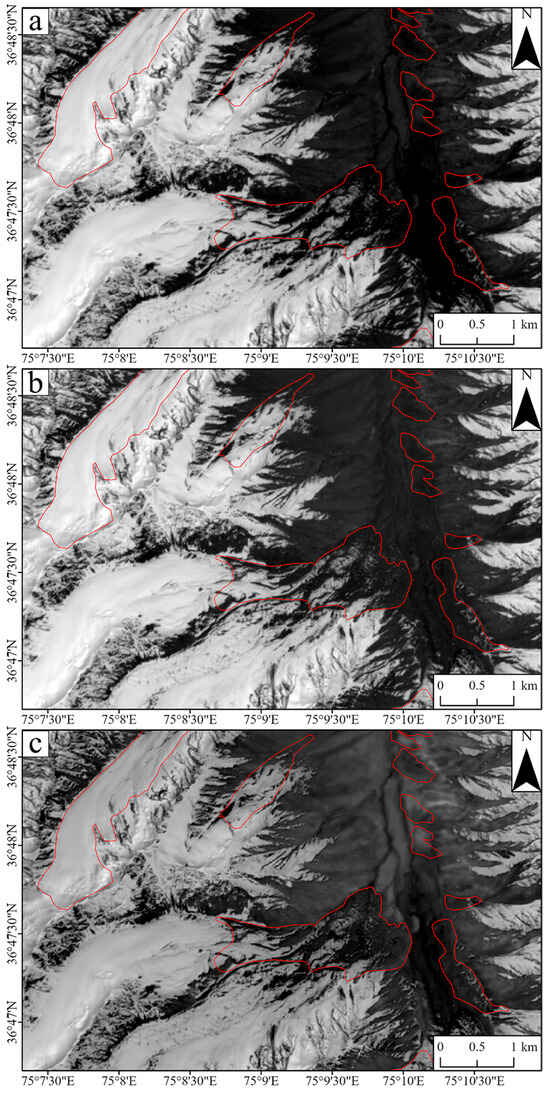
Figure 4.
Principal component feature. (The red line in the figure indicates the rock-glacier boundary. (a) The first principal feature, (b) the second principal feature, (c) the third principal feature).
The second principal component utilises visible bands, including Blue (Band 2), Green (Band 3), and Red (Band 4), to highlight surface texture and reflectance variations (Figure 4). This combination enhances contrast between the main flow zone and the toe region of rock glaciers. Band 4 improves differentiation between vegetated and non-vegetated areas, while Bands 2 and 3 capture finer texture details. High reflectance in Band 4 generally indicates sparsely vegetated or debris-covered regions, whereas low reflectance corresponds to sediment-rich zones. Overall, this component enhances the visual interpretation of surface roughness and debris distribution, improving the recognition of rock glacier flow structures [45].
The third principal component integrates the Red band (Band 4), Near-Infrared band (Band 8), and slope factor (Figure 4). Band 8 provides strong sensitivity to vegetation and bare rock reflectance, while the slope factor effectively highlights edge characteristics and topographic variations. The fusion of slope information with near-infrared data improves spectral contrast between rock glacier margins and surrounding terrain, enhancing the delineation of glacier boundaries. This integration also emphasises differences between steep lateral fronts and gently sloping surfaces, improving separability from tundra, grasslands and debris fields [46].
Following image mosaicking and principal component fusion, band fusion visualization further enhanced terrain differentiation across the study area. In the resulting imagery, low-elevation regions appear predominantly purple, representing mixed vegetation-rock signals, while at higher altitudes snow cover complicates true-color interpretation. Nevertheless, the distinctive morphology of rock glacier tongues and transverse ridges becomes more evident, substantially improving visual discernibility. This multi-component visualization approach enhances both interpretability and data reliability, providing a solid foundation for subsequent classification and model training (Figure 5).
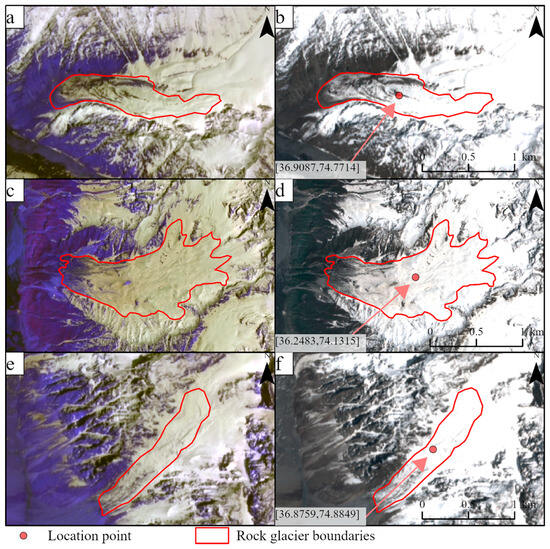
Figure 5.
True and false color comparison of rock glaciers ((a,c,e) are false color images; (b,d,f) are true color images).
5.2. Creation of the Rock Glacier Deep Learning Dataset
The feature-enhanced Sentinel-2 MSI imagery of the study area was processed in ArcGIS Pro3.0.2 to generate image tiles with a size of 256 × 256 pixels, resulting in 12,600 tiles distributed across different subregions. After excluding non-rock glacier areas based on elevation thresholds, 8013 tiles were retained for model training and analysis.
During deep learning training, input image size plays a crucial role in maintaining feature integrity. Oversized inputs can reduce resolution and blur fine details, while undersized inputs may fail to capture complete rock glacier structures. Therefore, a 256 × 256 cropping size was selected as an optimal balance, ensuring adequate spatial coverage and minimizing feature loss. To mitigate edge effects, an overlap stride of 50% of the tile size was applied.
In this study, non-rock glacier regions, including exposed bedrock, vegetation, snow, and shaded areas, were designated as the background class within a binary semantic segmentation framework. The term “rock glacier” was defined as the target category, with all other surface types categorised as background. This configuration enabled the model to focus on acquiring the unique spectral and morphological attributes of rock glaciers while minimising the influence of the surrounding terrain. Rock glaciers were distinguished from debris-covered glaciers through geomorphic indicators, including tongue-shaped morphology, ridged flow structures and the absence of active ice exposure. All training samples were manually validated to exclude debris-covered glaciers exhibiting visible crevasses or melt features. For dataset annotation, the software program LabelMe3.16.7 was used to delineate rock glacier boundaries with polygons according to their visible morphology. The annotations were stored in JSON format, containing category names, polygon coordinates and image paths. These were later converted into segmentation masks that are compatible with deep learning frameworks. To enhance labelling precision, the boundaries were carefully traced following their irregular morphology. Furthermore, all label files underwent multiple rounds of manual review to ensure consistency and alignment with existing catalogued datasets. A total of 156 rock glacier tiles were selected to create high-quality training samples (Figure 6).
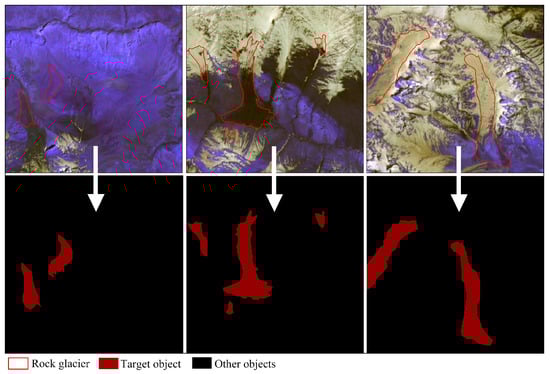
Figure 6.
Samples of rock glaciers. (This image is provided solely as a sample example. The upper row presents the false-color image slices, while the arrows denote the corresponding sample slices shown in the lower row).
5.3. Extraction Results of Rock Glaciers Based on Different Models
The labeled dataset was divided into training and validation sets with a ratio of 9:1, and three semantic segmentation models (U-Net, DeepLabV3+, and HRnet) were trained and evaluated. Each model was trained for 300 epochs, and the corresponding training and validation loss curves were analyzed to assess convergence and generalization performance.
5.3.1. Rock Glacier Extraction Results Based on U-Net
The loss curves of U-Net show that both training and validation losses decrease rapidly during the initial epochs, indicating efficient feature learning at the early stage. After approximately 50 iterations, the validation loss stabilizes near 0.4, while the training loss continues to decrease below 0.2 (Figure 7). This divergence suggests that the model continues improving on the training data but fails to achieve further gains on the validation set, reflecting a certain degree of overfitting. Although U-Net effectively captures key rock glacier features, its generalization ability remains limited when applied to unseen data (Figure 8).
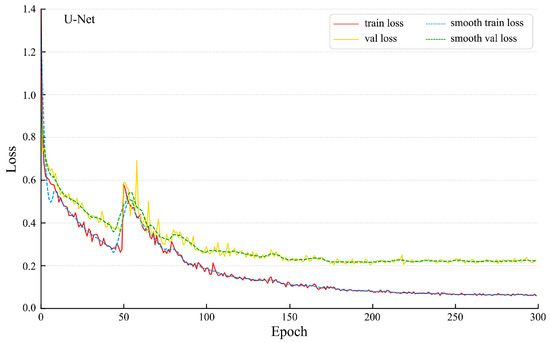
Figure 7.
Loss functions of U-Net model.
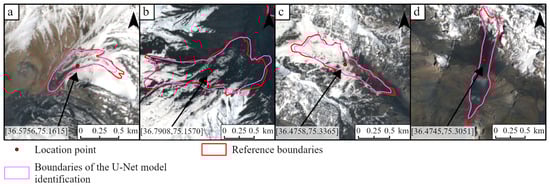
Figure 8.
Identification results of U-Net model.
5.3.2. Rock Glacier Extraction Results Based on DeepLabv3+
DeepLabV3+ exhibits superior performance and improved generalization, as reflected by its smoother loss curves. Both training and validation losses decline rapidly during the early iterations, with validation loss stabilizing around 0.3 after about 60 epochs (Figure 9). Compared with U-Net, DeepLabV3+ achieves a lower final validation loss and a smaller gap between the training and validation curves, indicating better model stability and reduced overfitting. The consistency of the two loss trends demonstrates that DeepLabV3+ effectively balances accuracy and generalization, making it more reliable for complex terrain classification (Figure 10).
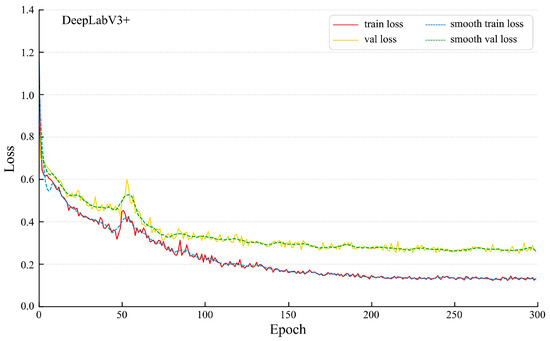
Figure 9.
Loss functions of DeepLabv3+ model.
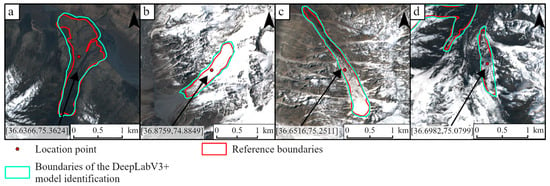
Figure 10.
Identification results of DeepLabv3+ model.
5.3.3. Rock Glacier Extraction Results Based on HRnet
HRnet demonstrates the most favorable convergence and generalization behavior among the three models (Figure 11). The loss decreases sharply during the initial training phase and stabilizes after approximately 50 iterations, with validation loss around 0.2 and training loss near 0.1. The minimal gap between the two curves indicates that HRnet achieves excellent stability and generalization across both training and validation datasets. This performance can be attributed to HRnet’s high-resolution feature representation, which enables the capture of complex spatial structures while avoiding overfitting (Figure 12). The almost identical convergence behavior confirms the robustness of HRnet for rock glacier segmentation under varying data distributions.
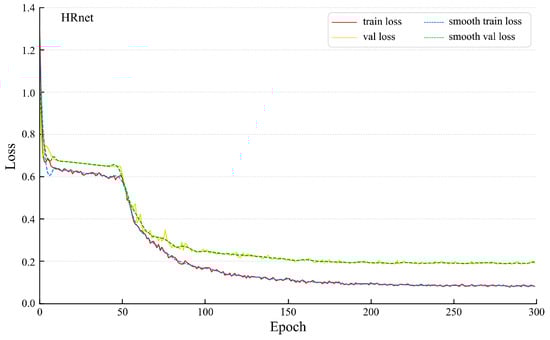
Figure 11.
Loss functions of HRnet model.
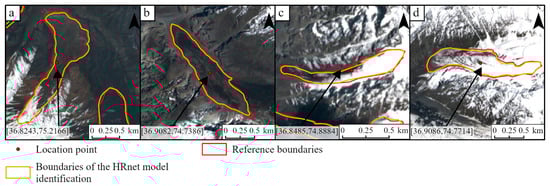
Figure 12.
Identification results of the HRnet model.
5.4. Comprehensive Accuracy Evaluation
Each group of models was subjected to 5 trials, respectively, followed by the selection of their respective optimal training models for accuracy evaluation by different semantic segmentation evaluation metrics. The experimental results (Table 2) showed that HRnet achieved a higher mIOU, with mPA exceeding 90. Additionally, HRnet exhibited slightly superior Accuracy and F1_score compared to the other two models. In terms of iteration speed, HRnet had the fastest performance at 2.19 iterations per second (it/s). On the other hand, DeepLabV3+ yielded relatively lower evaluation scores; however, it exceled in prediction speed among all three models with a high computation rate of 38.84 it/s. Although U-Net outperformed DeepLabV3+ in terms of evaluation indexes, its iteration speed was slower at 1.26 it/s, particularly when dealing with large training samples.
Table 2.
Evaluation of the accuracy of the rock glacier identification model.
5.5. Model Recognition Effects
Nine typical development areas of rock glaciers in the study area (Figure 13) were selected to compare the extraction results obtained from three models. The results showed that U-Net successfully identified rock glacier boundaries, closely resembling those derived from visual interpretation. However, inaccuracies were observed in the delineation of the starting and ending areas of certain rock glaciers, resulting in positional deviations. DeepLabV3+ demonstrated a high level of accuracy in locating nearly all rock glaciers within the region, with a wider identification range and minimal missing boundary extents. Nevertheless, its precision in capturing fine morphological details was relatively lower, providing only an approximate representation of boundary outlines. The recognition results of HRnet generally corresponded to the visually interpreted boundaries, with most identified features closely matching their actual locations. This was particularly evident in the accurate identification of starting and ending areas, consistent with the visual interpretation. Furthermore, HRnet effectively preserved landform texture features.
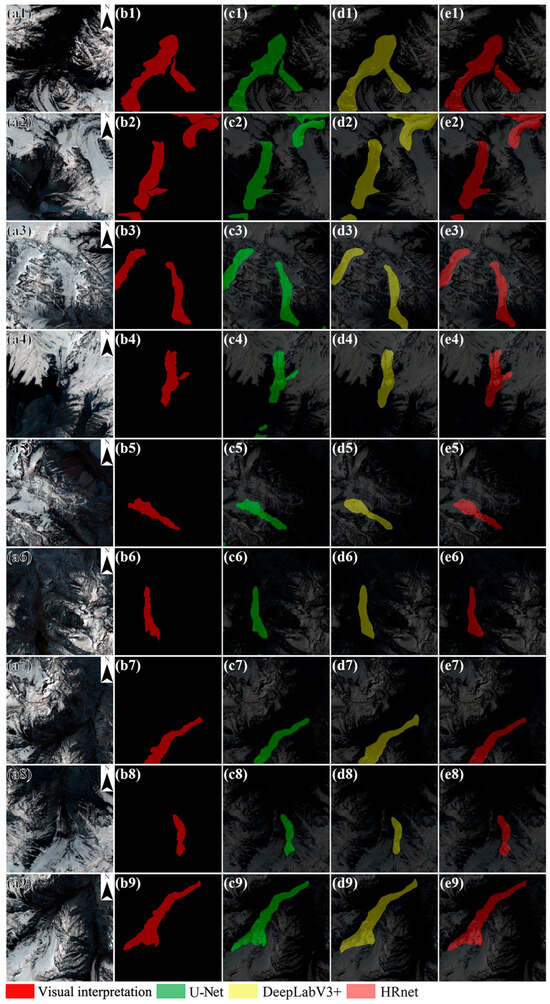
Figure 13.
Identification effectiveness of individual rock glacier for three typical models ((a1~a9) pseudo color image of rock glacier, (b1~b9) visual interpretation of rock glacier outlines, (c1~c9) U-Net identification results, (d1~d9) DeepLabV3+ identification results, (e1~e9) HRnet identification results).
The comparative results among U-Net, DeepLabV3+ and HRnet also provide insights into model adaptability under complex surface conditions. U-Net performed effectively in detecting smaller, isolated rock glaciers due to its ability to retain fine-scale features, while DeepLabV3+ exhibited robustness in recognising large, continuous forms with smoother boundaries, reflecting its multi-scale feature extraction capabilities. HRnet achieved an optimal balance by preserving high-resolution spatial information, making it particularly suitable for the precise delineation of transitional zones between debris-covered areas and adjacent terrain. These differences suggest that architectural design plays a key role in shaping how networks perceive and generalise geomorphological features in high-altitude regions.
The comparison of the recognized slices from the three models with remotely sensed imagery and tagged files revealed the following findings (Figure 14): (1) U-Net demonstrated proficiency in identifying object targets in small areas due to its streamlined structure, enabling it to retain intricate feature details. However, when tasked with recognizing targets with large amounts of data, there were instances of misrecognition, i.e., missing or false recognized objects. Moreover, the overall computational speed of this model was very slow, which hampered its ability to efficiently process extensive datasets. (2) DeepLabV3+ exceled in achieving complete coverage of the entire region while providing information on rock glacier locations. Nevertheless, it was weak at recognizing the details of geomorphological texture features of rock glaciers. This limitation could be attributed to DeepLabV3+’ utilization of lightweight network structures like deep separable convolution during the experiments. Consequently, this model exhibited significantly improved computational efficiency and expeditiously processed a substantial number of recognized targets. (3) In terms of HRnet’s performance, although its identification of rock glacier boundaries lacked the level of detail exhibited by U-Net, it still retained some boundary detail without excessive redundancy or lackluster identification.
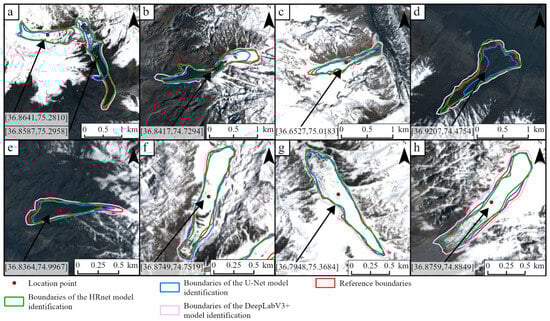
Figure 14.
Comparison of rock glaciers from different models (The figure presents the overlaid recognition results from different models, and the arrow indicates the central geographic coordinates of the rock glacier).
The above computational results showed that HRnet maintained a high-resolution feature map of the input image by combining global and local information through parallel connections. This integration facilitated the network in capturing the intricate details of the target object. Moreover, each layer of HRnet consisted of 32 channels, rendering it relatively lightweight. Overall, compared to DeepLabV3+, HRnet exhibited superior recognition performance for rock glaciers while also outperforming U-Net in terms of speed, accuracy and efficiency when dealing with large volumes of data. The extraction results obtained from HRnet aligned closely with actual rock glacier boundaries; however, challenges arose when identifying features related to smaller rock glaciers, leading to potential omissions in target objects.
5.6. Rock Glacier Extraction Results from the Hunza River Basin
Based on the 12-scene Sentinel-2 MSI images of the study area, a total of 596, 594 and 597 rock glaciers were identified in the Hunza River Basin using the trained U-Net, DeepLabV3+ and HRnet models, respectively. The number of jointly identified entries was found to be 589 with an impressive identification accuracy of HRnet at 98.35%. Compared with manual visual interpretation results, the area range of rock glaciers identified by these three models was around 174.62~192.58 km2. Based on their sizes, rock glaciers were classified into five groups (Table 3). For rock glaciers with smaller areas (<0.1 km2), all three models exhibited low numbers of identifications. Due to its wider identification range, DeepLabV3+ generated a larger area of rock glaciers. Rock glaciers with small areas (0.1~0.5 km2) are also among the more difficult types to judge. The number of identifications in this region was low, while there was an increase in the identification area of DeepLabV3+, indicating an expansion of its identification boundary, and the number of identifications yielded HRnet’s treatment closest to the true value. The easier determination of the extent of rock glaciers in medium sized areas (0.5~1.0 km2), where both HRnet and U-Net results compare well, as well as the comparison of the number and area of rock glacier identifications over large areas (1.0~3.0 km2) suggests that the area inaccuracy of HRnet and DeepLabV3+ did not exceed 1 km2, the area of boundary identifications by HRnet matches the true value in this area range. In summary, the recognition results of HRnet for different area size ranges are more in line with the real discrimination results compared with other models, which ensures the reliability of recognition in the same area range. In addition, its faster processing speed is suitable for large-base databases, and the processing results are used as a boundary reference for manual identification, which can reduce the workload of visual interpretation to a certain extent and improve the efficiency of cataloguing rock glaciers.
Table 3.
Identification results from three typical models for rock glaciers with different areas in the Hunza River Basin.
5.7. Spatial Distribution Characteristics of Rock Glaciers in the Hunza River Basin
Figure 15 presents the spatial distribution of rock glaciers extracted by the HRnet model in the Hunza River Basin. The blue polygons correspond to the HRnet-derived outlines, overlaid on a true-color Sentinel-2 image (10 m resolution). The background imagery highlights the basin’s topographic framework and snow cover, providing a clear visual reference for assessing the agreement between automatically detected rock glaciers and surrounding geomorphic features. Rock glaciers in the Hunza River Basin are predominantly concentrated mid-to high-elevation zones. Their density is especially high in the northeastern and central regions, where cold climatic conditions, abundant snow and ice supply, and favorable topography provide an environment conducive to rock glacier development. Most rock glaciers exhibit a pronounced alignment along major river valleys and their tributaries, reflecting strong geomorphic and hydrological controls. These valleys possess larger contributing areas capable of accumulating substantial glacial debris, which forms the material foundation for rock glacier formation and downslope evolution.
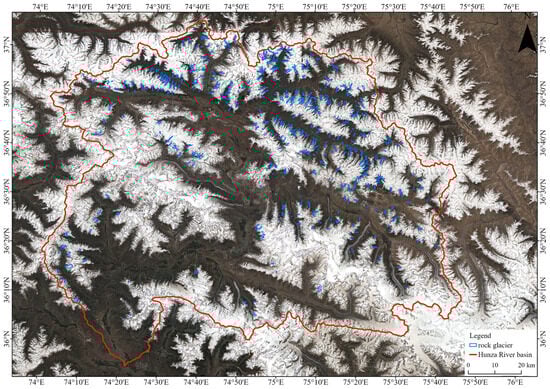
Figure 15.
Rock glacier recognition results in the Hunza River Basin.
While small rock glaciers are widely dispersed across secondary valleys and steep upper slopes, larger and more mature bodies are mainly situated along trunk valleys. This spatial differentiation likely results from variations in local topography, debris thickness and solar radiation.
5.7.1. Altitude-Dependent Distribution
Analysis of elevation distribution of rock glaciers (Figure 16) shows that most rock glaciers occur between 4000 m and 6000 m, with a distinct peak around 5000 m. The area declines sharply above this altitude, likely due to insufficient debris accumulation under extremely low temperatures and solid-phase precipitation at higher elevations. This pattern highlights elevation as a primary control factor in rock glacier development within the basin. The dense glaciation of the region and the interaction between glacial dynamics and surface environmental conditions exert a strong influence on rock glacier formation and persistence.
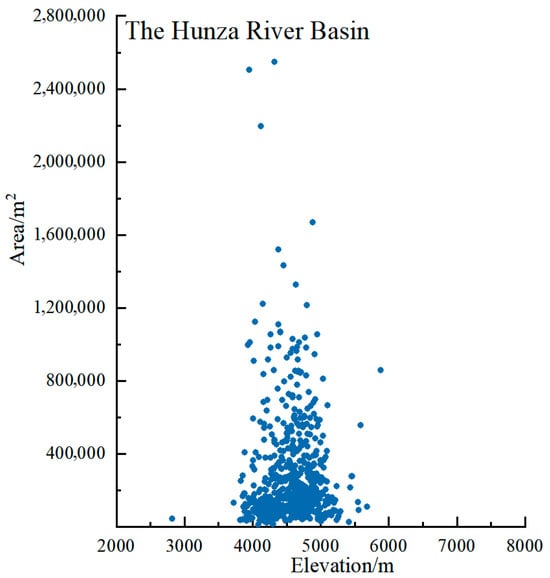
Figure 16.
Correlation between elevation and area of rock glaciers.
5.7.2. Aspect-Dependent Distribution
Aspect analysis (Figure 17) reveals clear slope-dependent differences in rock glacier distribution. Southwest-facing slope aspect contains the largest rock glacier coverage, exceeding 3.2 × 10⁶ m2, representing the dominant share of total area across all orientations. The rose diagram shows that rock glaciers are widely distributed, with notable concentrations falling within the blue (150,000~300,000 m2), green (300,000~450,000 m2), and orange (240,000~320,000 m2) intervals. The prevalence of rock glaciers on southwest slope aspect may be attributed to concentrated precipitation, avalanche accumulation, and favorable thermal conditions. The basin’s position at the margin of the monsoon zone introduces complex climatic and topographic interactions, where moderate temperatures at higher elevations facilitate the long-term preservation of rock glaciers. In contrast, the north (N) and northeast (NE) slope aspect contain smaller rock glacier areas, likely constrained by limited solar radiation.
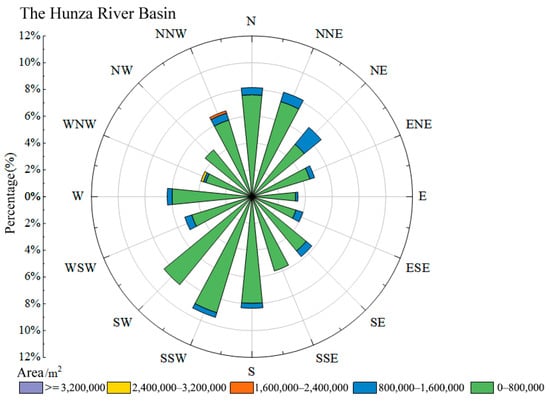
Figure 17.
Correlation between slope aspect and area of rock glaciers.
Overall, the extracted results reveal clear geomorphological regularities that enhance understanding of rock glacier distribution in the Hunza River Basin. Specifically, the spatial clustering of rock glaciers at elevations between 4000 m and 6000 m corresponds to zones of frequent freeze–thaw activity and debris supply, indicating strong topographic control on their formation. Furthermore, the model consistently shows that rock glaciers are predominantly located on south and southwest-facing slope aspect, where increased solar radiation and favourable microclimatic conditions promote both debris movement and partial ice preservation beneath surface material. The spatial patterns demonstrate that deep learning–based mapping improves both boundary delineation accuracy and captures terrain-driven geomorphological differentiation. Collectively, these findings extend beyond the scope of model benchmarking, demonstrating the potential of deep learning interactions at a regional scale. This provides methodological and theoretical foundations for future research in the domains of the cryosphere and geomorphology.
6. Conclusions
The research developed an integrated deep learning framework for automated rock glacier boundary extraction using Sentinel-2 MSI imagery and topographic data in the Hunza River Basin, a representative high-altitude region of the Karakoram. Three semantic segmentation networks were selected for the purpose of evaluating the effectiveness of different architectural paradigms. These networks are U-Net, DeepLabV3+ and HRnet. The architectural paradigms include encoder-decoder design, multi-scale contextual modelling and high-resolution feature preservation. The framework integrates spectral-terrain feature fusion and deep learning modelling to advance large-scale, high-precision mapping of alpine geomorphic features.
- (1)
- Spectral-terrain feature enhancement: A spectral-terrain fusion strategy integrating multispectral bands with topographic parameters was constructed through three principal components. This approach substantially improved the separability of rock glaciers from surrounding landforms by enhancing surface texture, lithological contrast, and topographic differentiation.
- (2)
- Model comparison and performance: A series of comparative experiments were conducted, the results of which demonstrated distinct strengths across the three architectures. U-Net demonstrated optimal performance in preserving fine details at small scales. DeepLabV3+ exhibited robust large-scale generalisation capabilities through multi-scale feature fusion, while HRnet maintained superior spatial fidelity and stability. The findings underscore the pivotal role of model architecture in the extraction of subtle geomorphic boundaries, extending beyond the confines of quantitative accuracy metrics.
- (3)
- Rock glacier inventory: Using the HRnet model, a total of 597 rock glaciers were identified within the Hunza River Basin, covering an area of 183.59 km2. This result validates the model’s applicability for large-scale rock glacier mapping and provides valuable data for studies on the geomorphological and climatic relationships of rock glaciers.
- (4)
- Spatial distribution characteristics: Rock glaciers are primarily concentrated in high-altitude zones and on south- and southwest-facing slopes, where radiation and microclimatic conditions are conducive to debris accumulation and ice preservation, thereby reflecting strong topographic control on rock glacier formation.
- (5)
- Scientific Contribution: Compared with earlier remote sensing studies (e.g., Hu et al. [24]; Erharter et al. [25]), this work proposes a scalable and transferable deep learning workflow that bridges conventional image interpretation and machine learning. The framework provides methodological support for future cryospheric monitoring and advances the application of deep learning in alpine geomorphology.
Future research will extend the framework to multi-temporal and multi-source remote sensing datasets to quantify rock glacier evolution and assess its sensitivity to climatic variability.
Author Contributions
Conceptualization, Y.L., T.X. and X.Y.; methodology, X.Y.; validation, Y.L., T.X. and X.Y.; formal analysis, Y.L.; data curation, Y.L.; writing—original draft preparation, Y.L.; writing—review and editing, T.X. and X.Y.; project administration, T.X.; funding acquisition, T.X. All authors have read and agreed to the published version of the manuscript.
Funding
Fund Name: Deep Earth Probe and Mineral Resources Exploration—National Science and Technology Major Project. Fund Number: 2025ZD1007005.
Data Availability Statement
The datasets utilized in this study are publicly available. The remote sensing imagery was obtained from publicly accessible sources as specified in the manuscript. All processed data and code used for analysis are available from the corresponding author upon reasonable request.
Conflicts of Interest
The authors declare no conflict of interest.
References
- Wanner, C.; Moradi, H.; Ingold, P.; Bocanegra, M.A.C.; Mercurio, R.; Furrer, G. Rock glaciers in the central eastern Alps-how permafrost degradation can cause acid rock drainage, mobilization of toxic elements and formation of basaluminite. Glob. Planet. Change 2023, 227, 104180. [Google Scholar] [CrossRef]
- Gonçalo, P.; Gonçalo, V. Surface displacement of Hurd rock glacier from 1956 to 2019 from historical aerial frames and satellite imagery (Livingston Island, Antarctic Peninsula). Remote Sens. 2023, 15, 3685. [Google Scholar]
- Pavoni, M.; Boaga, J.; Wagner, F.; Bast, A.; Phillips, M. Characterization of rock glaciers environments combining structurally-coupled and petrophysically-coupled joint inversions of electrical resistivity and seismic refraction datasets. J. Appl. Geophys. 2023, 215, 105097. [Google Scholar] [CrossRef]
- Zhang, X.; Feng, M.; Xu, J.; Yan, D.; Wang, J.; Zhou, X.; Li, T.; Zhang, X. Kinematic inventory of rock glaciers in the Nyainqêntanglha range using the MT-InSAR method. Int. J. Digit. Earth 2023, 16, 3923–3948. [Google Scholar] [CrossRef]
- Yu, Z.H.; Guoyu, L.I.; Wei, M.A.; Huijun, J.I.; Dun, C.H.; Yuncheng, M.A.; Qingsong, D.U. Formation mechanism, movement characteristics and hydrological effect of rock glaciers: A review. J. Glaciol. Geocryol. 2023, 45, 409–422. [Google Scholar]
- Buchelt, S.; Blöthe, J.H.; Kuenzer, C.; Schmitt, A.; Ullmann, T.; Philipp, M.; Kneisel, C. Deciphering small-scale seasonal surface dynamics of rock glaciers in the central European Alps using DInSAR time series. Remote Sens. 2023, 15, 2982. [Google Scholar] [CrossRef]
- Cai, J.; He, Y.; Wang, X.; Liu, G. Inventorying and characterizing rock glaciers in the southern Daxue Shan by combining time-series InSAR and optical image interpretation. J. Glaciol. Geocryol. 2023, 45, 774–785. [Google Scholar]
- Bertone, A.; Seppi, R.; Callegari, M.; Cuozzo, G.; Dematteis, N.; Krainer, K.; Marin, C.; Notarnicola, C.; Zucca, F. Unprecedented observation of hourly rock glacier velocity with ground-based SAR. Geophys. Res. Lett. 2023, 50, e2023GL102796. [Google Scholar] [CrossRef]
- Remya, S.N.; Ghosh, T.; Agarwal, V.; Majeed, Z.; Govindha, R.B.; Sharma, A.; Kulkarni, A.V.; Mukhtar, M.A.; Mishra, R. A framework to identify rock glaciers and model mountain permafrost in the Jhelum basin, Kashmir Himalaya, India. Earth Space Sci. 2023, 11, e2023EA003170. [Google Scholar] [CrossRef]
- Hartl, L.; Zieher, T.; Bremer, M.; Stocker-Waldhuber, M.; Zahs, V.; Höfle, B.; Klug, C.; Cicoira, A. Multi-sensor monitoring and data integration reveal cyclical destabilization of the Äußeres Hochebenkar rock glacier. Earth Surf. Dyn. 2023, 11, 117–147. [Google Scholar] [CrossRef]
- Munroe, J.S.; Handwerger, A.L. Contribution of rock glacier discharge to late summer and fall streamflow in the Uinta Mountains, Utah, USA. Hydrol. Earth Syst. Sci. 2023, 27, 543–557. [Google Scholar] [CrossRef]
- Kaldybayev, A.; Sydyk, N.; Yelisseyeva, A.; Merekeyev, A.; Nurakynov, S.; Zulpykharov, K.; Issanova, G.; Chen, Y. The first inventory of rock glaciers in the Zhetysu Alatau: The Aksu and Lepsy river basins. Remote Sens. 2022, 15, 197. [Google Scholar] [CrossRef]
- Meng, T.M.; Petersen, E.I.; Holt, J.W. Rock glacier composition and structure from radio wave speed analysis with dipping reflector correction. J. Glaciol. 2022, 69, 639–657. [Google Scholar] [CrossRef]
- Pandey, P.; Ali, S.N.; Simon, A. Rock glacier oasis: An alternative for agro-pastoralism in a changing environment in the Himalayan cold desert. Geogr. J. 2022, 188, 585–590. [Google Scholar] [CrossRef]
- Jones, D.; Harrison, S.; Anderson, K.; Shannon, S.; Betts, R. Rock glaciers represent hidden water stores in the Himalaya. Sci. Total Environ. 2021, 793, 145368. [Google Scholar] [CrossRef]
- Bertone, A.; Barboux, C.; Bodin, X.; Bolch, T.; Brardinoni, F.; Caduff, R.; Christiansen, H.H.; Darrow, M.M.; Delaloye, R.; Etzelmüller, B.; et al. Incorporating InSAR kinematics into rock glacier inventories: Insights from 11 regions worldwide. Cryosphere 2022, 16, 2769–2792. [Google Scholar] [CrossRef]
- Meng, T.M.; Aguilar, R.; Christoffersen, M.S.; Petersen, E.I.; Larsen, C.F.; Levy, J.S.; Holt, J.W. Photogrammetric monitoring of rock glacier motion using high-resolution cross-platform datasets: Formation age estimation and modern thinning rates. Remote Sens. 2023, 15, 4779. [Google Scholar] [CrossRef]
- Pandey, P.; Ali, S.N.; Das, S.S.; Khan, M.A. Rock glaciers of the semi-arid northwestern Himalayas: Distribution, characteristics and hydrological significance. Catena 2024, 238, 107845. [Google Scholar] [CrossRef]
- Liu, Y.; Zhang, W.; Wei, L.S. Developmental characteristics and potential disaster mechanism of rock glaciers in the middle reaches of the Yarlung Zangbo River. Northwest. Geol. 2024, 57, 44–54. [Google Scholar]
- Martínez-Fernández, A.; Serrano, E.; de Sanjosé Blasco, J.J.; Gómez-Lende, M.; Sánchez-Fernández, M.; Pisabarro, A.; Atkinson, A. Multiple close-range geomatic techniques for the kinematic study of the La Paúl rock glacier, southern pyrenees. Remote Sens. 2023, 16, 134. [Google Scholar] [CrossRef]
- Tielidze, L.G.; Cicoira, A.; Nosenko, G.A.; Eaves, S.R. The first rock glacier inventory for the greater caucasus. Geosciences 2023, 13, 117. [Google Scholar] [CrossRef]
- Agustina, R.; Nicolás, M.R.; Luis, E.B.; Guido, B.; Eleonora, C. Rock glacier and solifluction lobes groundwater as nutrient sources and refugia for unique macroinvertebrate assemblages in a mountain ecosystem of the north Patagonian Andes. Aquat. Sci. 2023, 86, 11. [Google Scholar] [CrossRef]
- Schreder, S.; Sommaruga, R.; Psenner, R.; Chimani, B.; Ganekind, M.; Koinig, K.A. Changes in air temperature, but not in precipitation, determine long-term trends in water chemistry of high mountain lakes of the Alps with and without rock glacier influence. Sci. Total Environ. 2023, 905, 167750. [Google Scholar] [CrossRef] [PubMed]
- Hu, Y.; Liu, L.; Huang, L.; Zhao, L.; Wu, T.; Wang, X.; Cai, J. Mapping and characterizing rock glaciers in the Arid western Kunlun Mountains supported by InSAR and deep learning. J. Geophys. Res. Earth Surf. 2023, 128, e2023JF007206. [Google Scholar] [CrossRef]
- Erharter, G.H.; Wagner, T.; Winkler, G.; Marcher, T. Machine learning-an approach for consistent rock glacier mapping and inventorying-example of Austria. Appl. Comput. Geosci. 2022, 16, 100093. [Google Scholar] [CrossRef]
- Robson, B.A.; Bolch, T.; MacDonell, S.; Hölbling, D.; Rastner, P.; Schaffer, N. Automated detection of rock glaciers using deep learning and object-based image analysis. Remote Sens. Environ. 2020, 250, 112033. [Google Scholar] [CrossRef]
- Brighenti, S.; Engel, M.; Dinale, R.; Tirler, W.; Voto, G.; Comiti, F. Isotopic and chemical signatures of high mountain rivers in catchments with contrasting glacier and rock glacier cover. J. Hydrol. 2023, 623, 129779. [Google Scholar] [CrossRef]
- Guo, Z.M. Inventorying and Spatial Distribution of Rock Glaciers in the Yarlung Zangbo River Basin. Ph.D. Thesis, Yunnan University, Kunming, China, 2019. [Google Scholar]
- Brardinoni, F.; Scotti, R.; Sailer, R.; Mair, V. Evaluating sources of uncertainty and variability in rock glacier inventories. Earth Surf. Process. Landf. 2019, 44, 2450–2466. [Google Scholar] [CrossRef]
- Ahmed, M.F.; Rogers, J.D.; Bakar, M.Z.A. Hunza River watershed landslide and related features inventory mapping. Environ. Earth Sci. 2016, 75, 523. [Google Scholar] [CrossRef]
- Siddique, U.B.; Humaira, K.; Ahmad, D. Spatio-temporal analysis of glacial ice area distribution of Hunza River basin, Karakoram region of Pakistan. Hydrol. Process. 2018, 32, 1491–1501. [Google Scholar]
- Ali, A.F.; Xiao, C.; Anjum, M.N.; Adnan, M.; Nawaz, Z.; Ijaz, M.W.; Sajid, M.; Farid, H.U. Evaluation and comparison of TRMM multi-satellite precipitation products with reference to rain gauge observations in Hunza River basin, Karakoram range, northern Pakistan. Sustainability 2017, 9, 1954. [Google Scholar] [CrossRef]
- Kivanc, B.; Shuhab, D.K.; Mohammad, T.S. The source and fate of sediment and mercury in Hunza River basin, northern Areas, Pakistan. Hydrol. Process. 2015, 29, 579–587. [Google Scholar]
- Maussion, F.; Hock, R.; Paul, F.; Raup, B.; Rastner, P.; Zemp, M.; Andreassen, L.; Barr, I.; Bolch, T.; Kochtitzky, W.; et al. The Randolph Glacier Inventory Version 7.0 User Guide V1.0; RGI Consortium: Boulder, CO, USA, 2023. [Google Scholar]
- Shrestha, M.; Koike, T.; Hirabayashi, Y.; Xue, Y.; Wang, L.; Rasul, G.; Ahmad, B. Integrated simulation of snow and glacier melt in water and energy balance-based, distributed hydrological modeling framework at Hunza River basin of Pakistan Karakoram region. J. Geophys. Res. Atmos. 2015, 120, 4889–4919. [Google Scholar] [CrossRef]
- Hassan, J.; Chen, X.; Muhammad, S.; Bazai, N.A. Rock glacier inventory, permafrost probability distribution modeling and associated hazards in the Hunza River basin, western Karakoram, Pakistan. Sci. Total Environ. 2021, 782, 146833. [Google Scholar] [CrossRef]
- Hawker, L.; Uhe, P.; Paulo, L.; Sosa, J.; Savage, J.; Sampson, C.; Neal, J. A 30 m global map of elevation with forests and buildings removed. Environ. Res. Lett. 2022, 17, 024016. [Google Scholar] [CrossRef]
- Xu, J.; Feng, M.; Wang, J.; Ran, Y.; Qi, Y.; Yang, L.A.; Li, X. Automatically identifying rock glacier based on Gaofen satellite image and deep learning. Remote Sens. Technol. Appl. 2020, 35, 1329–1336. [Google Scholar]
- Ronneberger, O.; Fischer, P.; Brox, T. U-Net: Convolutional networks for biomedical image segmentation. arXiv 2015, arXiv:1505.04597. [Google Scholar] [CrossRef]
- Song, W.; Zheng, N.; Liu, X.; Qiu, L.; Zheng, R. An improved U-Net convolutional networks for seabed mineral image Segmentation. IEEE Access 2019, 7, 82744–82752. [Google Scholar] [CrossRef]
- Zhu, R.; Ye, K.; Yang, B.; Xie, H.; Zhao, L. Feature classification method based on improved DeeplabV3+. Comput. Sci. 2021, 48, 382–385. [Google Scholar]
- Chen, L.; Zhu, Y.; Papandreou, G.; Schroff, F.; Adam, H. Encoder-decoder with atrous separable convolution for semantic image segmentation. arXiv 2018, arXiv:1802.02611. [Google Scholar] [CrossRef]
- Wang, J.; Sun, K.; Cheng, T.; Jiang, B.; Deng, C.; Zhao, Y.; Liu, D.; Mu, Y.; Tan, M.; Wang, X.; et al. Deep high-resolution representation learning for visual recognition. IEEE Trans. Pattern Anal. Mach. Intell. 2020, 43, 3349–3364. [Google Scholar] [CrossRef]
- Tahir, A.A.; Chevallier, P.; Arnaud, Y.; Ahmad, B. Snow cover dynamics and hydrological regime of the Hunza River basin, Karakoram range, northern Pakistan. Hydrol. Earth Syst. Sci. 2011, 15, 2275–2290. [Google Scholar] [CrossRef]
- Janke, J.R. Rock glacier mapping: A method utilizing enhanced TM data and GIS modeling techniques. Geocarto Int. 2001, 16, 5–15. [Google Scholar] [CrossRef]
- Kääb, A.; Reynolds, J.M.; Haeberli, W. Glacier and permafrost hazards in high mountains. Glob. Planet. Change 2005, 56, 25–48. [Google Scholar]


Disclaimer/Publisher’s Note: The statements, opinions and data contained in all publications are solely those of the individual author(s) and contributor(s) and not of MDPI and/or the editor(s). MDPI and/or the editor(s) disclaim responsibility for any injury to people or property resulting from any ideas, methods, instructions or products referred to in the content. |
© 2025 by the authors. Licensee MDPI, Basel, Switzerland. This article is an open access article distributed under the terms and conditions of the Creative Commons Attribution (CC BY) license (https://creativecommons.org/licenses/by/4.0/).