Highlights
What are the main findings?
- The assimilation of FY-4B AGRI clear-sky data produces positive water vapor increments across the lower-to-upper levels in precipitation areas, and the RMSEs of observed and simulated brightness temperatures decrease by 50–60%. This improvement of the analysis field significantly enhances the heavy rainfall forecasts.
- Compared with the two old channels, the addition of the new 7.42 µm channel assimilation can further humidify the air and intensify the ascending motion, thereby improving the accuracy of precipitation location and intensity predictions.
What is the implication of the main finding?
- This study provides an effective framework for the direct assimilation of FY-4B AGRI clear-sky radiance data, which enhances the forecasting of heavy rainfall location and intensity, particularly for extreme weather simulation.
- The FY-4B AGRI water vapor channel demonstrates substantial application potential, highlighting the critical role of China’s independent satellite capabilities in improving the accuracy of numerical weather prediction.
Abstract
The infrared satellite data have become an important source of assimilated data in numerical weather prediction (NWP) models. With the self-constructed assimilated module in the Weather Research and Forecasting model’s Data Assimilation (WRFDA) system, a set of cycling assimilation experiments is conducted to evaluate the added value of assimilating the Fengyun-4B (FY-4B) Advanced Geostationary Radiation Imager (AGRI) water vapor channels clear-sky data on analyses and forecasts for “23 · 7” heavy rainfall. The results show a notable reduction (50~60%) in the root mean square error (RMSE) of observed and simulated brightness temperature after assimilating AGRI and the positive analysis increments in temperature and humidity fields, which are conducive to precipitation formation. Furthermore, changes in humidity analysis caused by AGRI assimilation propagate from the upper to lower levels with assimilation cycling. Compared to the benchmark experiment, the AGRI assimilation experiments produce higher humidity conditions and more pronounced ascending motion, resulting in more realistic rainfall predictions at both location and intensity with higher rainfall scores, especially with the two-step assimilation scheme. Moreover, based on the results from sensitivity experiments, it is proven that the addition of a new channel 11 can further improve humidity and enhance rainfall location and intensity predictions. Overall, the clear-sky assimilation of the FY-4B AGRI water vapor channel data brings notable improvements to “23 · 7” heavy rainfall prediction.
1. Introduction
Heavy rainfall is one of the major meteorological disasters in China, often triggering floods and other hazards that severely impact people’s lives and properties. Consequently, it has remained a persistent research priority in meteorological science. In recent years, the rapid advancement of numerical models and multisource observation systems has significantly improved the capability of numerical weather prediction (NWP) for heavy rainfall forecasting [,,]. Despite these progresses, forecast errors are unavoidable in NWP systems. Studies have demonstrated that initial condition errors constitute a major source of forecast uncertainty, particularly for meso-and micro-scale weather predictions [,].
Previous studies have found that satellite data assimilation has become an effective method for improving the initial field of the model, playing a crucial role in weather forecasting and data assimilation [,]. In particular, they can supplement land and ocean observations and improve the distribution of atmospheric variables, such as model temperature and water vapor distribution, thereby enabling better detection of weather system evolution [,]. At first, owing to constraints in assimilation techniques and observation operators, satellite data assimilation primarily relied on satellite retrievals []. Since the 1990s, with the advancement of radiative transfer models and the rise of variational assimilation methods, the direct assimilation of satellite radiances from microwave and infrared sensors became the mainstream approach in satellite data assimilation [,]. Although the development of infrared data assimilation from geostationary satellites lags behind that of microwave data from polar-orbiting satellites, many studies have shown that the infrared imager data assimilation can improve both global and regional numerical weather forecasts [,,]. For instance, Stengel et al. [] found that assimilating Spinning Enhanced Visible and Infrared Imager (SEVIRI) radiance with the High Resolution Limited Area Model four-dimensional variational (4D-Var) method enhances very short-range forecasts at regional scales. However, due to their rapid development and short life cycles, heavy rainfall events pose a significant challenge for numerical weather prediction. Geostationary satellites, with their high spatiotemporal resolution, offer a distinct advantage in capturing the rapid evolution of weather systems, outperforming polar-orbiting satellites that only scan the same region twice daily. The assimilation of satellite infrared imager data can accurately capture the distribution of atmospheric temperature and humidity and adjust the vertical and horizontal wind fields, leading to significant advantages in both analysis and forecasting capabilities, and thus resulting in great improvements in the quantitative precipitation forecast [,,].
Due to limitations in the radiative transfer model, most assimilation efforts for infrared imager data have primarily focused on water vapor channels [,,,]. These studies indicate that the direct assimilation of water vapor channels from infrared imagers, such as the Advanced Baseline Imager (ABI), the Advanced Himawari Imager (AHI), and SEVIRI, can improve the prediction of water vapor distribution and thermal conditions in the atmosphere, thereby positively impacting numerical forecasts. For instance, Cintineo et al. [] proved that assimilating ABI water vapor brightness temperature markedly improved both the water vapor field and cloud top analysis, resulting in better forecasts of convective storm structures. Meanwhile, the AHI with high-frequency, every-10-minute assimilation also had a favorable effect on the prediction of convective systems []. Overall, the assimilation of water vapor channel data from the geostationary satellite’s infrared imager can clearly improve precipitation forecasts.
The Advanced Geostationary Radiation Imager (AGRI), an infrared imager aboard China’s Fengyun-4 (FY-4) series satellites, has great potential for numerical weather prediction. Previous studies have indicated that the clear-sky assimilation of FY-4A AGRI radiance was beneficial for typhoon and precipitation forecasts [,,]. The subsequent FY-4B AGRI adds a new low-level water vapor channel, expanding the spectral coverage to 15 bands spanning 0.47~13.3 μm and providing more accurate depictions of severe weather [,]. Correspondingly, studies utilizing FY-4B AGRI radiances are now widely applied in parameter retrievals [,,,,]. Its data assimilation has also achieved application in the NWP systems, such as the China Meteorological Administration Global Forecast System (CMA-GFS) and CMA-MESO [,]. Recent work has demonstrated that the direct assimilation of its water vapor channels substantially enhances typhoon intensity and track forecasts [,]. However, the direct assimilation of FY-4B AGRI data for heavy rainfall has not yet been thoroughly investigated and should be studied urgently.
This study evaluates the impact of assimilating FY-4B AGRI clear-sky water vapor channel radiance on heavy rainfall forecasting within the Weather Research and Forecasting Data Assimilation (WRFDA) system [], selecting the “23 · 7” heavy rainfall event as a case study. The subsequent sections of this paper are organized as follows: Section 2 describes the FY-4B AGRI radiance data and assimilation system. The overview of the “23 · 7” heavy rainfall event, the circulation situation, and the experimental configurations are discussed in Section 3. In Section 4, the results of comparative experiments are presented, while the results of sensitive experiments are shown in Section 5. Finally, Section 6 displays the conclusions and discussion.
2. Data and Methods
2.1. Data
AGRI provides continuous observations over East Asia and adjacent regions with high spatiotemporal resolution and multispectral capabilities, which aboard FY-4B shows considerable advancements over its predecessor FY-4A, including the addition of a 7.42 μm low-level water vapor channel and adjustments to the spectral ranges of several other channels [,]. These upgrades substantially enhance the instrument’s capacity for precise observation, providing higher-quality data for data assimilation and weather monitoring applications.
Nowadays, the FY-4B satellite has replaced FY-4A at the main operational longitude of 105°E in March 2024. The scanning mode of FY-4B AGRI is to acquire full disk images every 15 min at equal time intervals. Table 1 shows the detailed characteristics of the 15 spectral channels of FY-4B AGRI, with central wavelength ranging from 0.47 μm to 13.3 μm and spatial resolution ranging from 0.5 km to 4.0 km [,]. Channels 1–6 are visible and near-infrared channels with central wavelength ranging from 0.47 μm to 2.25 μm, dedicated mostly to daytime observations of the Earth’s surface and atmosphere. Channels 7 and 8 are medium-wave infrared channels with the same center wavelength of 3.75 μm, enabling simultaneous detection of both high-temperature and low-temperature targets. Channels 9–11 are water vapor channels operating at central wavelengths of 6.25 μm, 6.95 μm, and 7.42 μm, respectively, and are sensitive to water vapor at different levels of the troposphere, with channel 11 being a newly introduced low-level water vapor channel. Channels 12–14 are infrared window channels with central wavelengths ranging from 8.55 μm to 12 μm, which can be implemented to identify cloud pixels. Channel 15 is the carbon dioxide absorption channel at 13.3 μm, influenced by carbon dioxide in the troposphere [,,]. Based on previous findings, the assimilation of water vapor channels has a positive impact on weather forecasting [,,,,,]. Therefore, the study also focused on the assimilation of AGRI water vapor channels 9, 10, and the newly added channel 11. The AGRI 4 km Level-1 radiance and geolocation data for the full disk, with a temporal resolution of 15 min, are utilized in this study. Meanwhile, the Level-2 CLM (Cloud Mask) product is utilized to identify clear-sky conditions in quality control schemes.

Table 1.
Characterization of FY-4B AGRI channels.
To evaluate precipitation performance, the triple-source merged precipitation product from the China Meteorological Administration Multisource Precipitation Analysis System (CMPAS) serves as the reference dataset, characterized by a high spatial resolution of 0.01° × 0.01° and an hourly temporal resolution [,]. To analyze the circulation situation, this study employs the European Centre for Medium-Range Weather Forecasts (ECMWF) Reanalysis v5 (ERA5) hourly pressure-level dataset, with a temporal resolution of 1 h and a spatial resolution of 0.25° × 0.25° []. The National Centers for Environmental Prediction (NCEP) operational Global Forecast System (GFS) analysis and forecast dataset provides dozens of atmospheric and land-soil variables, with 3-hourly intervals from 0 to 240 h, and 12-hourly intervals from 240 to 384 h. The initial and boundary conditions for the model simulations are provided by the NCEP GFS 6-hourly GFS forecasts, with a horizontal resolution of 0.25° × 0.25° []. The conventional observations used for assimilation are obtained from the NCEP Administrative Data Processing Global Upper Air and Surface Weather Observations dataset, including land surface, marine surface, radiosonde, pibal and aircraft reports from the Global Telecommunications System (GTS) [].
2.2. FY-4B AGRI Assimilation Module in WRFDA System
The WRFDA v4.4 system from the Weather Research and Forecasting (WRF) v4.4 model includes 3D-Var, 4D-Var, and a hybrid assimilation method []. FY-4B AGRI clear-sky assimilation module is self-constructed within WRFDA v4.4 with the Community Radiative Transfer Model (CRTM). In this study, the 3D-Var method is applied for data assimilation experiments. It estimates the atmospheric state by minimizing a cost function using the conjugate gradient method [,]. The cost function is listed as
where x is the atmospheric state vector, is the background state vector, B is the background error (BE) covariance matrix, y is the observation vector, and R is the observation error covariance matrix. H is the observation operator, with CRTM v2.3.0 selected in this study.
Quality control (QC) is an essential step before satellite data assimilation. Based on the data characteristics of AGRI and previous studies [,,], the quality control schemes for the clear-sky assimilation experiment of heavy rainfall in this study are as follows: (1) over land, only retaining observations of the water vapor channel, rejecting all the other channels; (2) ignoring observations with >60° zenith angle; (3) rejecting observations under clouds as defined by the CLM product; (4) discarding observations if their absolute value exceeds 15 K or exceeds three times the standard deviation of the observation error.
Moreover, this study employs the variational bias correction (VarBC) method to correct systematic bias. The corrected observation operator is expressed as a linear combination of BC predictors, as follows:
where is the observation operator after deviation correction, is the observation operator, x is the background field state vector, is the constant term of the bias, and are the ith prediction factor and its coefficient, and is the number of predictors. This study uses a linear combination of 8 predictors: constants, 1000–300 hPa layer thickness, 200–50 hPa layer thickness, surface temperature, total water vapor, the sine of the satellite zenith angle, and its square and cube. For each assimilation, the BC correction coefficients are updated to adapt and then used in the subsequent time step. In this study, the correction coefficients for the heavy rainfall assimilation experiment are initially derived from offline statistics collected every 6 h between 1200 UTC on 24 July and 0600 UTC on 30 July 2023. To minimize error correlation, a 30 km thinning mesh is used to select satellite observations.
3. Experiment Setup
3.1. Overview of Case
From 29 July to 1 August 2023, the Beijing–Tianjin–Hebei (BTH) region was affected by an extremely heavy rainfall event, known as the “23 · 7” heavy rainfall event. The rainfall first appeared on the eastern side of the Taihang Mountains in northern Henan. Then, the precipitation magnitude increased rapidly, and the rainfall center moved northeast to the northeastern part of BTH. As shown in Figure 1, based on CMPAS data, the 72 h accumulated precipitation band is presented as a bow, crossing the BTH and Henan. The heaviest rainfall centers were located in central Beijing and the southwest of Hebei, with a maximum exceeding 500 mm. This heavy rainfall caused widespread flooding, resulting in significant economic losses and numerous casualties.
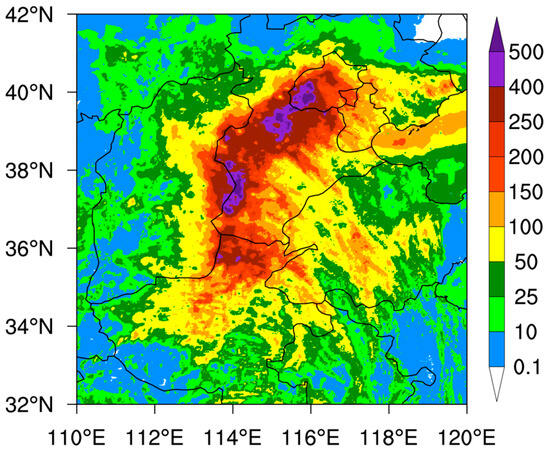
Figure 1.
The 72 h accumulated precipitation (unit: mm) from 0000 UTC on 29 July to 0000 UTC on 1 August, derived from CMPAS data.
This rainfall event is caused by multiple weather systems. Figure 2 shows the circulation situation at different pressure levels of 200 hPa, 500 hPa, and 850 hPa using ERA5 data. To the north of the BTH region, a westerly jet stream existed at 200 hPa, accompanied by strong horizontal divergence (Figure 2a). This divergence generated a pumping effect that, to satisfy mass conservation, drew up air from the lower troposphere and thus favored ascending motion []. At 500 hPa, the remnant circulation of Typhoon Doksuri became quasi-stationary over the western flank of the BTH region, which was blocked by the Western Pacific Subtropical High (WPSH) and an upper-level ridge. Meanwhile, Typhoon Khanun was located over the ocean at approximately 132°E, 17°N (Figure 2b). The southwesterly flow from Doksuri’s remnant circulation converged with Khanun’s southeasterly flow over the BTH region, resulting in persistent moisture transport at 850 hPa (Figure 2c). The nearly stationary typhoon’s inverted trough, combined with the terrain effects of the Taihang Mountain, provided highly favorable conditions for strong ascending motion, sustaining the heavy rainfall event.
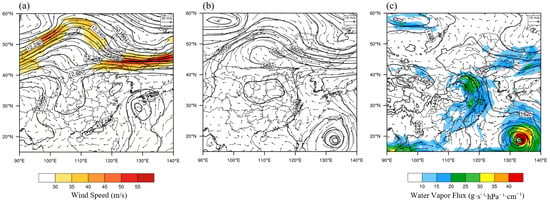
Figure 2.
ERA5 circulation situation at 0000 UTC on 30 July 2023: (a) 200 hPa geopotential height (contours, unit: gpm), and wind field (vectors, unit: m/s, shading represents the upper-level jet); (b) 500 hPa geopotential height (contours, unit: gpm), and wind field (vectors, unit: m/s); (c) 850 hPa geopotential height (contours, unit: gpm), wind field (vectors, unit: m/s), and water vapor flux (shaded, unit: g·s−1·hPa−1·cm−1).
3.2. Experiment Design
In this study, WRF v4.4 is selected for the forecast. The simulated area is depicted in Figure 3. The heavy rainfall experiments construct a double-nested domain configuration with horizontal resolutions of 9 km (521 × 439 grid points) for domain 1 (d01) and 3 km (601 × 499 grid points) for domain 2 (d02), and 50 vertical levels extending up to 50 hPa. The following physical parameterization schemes are employed: WSM6 for the microphysics scheme [], RRTMG for the longwave and shortwave radiation schemes [], Noah for the land surface scheme [], YSU for the boundary layer scheme [], KF cumulus scheme for d01 [], while the cumulus parameterization for d02 is switched off. Initial and boundary conditions are obtained from the NCEP GFS forecasts, with a horizontal resolution of 0.25° × 0.25°.
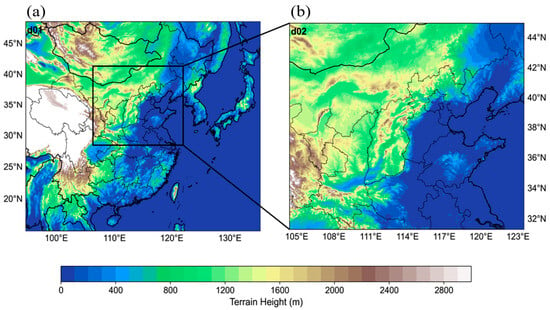
Figure 3.
The simulated area in the WRF model: (a) two nested domains (d01: 9 km, d02: 3 km), d02 is outlined by the black box; (b) d02 configuration. The color shading represents terrain height (unit: m).
The main precipitation period from 0600 UTC on 30 July to 1800 UTC on 31 July 2023 is selected as the experiment period for assimilation experiments. As shown in the flowchart (Figure 4), a 6 h spin-up is conducted at 0600 UTC on 30 July before the assimilation. Subsequently, hourly data assimilation cycles are performed from 1200 UTC on 30 July to 1800 UTC on 30 July. At the final analysis, a 24 h forecast is carried out from 1800 UTC on July 30 to 1800 UTC on July 31. CV7 scheme of the National Meteorological Center (NMC) [], which includes the control variables u, v, temperature, pseudo relative humidity (RHs), and surface pressure (Ps), is selected to generate the BE statistics. These statistics are based on 24 h to 12 h forecast results from 16 July to 15 August 2023, for both d01 and d02.

Figure 4.
The flowchart for assimilation experiments.
For assimilation experiments, conventional observations and AGRI clear-sky radiance data from water vapor channels are utilized. Since heavy rainfall over land exhibits stronger local characteristics and more rapid evolution, 1 h assimilation interval is selected for the assimilation scheme. To explore the impact of FY-4B AGRI clear-sky assimilation, a set of comparative experiments is designed (Table 2). The first experiment (after as CTRL) assimilates only conventional observations in d01 and d02. Figure 5 shows the distribution of assimilated conventional observations in d01 at 1200 UTC on 30 July, which can be seen to cover the simulation area. The second experiment (DA_wv123) builds upon CTRL by additionally assimilating AGRI clear-sky radiance from water vapor channels 9, 10, and 11 in d02. With the clear-sky assimilation scheme, observations affected by clouds are rejected (Figure 6). Furthermore, in order to achieve better satellite assimilation effects, a two-step assimilation approach is adopted in this study. In d02, conventional observations are assimilated at first to preliminarily improve the initial conditions, thereby facilitating more effective assimilation of subsequent data in the second step. This approach has been further supported and validated by the study of Xu et al. [], which confirmed that convective-scale information is better captured when conventional and satellite observations are assimilated through this two-step process. Therefore, the third experiment (DA_2step_wv123) is based on DA_wv123 by first assimilating conventional observations in d02.

Table 2.
Experiment setup.
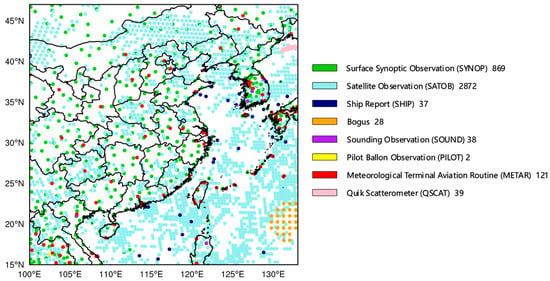
Figure 5.
D01 spatial coverage of assimilated conventional observations valid at 1200 UTC on 30 July 2023.
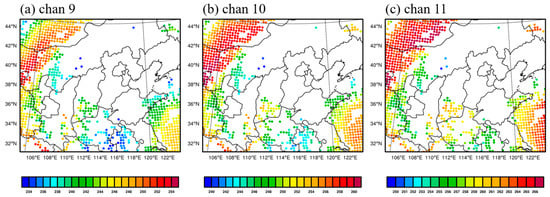
Figure 6.
The spatial distribution of the AGRI observed brightness temperature (unit: K) of (a) channel 9, (b) channel 10, and (c) channel 11 after QC from DA_wv123 at 1200 UTC on 30 July 2023.
4. Experimental Results
4.1. Impact on the Analysis
Figure 7 shows the scatter distribution of observation versus background or analysis at 1800 UTC on 30 July of DA_wv123, illustrating an example used to evaluate the bias correction scheme for AGRI data. Without bias correction, there is a positive bias for channels 9 and 10 (Figure 7a,d), while a negative bias is observed for channel 11 (Figure 7g). It means that, before BC, the background simulated brightness temperatures (TBs) from channels 9 and 10 are generally lower than the observations, but that of channel 11 is higher than the observations. From Figure 7b,e,h, there is a significant decline in the mean bias, standard deviation, and root mean square error (RMSE) for all channels after bias correction. Scatter points corresponding to observed and simulated TBs are more evenly distributed on both sides of the diagonal. It proves that the BC scheme is effective for AGRI data. After data assimilation (Figure 7c,f,i), the scatter points of the analysis are more concentrated along the diagonal. The mean bias for the three channels nearly decreases to 0, while the RMSEs are significantly reduced by about 60% for channel 9 and channel 10, and 50% for channel 11. This indicates that AGRI assimilation substantially improves the analysis field.
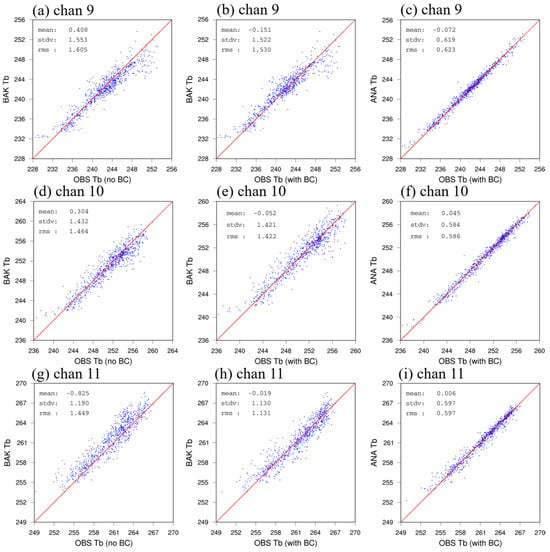
Figure 7.
The scatterplots of (a–c) channel 9, (d–f) channel 10, and (g–i) channel 11 observation versus simulated TBs (unit: K) from background (a,d,g) before and (b,e,h) after bias correction, and (c,f,i) observation versus simulated TBs from the analysis of DA_wv123 valid at 1800 UTC on 30 July 2023.
The differences between the simulated channel 9 TBs (with cloudy CRTM) from CTRL, DA_wv123, and DA_2step_wv123 analyses and the observed TBs from AGRI observation are plotted in Figure 8, respectively. It can be observed that the simulated TB from all assimilation experiment analyses shows a clear underestimation in central Hebei, with a negative bias, while it shows an overestimation at the Shanxi–Hebei border (Figure 8). The large positive bias means that all analyses are drier than the observations, leading to the precipitation underestimation in this area. Compared to CTRL (Figure 8a), after AGRI assimilation, both DA_wv123 (Figure 8b) and DA_2step_wv123 (Figure 8c) effectively reduce the TB differences in Shaanxi, northern Jiangsu, Shandong and southern Hebei, bringing the simulation TBs closer to observations. In central Hebei, the different distributions of CTRL and DA_wv123 are similar, while the difference between DA_2step_wv123 and AGRI observation has markedly reduced, making it closer to the observations.
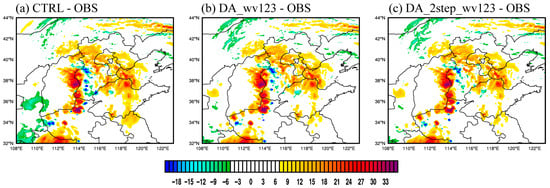
Figure 8.
The difference of brightness temperature (unit: K) between CTRL, DA_wv123, DA_2step_wv123 and AGRI observation for channel 9, namely (a) CTRL-OBS, (b) DA_wv123-OBS and (c) DA_2step_wv123-OBS at 1600 UTC on 30 July 2023.
Figure 9 shows the 850 hPa analysis increments of temperature and QVAPOR at 1800 UTC on 30 July 2023. As can be seen in Figure 9a–c, most of the BTH region is dominated by positive analysis temperature increments, contrasting with the negative increment in Northern Hebei. The significant temperature gradient creates favorable thermal conditions for precipitation. Compared with CTRL, DA_wv123 and DA_2step_wv123, which assimilate AGRI data, markedly enlarge the positive increment center and extend its influence to Hebei. Moreover, DA_2step_wv123 produces a warmer center and a sharper temperature gradient than DA_wv123, thereby enhancing low-level instability and creating advantageous thermodynamic conditions for the heavy rainfall event.
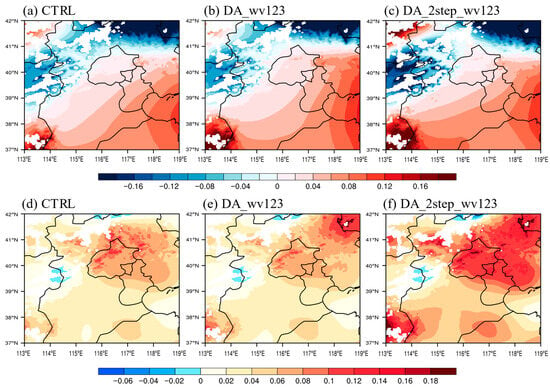
Figure 9.
The analysis increments (analysis minus background) of 850 hPa (a–c) temperature (unit: K), (d–f) QVAPOR (unit: g/kg) for (a,d) CTRL, (b,e) DA_wv123, and (c,f) DA_2step_wv123 at 1800 UTC on 30 July 2023.
Figure 9d–f show that nearly the entire BTH region exhibits a positive QVAPOR increment, demonstrating that data assimilation effectively improves the moisture field, particularly with AGRI assimilation delivering the most marked benefit. Compared with CTRL and DA_wv123, DA_2step_wv123 generates a larger and stronger positive increment area over the BTH and southwest regions, thereby strengthening low-level water vapor and enhancing water vapor prediction.
In summary, AGRI assimilation experiments outperform CTRL, which uses only conventional observations, in improving the analysis of temperature and humidity, with DA_2step_wv123 having the most significant effect.
Figure 10 presents domain-averaged vertical distributions of relative humidity from four analyses across three experiments. At the initial cycle (Figure 10a), AGRI assimilation only brings slight humidification below 700 hPa and above 300 hPa, while the middle troposphere shows drier conditions than CTRL. However, with the increase in assimilation cycling, it can be observed that the effects of AGRI assimilation become increasingly pronounced (Figure 10b,d). Compared to the initial assimilation time (Figure 10a), the distributions of relative humidity show a marked enhancement from the lower to upper troposphere, particularly above 450 hPa in the upper atmosphere. Furthermore, it is noted that, from the first assimilation to the final one, the lower bound of significant humidification in the upper level is dropped from 300 hPa to 500 hPa. This indicates that changes in humidity caused by AGRI assimilation propagate from the upper to lower levels with assimilation cycling.
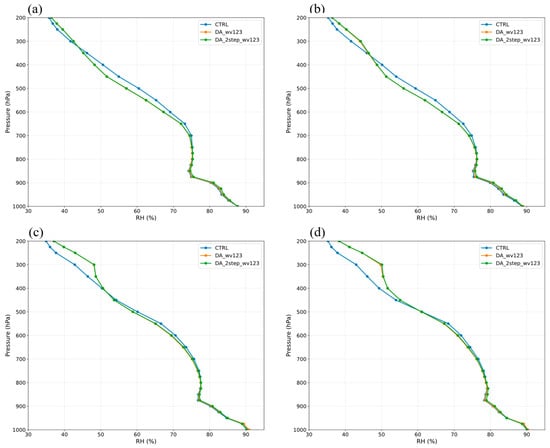
Figure 10.
The domain-averaged vertical distributions of relative humidity from CTRL (blue), DA_wv123 (orange) and DA_2step_wv123 (green) at (a) 1200 UTC, (b) 1400 UTC, (c) 1600 UTC, and (d) 1800 UTC on 30 July 2023.
4.2. Impact on the Forecasts
Figure 11 displays the 24 h accumulated precipitation from 1800 UTC on 30 July to 1800 UTC on 31 July 2023. According to the CMPAS estimation (Figure 11a), this heavy rainfall event exhibits a pronounced northeast–southwest-oriented banded distribution, with an extreme rainfall center exceeding 250 mm located in central Hebei and western Beijing, respectively, causing severe flooding in the BTH region. While all three experiments reasonably capture the overall orientation of the rainband, significant discrepancies are observed in their simulations of the heavy precipitation centers. CTRL notably underestimates both the intensity and spatial extent of precipitation. The maximum rainfall near Beijing is below 250 mm, and the heavy precipitation center in central Hebei appears scattered and shifted northward (Figure 11b). Compared with CTRL, with AGRI assimilation, DA_wv123 slightly expands the coverage of the precipitation center in central Hebei and western Beijing (Figure 11c). DA_2step_wv123, which adopts a two-step assimilation strategy, successfully reproduces independent heavy precipitation centers along the Shanxi–Henan border (Figure 11d). Meanwhile, it shows good agreement with the observation in terms of the precipitation center location in central Hebei. Moreover, both the location and intensity of the simulated precipitation center in Beijing are closer to the observation compared to those in other experiments.
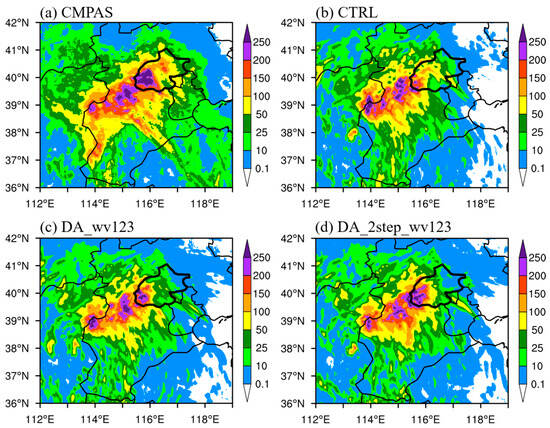
Figure 11.
The 24 h accumulated precipitation distribution (unit: mm) from 1800 UTC 30 to 1800 UTC 31 July in the (a) CMPAS estimation, (b) CTRL, (c) DA_wv123, and (d) DA_2step_wv123.
Furthermore, to quantitatively evaluate the precipitation simulation performance, the performance diagram method is adopted []. This comprehensive approach simultaneously examines four key verification metrics: Probability of Detection (POD), False Alarm Ratio (FAR), BIAS, and Critical Success Index (CSI). The mathematical expressions are defined below:
where TP, FN, and FP denote the grid number of hits, misses, and false alarms, respectively. The CSI value spans from 0 to 1, with higher values signifying greater precipitation forecast accuracy. The BIAS quantifies systematic deviations, where BIAS > 1 reflects overestimation, BIAS < 1 indicates underestimation, and BIAS = 1 represents perfect agreement with observations.
Figure 12 shows the performance diagram for the 24 h accumulated precipitation from 1800 UTC on 30 July to 1800 UTC on 31 July 2023, using the same domain as in Figure 10. The exact values of TP, FN, and FP for each experiment are shown in Table S1 (in Support Material). All three experiments exhibit underestimation in both the intensity and spatial coverage of precipitation (Figure 11b,d), as evidenced by BIAS values consistently around 1/1.5, suggesting a substantial systematic underestimation of rainfall. At lower thresholds of precipitation (Figure 12a,b), the differences among the three assimilation experiments are marginal. By contrast, a distinct shift in result emerges as the precipitation threshold increases (Figure 12c–e), particularly for heavy rainfall events. Compared with CTRL, DA_wv123 shows better simulation capability. Moreover, DA_2step_wv123 demonstrates the best results across all verification metrics, with higher CSI and POD values, and BIAS values closer to 1. Therefore, quantitative precipitation analysis further supports that AGRI assimilation also has a positive impact on heavy rainfall forecasts, and DA_2step_wv123 outperforms other experiments.
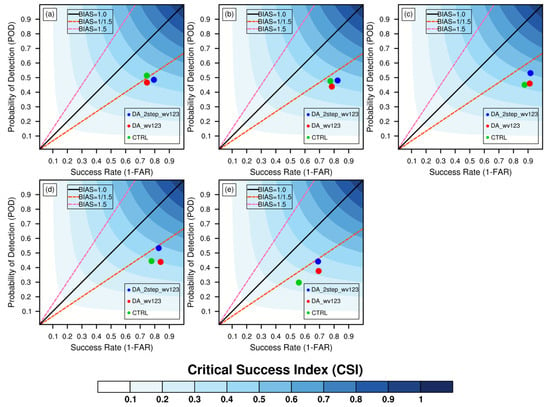
Figure 12.
The Performance diagram for the 24 h accumulated precipitation from CTRL (green), DA_wv123 (red), and DA_2step_wv123 (blue) with a threshold of (a) 30 mm, (b) 50 mm, (c) 100 mm, (d) 150 mm, and (e) 200 mm from 1800 UTC on 30 July to 1800 UTC 31 July 2023.
Abundant water vapor is a prerequisite for persistent heavy rainfall. Typhoon Khanun continuously transports substantial water vapor from the southeast to the precipitation zone. As shown in Figure 13, high water vapor fluxes are primarily distributed in a banded pattern across northern Hebei, which can be attributed to the valley effect induced by the local terrain. When water vapor transported by Typhoon Khanun flows through the constricted topographic passageway, the airflow is forced to accelerate. This acceleration enhances water vapor flux, resulting in the observed banded high-value distribution. Both CTRL (Figure 13a) and DA_wv123 (Figure 13b) exhibit relatively weak water vapor flux over the Beijing area, while DA_2step_wv123 (Figure 13c) maintains strong flux in the western part of Beijing, supplying more abundant moisture to the precipitation zone. This moisture supply is conducive to the development of heavy rainfall over Beijing, and can thereby accurately simulate the intensity of the precipitation to a certain extent.
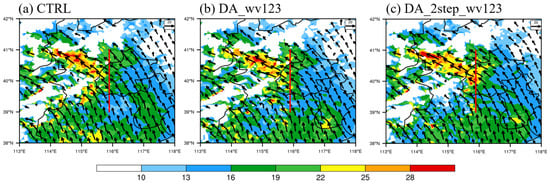
Figure 13.
The 850 hPa water vapor flux (shaded and vector, unit: g·s−1·hPa−1·cm−1) for the (a) CTRL, (b) DA_wv123, and (c) DA_2step_wv123 at 1200 UTC on 31 July 2023. The red line is the cross-section line for Figure 14.
Figure 14 shows the north–south vertical structures of relative humidity, equivalent potential temperature (EPT), and meridional–vertical circulation through the center of the rainstorm system at approximately 115.89°E. Notably, all three experiments exhibit the airflow ascent in the area in front of the mountain range, yet distinct differences emerge in moisture, thermodynamics, and dynamic lifting. Below 700 hPa, favorable humidity conditions are present in all experiments. However, in the CTRL, the mid-to-upper levels are relatively drier compared to the lower levels (Figure 14a). Moreover, the EPT changes rather gently, with weaker upward motion, suggesting weaker convective activity, which may lead to the underestimation of simulated precipitation intensity. In contrast, DA_wv123 exhibits improved mid-level moisture conditions compared to CTRL, along with more obvious EPT variation (Figure 14b). Additionally, regions around 39°N with higher relative humidity display steeper EPT gradients and more pronounced ascending motion, indicating enhanced convective instability. Furthermore, DA_2step_wv123 further adjusts EPT, humidity, and meridional–vertical circulation structure, resulting in consistently high humidity conditions from the lower to the upper levels (Figure 14c). At 39.2°N and 40.2°N, the area of most vigorous convective activity corresponds well with the region of high humidity and strong EPT gradients, which are conducive to precipitation formation. Moreover, a distinct drop in EPT is observed at 40.3°N, likely caused by the intrusion of dry, cold air into the lower levels, further intensifying convective instability. Therefore, AGRI assimilation demonstrates a notable advantage in capturing heavy rainfall, especially DA_2step_wv123.
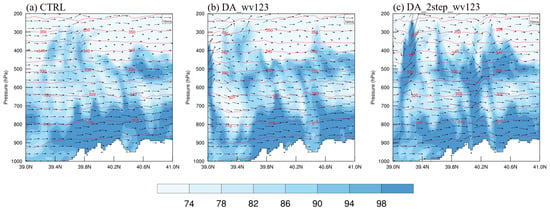
Figure 14.
The vertical cross sections of the relative humidity (shaded, unit: %), equivalent potential temperature (red solid contours, unit: K), and meridional–vertical circulation (v and w × 5, vector, unit: m/s) of (a) CTRL, (b) DA_wv123, and (c) DA_2step_wv123 at 1200 UTC on 31 July 2023. The location of the cross-section is the Beijing precipitation center, about 115.89°E.
5. Sensitivity Experiments
The above results have proved that AGRI’s three water vapor channel assimilation is beneficial for precipitation forecast. Actually, channel 11 at 7.42 μm is a newly added water vapor channel in FY-4B. The impact of the addition of channel 11 is also worth evaluating. Following the two-step assimilation configuration as DA_2step_wv123, an additional experiment is constructed, but assimilating only water vapor channels 9 and 10 as DA_2step_wv12. By comparing these two experiments, channel 11’s specific contribution is investigated.
Figure 15 shows the QVAPOR analysis increments of DA_2step_wv12 and DA_2step_wv123 at 200 hPa, 500 hPa, and 700 hPa at 1800 UTC on 30 July 2023. With AGRI assimilation, both DA_2step_wv12 and DA_2step_wv13 show positive increments from low to upper levels in the water vapor field over North China (Figure 15). However, compared with DA_2step_wv123 (Figure 15b,d,f), DA_2step_wv12 (Figure 15a,c,e) exhibits generally weaker and less organized increments across all levels. At 200 hPa, DA_2step_wv12 shows a more limited spatial coverage and a smoother gradient (Figure 15a), whereas DA_2step_wv123 presents stronger, more widespread positive increments with sharper gradients (Figure 15b). The 500 hPa and 700 hPa show similar patterns of increments (Figure 15c–f), but with different intensities, whereas DA_2step_wv12 shows relatively weaker intensities and less defined gradients (Figure 15c,e) than DA_2step_wv123 (Figure 15d,f). Overall, the QVAPOR increments in DA_2step_wv12 are generally weaker and less pronounced than those in DA_2step_wv123. It is clear that DA_2step_wv123, with the new channel 11 assimilation, has effectively optimized the moisture field, resulting in a higher-quality analysis field and promising more accurate results.
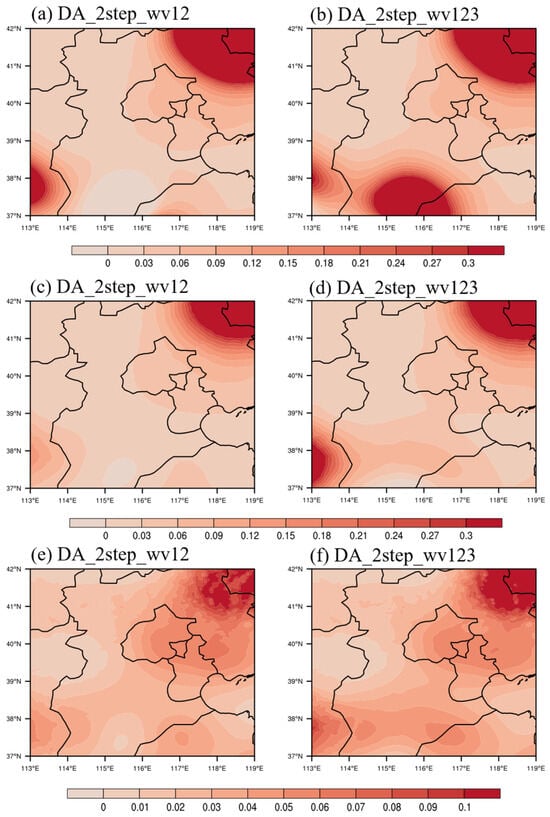
Figure 15.
The QVAPOR analysis increments (analysis minus background) at (a,b) 200 hPa (unit: 10−2 g/kg), (c,d) 500 hPa (unit: g/kg), (e,f) 700 hPa (unit: g/kg) of DA_2step_wv12 (left) and DA_2step_wv123 (right) at 1800 UTC on 30 July 2023.
Figure 16 shows the 24 h accumulated precipitation from 1800 UTC on 30 July to 1800 UTC on 31 July 2023. Compared to CMPAS estimation (Figure 16a) and DA_2step_wv123 (Figure 16c), DA_2step_wv12 (Figure 16b) produces a stronger and more northerly concentrated precipitation center in central Hebei, while a weaker center over the western part of Beijing. It demonstrates that the assimilation of low-level water vapor channel 11 can lead to substantial improvements in reproducing the precipitation center, with both spatial positioning and intensity aligning closely with CMPAS estimation. These results highlight the critical role of assimilating channel 11 in heavy rainfall simulations.

Figure 16.
The 24 h accumulated precipitation distribution (unit: mm) from 1800 UTC on 30 July to 1800 UTC on 31 July in the (a) CMPAS estimation, (b) DA_2step_wv12, and (c) DA_2step_wv123.
As shown in Figure 16, compared to DA_2step_wv123, DA_2step_wv12 has larger rainfall coverage below 50 mm accumulated precipitation in southern Hebei and northern Shandong, more closely aligning with the CMPAS. As a result, it creates higher CSI values at 30 mm and 50 mm (Figure 17). In contrast, at large thresholds (>100 mm), DA_2step_wv123 better captures the spatial distribution and intensity of heavy precipitation in central Hebei and western Beijing compared to the DA_2step_wv12 (Figure 16). Therefore, it achieves significantly higher CSI values, underscoring its decisive advantage in forecasting the extremely heavy rainfall. This enhanced capability stems primarily from the assimilation of channel 11 data, which provides critical low-level moisture information. The marked improvement in both quantitative precipitation estimation quality and heavy rainfall forecasting highlights the indispensable role of channel 11 in heavy rainfall prediction.
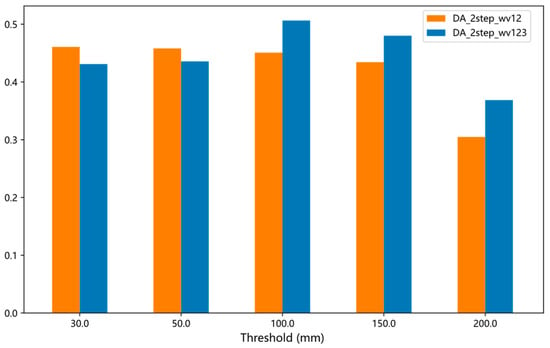
Figure 17.
The CSI score for the 24 h accumulated precipitation for the DA_2step_wv12 (orange) and DA_2step_wv123 (blue) with a threshold of 30 mm, 50 mm, 100 mm, 150 mm, and 200 mm from 1800 UTC 30 to 1800 UTC 31 July 2023.
Due to topographic blocking by the Taihang Mountains, low-level easterly winds generate strong convergent uplift over the piedmont plain and windward slopes, which facilitates the accumulation of moisture and leads to higher relative humidity in this region (Figure 18). In the DA_2step_wv12, distinct ascending motion is observed between 600 hPa and 200 hPa, and this ascending zone corresponds well with the areas of high humidity and actual precipitation (Figure 18a). Compared to DA_2step_wv12, the DA_2step_wv123 exhibits two significant ascents induced by the stronger easterly flow, which are located at two sides of the ascending region of DA_2step_wv12. Additionally, the eastern ascending motion extends higher and develops stronger, further enhancing moisture accumulation (Figure 18b). From the lower to the upper levels, high humidity conditions are maintained, indicating more favorable moisture conditions. Combined with the intense ascending flow, these conditions ultimately lead to enhanced precipitation in Beijing.
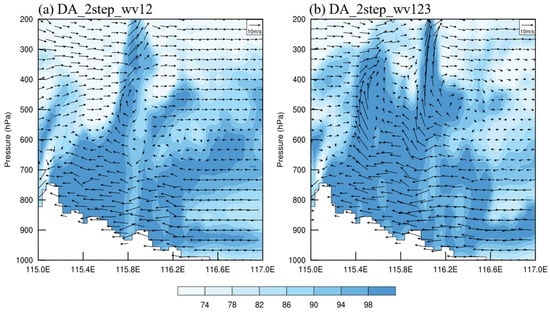
Figure 18.
The vertical cross sections of the relative humidity (shaded, unit: %) and zonal–vertical circulation (u and w × 5, vector, unit: m/s) of (a) DA_2step_wv12, (b) DA_2step_wv123 at 0600 UTC on 31 July 2023. The location of the cross-section is the Beijing precipitation center, about 40°N.
6. Conclusions and Discussion
The FY-4B AGRI assimilation module is self-developed within the WRFDA v4.4 system, including the CRTM model, the VarBC scheme, and quality control methods. In order to evaluate the impact of AGRI clear-sky assimilation on heavy rainfall, a case study was conducted for the “23 · 7” heavy rainfall in 2023.
Data from channels 9, 10, and 11 from AGRI and conventional observations were directly assimilated into assimilation experiments. Compared to CTRL, which assimilated only conventional observations, AGRI assimilation showed more significant improvements in the analysis fields. After data assimilating AGRI water vapor channel data, the RMSE of observed and simulated TBs from the analysis decreased by 50–60%. Moreover, AGRI assimilation improved the analysis of temperature and humidity. Furthermore, with the increase in assimilation cycling, changes in humidity analysis caused by AGRI assimilation propagated from the upper to lower levels. Based on preliminary results from an additional conventional-observation assimilation, DA_2step_wv123 achieved lower RMSE and further improved temperature and humidity analyses.
With the improved initial condition, AGRI assimilation experiments exhibited higher humidity and stronger EPT gradients than CTRL, which are conducive to precipitation formation. Combined with improved depiction of dynamic and thermodynamic processes, assimilation experiments produced more realistic simulations of both the location and intensity of precipitation. In particular, DA_2step_wv123 outperformed other experiments on the heavy rainfall in Beijing.
The assimilation effect of the newly added low-level water vapor channel 11 was also discussed. Compared with DA_2step_wv123, DA_2step_wv12 without channel 11 showed weaker water vapor increments and smaller CSI values for heavy rainfall. It proved that channel 11 had a significant impact on the analysis fields of humidity, playing a crucial role in enhancing AGRI assimilation performance. Moreover, the incorporation of channel 11 significantly improved both the location and intensity forecasts of precipitation.
Additional sensitivity experiments were also conducted to investigate different assimilation schemes, such as implementing seven predictors for BC, excluding “total water vapor”, and assimilating AGRI data in two domains. However, these experiments showed a larger RMSE between observed and simulated brightness temperatures after BC, resulting in more inaccurate rainfall predictions (Figures S1–S5 in Supplementary Materials).
This study represents an assessment of FY-4B AGRI water vapor channel data assimilation in extreme rainfall forecasts with a self-developed WRFDA module. To further enhance analysis and forecast quality, future efforts should focus on refining quality control and bias correction schemes for AGRI radiance. While this study employed clear-sky radiance assimilation with 3D-Var, more advanced techniques such as 4D-Var, hybrid assimilation, and all-sky data assimilation could be explored to extract atmospheric information more effectively. Additionally, this study assimilated only water vapor channel observations over land, while the potential benefit of other infrared channels for severe weather forecasts is also worth exploring.
Supplementary Materials
The following supporting information can be downloaded at: https://www.mdpi.com/article/10.3390/rs17233808/s1.
Author Contributions
Conceptualization, C.Y.; Data curation, T.Z.; Formal analysis, C.Y., T.Z., B.S. and Q.S.; Funding acquisition, C.Y. and J.M.; Methodology, C.Y.; Software, T.Z.; Visualization, C.Y. and T.Z.; Writing—original draft, C.Y. and T.Z.; Writing—review and editing, C.Y. and J.M. All authors have read and agreed to the published version of the manuscript.
Funding
This research was funded by the National Key R&D Program of China (Grant No.2024YFC2815702), the Heavy Rainfall Research Foundation of China (Grant No. BYKJ2024M11), and the National Natural Science Foundation of China (Grant No. 42192553).
Data Availability Statement
The AGRI radiance data and retrieval data were downloaded from the National Satellite Meteorological Center (NSMC) (https://satellite.nsmc.org.cn/portalsite/Data/DataView.aspx?SatelliteType=1&SatelliteCode=FY4B (accessed on 1 May 2025)). Part of the software was associated with the National Center for Atmospheric Research (NCAR) using the new version 4.4 of the WRF and WRFDA system. The reanalysis data were obtained from the National Centers for Environmental Prediction (NCEP) (https://rda.ucar.edu/datasets/d084001 (accessed on 1 May 2025)). The conventional observations used for assimilation are obtained from the National Centers for Environmental Prediction Administrative Data Processing Global Upper Air and Surface Weather Observations.
Acknowledgments
We would like to express our gratitude to the editors and reviewers for their insightful comments and valuable suggestions on our manuscript. We acknowledge the High Performance Computing Center of Nanjing University of Information Science & Technology for their support of this work.
Conflicts of Interest
The authors declare no conflicts of interest.
References
- Bauer, P.; Thorpe, A.; Brunet, G. The Quiet Revolution of Numerical Weather Prediction. Nature 2015, 525, 47–55. [Google Scholar] [CrossRef]
- Brotzge, J.; Berchoff, D.; Carlis, D.; Carr, F.; Carr, R.H.; Gerth, J.; Gross, B.; Hamill, T.; Haupt, S.; Jacobs, N.; et al. Challenges and Opportunities in Numerical Weather Prediction. Bull. Am. Meteorol. Soc. 2023, 104, 698–705. [Google Scholar] [CrossRef]
- Charlton-Perez, C.; Cloke, H.L.; Ghelli, A. Rainfall: High-Resolution Observation and Prediction. Meteorol. Appl. 2015, 22, 1–2. [Google Scholar] [CrossRef]
- Bei, N.; Zhang, F. Impacts of Initial Condition Errors on Mesoscale Predictability of Heavy Precipitation along the Mei-Yu Front of China. Q. J. R. Meteorol. Soc. 2007, 133, 83–99. [Google Scholar] [CrossRef]
- Hwang, J.; Cha, D.; Yoon, D.; Goo, T.; Jung, S. Effects of Initial and Boundary Conditions on Heavy Rainfall Simulation over the Yellow Sea and the Korean Peninsula: Comparison of ECMWF and NCEP Analysis Data Effects and Verification with Dropsonde Observation. Adv. Atmos. Sci. 2024, 41, 1787–1803. [Google Scholar]
- Derber, J.; Wu, W. The Use of TOVS Cloud-Cleared Radiances in the NCEP SSI Analysis System. Mon. Weather Rev. 1998, 126, 2287–2299. [Google Scholar] [CrossRef]
- Zhang, P.; Lu, Q.; Hu, X.; Gu, S.; Yang, L.; Min, M.; Chen, L.; Xu, N.; Sun, L.; Bai, W.; et al. Latest Progress of the Chinese Meteorological Satellite Program and Core Data Processing Technologies. Adv. Atmos. Sci. 2019, 36, 1027–1045. [Google Scholar]
- Li, J.; Li, J.; Otkin, J.; Schmit, T.; Liu, C. Warning Information in a Preconvection Environment from the Geostationary Advanced Infrared Sounding System—A Simulation Study Using the IHOP Case. J. Appl. Meteorol. Climatol. 2011, 50, 776–783. [Google Scholar]
- Qin, Z.; Zou, X.; Weng, F. Evaluating Added Benefits of Assimilating GOES Imager Radiance Data in GSI for Coastal QPFs. Mon. Weather Rev. 2013, 141, 75–92. [Google Scholar]
- Smith, W.; Rao, P.; Koffler, R.; Curtis, W. The Determination of Sea-Surface Temperature from Satellite High Resolution Infrared Window Radiation Measurements. Mon. Weather Rev. 1970, 98, 604–611. [Google Scholar]
- Eyre, J.; English, S.; Forsythe, M. Assimilation of Satellite Data in Numerical Weather Prediction. Part I: The Early Years. Q. J. R. Meteorol. Soc. 2020, 146, 49–68. [Google Scholar]
- Eyre, J.; Bell, W.; Cotton, J.; English, S.; Forsythe, M.; Healy, S.; Pavelin, E. Assimilation of Satellite Data in Numerical Weather Prediction. Part II: Recent Years. Q. J. R. Meteorol. Soc. 2022, 148, 521–556. [Google Scholar]
- Montmerle, T.; Rabier, F.; Fischer, C. Relative Impact of Polar-Orbiting and Geostationary Satellite Radiances in the Aladin/France Numerical Weather Prediction System. Q. J. R. Meteorol. Soc. 2007, 133, 655–671. [Google Scholar]
- Zou, X.; Qin, Z.; Weng, F. Improved Coastal Precipitation Forecasts with Direct Assimilation of GOES-11/12 Imager Radiances. Mon. Weather Rev. 2011, 139, 3711–3729. [Google Scholar] [CrossRef]
- Ma, Z.; Maddy, E.; Zhang, B.; Zhu, T.; Boukabara, S. Impact Assessment of Himawari-8 AHI Data Assimilation in NCEP GDAS/GFS with GSI. J. Atmos. Ocean. Technol. 2017, 34, 797–815. [Google Scholar]
- Stengel, M.; Undén, P.; Lindskog, M.; Dahlgren, P.; Gustafsson, N.; Bennartz, R. Assimilation of SEVIRI Infrared Radiances with HIRLAM 4D-Var. Q. J. R. Meteorol. Soc. 2009, 135, 2100–2109. [Google Scholar]
- Qin, Z.; Zou, X.; Weng, F. Impacts of Assimilating All or GOES-like AHI Infrared Channels Radiances on QPFs over Eastern China. Tellus A Dyn. Meteorol. Oceanogr. 2017, 69, 1345265. [Google Scholar]
- Qin, Z. Adding CO2 Channel 16 to AHI Data Assimilation over Land Further Improves Short-Range Rainfall Forecasts. Tellus A Dyn. Meteorol. Oceanogr. 2020, 72, 1840210. [Google Scholar]
- Wang, Y.; Liu, Z.; Sen, Y. Added Value of Assimilating Himawari-8 AHI Water Vapor Radiances on Analyses and Forecasts for “7.19” Severe Storm Over North China. J. Geophys. Res. Atmos. 2018, 123, 3374–3394. [Google Scholar]
- Szyndel, M.; Kelly, G.; Thépaut, J. Evaluation of Potential Benefit of Assimilation of SEVIRI Water Vapour Radiance Data from Meteosat-8 into Global Numerical Weather Prediction Analyses. Atmos. Sci. Lett. 2005, 6, 105–111. [Google Scholar]
- Jones, T.; Wang, X.; Skinner, P.; Johnson, A.; Wang, Y. Assimilation of GOES-13 Imager Clear-Sky Water Vapor (6.5 Mm) Radiances into a Warn-on-Forecast System. Mon. Weather Rev. 2018, 146, 1077–1107. [Google Scholar]
- Hutt, A.; Schraff, C.; Anlauf, H.; Bach, L.; Baldauf, M.; Bauernschubert, E.; Cress, A.; Faulwetter, R.; Fundel, F.; Köpken-Watts, C.; et al. Assimilation of SEVIRI Water Vapor Channels with an Ensemble Kalman Filter on the Convective Scale. Front. Earth Sci. 2020, 8, 70. [Google Scholar] [CrossRef]
- Cintineo, R.; Otkin, J.; Jones, T.; Koch, S.; Stensrud, D. Assimilation of Synthetic GOES-R ABI Infrared Brightness Temperatures and WSR-88D Radar Observations in a High-Resolution OSSE. Mon. Weather Rev. 2016, 144, 3159–3180. [Google Scholar]
- Sawada, Y.; Okamoto, K.; Kunii, M.; Miyoshi, T. Assimilating Every-10-minute Himawari-8 Infrared Radiances to Improve Convective Predictability. J. Geophys. Res. Atmos. 2019, 124, 2546–2561. [Google Scholar] [CrossRef]
- Niu, Z.; Zhang, L.; Dong, P.; Weng, F.; Huang, W.; Zhu, J. Effects of Direct Assimilation of FY-4A AGRI Water Vapor Channels on the Meiyu Heavy-Rainfall Quantitative Precipitation Forecasts. Remote Sens. 2022, 14, 3484. [Google Scholar]
- Zhang, X.; Xu, D.; Liu, R.; Shen, F. Impacts of FY-4A AGRI Radiance Data Assimilation on the Forecast of the Super Typhoon “In-Fa” (2021). Remote Sens. 2022, 14, 4718. [Google Scholar]
- Xu, L.; Cheng, W.; Deng, Z.; Liu, J.; Wang, B.; Lu, B.; Wang, S.; Dong, L. Assimilation of the FY-4A AGRI Clear-Sky Radiance Data in a Regional Numerical Model and Its Impact on the Forecast of the “21·7” Henan Extremely Persistent Heavy Rainfall. Adv. Atmos. Sci. 2023, 40, 920–936. [Google Scholar]
- Yang, J.; Zhang, Z.; Wei, C.; Lu, F.; Guo, Q. Introducing the New Generation of Chinese Geostationary Weather Satellites, Fengyun-4. Bull. Am. Meteorol. Soc. 2017, 98, 1637–1658. [Google Scholar] [CrossRef]
- Zhu, Z.; Shi, C.; Gu, J. Characterization of Bias in Fengyun-4B/AGRI Infrared Observations Using RTTOV. Remote Sens. 2023, 15, 1224. [Google Scholar]
- He, Q.; Cui, P.; Chen, Y. Quality Assessment of Operational Sea Surface Temperature Product from FY-4B/AGRI with In Situ and OSTIA Data. Remote Sens. 2024, 16, 2769. [Google Scholar]
- Huang, Y.; Bao, Y.; Petropoulos, G.; Lu, Q.; Huo, Y.; Wang, F. Precipitation Estimation Using FY-4B/AGRI Satellite Data Based on Random Forest. Remote Sens. 2024, 16, 1267. [Google Scholar]
- Wang, W.; Wang, N.; Chen, B. Retrieving Hourly Aerosol Optical Depth for Geostationary Satellite FY-4B/AGRI by Surface-Related Dynamic Spectral Reflectance Ratio Method. Adv. Space Res. 2025, 75, 2484–2505. [Google Scholar] [CrossRef]
- Xia, D.; Zhao, D.; Li, K.; Qiu, Z.; Liu, J.; Luan, J.; Chen, S.; Song, B.; Wang, Y.; Yang, J. Retrieval of Cloud Optical Thickness During Nighttime from FY-4B AGRI Using a Convolutional Neural Network. Remote Sens. 2025, 17, 737. [Google Scholar]
- Zhang, M.; Lai, X.; Zhao, D.; Chen, L.; Cao, G.; Xu, N. Reconstruction of Hourly Sea Surface Temperature Based on FY-4B AGRI. Int. J. Remote Sens. 2025, 46, 6695–6710. [Google Scholar] [CrossRef]
- Lei, L.; Weng, F.; Duan, W.; Chen, Y.; Zhang, L.; Wang, R.; Yang, J.; Qin, X.; Han, W.; Li, J.; et al. Overview and Prospect of Data Assimilation in Numerical Weather Prediction. J. Geophys. Res. 2025, 39, 559–592. [Google Scholar]
- Xie, Y.; Weng, F.; Ye, C.; Liu, R.; Han, X. All-Sky Assimilation of FY-4B AGRI Reflectance in the CMA-MESO Model with ARMS as a Forward Operator. J. Geophys. Res. Atmos. 2025, 130, e2025JD043600. [Google Scholar]
- Niu, Z.; Zhang, L.; Yang, Y.; Han, Y.; Li, H.; Wang, D.; Huang, W.; Weng, F. Assimilating FY-4B AGRI Three Water Vapor Channels in Operational Shanghai Typhoon Model (SHTM) Using GSI-Based 3-DVar Approach. IEEE J. Sel. Top. Appl. Earth Obs. Remote Sens. 2025, 18, 3599–3610. [Google Scholar]
- Yang, C.; Zhong, T.; Min, J. A Preliminary Study of FY-4B AGRI All-Sky Assimilation by WRFDA for Tropical Cyclones. Atmos. Res. 2025, 327, 108377. [Google Scholar]
- Barker, D.; Huang, X.; Liu, Z.; Auligné, T.; Zhang, X.; Rugg, S.; Ajjaji, R.; Bourgeois, A.; Bray, J.; Chen, Y.; et al. The Weather Research and Forecasting Model’s Community Variational/Ensemble Data Assimilation System: WRFDA. Bull. Am. Meteorol. Soc. 2012, 93, 831–843. [Google Scholar]
- National Satellite Meteorological Center (National Center for Space Weather). Available online: https://www.nsmc.org.cn/nsmc/en/instrument/AGRI.html (accessed on 1 June 2025).
- Lu, F.; Zhang, X.; Chen, B.; Liu, H.; Wu, R.; Han, Q.; Feng, X.; Li, Y.; Zhang, Z. FY-4 Geostationary Meteorological Satellite Imaging Characteristics and Its Application Prospects. J. Mar. Meteorol. 2017, 37, 1–12. (In Chinese) [Google Scholar]
- Pan, Y.; Gu, J.; Yu, J.; Shen, Y.; Shi, C.; Zhou, Z. Test of Merging Methods for Multi-Source Observed Precipitation Products at High Resolution over China. Acta Meteorol. Sin. 2018, 76, 755–766. [Google Scholar]
- Shi, C.; Pan, Y.; Gu, J.; Xu, B.; Han, S.; Zhu, Z.; Zhang, L.; Sun, S.; Jiang, Z. A Review of Multi-Source Meteorological Data Fusion Products. Acta Meteorol. Sin. 2019, 77, 774–783. [Google Scholar]
- Hersbach, H.; Bell, B.; Berrisford, P.; Hirahara, S.; Horányi, A.; Muñoz-Sabater, J.; Nicolas, J.; Peubey, C.; Radu, R.; Schepers, D.; et al. The ERA5 Global Reanalysis. Q. J. R. Meteorol. Soc. 2020, 146, 1999–2049. [Google Scholar] [CrossRef]
- National Centers for Environmental Prediction; National Weather Service; NOAA; U.S. Department of Commerce. NCEP GFS 0.25 Degree Global Forecast Grids Historical Archive; NSF National Center for Atmospheric Research: Boulder, CO, USA, 2015. [Google Scholar]
- NOAA; NCEP. NCEP ADP Global Upper Air and Surface Weather Observations; National Center for Atmospheric Research: Boulder, CO, USA, 2008. [Google Scholar]
- Skamarock, W.; Klemp, J.; Dudhia, J.; Gill, D.; Liu, Z.; Berner, J.; Wang, W.; Powers, J.; Duda, M.; Barker, D.; et al. A Description of the Advanced Research WRF Model Version 4; UCAR/NCAR: Boulder, CO, USA, 2019. [Google Scholar]
- Lorenc, A. Analysis Methods for Numerical Weather Prediction. Q. J. R. Meteorol. Soc. 1986, 112, 1177–1194. [Google Scholar] [CrossRef]
- Barker, D.; Huang, W.; Guo, Y.; Bourgeois, A.; Xiao, Q. A Three-Dimensional Variational Data Assimilation System for MM5: Implementation and Initial Results. Mon. Weather Rev. 2004, 132, 897–914. [Google Scholar]
- Quan, M.; Liu, H.; Zhu, Y.; Cheng, L. Study of the Dynamic Effects of the Upper-Level Jet Stream on the Beijing Rainstorm of 21 July 2012. Acta Meteorol. Sin. 2013, 71, 1012–1019. [Google Scholar]
- Hong, S.; Lim, J. The WRF Single-Moment 6-Class Microphysics Scheme (WSM6). J. Korean Meteorol. Soc. 2006, 42, 129–151. [Google Scholar]
- Iacono, M.; Delamere, J.; Mlawer, E.; Shephard, M.; Clough, S.; Collins, W.D. Radiative Forcing by Long-lived Greenhouse Gases: Calculations with the AER Radiative Transfer Models. J. Geophys. Res. 2008, 113, D13103. [Google Scholar]
- Tewari, M.; Chen, F.; Wang, W.; Dudhia, J.; LeMone, M.A.; Mitchell, K.; Ek, M.; Gayno, G.; Wegiel, J.; Cuenca, R. Implementation and Verification of the Unified NOAH Land Surface Model in the WRF Model. In Proceedings of the 20th Conference on Weather Analysis and Forecasting/16th Conference on Numerical Weather Prediction, Seattle, WA, USA, 12–16 January 2004; pp. 11–15. [Google Scholar]
- Hong, S.; Noh, Y.; Dudhia, J. A New Vertical Diffusion Package with an Explicit Treatment of Entrainment Processes. Mon. Weather Rev. 2006, 134, 2318–2341. [Google Scholar] [CrossRef]
- Kain, J.S. The Kain–Fritsch Convective Parameterization: An Update. J. Appl. Meteorol. 2004, 43, 170–181. [Google Scholar] [CrossRef]
- NCAR. WRFDA Data Assimilation System User’s Guide, Version 3.7; NCAR: Boulder, CO, USA, 2014.
- Xu, D.; Zhang, X.; Min, J.; Shen, F. Impacts of Assimilating All-Sky FY-4A AGRI Satellite Infrared Radiances on the Prediction of Super Typhoon In-Fa During the Period with Abnormal Changes. J. Geophys. Res. Atmos. 2024, 129, e2024JD040784. [Google Scholar] [CrossRef]
- Mason, I. Dependence of the Critical Success Index on Sample Climate and Threshold Probability. Aust. Meteorol. Mag. 1989, 37, 75–81. [Google Scholar]
Disclaimer/Publisher’s Note: The statements, opinions and data contained in all publications are solely those of the individual author(s) and contributor(s) and not of MDPI and/or the editor(s). MDPI and/or the editor(s) disclaim responsibility for any injury to people or property resulting from any ideas, methods, instructions or products referred to in the content. |
© 2025 by the authors. Licensee MDPI, Basel, Switzerland. This article is an open access article distributed under the terms and conditions of the Creative Commons Attribution (CC BY) license (https://creativecommons.org/licenses/by/4.0/).