
Characterization of Fresh and Aged Smoke Particles Simultaneously Observed with an ACTRIS Multi-Wavelength Raman Lidar in Potenza, Italy

 , , , , ,
  , , , , , , ,
  , , , , , , , , , and add
Show full author list
, , , , , , , , , and add
Show full author list
Abstract

1. Introduction
2. Materials and Methods
2.1. Multi-Wavelength Raman Lidar POLPO
2.2. Radar, Ceilometer, and Microwave Radiometer
2.3. Aethalometer and ACSM
3. Results
Origin of the Two Observed Layers
4. Discussion
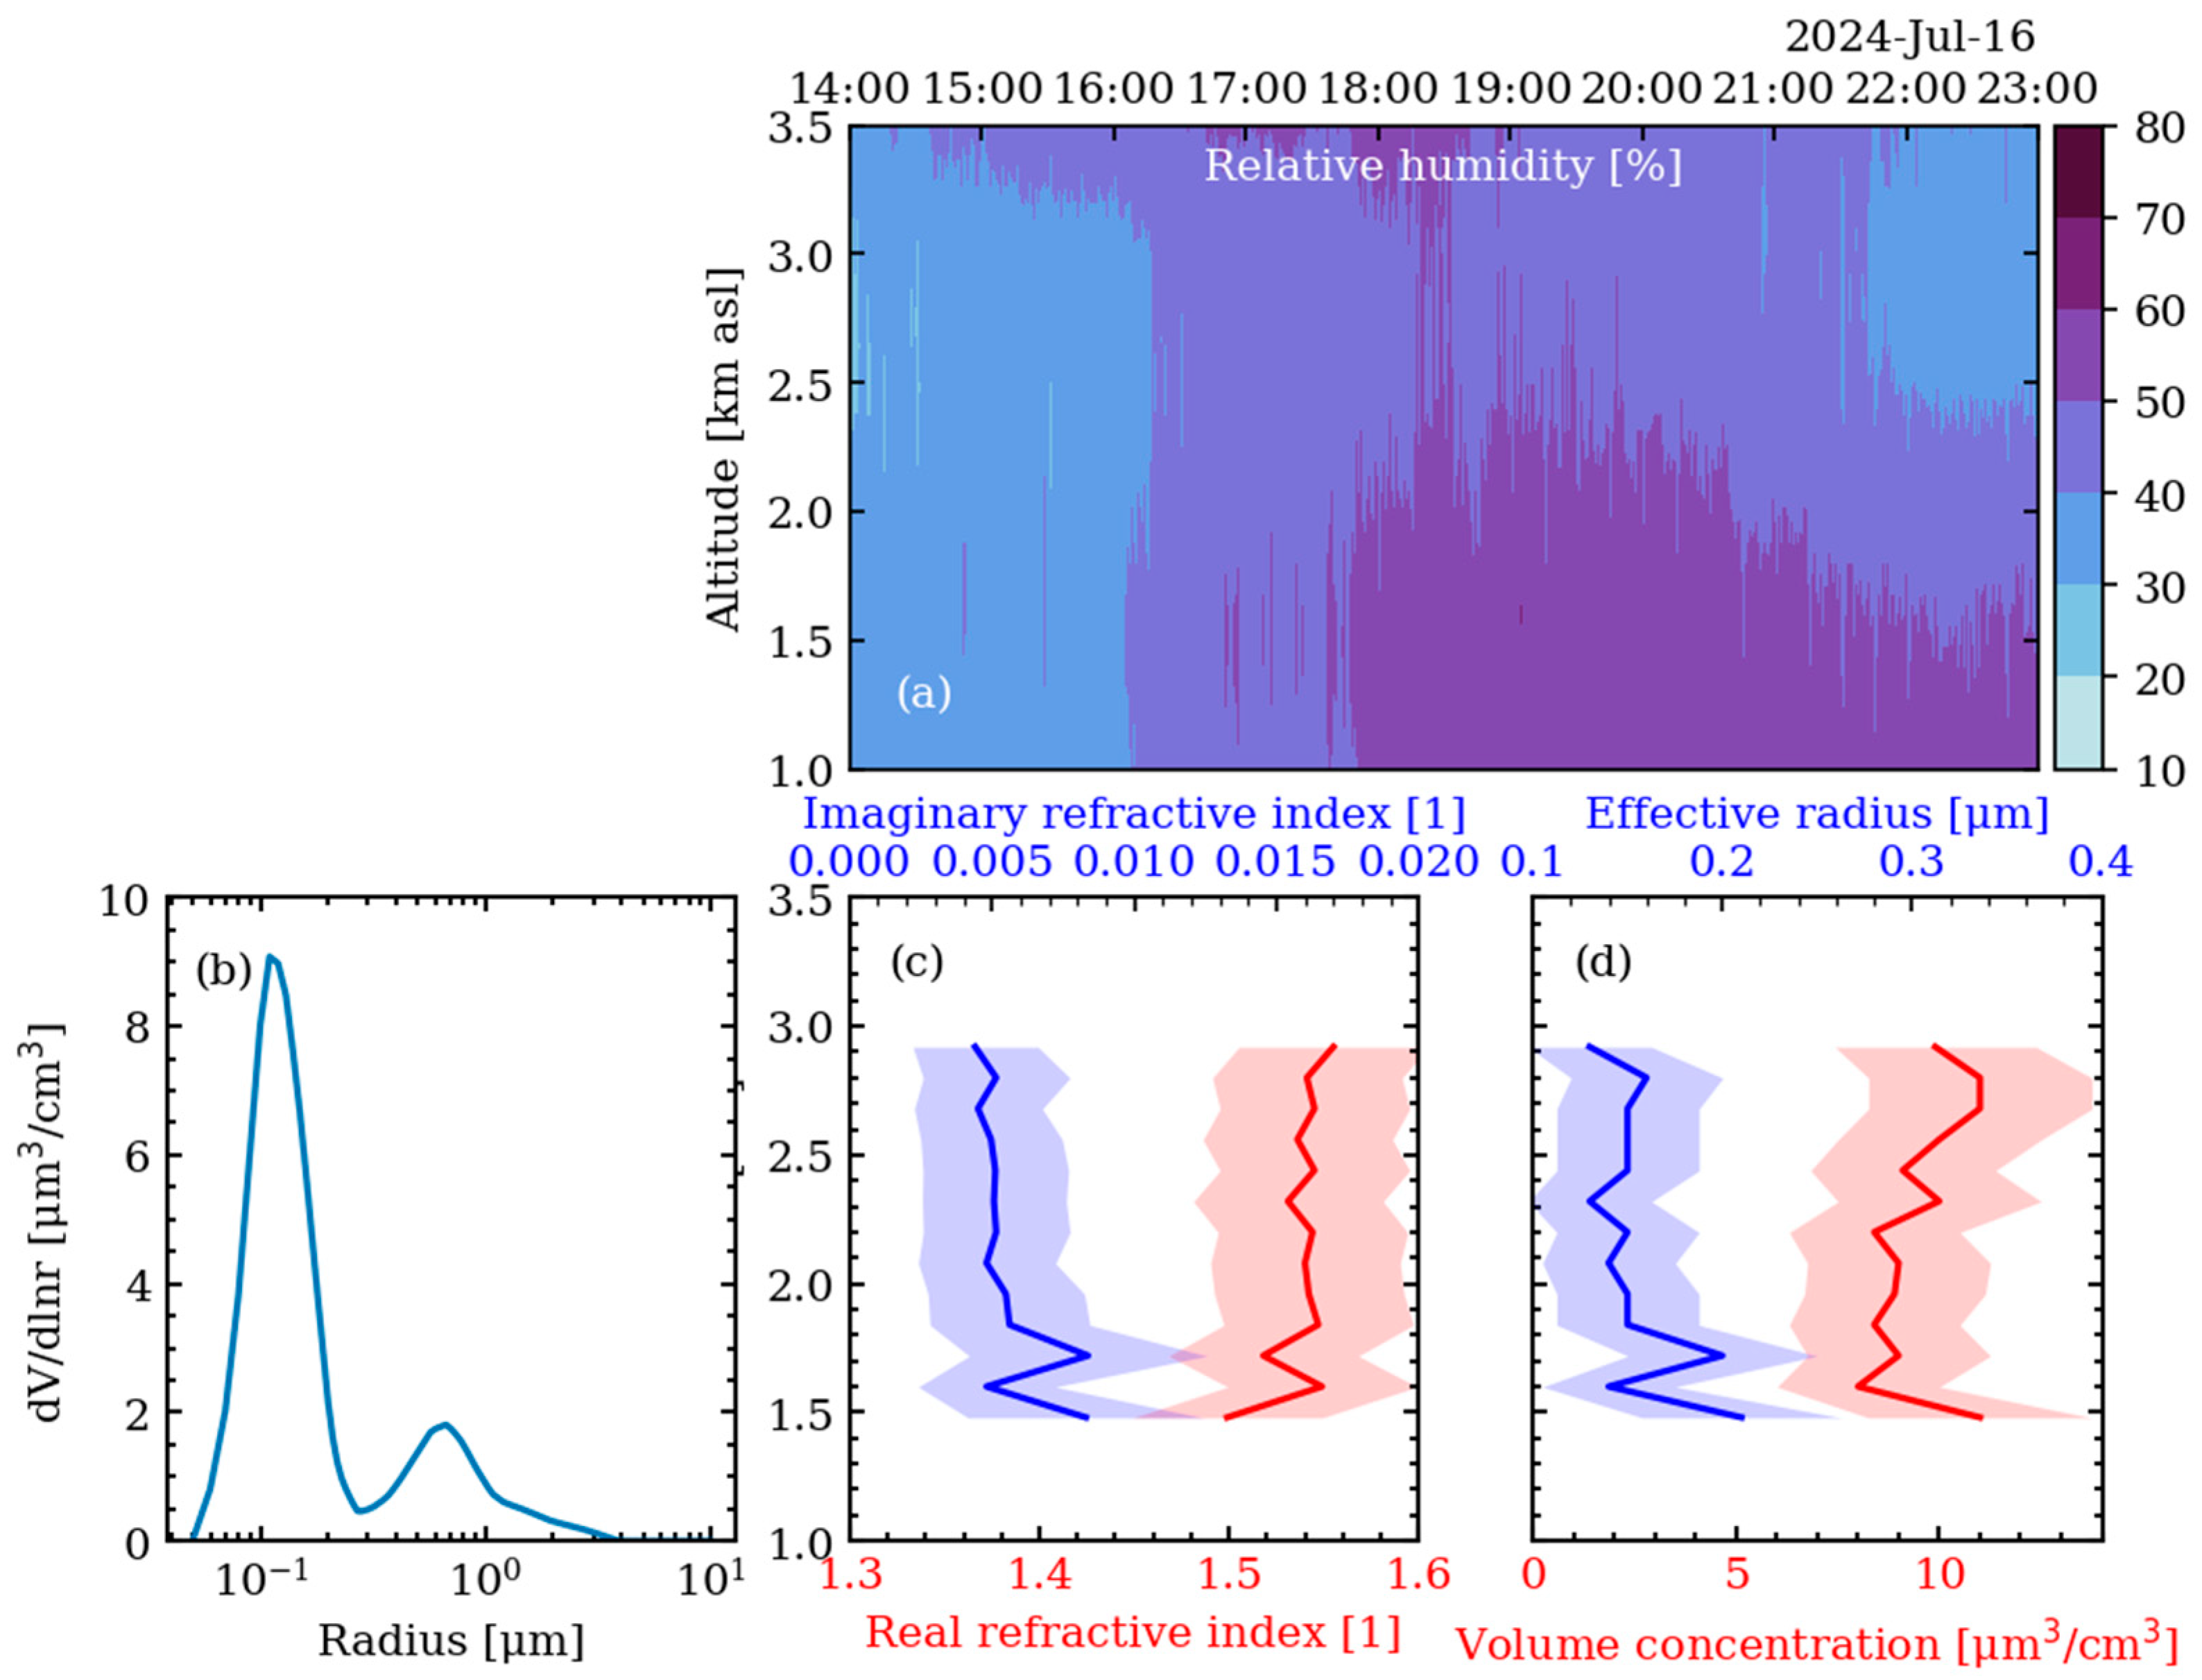
4.1. Characterization of Smoke Plumes from a Local Wildfire
4.2. Optical Proprierties of Local Fire
4.3. Microphysical Properties of Local Fire
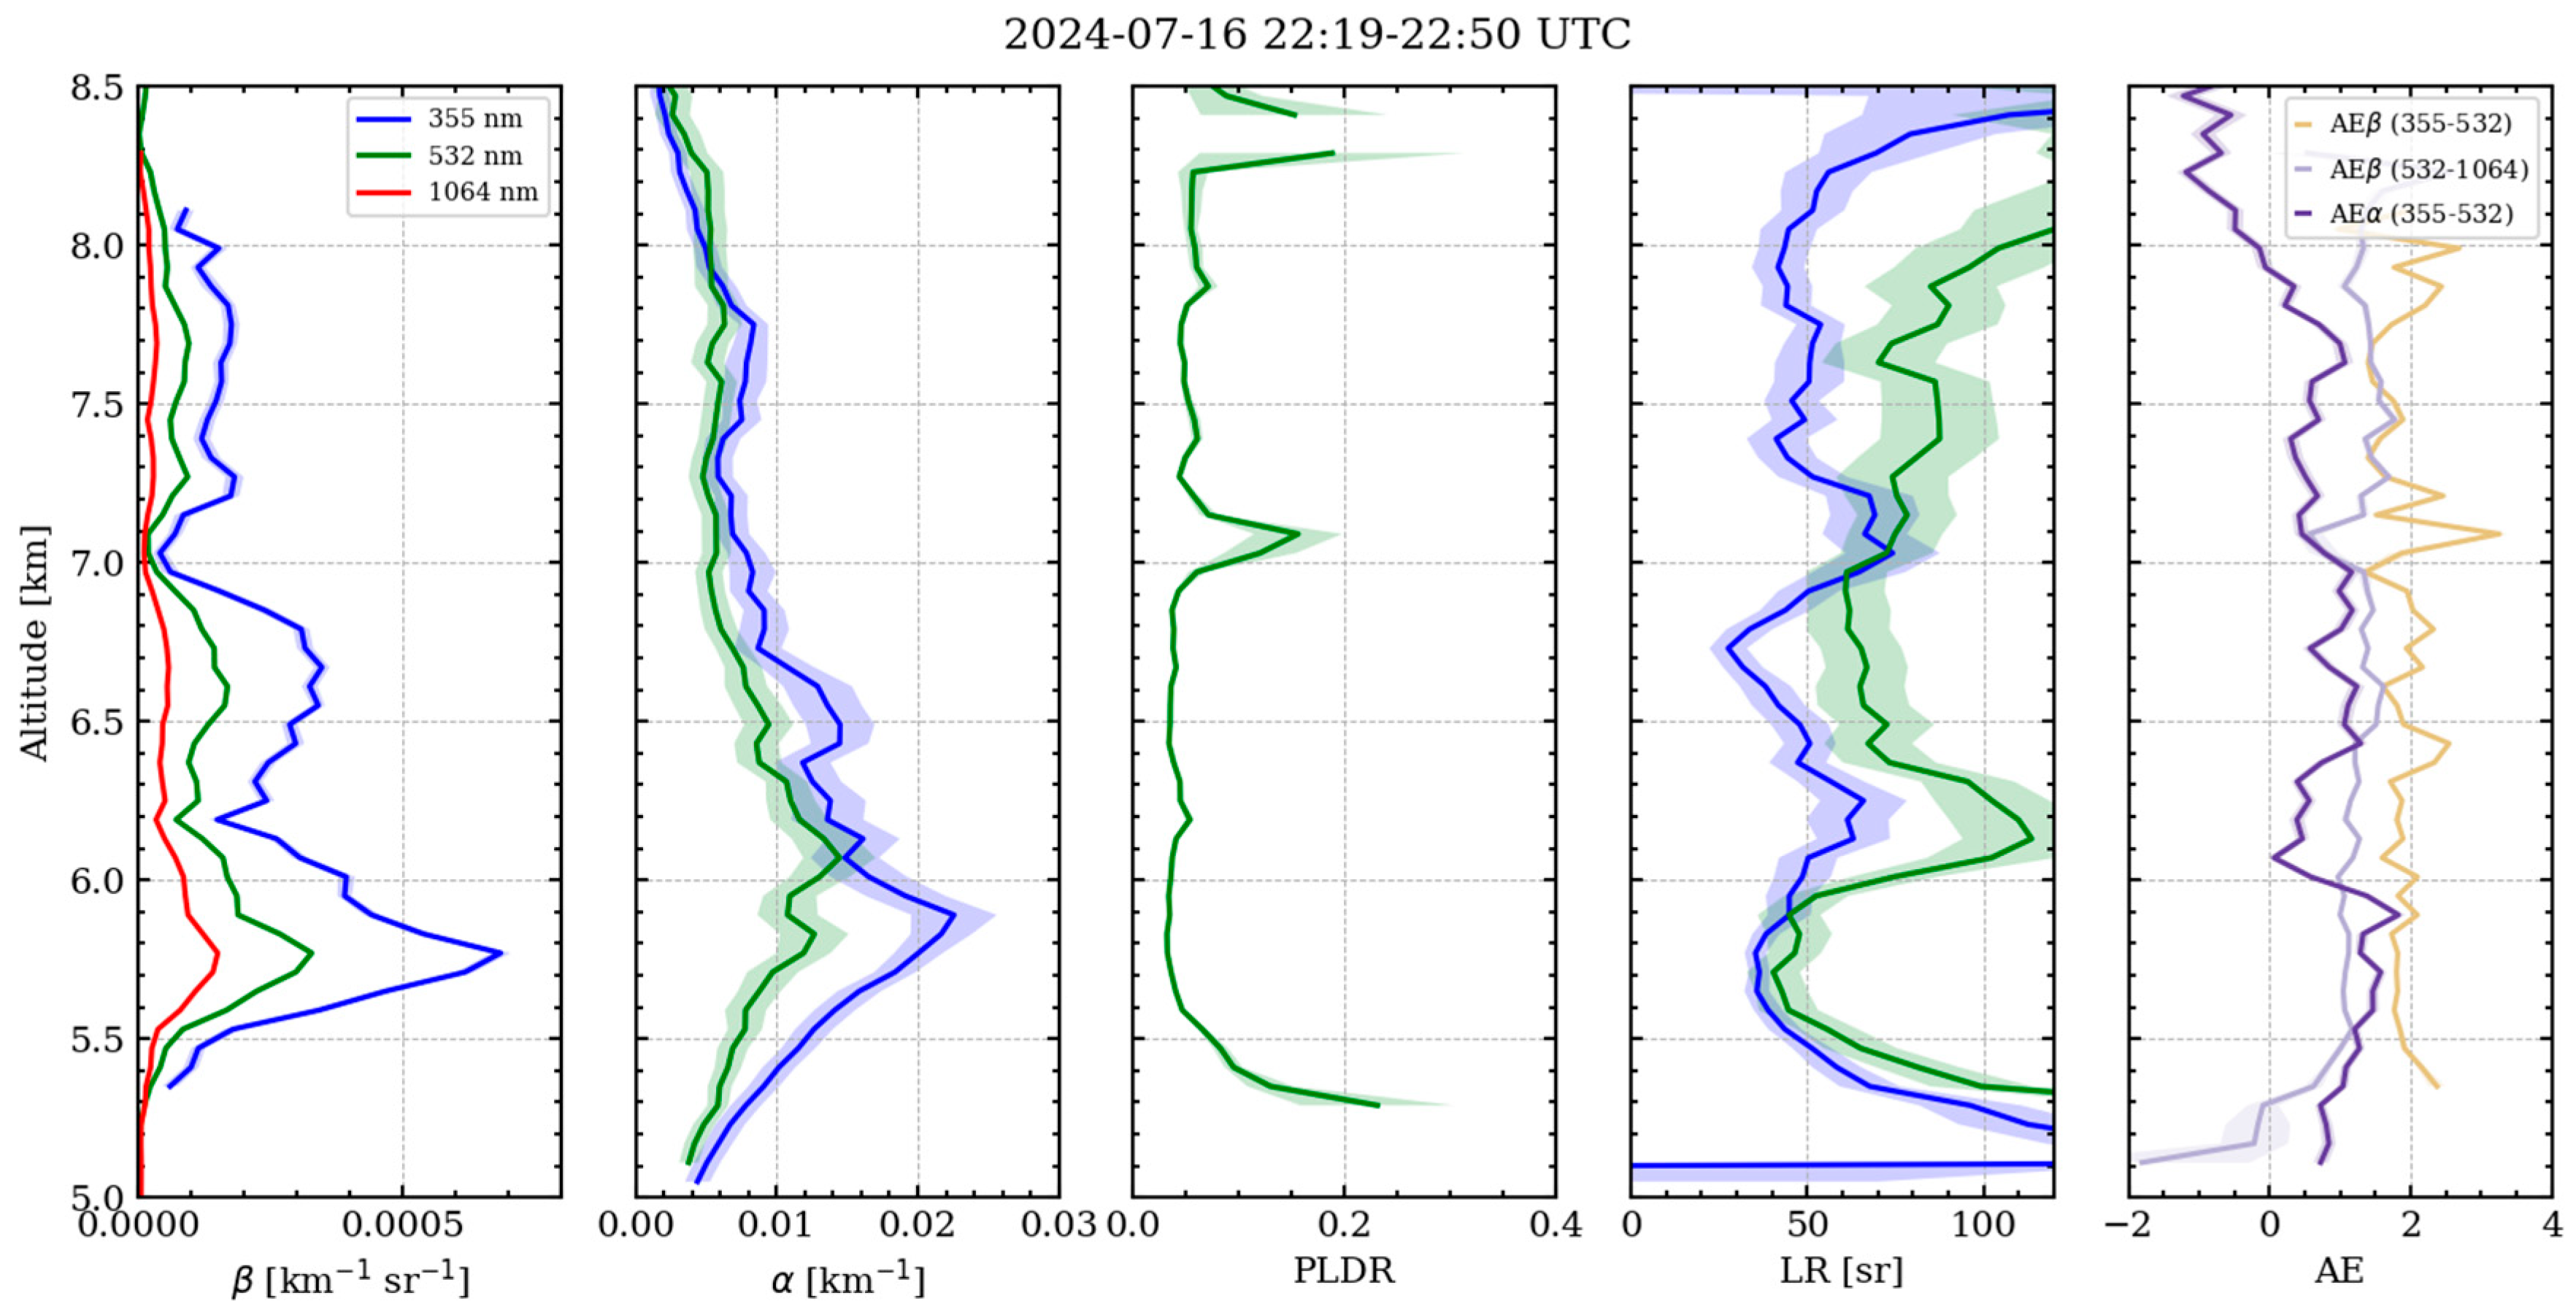
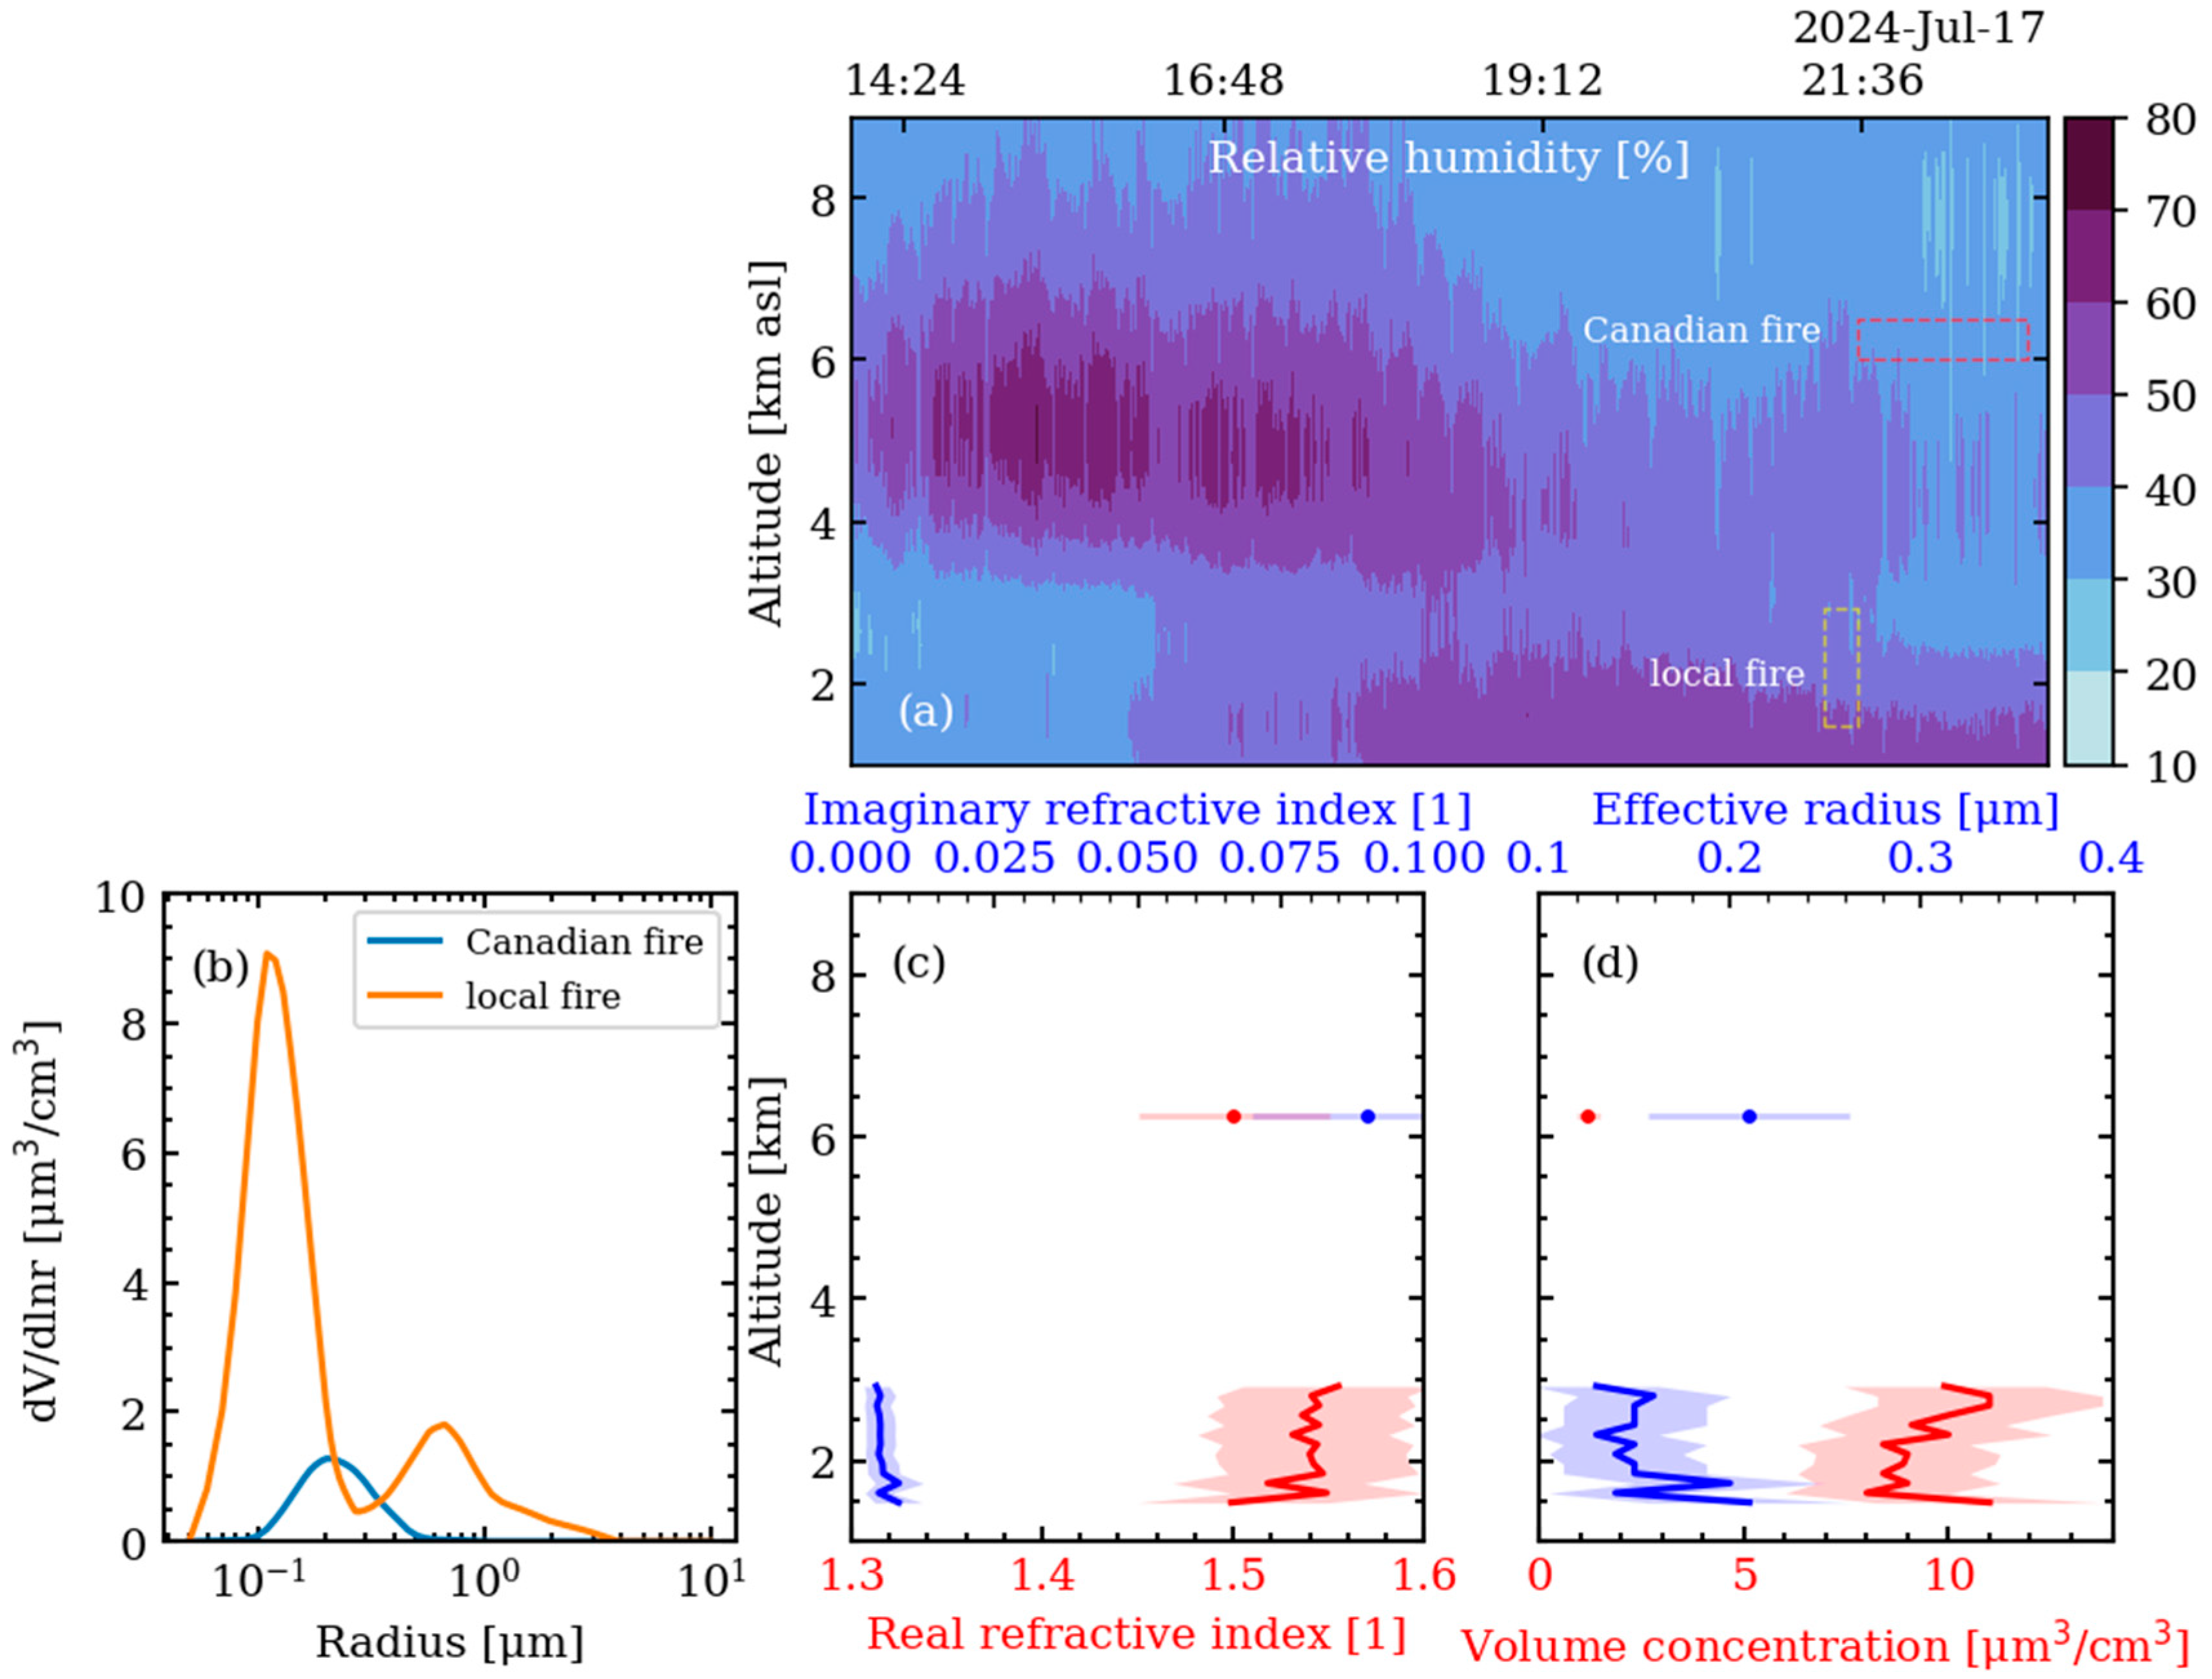
4.4. Characterization of Smoke Plumes from Canadian Wildfires
5. Conclusions
Author Contributions
Funding
Data Availability Statement
Acknowledgments
Conflicts of Interest
References
- Johnston, F.H.; Henderson, S.B.; Chen, Y.; Randerson, J.T.; Marlier, M.; DeFries, R.S.; Kinney, P.; Bowman, D.M.J.S.; Brauer, M. Estimated global mortality attributable to smoke from landscape fires. Environ. Health Perspect. 2012, 120, 695–701. [Google Scholar] [CrossRef] [PubMed]
- Reid, C.E.; Brauer, M.; Johnston, F.H.; Jerrett, M.; Balmes, J.R.; Elliott, C.T. Critical review of health impacts of wildfire smoke exposure. Remote Sens. 2016, 124, 1334–1343. [Google Scholar] [CrossRef] [PubMed]
- Tian, L.; Wu, X.; Tao, Y.; Li, M.; Qian, C.; Liao, L.; Fu, W. Review of Remote Sensing-Based Methods for Forest Aboveground Biomass Estimation: Progress, Challenges, and Prospects. Forests 2023, 14, 1086. [Google Scholar] [CrossRef]
- Bond, T.C.; Doherty, S.J.; Fahey, D.W.; Forster, P.M.; Berntsen, T.; DeAngelo, B.J.; Flanner, M.G.; Ghan, S.; Kärcher, B.; Koch, D.; et al. Bounding the role of black carbon in the climate system: A scientific assessment. Remote Sens. 2013, 118, 5380–5552. [Google Scholar] [CrossRef]
- Curci, G.; Alyuz, U.; Barò, R.; Bianconi, R.; Bieser, J.; Christensen, J.H.; Colette, A.; Farrow, A.; Francis, X.; Jiménez-Guerrero, P.; et al. Modelling black carbon absorption of solar radiation: Combining external and internal mixing assumptions. Atmos. Chem. Phys. 2019, 19, 181–204. [Google Scholar] [CrossRef] [PubMed]
- Turpin, B.J.; Lim, H.J. Species Contributions to PM2.5 Mass Concentrations: Revisiting Common Assumptions for Estimating Organic Mass. Aerosol Sci. Technol. 2001, 35, 602–610. [Google Scholar] [CrossRef]
- Kuhlbusch, T.A.J.; Andreae, M.O. Black carbon formation during savanna fires: Seasonal variation of emission factors. Sustainability 2010, 2, 294–320. [Google Scholar] [CrossRef]
- Popovicheva, O.B.; Persiantseva, N.M.; Kireeva, E.D.; Timofeev, M.A.; Shonija, N.K. Microstructure and physicochemical properties of black carbon particles from wildfire emissions. Atmosphere 2022, 13, 115. [Google Scholar] [CrossRef]
- Liu, D.; Allan, J.D.; Whitehead, J.D.; Young, D.E.; Flynn, M.J.; Coe, H.; Beddows, D.C.S.; Taylor, J.W.; McFiggans, G.; Fleming, Z.L.; et al. Black-Carbon Absorption Enhancement in the Atmosphere Determined by Particle Mixing State. Nat. Geosci. 2017, 10, 184–188. [Google Scholar] [CrossRef]
- Müller, D.; Mattis, I.; Ansmann, A.; Wandinger, U.; Ritter, C.; Kaiser, D. Multiwavelength Raman lidar observations of particle growth during long-range transport of forest-fire smoke in the free troposphere. Geophys. Res. Lett. 2007, 34, L05803. [Google Scholar] [CrossRef]
- Andreae, M.O.; Merlet, P. Emission of trace gases and aerosols from biomass burning. Glob. Biogeochem. Cycles 2001, 15, 955–966. [Google Scholar] [CrossRef]
- Romshoo, B.; Müller, T.; Pfeifer, S.; Saturno, J.; Nowak, A.; Ciupek, K.; Quincey, P.; Wiedensohler, A. Optical Properties of Coated Black Carbon Aggregates: Numerical Simulations, Radiative Forcing Estimates, and Size-Resolved Parameterization Scheme. Atmosphere 2021, 12, 12989. [Google Scholar] [CrossRef]
- Li, Y.; He, C.; Liu, X.; Kang, H.; Zhang, Y.; Liu, J.; Yang, M.; Gong, X.; Zhu, T.; Martin, S.T. Liquid–Liquid Phase Separation Reduces Radiative Absorption by Aged Black Carbon Aerosols. Commun. Earth Environ. 2023, 4, 123. [Google Scholar] [CrossRef]
- Papagiannopoulos, N.; Mona, L.; Amodeo, A.; D’Amico, G.; Gumà Claramunt, P.; Pappalardo, G.; Alados-Arboledas, L.; Guerrero-Rascado, J.L.; Amiridis, V.; Kokkalis, P.; et al. An automatic observation-based aerosol typing method for EARLINET. Remote Sens. 2020, 12, 1234. [Google Scholar] [CrossRef]
- Baars, H.; Ansmann, A.; Ohneiser, K.; Althausen, D.; Engelmann, R.; Foth, A.; Heese, B.; Mattis, I.; Pappalardo, G.; Wandinger, U.; et al. The unprecedented 2017–2018 stratospheric smoke event: Decay phase and aerosol properties observed with the EARLINET. Atmos. Chem. Phys. 2019, 19, 15183–15198. [Google Scholar] [CrossRef]
- Flannigan, M.D.; Stocks, B.J.; Turetsky, M.R.; Wotton, B.M. Implications of changing climate for global wildland fire. Int. J. Wildland Fire 2009, 18, 483–507. [Google Scholar] [CrossRef]
- Val Martin, M.; Logan, J.A.; Kahn, R.A.; Leung, F.-Y.; Nelson, D.L.; Diner, D.J. Smoke injection heights from fires in North America: Analysis of 5 years of satellite observations. Atmos. Chem. Phys. 2010, 10, 1491–1510. [Google Scholar] [CrossRef]
- Pappalardo, G.; Amodeo, A.; Apituley, A.; Comeron, A.; Freudenthaler, V.; Linné, H.; Ansmann, A.; Bösenberg, J.; D’Amico, G.; Mattis, I.; et al. EARLINET: Towards an advanced sustainable European aerosol lidar network. Atmos. Meas. Tech. 2014, 7, 2389–2409. [Google Scholar] [CrossRef]
- Adam, M.; Nicolae, D.; Stachlewska, I.S.; Papayannis, A.; Balis, D. Biomass Burning Events Measured by Lidars in EARLINET—Part 1: Data Analysis Methodology. Atmosphere 2020, 20, 13905–13933. [Google Scholar] [CrossRef]
- De Rosa, B.; Amato, F.; Amodeo, A.; D’Amico, G.; Dema, C.; Falconieri, A.; Giunta, A.; Gumà-Claramunt, P.; Kampouri, A.; Solomos, S.; et al. Characterization of Extremely Fresh Biomass Burning Aerosol by Means of Lidar Observations. Remote Sens. 2022, 14, 4984. [Google Scholar] [CrossRef]
- Nicolae, D.; Nemuc, A.; Müller, D.; Talianu, C.; Vasilescu, J.; Belegante, L.; Kolgotin, A. Characterization of fresh and aged biomass burning events using multiwavelength Raman lidar and mass spectrometry. J. Geophys. Res. 2013, 118, 2956–2965. [Google Scholar] [CrossRef]
- Chen, W.; Yan, L.; Ding, N.; Xie, M.; Lu, M.; Zhang, F.; Duan, Y.; Zong, S. Analysis of Aerosol Radiative Forcing over Beijing under Different Air Quality Conditions Using Ground-Based Sun-Photometers between 2013 and 2015. Remote Sens. 2016, 8, 510. [Google Scholar] [CrossRef]
- Liang, Y.; Che, H.; Wang, H.; Zhang, W.; Li, L.; Zheng, Y.; Gui, K.; Zhang, P.; Zhang, X. Aerosols Direct Radiative Effects Combined Ground-Based Lidar and Sun-Photometer Observations: Cases Comparison between Haze and Dust Events in Beijing. Remote Sens. 2022, 14, 266. [Google Scholar] [CrossRef]
- Andreae, M.O.; Rosenfeld, D.; Artaxo, P.; Costa, A.A.; Frank, G.P.; Longo, K.M.; Silva-Dias, M.A.F. Smoking rain clouds over the Amazon. Science 2004, 303, 1337–1342. [Google Scholar] [CrossRef] [PubMed]
- Rosenfeld, D.; Zhu, Y.; Wang, M.; Zheng, Y.; Goren, T.; Yu, S. Aerosol-driven droplet concentrations dominate coverage and water of oceanic low-level clouds. Science 2019, 363, eaav0566. [Google Scholar] [CrossRef] [PubMed]
- Ogawa, D.; Kanaya, Y.; Taketani, F.; Miyakawa, T.; Pan, X.; Kondo, Y. Hygroscopicity of Aerosol Particles and CCN Activity of Nearly Hydrophobic Particles in the Urban Atmosphere over Japan during Summer. J. Geophys. Res. Atmos. 2016, 121, 12000–12018. [Google Scholar] [CrossRef]
- Massling, A.; Leinert, S.; Wiedensohler, A.; Covert, D. Hygroscopic Growth of Sub-Micrometer and One-Micrometer Aerosol Particles Measured during ACE-Asia. Atmos. Chem. Phys. 2007, 7, 3249–3259. [Google Scholar] [CrossRef]
- Albrecht, B.A. Aerosols, cloud microphysics, and fractional cloudiness. Science 1989, 245, 1227–1230. [Google Scholar] [CrossRef] [PubMed]
- Lohmann, U.; Feichter, J. Global indirect aerosol effects: A review. Atmos. Chem. Phys. 2005, 5, 715–737. [Google Scholar] [CrossRef]
- Nessler, R.; Weingartner, E.; Baltensperger, U. Effect of Humidity on Aerosol Light Absorption and Its Implications for Extinction and the Single Scattering Albedo Illustrated for a Site in the Lower Free Troposphere. J. Aerosol Sci. 2005, 36, 958–972. [Google Scholar] [CrossRef]
- Madonna, F.; Amodeo, A.; Boselli, A.; Cornacchia, C.; Cuomo, V.; D’Amico, G.; Giunta, A.; Mona, L.; Pappalardo, G. CIAO: The CNR-IMAA advanced observatory for atmospheric research. Atmos. Meas. Tech. 2011, 4, 1191–1208. [Google Scholar] [CrossRef]
- Laurita, T.; Mauceri, A.; Cardellicchio, F.; Lapenna, E.; De Rosa, B.; Trippetta, S.; Mytilinaios, M.; Amodio, D.; Giunta, A.; Ripepi, E.; et al. CIAO observatory main upgrade: Building up an ACTRIS compliant aerosol in-situ laboratory. Atmos. Meas. Tech. Discuss. 2024. in review. [Google Scholar]
- De Rosa, B.; Mytilinaios, M.; Amodeo, A.; Colangelo, C.; D’Amico, G.; Dema, C.; Gandolfi, I.; Giunta, A.; Gumà-Claramunt, P.; Laurita, T.; et al. Observations of Saharan Dust Intrusions over Potenza, Southern Italy, During 13 Years of Lidar Measurements: Seasonal Variability of Optical Properties and Radiative Impact. Remote Sens. 2025, 17, 453. [Google Scholar] [CrossRef]
- Laj, P.; Myhre, C.L.; Riffault, V.; Amiridis, V.; Fuchs, H.; Eleftheriadis, K.; Petäjä, T.; Salameh, T.; Kivekäs, N.; Juurola, E.; et al. Aerosol, Clouds and Trace Gases Research Infrastructure (ACTRIS): The European Research Infrastructure Supporting Atmospheric Science. Atmosphere 2020, 11, 1313. [Google Scholar] [CrossRef]
- Freudenthaler, V. About the effects of polarising optics on lidar signals and the Δ90-calibration. Atmos. Meas. Tech. 2016, 9, 4181–4255. [Google Scholar] [CrossRef]
- Freudenthaler, V. Optimized Background Suppression in Near Field Lidar Telescopes. In Proceedings of the 6th International Symposium on Tropospheric Profiling (ISTP), Leipzig, Germany, 14–20 September 2003. [Google Scholar]
- Freudenthaler, V. Effects of Spatially Inhomogeneous Photomultiplier Sensitivity on Lidar Signals and Remedies. In Proceedings of the 22nd International Laser Radar Conference (ILRC 2004), Matera, Italy, 12–16 July 2004. [Google Scholar]
- D’Amico, G.; Amodeo, A.; Mattis, I.; Freudenthaler, V.; Pappalardo, G. EARLINET Single Calculus Chain–technical–Part 1: Pre-processing of raw lidar data. Atmos. Meas. Tech. 2016, 9, 491–507. [Google Scholar] [CrossRef]
- Madonna, F.; Amodeo, A.; D’Amico, G.; Pappalardo, G. A study on the use of radar and lidar for characterizing ultragiant aerosol. Geophys. Res. 2013, 118, 10056–10071. [Google Scholar] [CrossRef]
- Gumà-Claramunt, P.; Madonna, F.; Amodeo, A.; Bauer-Pfundstein, M.; Papagiannopoulos, N.; Rosoldi, M.; Pappalardo, G. Giant Aerosol Observations with Cloud Radar: Methodology and Effects. Remote Sens. 2025, 17, 419. [Google Scholar] [CrossRef]
- Granados-Muñoz, M.J.; García, S.; Mora, J.M.; Cuevas, E.; Alonso-Pérez, S.; Querol, X. Analysis of Four Years of Ceilometer-Derived Aerosol Backscatter Profiles in a Coastal Site of the Western Mediterranean. Remote Sens. 2021, 13, 2576. [Google Scholar] [CrossRef]
- Chen, J.; Zeng, X.; Li, S.; Song, G.; Li, S. Water Vapor Correction in Measurements of Aerosol Backscatter Coefficients Using a 910 nm Vaisala CL51 Ceilometer. Remote Sens. 2025, 17, 2013. [Google Scholar] [CrossRef]
- Jung, T.; Ruprecht, E.; Wagner, F. Determination of cloud liquid water path over the oceans from SSM/I data using neural networks. J. Appl. Meteorol. 1997, 37, 832844. [Google Scholar]
- Solheim, F.; Godwin, J.; Westwater, E.; Han, Y.; Keihm, S.; Marsh, K.; Ware, R. Radiometric profiling of temperature, water vapor, and cloud liquid water using various inversion methods. Radio Sci. 1998, 33, 393–404. [Google Scholar] [CrossRef]
- Illingworth, A.J.; Hogan, R.J.; O’Connor, E.J.; Bouniol, D.; Brooks, M.E.; Delanoé, J.; Donovan, D.P.; Eastment, J.D.; Gaussiat, N.; Goddard, J.W.F.; et al. Cloudnet: Continuous evaluation of cloud profiles in seven operational models using ground-based observations. Bull. Am. Meteorol. Soc. 2007, 88, 883–898. [Google Scholar] [CrossRef]
- Tukiainen, S.; O’cOnnor, E.; Korpinen, A. CloudnetPy: A Python package for processing cloud remote sensing data. J. Open Source Softw. 2020, 5, 2123. [Google Scholar] [CrossRef]
- Drinovec, L.; Močnik, G.; Zotter, P.; Prévôt, A.S.H.; Ruckstuhl, C.; Coz, E.; Rupakheti, M.; Sciare, J.; Müller, T.; Wiedensohler, A.; et al. The “dual-spot” Aethalometer: An improved measurement of aerosol black carbon with real-time loading compensation. Atmos. Meas. Tech. 2015, 8, 1965–1979. [Google Scholar] [CrossRef]
- Sandradewi, J.; Prévôt, A.S.H.; Szidat, S.; Perron, N.; Alfarra, M.R.; Lanz, V.A.; Weingartner, E.; Baltensperger, U. Using Aerosol Light Absorption Measurements for the Quantitative Determination of Wood Burning and Traffic Emission Contributions to Particulate Matter. Environ. Sci. Technol. 2008, 42, 3316–3323. [Google Scholar] [CrossRef] [PubMed]
- Fröhlich, R.; Cubison, M.J.; Slowik, J.G.; Bukowiecki, N.; Prévôt, A.S.H.; Baltensperger, U.; Schneider, J.; Kimmel, J.R.; Gonin, M.; Rohner, U.; et al. The ToF-ACSM: A portable aerosol chemical speciation monitor with TOFMS detection. Atmos. Meas. Tech. 2013, 6, 3225–3241. [Google Scholar] [CrossRef]
- Middlebrook, A.M.; Bahreini, R.; Jimenez, J.L.; Canagaratna, M.R. Evaluation of composition-dependent collection efficiencies for the Aerodyne aerosol mass spectrometer using field data. Aerosol Sci. Technol. 2012, 46, 258–271. [Google Scholar] [CrossRef]
- Borghetti, M.; Ferrara, A.; Moretti, N.; Nolè, A.; Pierangeli, D.; Ripullone, F.; Todaro, L. Caring for the Forests of an Inland Area in the Era of Climate Change: A Case Study of Basilicata, Southern Italy. For. J. Silvic. For. Ecol. 2024, 21, 10–36. [Google Scholar] [CrossRef]
- Bai, M.; Yao, Q.; Wang, Z.; Wang, D.; Zhang, H.; Fang, K.; Guo, F. Driving Factors and Future Trends of Wildfires in Alberta, Canada. Fire 2024, 7, 419. [Google Scholar] [CrossRef]
- Copernicus Atmosphere Monitoring Service (CAMS). CAMS on Air: Boreal Summer 24. Copernicus Atmosphere Monitoring Service, 2024. Available online: https://atmosphere.copernicus.eu/cams-air-boreal-summer-24 (accessed on 17 February 2025).
- Rolph, G.; Stein, A.; Stunder, B. Real-time environmental applications and display system: READY. Environ. Model. Softw. 2017, 95, 210–228. [Google Scholar] [CrossRef]
- Stein, A.F.; Draxler, R.R.; Rolph, G.D.; Stunder, B.J.B.; Cohen, M.D.; Ngan, F. NOAA’s HYSPLIT atmospheric transport and dispersion modeling system. Bull. Am. Meteorol. Soc. 2015, 96, 2059–2077. [Google Scholar] [CrossRef]
- Heilman, W.E. Atmospheric Turbulence and Wildland Fires: A Review. Int. J. Wildland Fire 2023, 32, 476–495. [Google Scholar] [CrossRef]
- Garratt, J.R. The Atmospheric Boundary Layer; Elsevier: Amsterdam, The Netherlands, 1994. [Google Scholar]
- LeMone, M.A.; Angevine, W.M.; Bretherton, C.S.; Chen, F.; Dudhia, J.; Fedorovich, E.; Katsaros, K.B.; Lenschow, D.H.; Mahrt, L.; Patton, E.G.; et al. 100 Years of Progress in Boundary Layer Meteorology. Meteorol. Monogr. 2019, 59, 9.1–9.85. [Google Scholar] [CrossRef]
- Sicard, M.; Granados-Muñoz, M.J.; Alados-Arboledas, L.; Barragán, R.; Bedoya-Velásquez, A.E.; Benavent-Oltra, J.A.; Yela, M. Ground/space, passive/active remote sensing observations coupled with particle dispersion modeling to understand the inter-continental transport of wildfire smoke plumes. Remote Sens. Environ. 2019, 232, 111294. [Google Scholar] [CrossRef]
- Noyes, K.T.J.; Kahn, R.A.; Limbacher, J.A.; Li, Z. Analyzing Canadian and Alaskan Wildfire Smoke Particle Properties and Their Evolution Using Satellite Observations. Atmos. Chem. Phys. 2022, 22, 10267–10287. [Google Scholar] [CrossRef]
- Sinha, A.; George, I.; Holder, A.; Preston, W.; Hays, M.; Grieshop, A.P. Development of Volatility Distributions for Organic Matter in Biomass Burning Emissions. Atmosphere 2020, 11, 1234. [Google Scholar] [CrossRef] [PubMed]
- Zhang, X.; Mao, M.; Yin, Y.; Tang, S. The Absorption Ångström Exponent of Black Carbon with Brown Coatings: Effects of Aerosol Microphysics and Parameterization. Atmosphere 2020, 11, 1234. [Google Scholar] [CrossRef]
- Pereira, S.N.; Preißler, J.; Guerrero-Rascado, J.L.; Silva, A.M.; Wagner, F. Forest fire smoke layers observed in the free troposphere over Portugal with a multiwavelength Raman lidar: Optical and microphysical properties. Sci. World J. 2014, 2014, 421838. [Google Scholar] [CrossRef] [PubMed]
- Veselovskii, I.; Kolgotin, A.; Griaznov, V.; Müller, D.; Wandinger, U.; Whiteman, D.N. Inversion with regularization for the retrieval of tropospheric aerosol parameters from multiwavelength lidar sounding. Appl. Opt. 2002, 41, 3685–3699. [Google Scholar] [CrossRef] [PubMed]
- Müller, D.; Wandinger, U.; Ansmann, A. Microphysical particle parameters from extinction and backscatter lidar data by inversion with regularization. Theory Appl. Opt. 1999, 38, 2346–2357. [Google Scholar] [CrossRef] [PubMed]
- Ansmann, A.; Müller, D. Lidar and Atmospheric Aerosol Particles. In Lidar—Range-Resolved Optical Remote Sensing of the Atmosphere; Weitkamp, C., Ed.; Springer: New York, NY, USA, 2005; pp. 105–141. [Google Scholar]
- Tikhonov, A.N.; Arsenin, V.Y. Solution of Ill-Posed Problems; Wiley: New York, NY, USA, 1977. [Google Scholar]
- Veselovskii, I.; Whiteman, D.N.; Kolgotin, A.; Andrews, E.; Korenskii, M. Demonstration of aerosol property profiling by multiwavelength lidar under varying relative humidity conditions. J. Atmos. Oceanic Technol. 2009, 26, 1543–1557. [Google Scholar] [CrossRef]
- Veselovskii, I.; Dubovik, O.; Kolgotin, A.; Korenskiy, M.; Whiteman, D.N.; Allakhverdiev, K.; Huseyinoglu, F. Linear estimation of particle bulk parameters from multi-wavelength lidar measurements. Atmos. Meas. Tech. 2012, 5, 1135–1145. [Google Scholar] [CrossRef]
- Alados-Arboledas, L.; Müller, D.; Guerrero-Rascado, J.L.; Navas-Guzmán, F.; Pérez-Ramírez, D.; Olmo, F.J. Optical and microphysical properties of fresh biomass burning aerosol retrieved by Raman lidar, and star-and sun-photometry. Geophys. Res. Lett. 2011, 38, L01807. [Google Scholar] [CrossRef]
- O′Neill, N.T.; Eck, T.F.; Holben, B.N.; Smirnov, A.; Royer, A.; Li, Z. Optical properties of boreal forest fire smoke drived from Sun photometry. J. Geophys. Res. 2002, 107, AAC 6-1–AAC 6-19. [Google Scholar] [CrossRef]
- Quinn, P.K.; Bates, T.S.; Coffman, D.J.; Covert, D.S. Influence of particle size and chemistry on the cloud nucleating properties of aerosols. Atmos. Chem. Phys. 2008, 8, 1029–1042. [Google Scholar] [CrossRef]
- Kumar, P.; Sokolik, I.N.; Nenes, A. Parameterization of cloud droplet formation for global and regional models: Including adsorption activation from insoluble CCN. Atmos. Chem. Phys. 2009, 9, 2517–2532. [Google Scholar] [CrossRef]
- Rose, D.; Nowak, A.; Achtert, P.; Wiedensohler, A.; Hu, M.; Shao, M.; Zhang, Y.; Andreae, M.O.; Pöschl, U. Cloud condensation nuclei in polluted air and biomass burning smoke near the mega-city Guangzhou, China—Part 1: Size-resolved measurements and implications for the modeling of aerosol particle hygroscopicity and CCN activity. Atmos. Chem. Phys. 2010, 10, 3365–3383. [Google Scholar] [CrossRef]
- Fu, Q.; Liou, K.N. On the Correlated k-Distribution Method for Radiative Transfer in Nonhomogeneous Atmospheres. J. Atmos. Sci. 1992, 49, 2139–2156. [Google Scholar] [CrossRef]
- Gu, Y.; Farrara, J.; Liou, K.N.; Mechoso, C.R. Parameterization of Cloud-Radiation Processes in the UCLA General Circulation Model. J. Clim. 2003, 16, 3357–3370. [Google Scholar] [CrossRef]
- Damiano, R.; Amoruso, S.; Sannino, A.; Boselli, A. Lidar Optical and Microphysical Characterization of Tropospheric and Stratospheric Fire Smoke Layers Due to Canadian Wildfires Passing over Naples (Italy). Remote Sens. 2024, 16, 538. [Google Scholar] [CrossRef]
- Haarig, M.; Ansmann, A.; Baars, H.; Jimenez, C.; Veselovskii, I.; Engelmann, R.; Althausen, D. Depolarization and lidar ratios at 355, 532, and 1064 nm and microphysical properties of aged tropospheric and stratospheric Canadian wildfire smoke. Atmos. Chem. Phys. 2018, 18, 11847–11861. [Google Scholar] [CrossRef]
- Hu, Q.; Goloub, P.; Veselovskii, I.; Podvin, T. The characterization of long-range transported North American biomass burning plumes: What can a multi-wavelength Mie–Raman-polarization-fluorescence lidar provide? Atmos. Chem. Phys. 2022, 22, 5399–5414. [Google Scholar] [CrossRef]
- Ohneiser, K.; Ansmann, A.; Engelmann, R.; Baars, H.; Althausen, D.; Pappalardo, G.; Wandinger, U.; Freudenthaler, V.; Heinold, B.; Müller, T.; et al. The unexpected smoke layer in the High Arctic winter stratosphere during MOSAiC 2019–2020. Atmos. Chem. Phys. 2021, 21, 15783–15798. [Google Scholar] [CrossRef]
- Ansmann, A.; Engelmann, R.; Althausen, D.; Baars, H.; Pappalardo, G.; Wandinger, U.; Freudenthaler, V.; Heinold, B.; Müller, T.; Matvienko, G.; et al. Tropospheric and stratospheric wildfire smoke profiling with lidar. Atmos. Chem. Phys. 2021, 21, 9779–9803. [Google Scholar] [CrossRef]
- Wandinger, U.; Müller, D.; Böckmann, C.; Althausen, D.; Matthias, V.; Bösenberg, J.; Weiß, V.; Fiebig, M.; Wendisch, M.; Stohl, A.; et al. Optical and Microphysical Characterization of Biomass-Burning and Industrial-Pollution Aerosols from Multiwavelength Lidar and Aircraft Measurements. J. Geophys. Res. Atmos. 2002, 107, LAC 7-1–LAC 7-20. [Google Scholar] [CrossRef]
- Murayama, T.; Müller, D.; Wada, K.; Shimizu, A.; Sekiguchi, M.; Tsukamoto, T. Characterization of Asian Dust and Siberian Smoke with Multi-Wavelength Raman Lidar over Tokyo, Japan in Spring 2003. Geophys. Res. Lett. 2004, 31, L23103. [Google Scholar] [CrossRef]
- Sugimoto, N.; Tatarov, B.; Shimizu, A.; Matsui, I.; Nishizawa, T. Optical Characteristics of Forest-Fire Smoke Observed with Two-Wavelength Mie-Scattering Lidars and a High-Spectral-Resolution Lidar over Japan. SOLA 2010, 6, 93–96. [Google Scholar] [CrossRef]
- Hu, Q.; Goloub, P.; Veselovskii, I.; Bravo-Aranda, J.-A.; Popovici, I.E.; Podvin, T.; Haeffelin, M.; Lopatin, A.; Dubovik, O.; Pietras, C.; et al. Long-Range-Transported Canadian Smoke Plumes in the Lower Stratosphere over Northern France. Atmos. Chem. Phys. 2019, 19, 1173–1193. [Google Scholar] [CrossRef]
- Papanikolaou, C.-A.; Giannakaki, E.; Papayannis, A.; Tombrou, M.; Mylonaki, M.; Soupiona, O. Optical Properties of Canadian Biomass Burning Particles over Europe Observed with CALIPSO and Ground-Based Lidar Systems. EPJ Web Conf. 2020, 237, 08016. [Google Scholar] [CrossRef]
- Amiridis, V.; Balis, D.S.; Giannakaki, E.; Stohl, A.; Kazadzis, S.; Koukouli, M.E.; Zanis, P. Optical Characteristics of Biomass Burning Aerosols over Southeastern Europe Determined from UV-Raman Lidar Measurements. Atmos. Chem. Phys. 2009, 9, 2431–2440. [Google Scholar] [CrossRef]
- Janicka, L.; Davuliene, L.; Bycenkiene, S.; Stachlewska, I.S. Long Term Observations of Biomass Burning Aerosol over Warsaw by Means of Multiwavelength Lidar. Opt. Express OE 2023, 31, 33150–33174. [Google Scholar] [CrossRef] [PubMed]
- Müller, D.; Mattis, I.; Wandinger, U.; Ansmann, A.; Althausen, D.; Stohl, A. Raman Lidar Observations of Aged Siberian and Canadian Forest Fire Smoke in the Free Troposphere over Germany in 2003: Microphysical Particle Characterization. J. Geophys. Res. 2005, 110, D17201. [Google Scholar] [CrossRef]
- Reid, J.S.; Hobbs, P.V. Physical and optical properties of smoke from individual biomass fires in Brazil. J. Geophys. Res. 1998, 103, 32013–32031. [Google Scholar] [CrossRef]
- Müller, D.; Böckmann, C.; Kolgotin, A.; Schneidenbach, L.; Chemyakin, E.; Rosemann, J.; Znak, P.; Romanov, A. Microphysical Particle Properties Derived from Inversion Algorithms Developed in the Framework of EARLINET. Atmos. Meas. Tech. 2016, 9, 5007–5035. [Google Scholar] [CrossRef]
- Di Girolamo, P.; De Rosa, B.; Summa, D.; Franco, N.; Veselovskii, I. Measurements of Aerosol Size and Microphysical Properties: A Comparison Between Raman Lidar and Airborne Sensors. J. Geophys. Res. Atmos. 2022, 127, e2021JD036086. [Google Scholar] [CrossRef]
- Andreae, M.O.; Gelencser, A. Black carbon or brown carbon? The nature of light-absorbing carbonaceous aerosols. Atmos. Chem. Phys. 2006, 6, 3131–3148. [Google Scholar] [CrossRef]
- Reid, J.S.; Kopp, H.; Higurashi, A.; Eck, T.F.; Zhang, J.; Li, Z.; Liu, Z.; Holben, B.N.; O’Neill, N.T.; Tsay, S.C. A review of biomass-burning aerosol properties in relation to atmospheric radiative forcing. J. Geophys. Res. 2005, 110, D10204. [Google Scholar] [CrossRef]
- Summa, D.; Madonna, F.; Franco, N.; De Rosa, B.; Di Girolamo, P. Inter-Comparison of Atmospheric Boundary Layer (ABL) Height Estimates from Different Profiling Sensors and Models in the Framework of HyMeX-SOP1. Atmos. Meas. Tech. 2022, 15, 4153–4170. [Google Scholar] [CrossRef]
- Summa, D.; Vivone, G.; Franco, N.; D’Amico, G.; De Rosa, B.; Di Girolamo, P. Atmospheric Boundary Layer Height: Inter-Comparison of Different Estimation Approaches Using the Raman Lidar as Benchmark. Remote Sens. 2023, 15, 1381. [Google Scholar] [CrossRef]
- Reichardt, J.; Lauermann, F.; Behrendt, O. Fluorescence spectra of atmospheric aerosols. EGUsphere 2024, 2024, 1–52. [Google Scholar] [CrossRef]
- Reichardt, J. Cloud and aerosol spectroscopy with Raman lidar. J. Atmos. Ocean. Technol. 2014, 31, 1946–1963. [Google Scholar] [CrossRef]
- Reichardt, J.; Behrendt, O.; Lauermann, F. Spectrometric fluorescence and Raman lidar: Absolute calibration of aerosol fluorescence spectra and fluorescence correction of humidity measurements. Atmos. Meas. Tech. Discuss. 2022, 2022, 1–21. [Google Scholar] [CrossRef]

| Instrument | Main Products |
|---|---|
| Raman Lidar (POLPO—Potenza Lidar for Particle Observation) | Aerosol backscatter @1064, 532 and 355 nm Aerosol depolarization ratio @1064, 532 and 355 nm Aerosol extinction @532 and 355 nm Water vapor mixing ratio |
| Doppler Radar (MIRA35—METEK) | Doppler spectrum Doppler velocity Linear Depolarization Ratio |
| Ceilometer (CL51—VAISALA) | Aerosol backscatter Cloud base height |
| Microwave Radiometer (RPG-HATPRO-G5—Radiometer Physics) | Temperature, humidity and cloud liquid water profiles Integrated Precipitable Water Vapor (IPWV) Cloud Liquid Water Path (LWP) |
| ACSM | Chemical composition and mass (<1 μm) |
| Aethalometer AE33 | Black Carbon (BC) concentration |
| Date and Time | Alt a.s.l | LR 532 | LR 355 | LR 532/LR355 | Aeβ 355–532 | AEβ 355–1064 | AEβ 532–1064 | AEα 355–532 | PLDR 532 | PLDR 1064 |
|---|---|---|---|---|---|---|---|---|---|---|
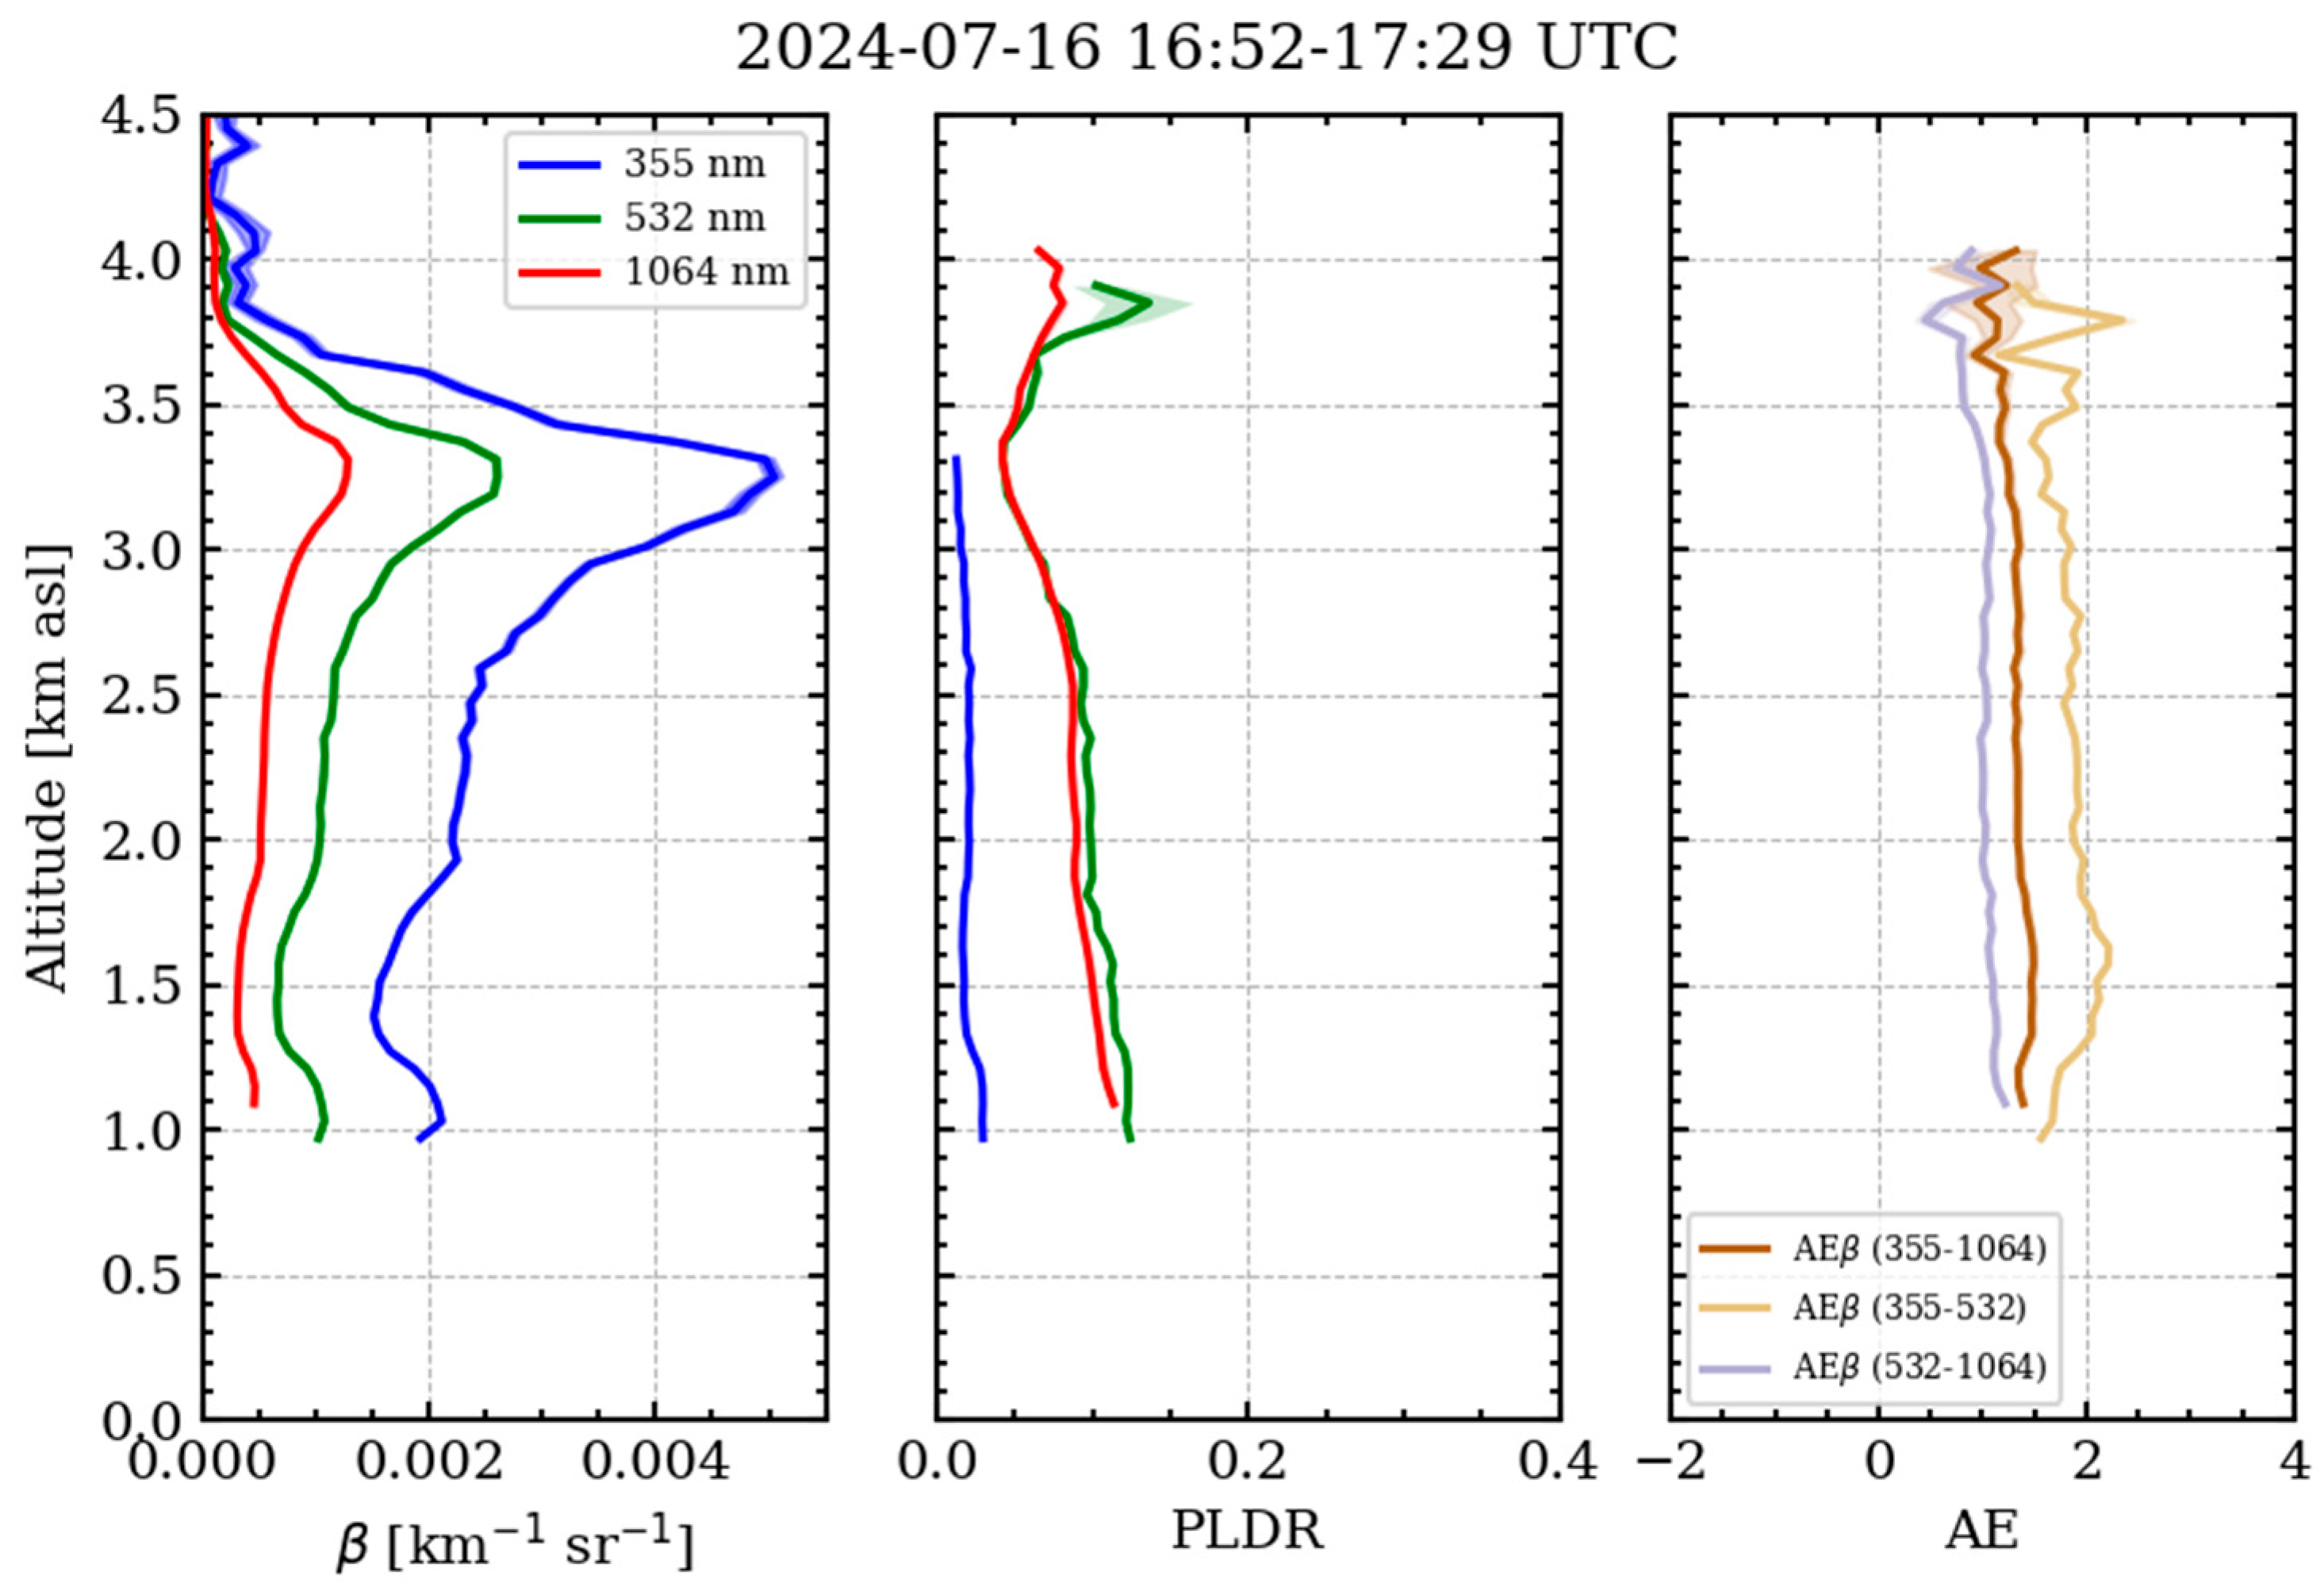
| 16 July 2024, 16:50–17:29 UTC. | 3–3.5 | - | - | - | 1.55 ± 0.04 | 1.17 ± 0.05 | 0.92 ± 0.05 | - | 0.052 ± 0.002 | 0.050 ± 0.001 |
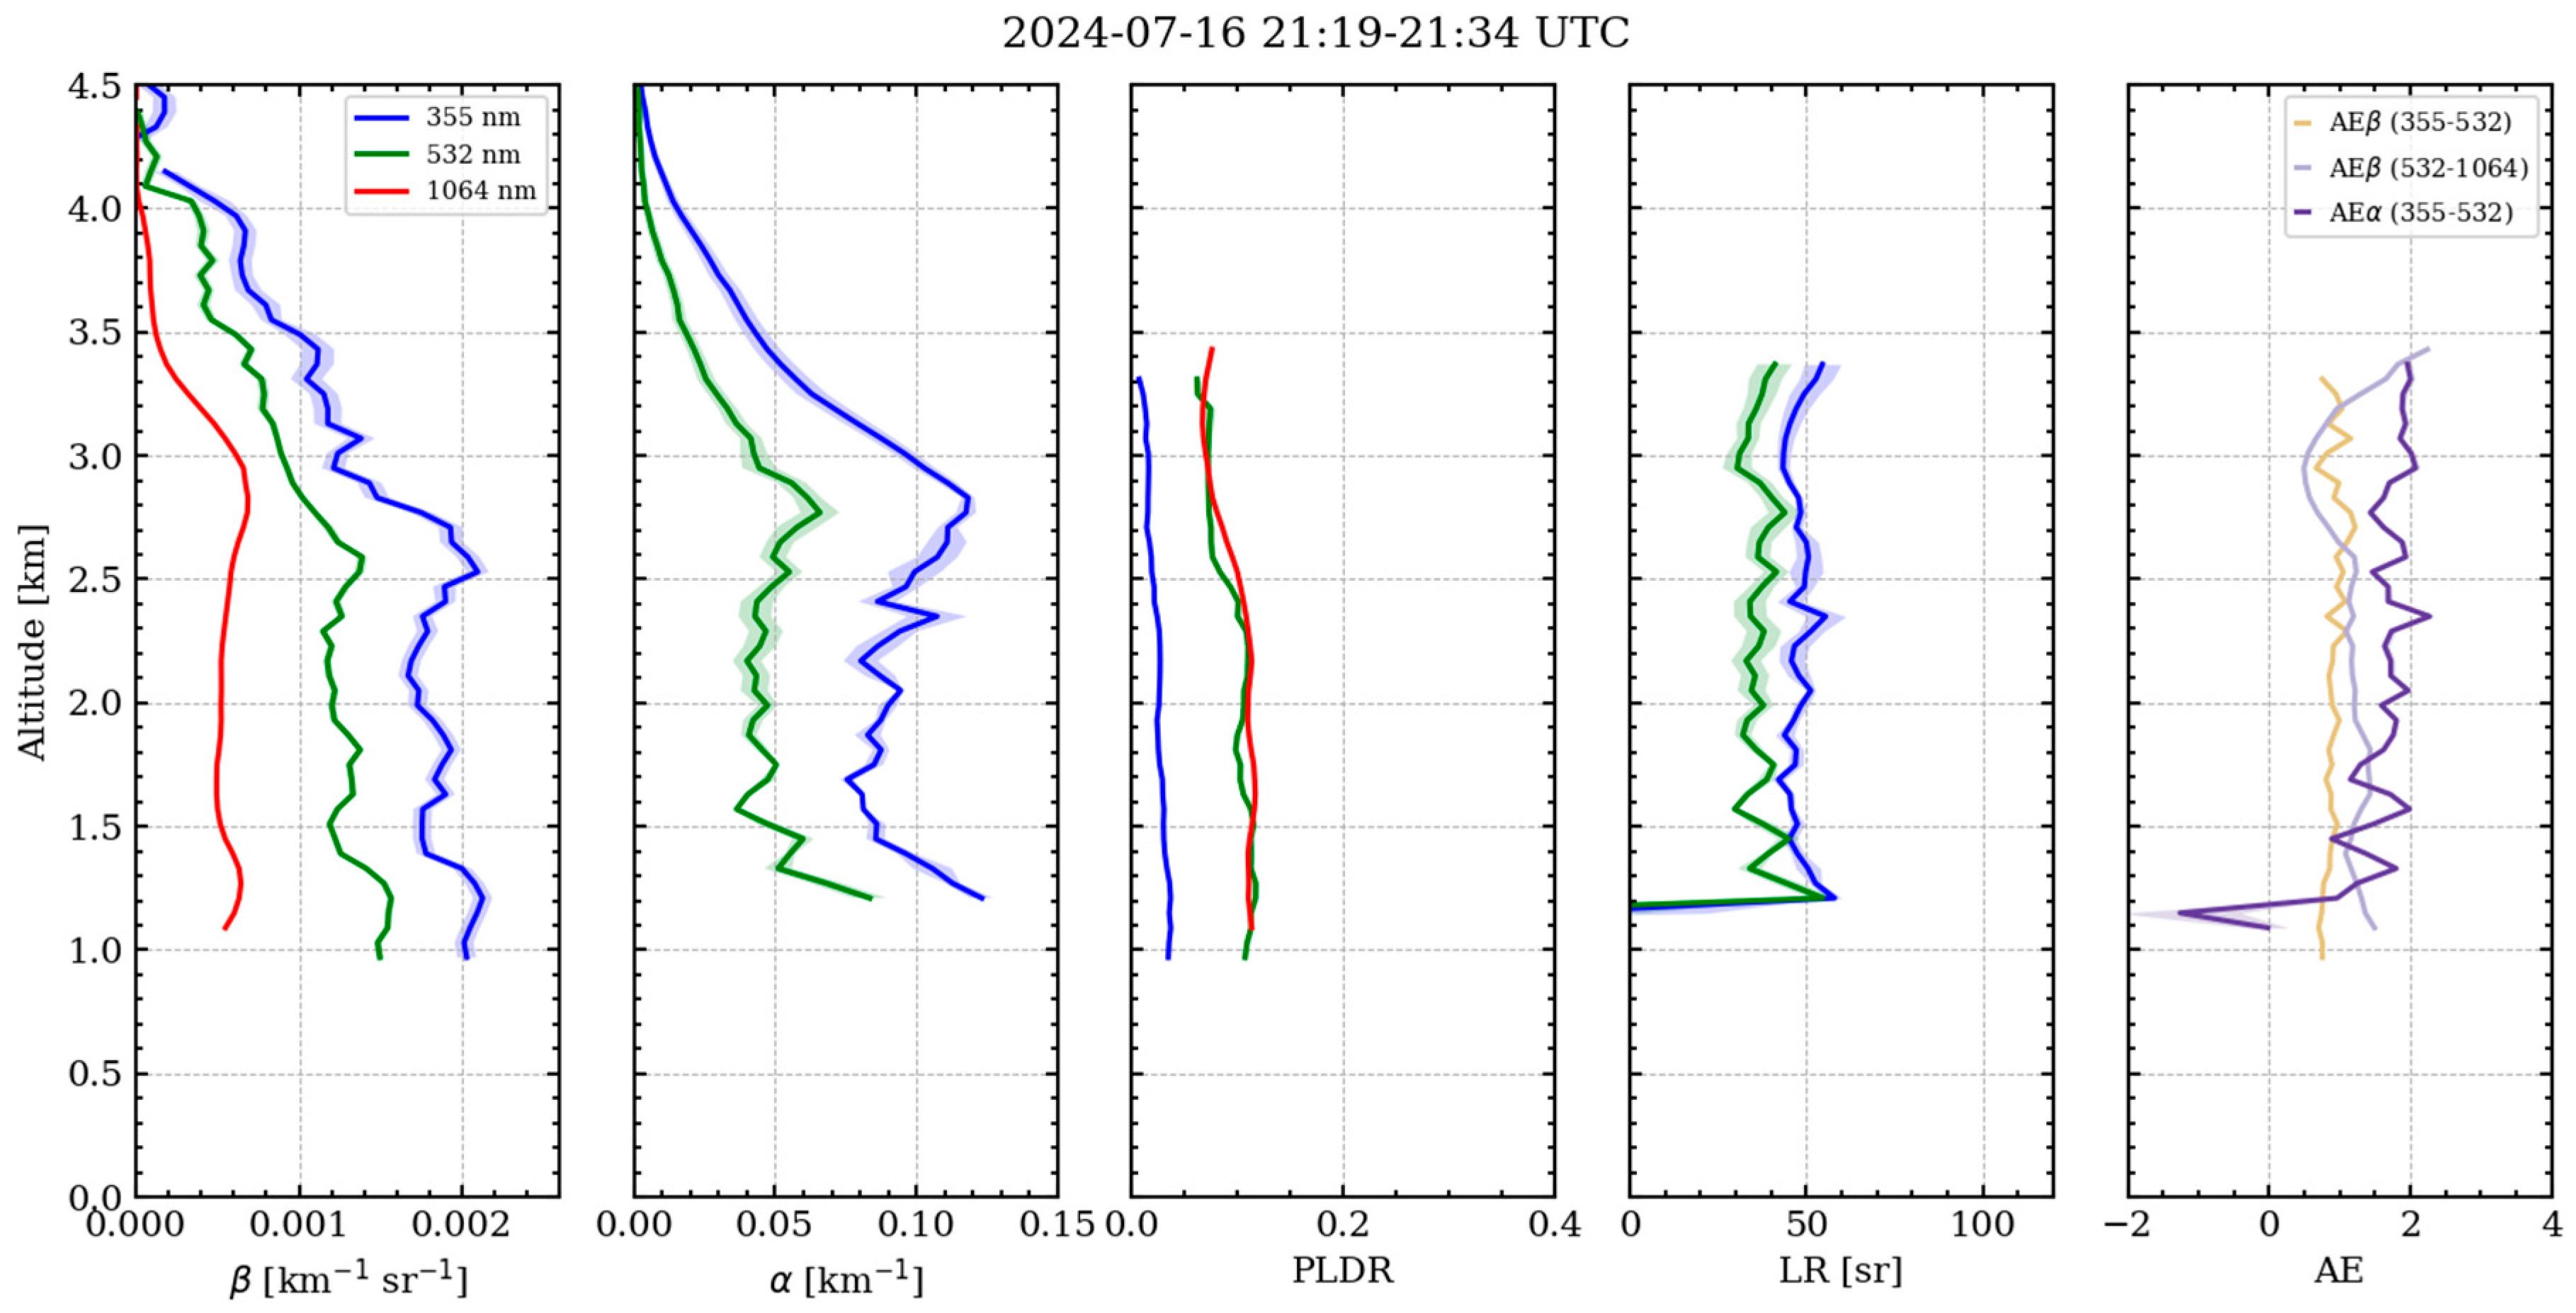
| 16 July 2024, 21:19–21:34 UTC. | 2.6–2.9 | 34.29 ± 2.8 | 45.60 ± 3.54 | 0.75 ± 0.09 | 1.21 ± 0.03 | 1.23 ± 0.03 | 1.22 ± 0.04 | 1.93 ± 0.05 | 0.067 ± 0.002 | 0.070 ± 0.001 |
| Date and Time | Alt a.s.l. (km) | LR 532 | LR 355 | LR 532/LR355 | AEβ 355–532 | AEα 532–1064 | AEα 355–532 | PLDR 532 |
|---|---|---|---|---|---|---|---|---|
| 16 July 2024, 22:19–22:50 UTC. | 6–6.5 | 82.26 ± 3.32 | 55.10 ± 2.29 | 1.49 ± 0.09 | 1.77 ± 0.13 | 1.41 ± 0.07 | 1.11 ± 0.14 | 0.040 ± 0.003 |
| 16 July 2024, 21:19–21:34 UTC. | 2.6–2.9 | 34.29 ± 2.82 | 45.60 ± 3.54 | 0.75 ± 0.09 | 1.21 ± 0.03 | 1.21 ± 0.04 | 1.93 ± 0.09 | 0.067 ± 0.002 |
| Date and Time | Alt a.s.l. (km) | Reff (µm) | V (µm3 cm−3) | mR | mi |
|---|---|---|---|---|---|
| 16 July 2024, 22:19–22:50 UTC. | 6–6.5 | 0.21 ± 0.04 | 1.2 ± 0.2 | 1.5 ± 0.1 | 0.09 ± 0.04 |
| 16 July 2024, 20:19–21:19 UTC. | 2.6–2.9 | 0.14 ± 0.02 | 10.6 ± 2.1 | 1.5 ± 0.1 | 0.004 ± 0.002 |
Disclaimer/Publisher’s Note: The statements, opinions and data contained in all publications are solely those of the individual author(s) and contributor(s) and not of MDPI and/or the editor(s). MDPI and/or the editor(s) disclaim responsibility for any injury to people or property resulting from any ideas, methods, instructions or products referred to in the content. |
© 2025 by the authors. Licensee MDPI, Basel, Switzerland. This article is an open access article distributed under the terms and conditions of the Creative Commons Attribution (CC BY) license (https://creativecommons.org/licenses/by/4.0/).
Share and Cite
De Rosa, B.; Amodeo, A.; D’Amico, G.; Papagiannopoulos, N.; Rosoldi, M.; Veselovskii, I.; Cardellicchio, F.; Falconieri, A.; Gumà-Claramunt, P.; Laurita, T.; et al. Characterization of Fresh and Aged Smoke Particles Simultaneously Observed with an ACTRIS Multi-Wavelength Raman Lidar in Potenza, Italy. Remote Sens. 2025, 17, 2538. https://doi.org/10.3390/rs17152538
De Rosa B, Amodeo A, D’Amico G, Papagiannopoulos N, Rosoldi M, Veselovskii I, Cardellicchio F, Falconieri A, Gumà-Claramunt P, Laurita T, et al. Characterization of Fresh and Aged Smoke Particles Simultaneously Observed with an ACTRIS Multi-Wavelength Raman Lidar in Potenza, Italy. Remote Sensing. 2025; 17(15):2538. https://doi.org/10.3390/rs17152538
Chicago/Turabian StyleDe Rosa, Benedetto, Aldo Amodeo, Giuseppe D’Amico, Nikolaos Papagiannopoulos, Marco Rosoldi, Igor Veselovskii, Francesco Cardellicchio, Alfredo Falconieri, Pilar Gumà-Claramunt, Teresa Laurita, and et al. 2025. "Characterization of Fresh and Aged Smoke Particles Simultaneously Observed with an ACTRIS Multi-Wavelength Raman Lidar in Potenza, Italy" Remote Sensing 17, no. 15: 2538. https://doi.org/10.3390/rs17152538
APA StyleDe Rosa, B., Amodeo, A., D’Amico, G., Papagiannopoulos, N., Rosoldi, M., Veselovskii, I., Cardellicchio, F., Falconieri, A., Gumà-Claramunt, P., Laurita, T., Mytilinaios, M., Papanikolaou, C.-A., Amodio, D., Colangelo, C., Di Girolamo, P., Gandolfi, I., Giunta, A., Lapenna, E., Marra, F., ... Mona, L. (2025). Characterization of Fresh and Aged Smoke Particles Simultaneously Observed with an ACTRIS Multi-Wavelength Raman Lidar in Potenza, Italy. Remote Sensing, 17(15), 2538. https://doi.org/10.3390/rs17152538