
Detection of Greenhouse and Typical Rural Buildings with Efficient Weighted YOLOv8 in Hebei Province, China

 ,
,  , and
, and
Abstract
1. Introduction
2. Data and Study Areas
2.1. Wide-Area Greenhouses and Rural Building Detection Dataset
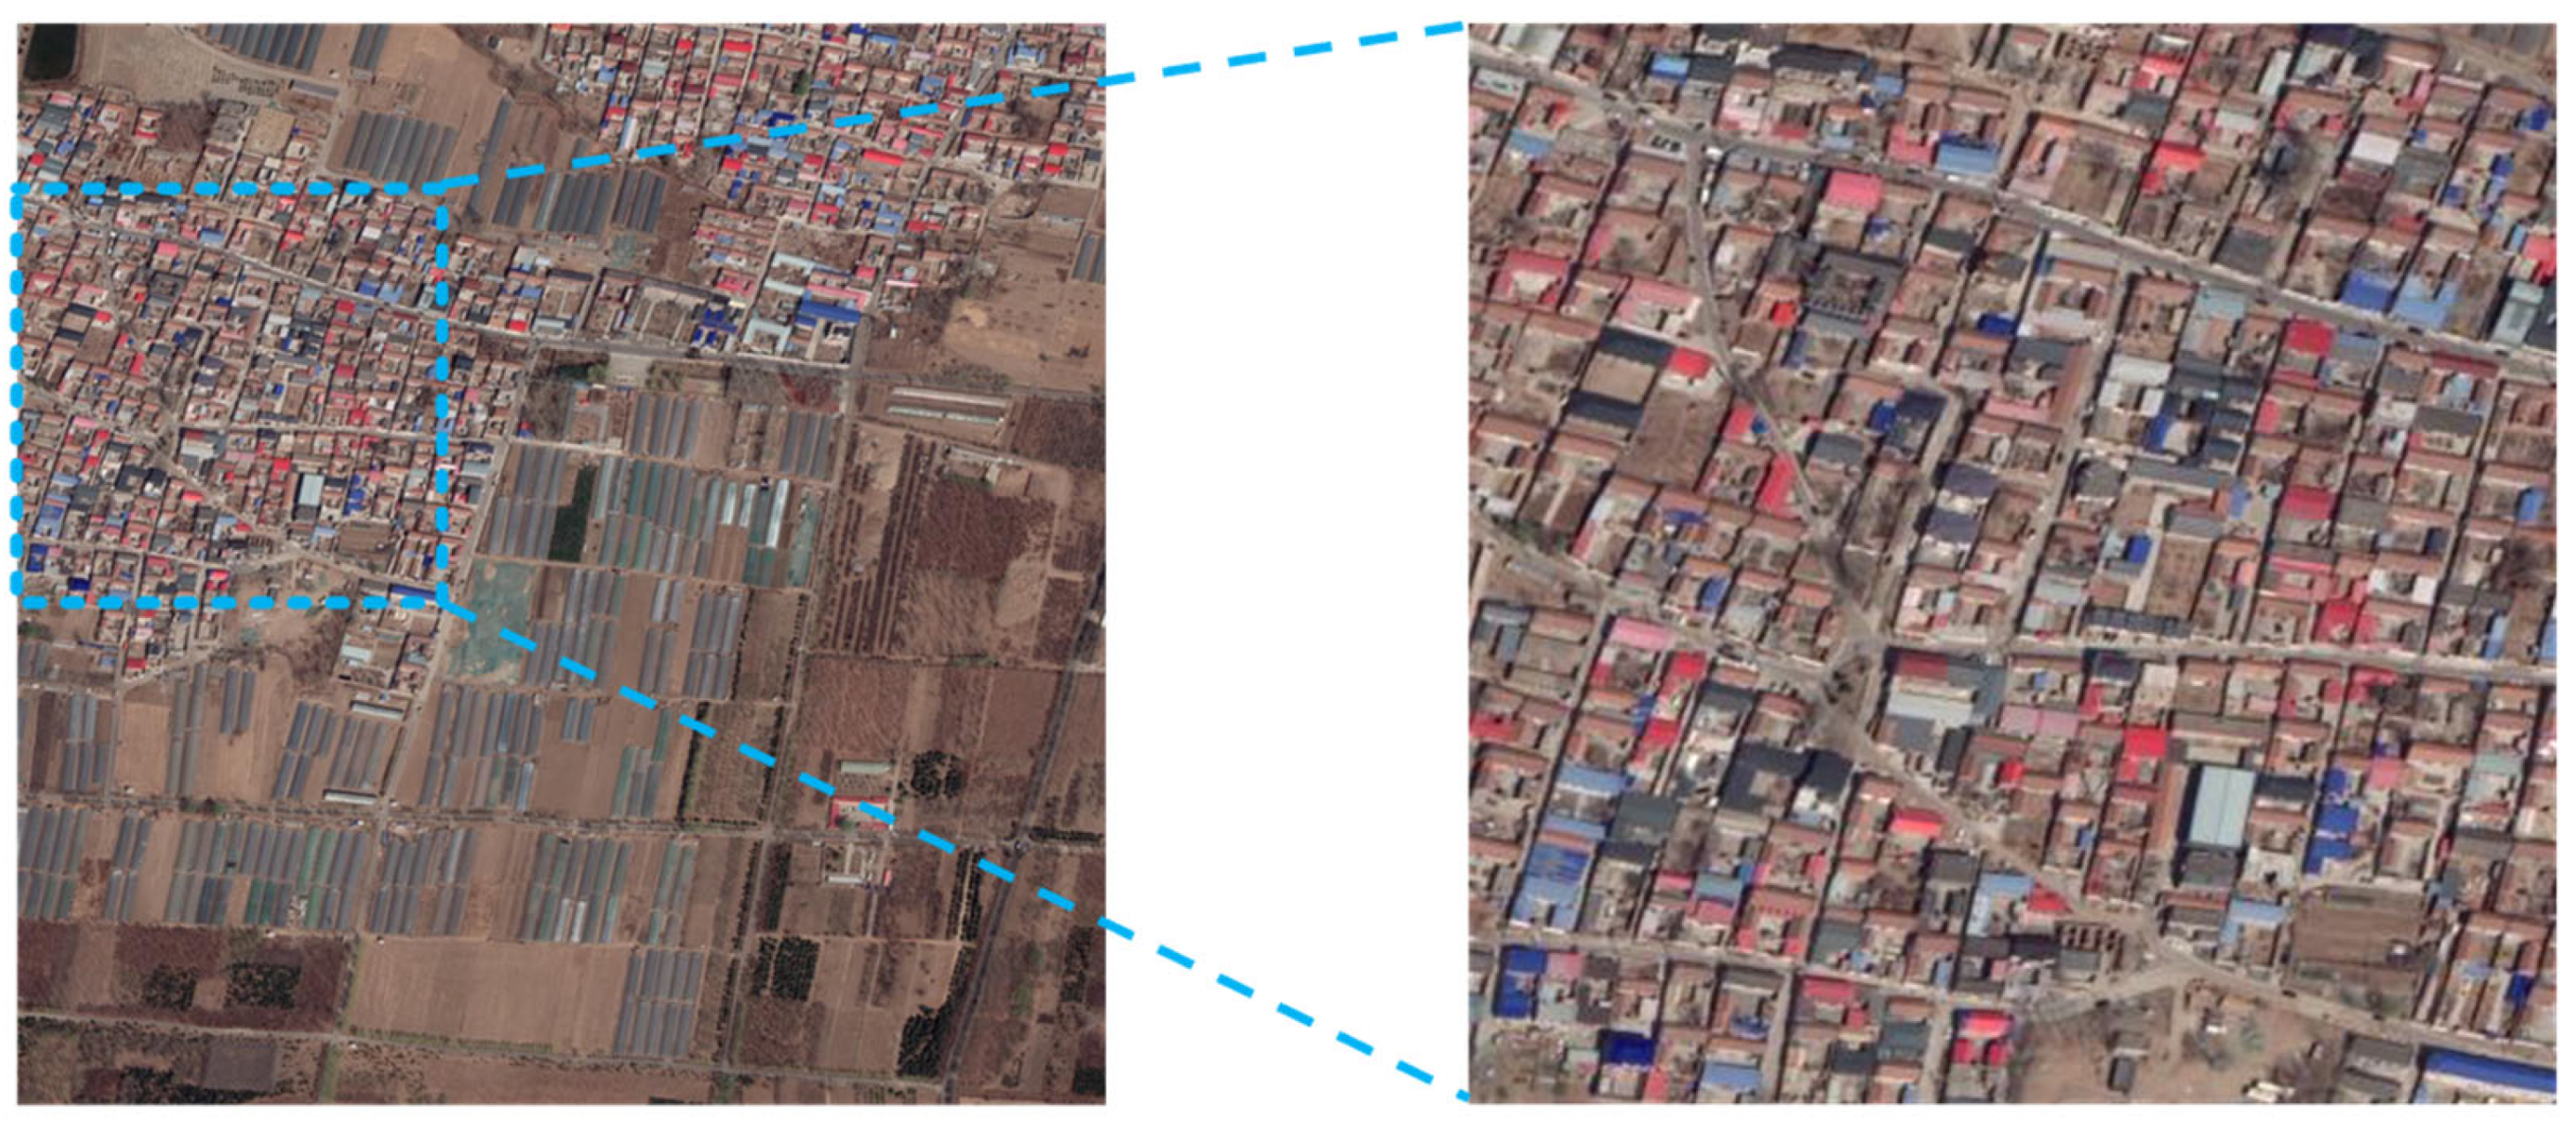
2.2. Study Area
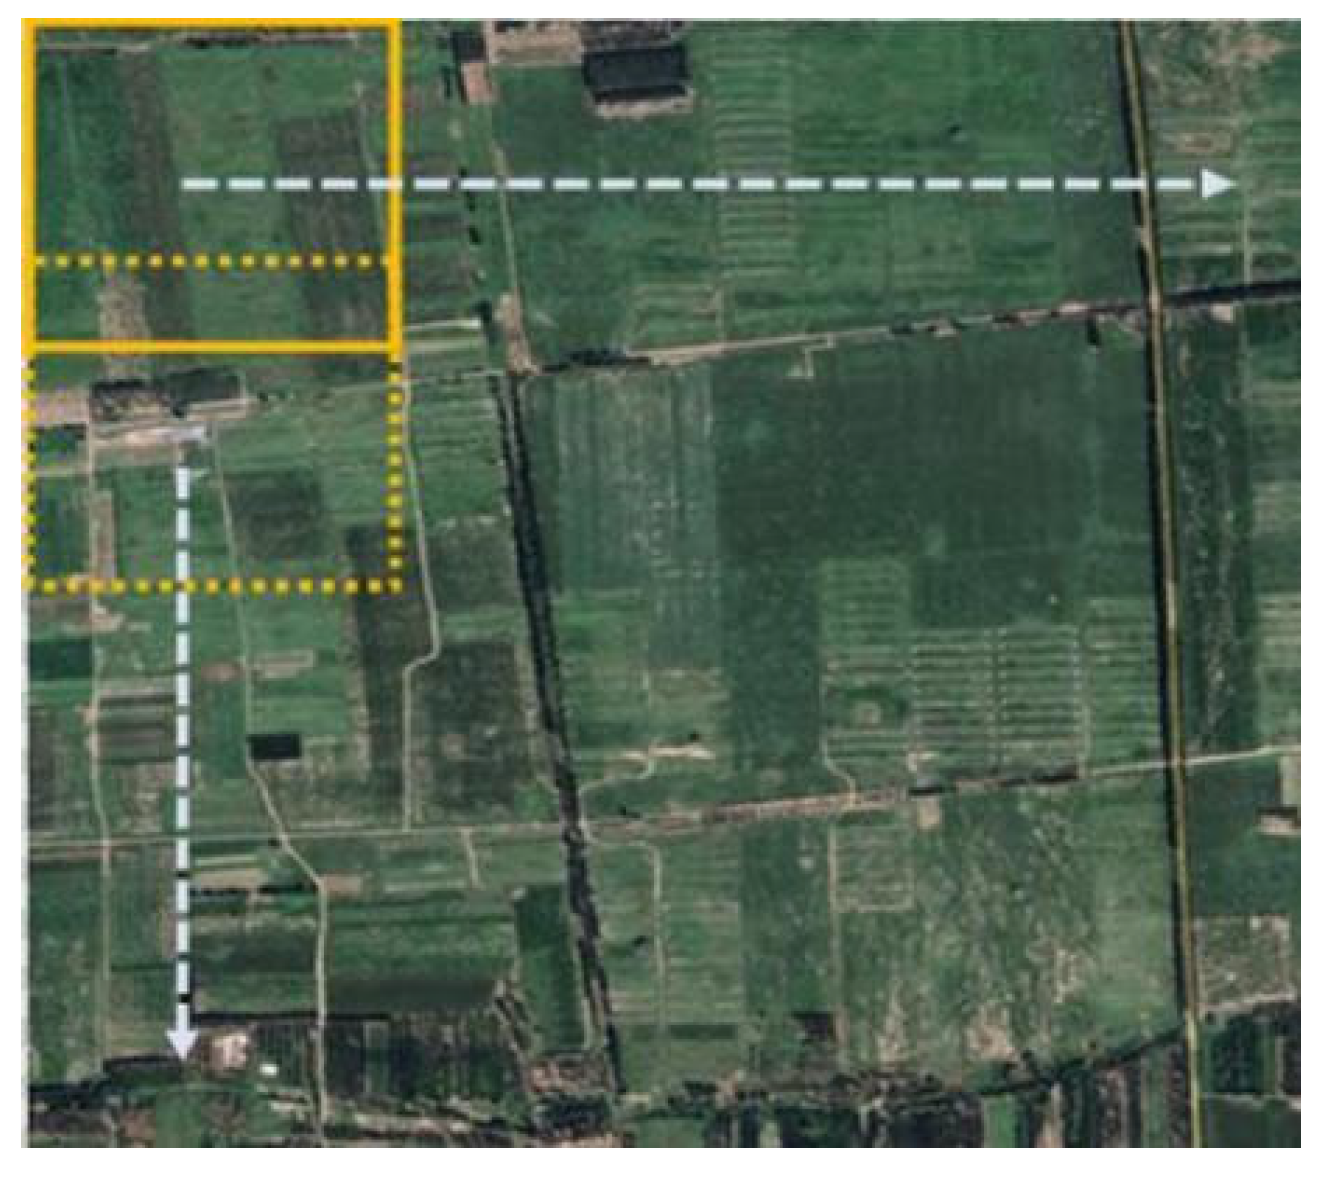
2.3. Dataset Preprocessing
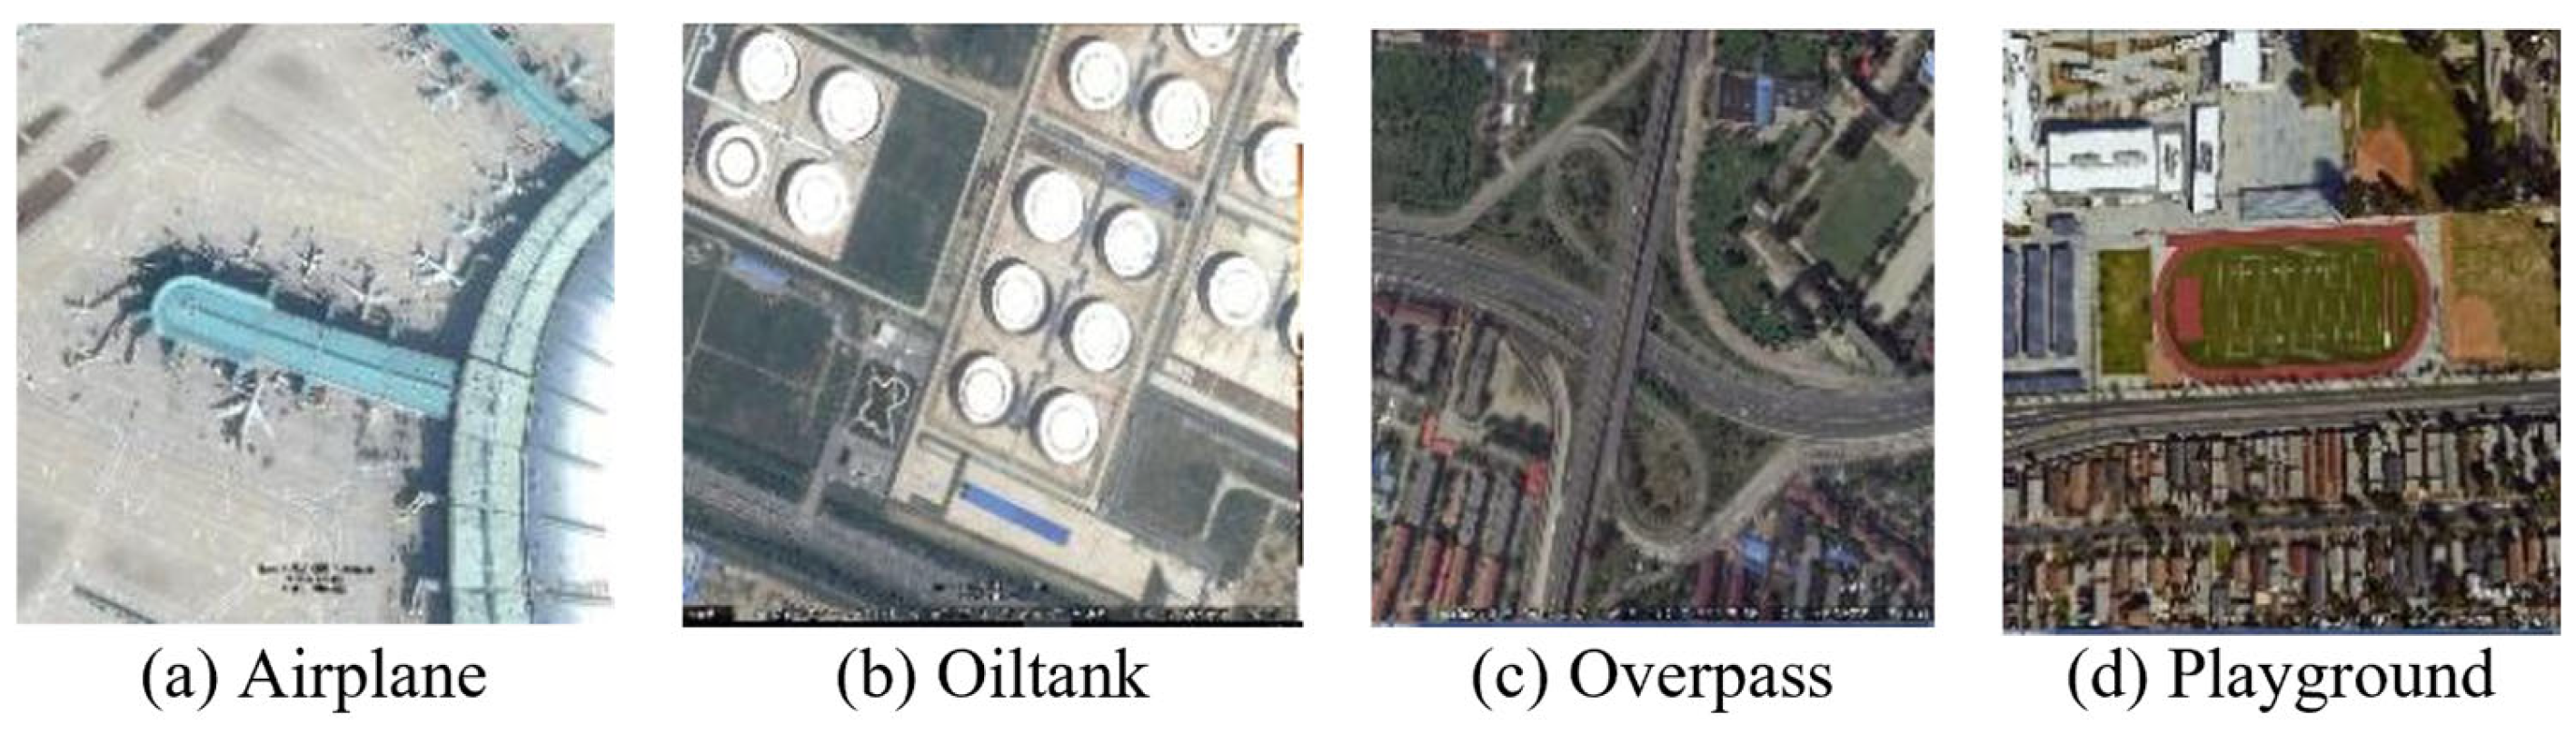
2.4. RSOD Dataset
3. Methods
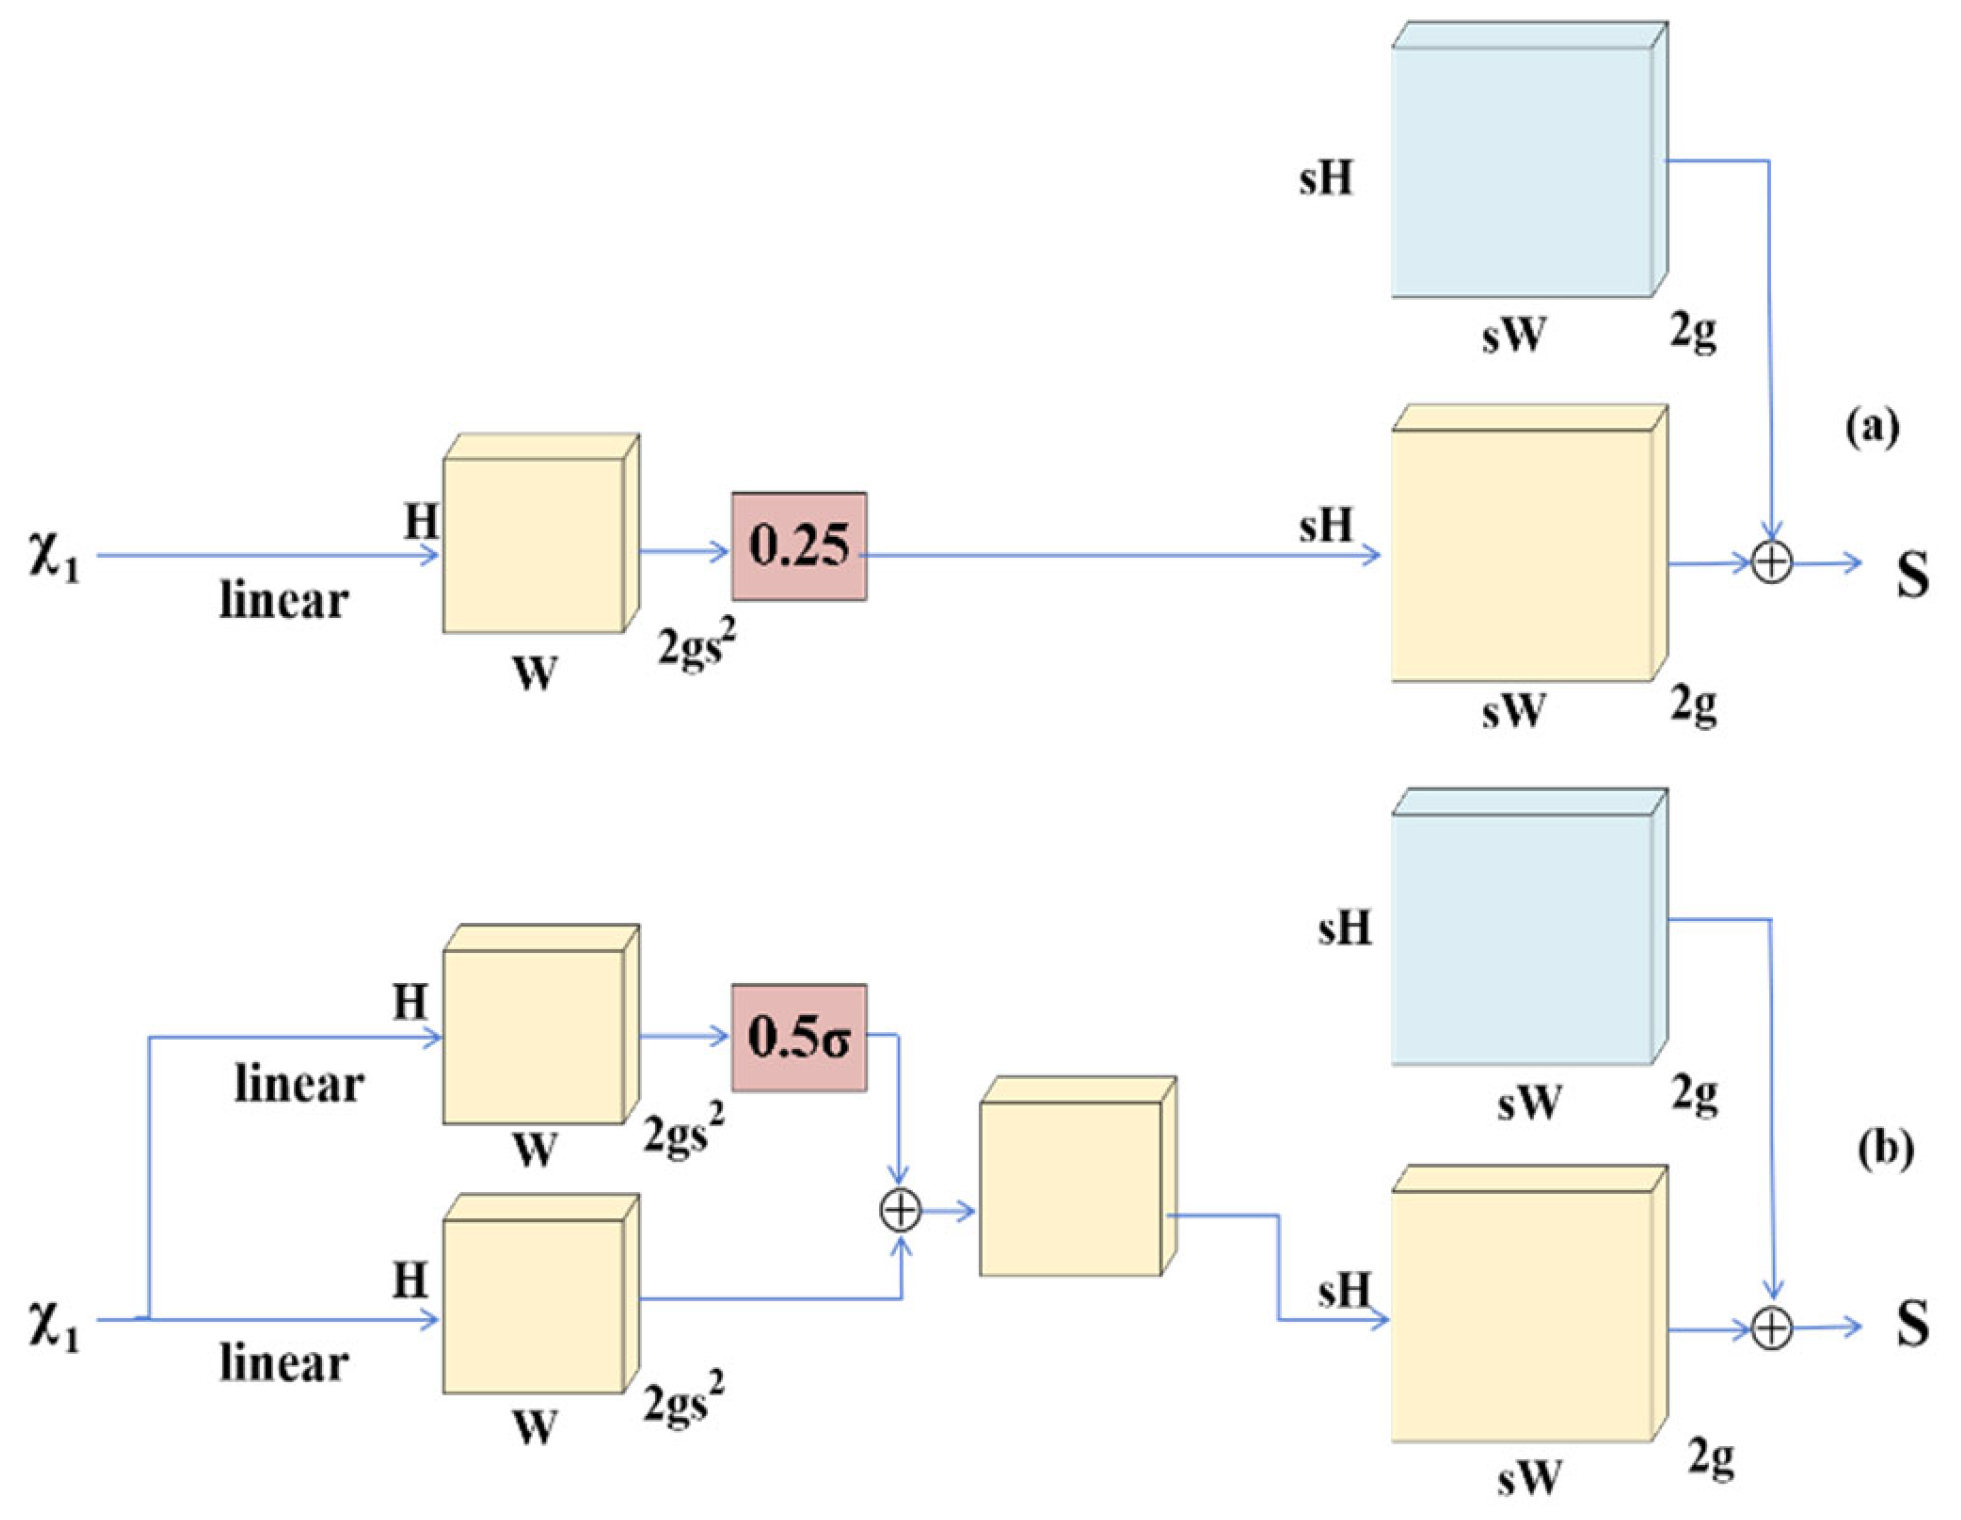
3.1. DySample
3.2. Normalized Wasserstein Distance
3.3. SlideLoss
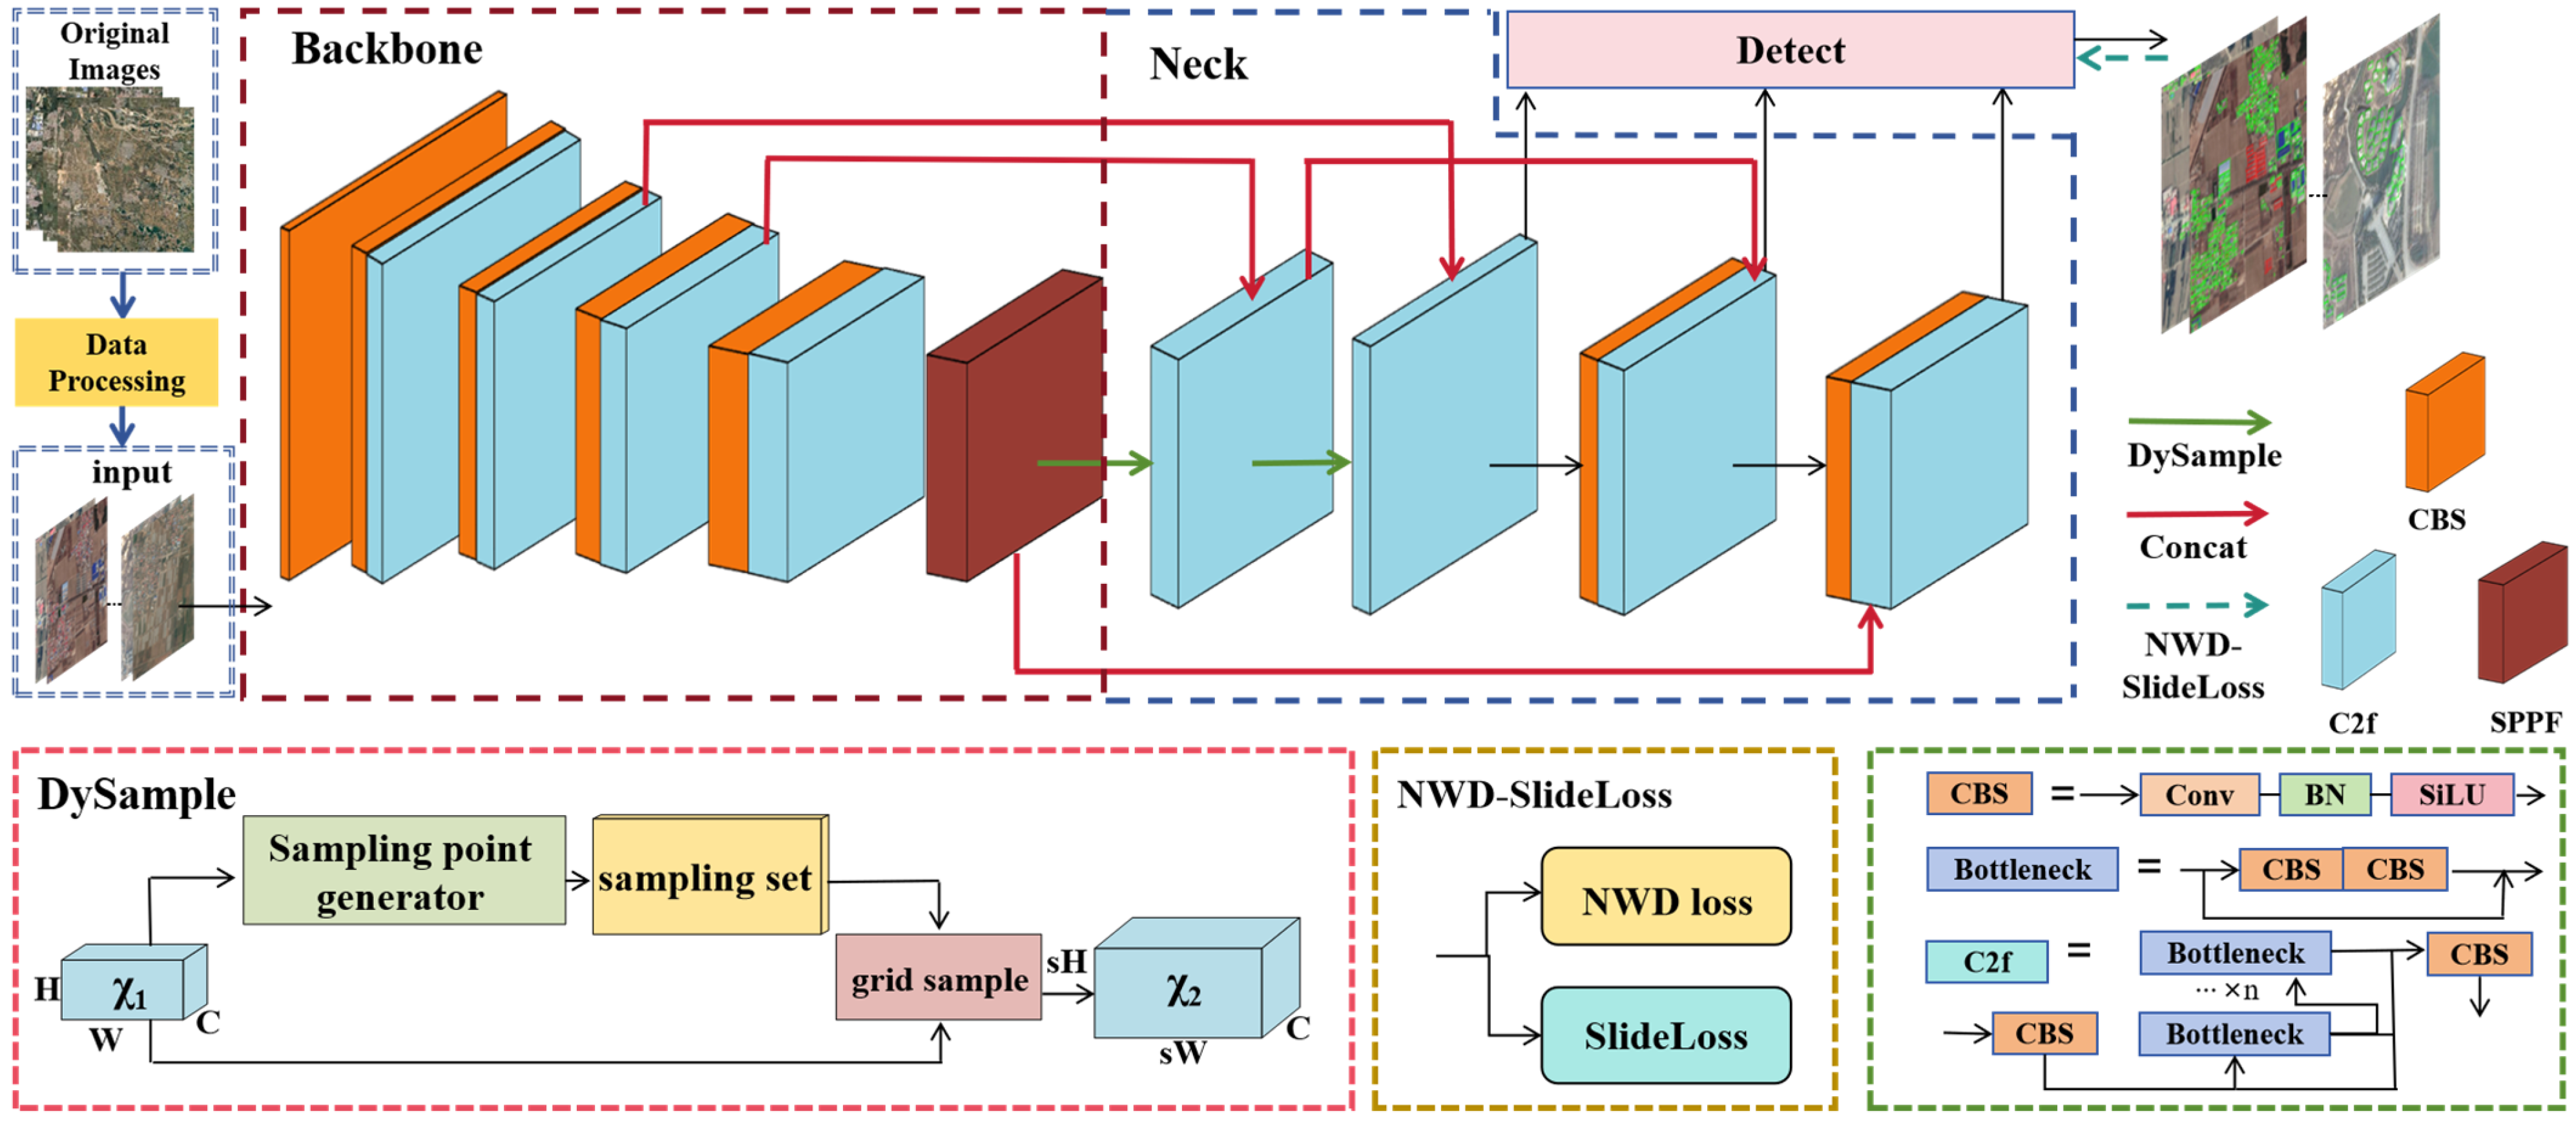
3.4. EW-YOLOv8
4. Experimental Results
4.1. Experimental Setting
4.2. Experimental Indices
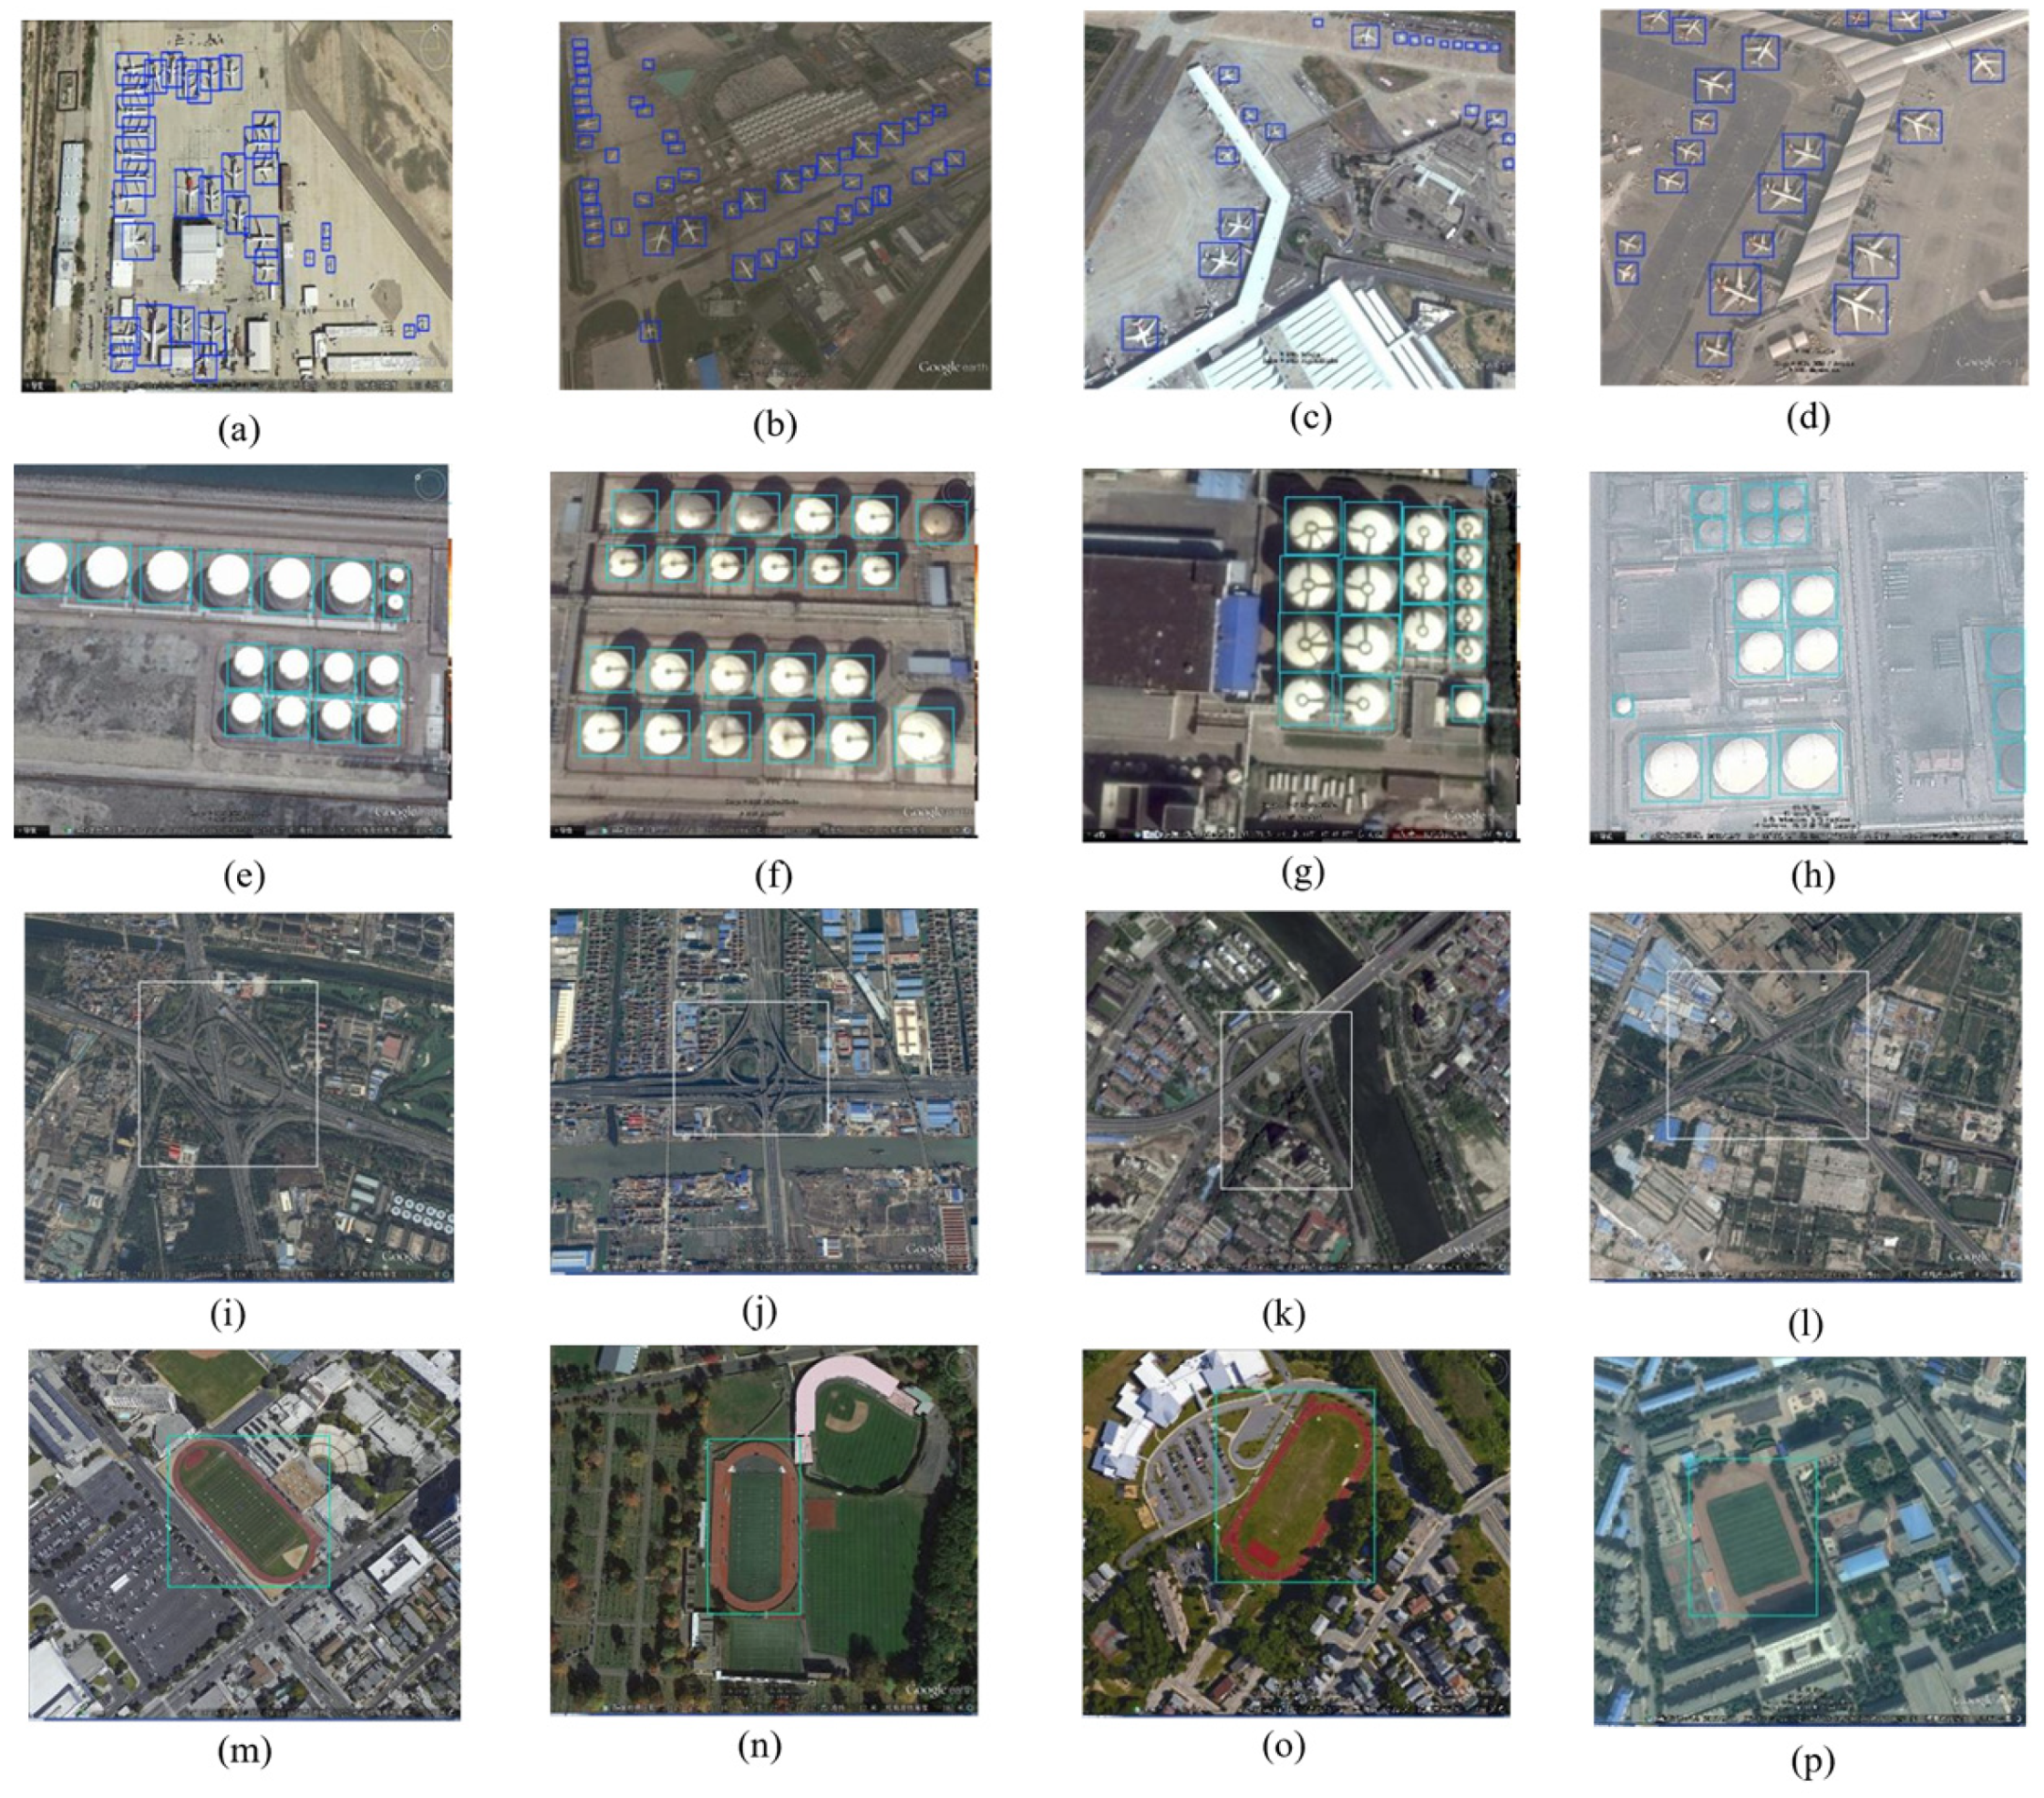
4.3. Validation of EW-YOLOv8 on RSOD Dataset
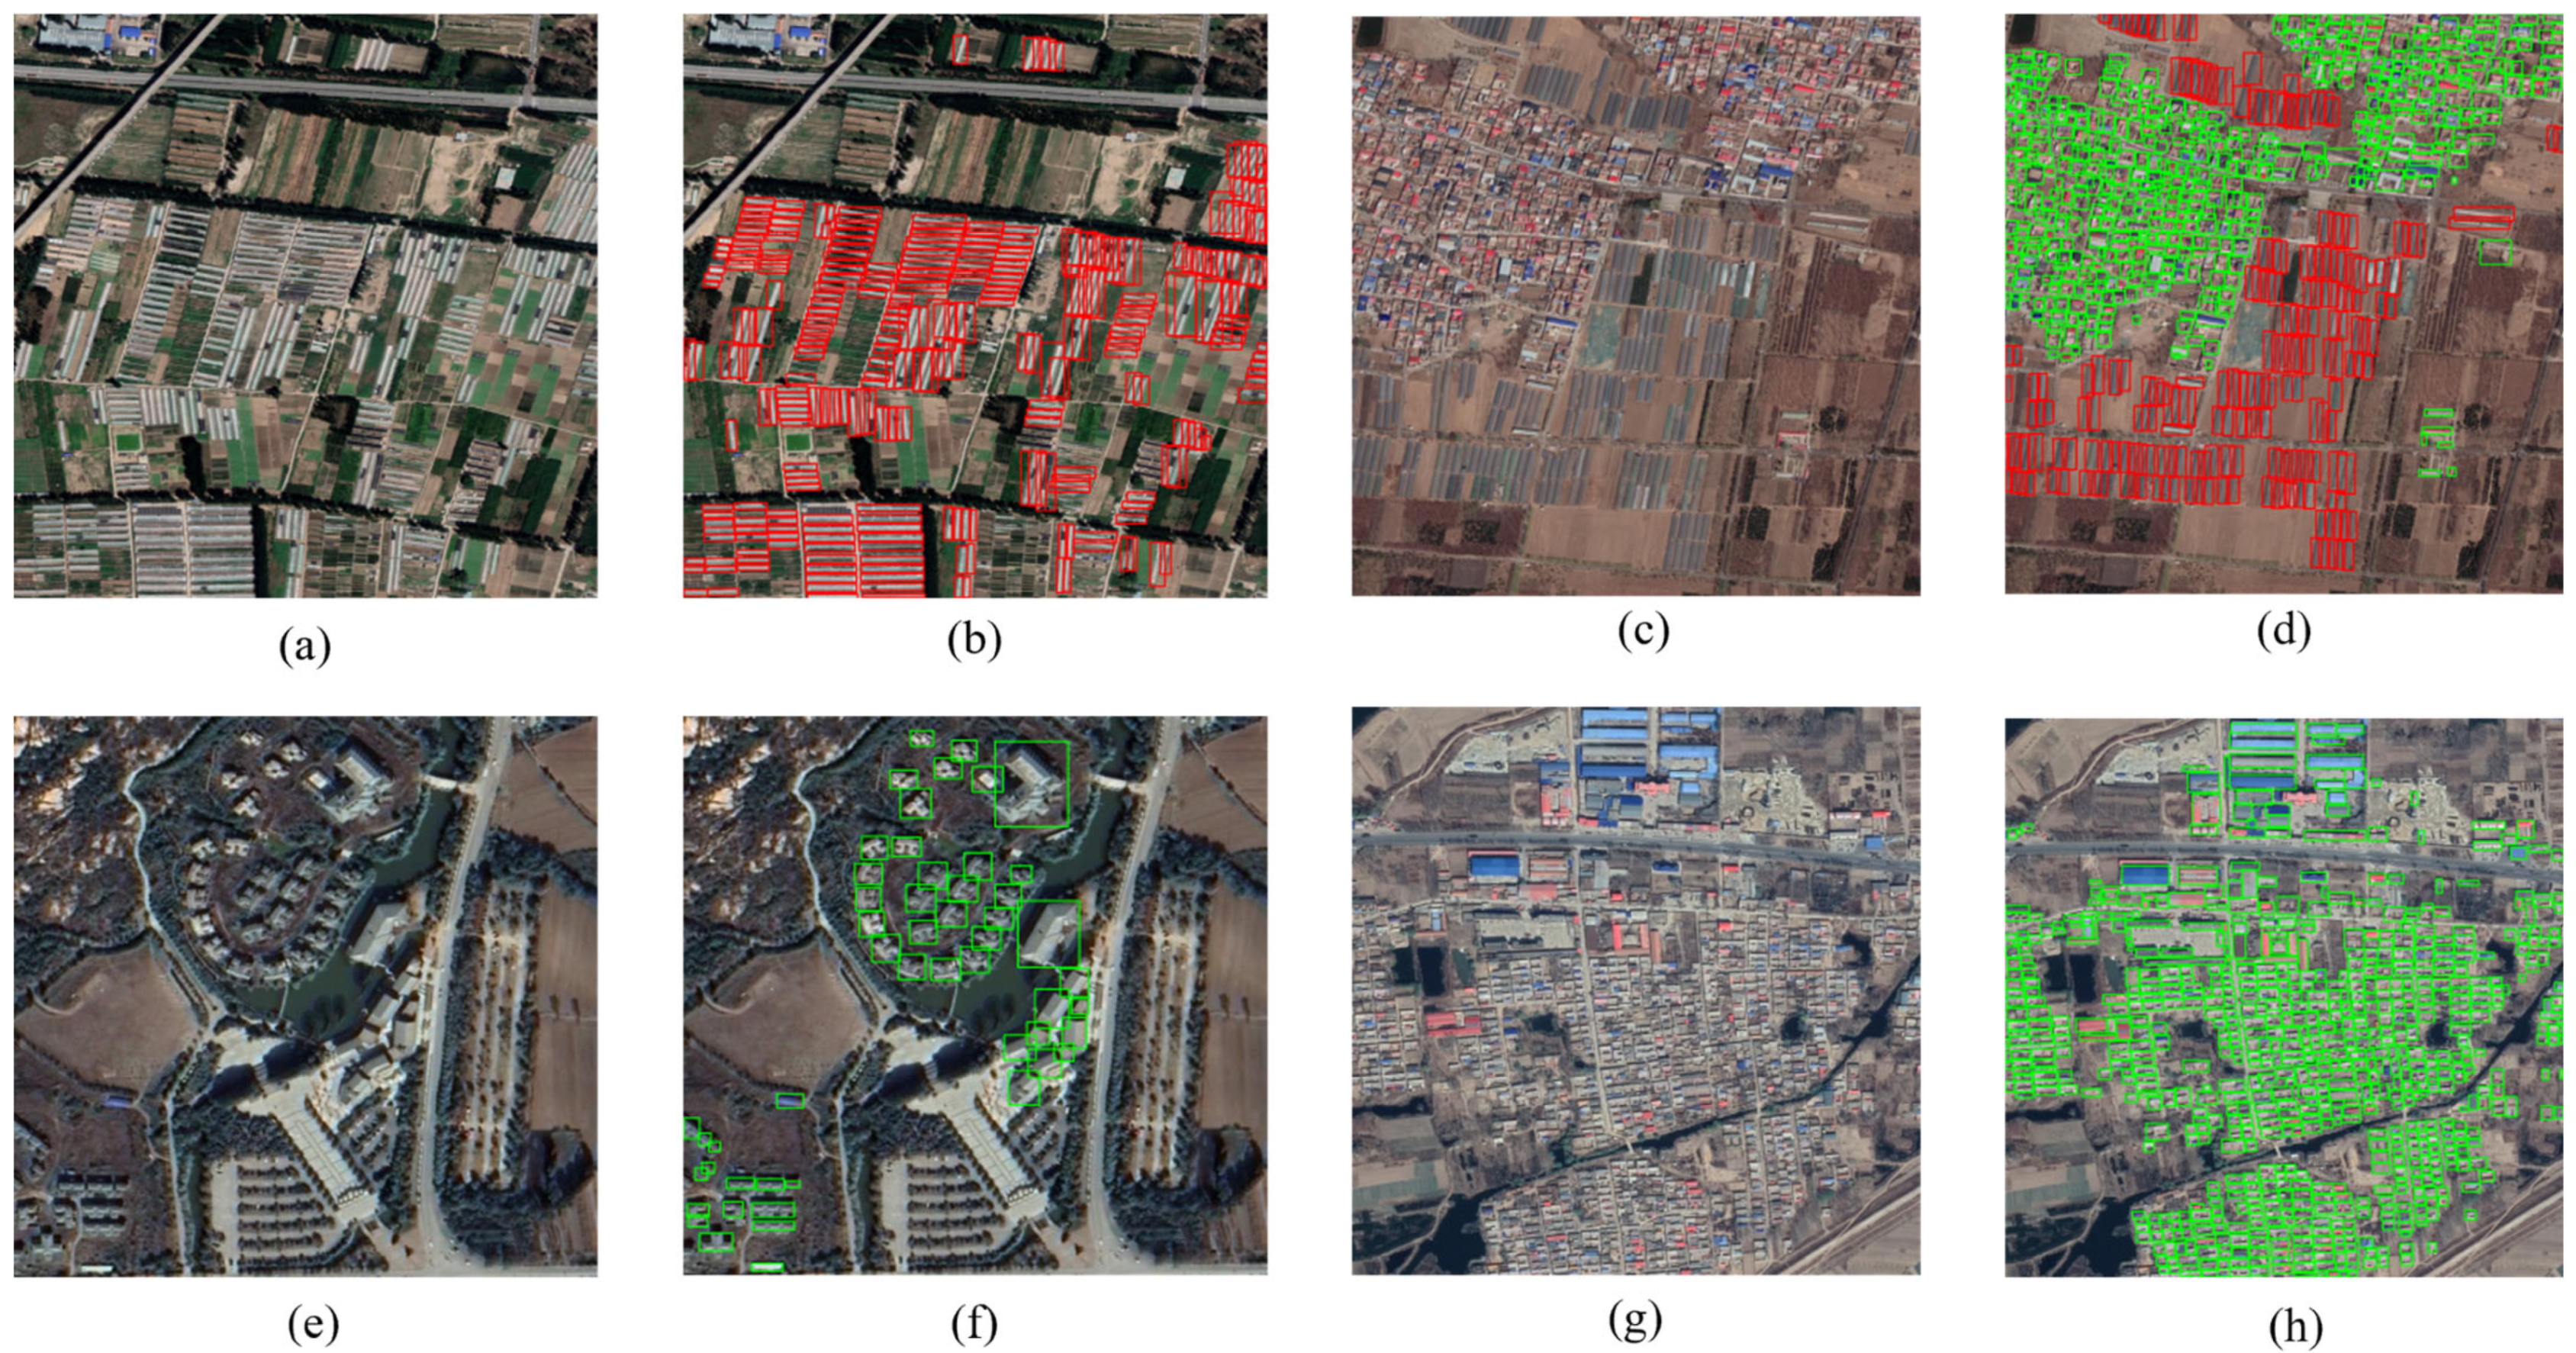
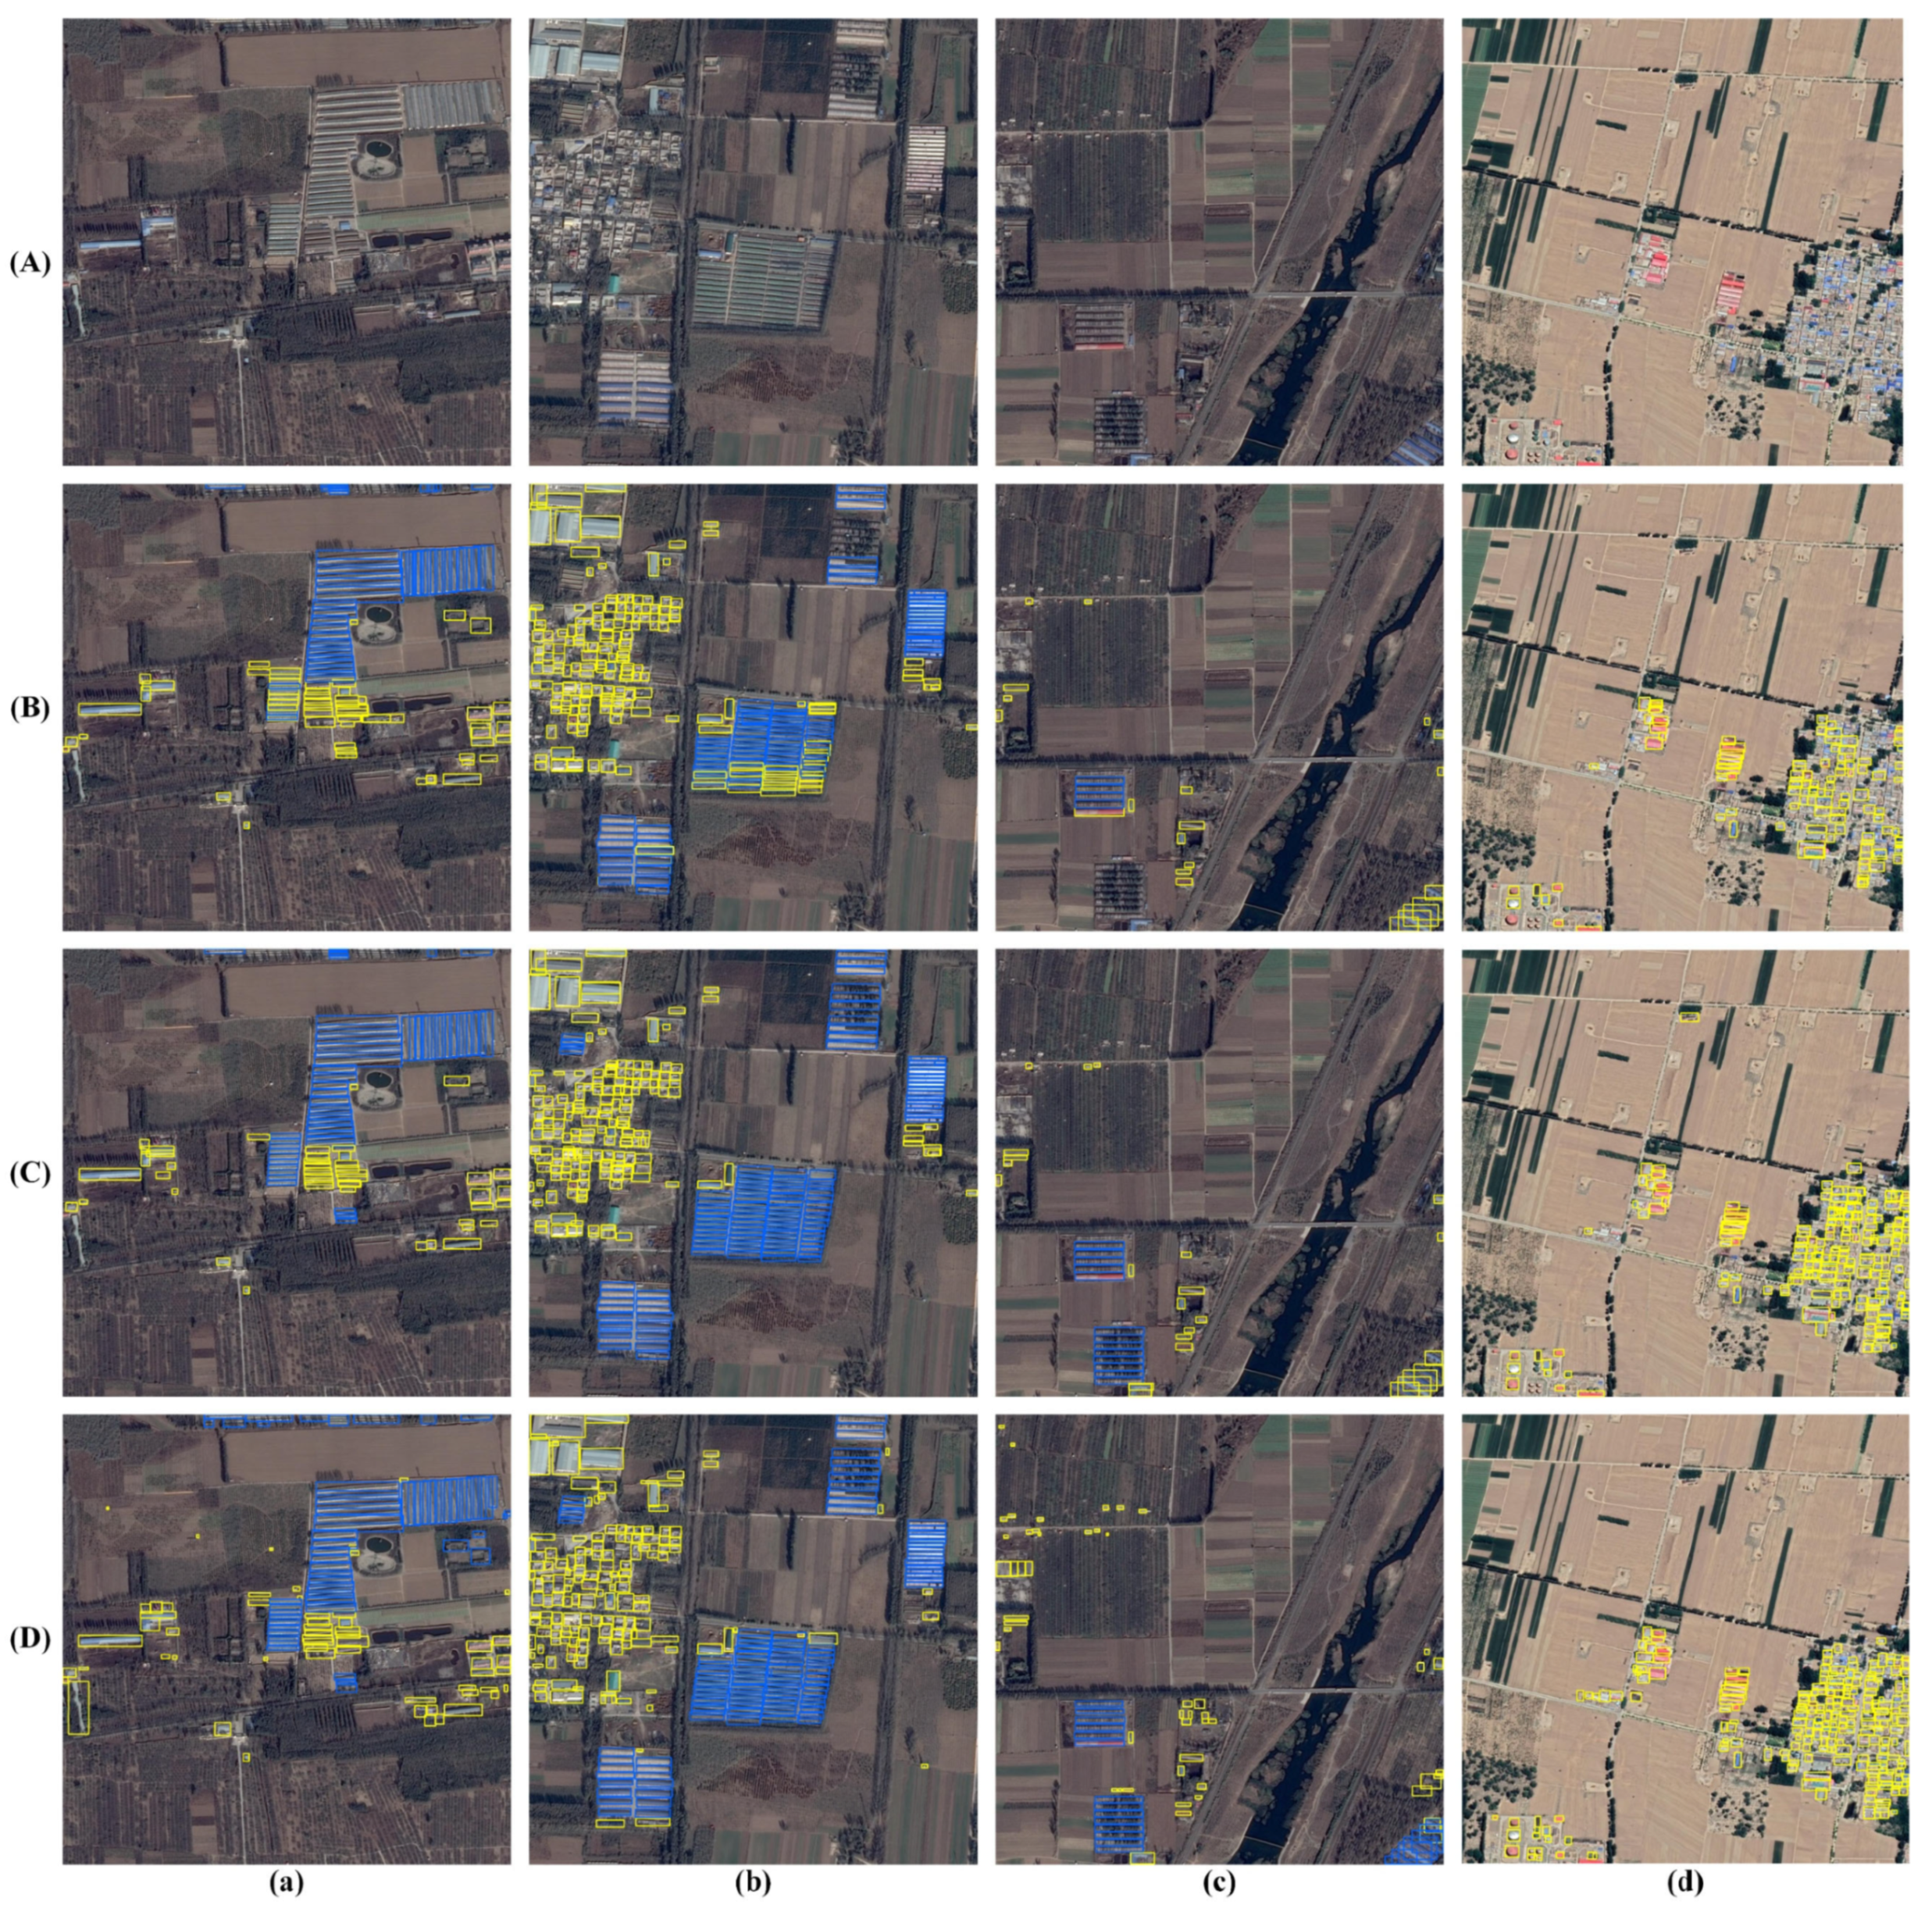
4.4. Accuracy Analysis of Detection Results Based on EW-YOLOv8
5. Discussion
6. Conclusions
Author Contributions
Funding
Data Availability Statement
Conflicts of Interest
References
- Choi, H.O. An evolutionary approach to technology innovation of cadastre for smart land management policy. Land 2020, 9, 50. [Google Scholar] [CrossRef]
- Ji, Y.; Wu, W.; Wan, G.; Zhao, Y.; Wang, W.; Yin, H.; Tian, Z.; Liu, S. Segment Anything Model-Based Building Footprint Extraction for Residential Complex Spatial Assessment Using LiDAR Data and Very High-Resolution Imagery. Remote Sens. 2024, 16, 2661. [Google Scholar] [CrossRef]
- Nahhas, F.H.; Shafri, H.Z.; Sameen, M.I.; Pradhan, B.; Mansor, S. Deep learning approach for building detection using lidar–orthophoto fusion. J. Sens. 2018, 2018, 7212307. [Google Scholar] [CrossRef]
- Hermosilla, T.; Ruiz, L.A.; Recio, J.A.; Estornell, J. Evaluation of automatic building detection approaches combining high resolution images and LiDAR data. Remote Sens. 2011, 3, 1188–1210. [Google Scholar] [CrossRef]
- Wierzbicki, D.; Matuk, O.; Bielecka, E. Polish cadastre modernization with remotely extracted buildings from high-resolution aerial orthoimagery and airborne LiDAR. Remote Sens. 2021, 13, 611. [Google Scholar] [CrossRef]
- Sun, Y.; Fu, Z.; Sun, C.; Hu, Y.; Zhang, S. Deep multimodal fusion network for semantic segmentation using remote sensing image and LiDAR data. IEEE Trans. Geosci. Remote Sens. 2021, 60, 5404418. [Google Scholar] [CrossRef]
- Liu, Z.; Gao, X.; Yang, Y.; Xu, L.; Wang, S.; Chen, N.; Wang, Z.; Kou, Y. EDT-Net: A Lightweight Tunnel Water Leakage Detection Network Based on LiDAR Point Clouds Intensity Images. IEEE J. Sel. Top. Appl. Earth Obs. Remote Sens. 2025, 18, 7334–7346. [Google Scholar] [CrossRef]
- Zheheng, L.; Peng, D.; Fuquan, J.; Sen, S.H.; Rulan, W.E.; Gangsheng, X.I. The application of illegal building detection from VHR UAV remote sensing images based on convolutional neural network. Bull. Surv. Mapp. 2021, 4, 111. [Google Scholar]
- Shi, L.; Zhang, Q.; Pan, B.; Zhang, J.; Su, Y. Global-local and occlusion awareness network for object tracking in UAVs. IEEE J. Sel. Top. Appl. Earth Obs. Remote Sens. 2023, 16, 8834–8844. [Google Scholar] [CrossRef]
- Hou, W.; Wu, H.; Wu, D.; Shen, Y.; Liu, Z.; Zhang, L.; Li, J. Small Object Detection Method for UAV Remote Sensing Images Based on αS-YOLO. IEEE J. Sel. Top. Appl. Earth Obs. Remote Sens. 2025, 18, 8984–8994. [Google Scholar] [CrossRef]
- Niu, K.; Wang, C.; Xu, J.; Liang, J.; Zhou, X.; Wen, K.; Lu, M.; Yang, C. Early Forest Fire Detection with UAV Image Fusion: A Novel Deep Learning Method Using Visible and Infrared Sensors. IEEE J. Sel. Top. Appl. Earth Obs. Remote Sens. 2025, 18, 6617–6629. [Google Scholar] [CrossRef]
- Huang, X.; Chen, K.; Tang, D.; Liu, C.; Ren, L.; Sun, Z.; Hänsch, R.; Schmitt, M.; Sun, X.; Huang, H.; et al. Urban building classification (UBC) V2—A benchmark for global building detection and fine-grained classification from satellite imagery. IEEE Trans. Geosci. Remote Sens. 2023, 61, 5620116. [Google Scholar] [CrossRef]
- Konstantinidis, D.; Stathaki, T.; Argyriou, V.; Grammalidis, N. Building detection using enhanced HOG–LBP features and region refinement processes. IEEE J. Sel. Top. Appl. Earth Obs. Remote Sens. 2016, 10, 888–905. [Google Scholar] [CrossRef]
- Chen, Y.; He, C.; Guo, W.; Zheng, S.; Wu, B. Mapping urban functional areas using multisource remote sensing images and open big data. IEEE J. Sel. Top. Appl. Earth Obs. Remote Sens. 2023, 16, 7919–7931. [Google Scholar] [CrossRef]
- Ball, J.E.; Anderson, D.T.; Chan, C.S. Comprehensive survey of deep learning in remote sensing: Theories, tools, and challenges for the community. J. Appl. Remote Sens. 2017, 11, 042609. [Google Scholar] [CrossRef]
- Zhu, X.X.; Tuia, D.; Mou, L.; Xia, G.S.; Zhang, L.; Xu, F.; Fraundorfer, F. Deep learning in remote sensing: A comprehensive review and list of resources. IEEE Geosci. Remote Sens. Mag. 2017, 5, 8–36. [Google Scholar] [CrossRef]
- Freund, Y.; Schapire, R.E. Experiments with a new boosting algorithm. In Proceedings of the ICML’96: Proceedings of the Thirteenth International Conference on International Conference on Machine Learning, Bari, Italy, 3–6 July 1996; Volume 96, pp. 148–156. [Google Scholar]
- Dalal, N.; Triggs, B. Histograms of oriented gradients for human detection. In Proceedings of the 2005 IEEE Computer Society Conference on Computer Vision and Pattern Recognition (CVPR’05), San Diego, CA, USA, 20–25 June 2005; Volume 1, pp. 886–893. [Google Scholar]
- Tsangaratos, P.; Ilia, I. Landslide susceptibility mapping using a modified decision tree classifier in the Xanthi Perfection, Greece. Landslides 2016, 13, 305–320. [Google Scholar] [CrossRef]
- Vladimir, V.N.; Vapnik, V. The Nature of Statistical Learning Theory; Springer: Berlin/Heidelberg, Germany, 1995. [Google Scholar]
- LeCun, Y.; Bengio, Y.; Hinton, G. Deep learning. Nature 2015, 521, 436–444. [Google Scholar] [CrossRef]
- Jeon, J.; Jeong, B.; Baek, S.; Jeong, Y.S. Hybrid malware detection based on Bi-LSTM and SPP-Net for smart IoT. IEEE Trans. Ind. Inform. 2021, 18, 4830–4837. [Google Scholar] [CrossRef]
- Jiang, D.; Li, G.; Tan, C.; Huang, L.; Sun, Y.; Kong, J. Semantic segmentation for multiscale target based on object recognition using the improved Faster-RCNN model. Future Gener. Comput. Syst. 2021, 123, 94–104. [Google Scholar] [CrossRef]
- He, K.; Gkioxari, G.; Dollár, P.; Girshick, R. Mask r-cnn. In Proceedings of the 2017 IEEE International Conference on Computer Vision (ICCV), Venice, Italy, 22–29 October 2017; pp. 2961–2969. [Google Scholar]
- Fang, W.; Wang, L.; Ren, P. Tinier-YOLO: A real-time object detection method for constrained environments. IEEE Access 2019, 8, 1935–1944. [Google Scholar] [CrossRef]
- Huang, R.; Pedoeem, J.; Chen, C. YOLO-LITE: A real-time object detection algorithm optimized for non-GPU computers. In Proceedings of the 2018 IEEE International Conference on Big Data (Big Data), Seattle, WA, USA, 10–13 December 2018; pp. 2503–2510. [Google Scholar]
- Ge, Z.; Liu, S.; Wang, F.; Li, Z.; Sun, J. Yolox: Exceeding yolo series in 2021. arXiv 2021, arXiv:2107.08430. [Google Scholar]
- Lin, Y.; Li, J.; Shen, S.; Wang, H.; Zhou, H. GDRS-YOLO: More efficient multiscale features fusion object detector for remote sensing images. IEEE Geosci. Remote Sens. Lett. 2024, 21, 6008505. [Google Scholar] [CrossRef]
- Zhang, H.; Xu, D.; Cheng, D.; Meng, X.; Xu, G.; Liu, W.; Wang, T. An improved lightweight yolo-fastest V2 for engineering vehicle recognition fusing location enhancement and adaptive label assignment. IEEE J. Sel. Top. Appl. Earth Obs. Remote Sens. 2023, 16, 2450–2461. [Google Scholar] [CrossRef]
- Zhao, T.; Feng, R.; Wang, L. SCENE-YOLO: A One-stage Remote Sensing Object Detection Network with Scene Supervision. IEEE Trans. Geosci. Remote Sens. 2025, 63, 5401515. [Google Scholar] [CrossRef]
- Meng, S.; Shi, Z.; Pirasteh, S.; Ullo, S.L.; Peng, M.; Zhou, C.; Gonçalves, W.N.; Zhang, L. TLSTMF-YOLO: Transfer Learning and Feature Fusion Network for Earthquake-Induced Landslide Detection in Remote Sensing Images. IEEE Trans. Geosci. Remote Sens. 2025, 63, 5610712. [Google Scholar] [CrossRef]
- Liu, W.; Anguelov, D.; Erhan, D.; Szegedy, C.; Reed, S.; Fu, C.Y.; Berg, A.C. Ssd: Single shot multibox detector. In Proceedings of the Computer Vision–ECCV 2016: 14th European Conference 2016, Amsterdam, The Netherlands, 11–14 October 2016; Proceedings, Part I 14. Springer International Publishing: Berlin/Heidelberg, Germany, 2016; pp. 21–37. [Google Scholar]
- Wang, J.; Chen, K.; Xu, R.; Liu, Z.; Loy, C.C.; Lin, D. Carafe: Content-aware reassembly of features. In Proceedings of the 2019 IEEE/CVF International Conference on Computer Vision (ICCV), Seoul, Republic of Korea, 27 October–2 November 2019; pp. 3007–3016. [Google Scholar]
- Liu, W.; Lu, H.; Fu, H.; Cao, Z. Learning to upsample by learning to sample. In Proceedings of the 2023 IEEE/CVF International Conference on Computer Vision (ICCV), Paris, France, 1–6 October 2023; pp. 6027–6037. [Google Scholar]
- Lu, H.; Liu, W.; Fu, H.; Cao, Z. FADE: Fusing the assets of decoder and encoder for task-agnostic upsampling. In Proceedings of the European Conference on Computer Vision, Tel Aviv, Israel, 23–27 October 2022; Springer Nature: Cham, Switzerland; pp. 231–247. [Google Scholar]
- Lu, H.; Liu, W.; Ye, Z.; Fu, H.; Liu, Y.; Cao, Z. SAPA: Similarity-aware point affiliation for feature upsampling. Adv. Neural Inf. Process. Syst. 2022, 35, 20889–20901. [Google Scholar]
- Yu, Z.; Huang, H.; Chen, W.; Su, Y.; Liu, Y.; Wang, X. Yolo-facev2: A scale and occlusion aware face detector. Pattern Recognit. 2024, 155, 110714. [Google Scholar] [CrossRef]
- Wang, J.; Xu, C.; Yang, W.; Yu, L. A normalized Gaussian Wasserstein distance for tiny object detection. arXiv 2021, arXiv:2110.13389. [Google Scholar]
- Amri, M.B.; Larabi, M.E.A.; Bakhti, K.; Meroufel, H. Plastic Greenhouses Detection from Alsat-2A Satellite Data Using Mask R-CNN. In Proceedings of the2022 IEEE Mediterranean and Middle-East Geoscience and Remote Sensing Symposium (M2GARSS), Istanbul, Turkey, 7–9 March 2022; pp. 82–85. [Google Scholar]
- Feng, J.; Wang, D.; Yang, F.; Huang, J.; Wang, M.; Tao, M.; Chen, W. PODD: A dual-task detection for greenhouse extraction based on deep learning. Remote Sens. 2022, 14, 5064. [Google Scholar] [CrossRef]
- Ma, A.; Chen, D.; Zhong, Y.; Zheng, Z.; Zhang, L. National-scale greenhouse mapping for high spatial resolution remote sensing imagery using a dense object dual-task deep learning framework: A case study of China. ISPRS J. Photogramm. Remote Sens. 2021, 181, 279–294. [Google Scholar] [CrossRef]
- Lin, J.; Jin, X.; Ren, J.; Liu, J.; Liang, X.; Zhou, Y. Rapid mapping of large-scale greenhouse based on integrated learning algorithm and Google Earth Engine. Remote Sens. 2021, 13, 1245. [Google Scholar] [CrossRef]
- Sun, H.; Wang, L.; Lin, R.; Zhang, Z.; Zhang, B. Mapping plastic greenhouses with two-temporal sentinel-2 images and 1d-cnn deep learning. Remote Sens. 2021, 13, 2820. [Google Scholar] [CrossRef]
- Liu, X.; Xiao, B.; Jiao, J.; Hong, R.; Li, Y.; Liu, P. Remote sensing detection and mapping of plastic greenhouses based on YOLOX+: A case study in Weifang, China. Comput. Electron. Agric. 2024, 218, 108702. [Google Scholar] [CrossRef]
- Liu, J.; Huang, H.; Sun, H.; Wu, Z.; Luo, R. LRAD-Net: An improved lightweight network for building extraction from remote sensing images. IEEE J. Sel. Top. Appl. Earth Obs. Remote Sens. 2022, 16, 675–687. [Google Scholar] [CrossRef]
- Chen, X.; Xiao, P.; Zhang, X.; Muhtar, D.; Wang, L. A cascaded network with coupled high-low frequency features for building extraction. IEEE J. Sel. Top. Appl. Earth Obs. Remote Sens. 2024, 17, 10390–10406. [Google Scholar] [CrossRef]
- Wang, Q.; Zhang, M.; Ren, J.; Li, Q. Exploring Context Alignment and Structure Perception for Building Change Detection. IEEE Trans. Geosci. Remote Sens. 2025, 63, 5609910. [Google Scholar] [CrossRef]
- Zhang, H.; Zhang, Y.; Wang, D.; Ma, G. Damaged Building Object Detection From Bi-temporal Remote Sensing Imagery: A Cross-task Integration Network and Five Datasets. IEEE Trans. Geosci. Remote Sens. 2024, 62, 5648827. [Google Scholar] [CrossRef]
- Gao, W.; Sun, Y.; Han, X.; Zhang, Y.; Zhang, L.; Hu, Y. AMIO-Net: An attention-based multiscale input–output network for building change detection in high-resolution remote sensing images. IEEE J. Sel. Top. Appl. Earth Obs. Remote Sens. 2023, 16, 2079–2093. [Google Scholar] [CrossRef]
- Liu, L.; Bai, Y.; Li, Y. Locality-aware rotated ship detection in high-resolution remote sensing imagery based on multiscale convolutional network. IEEE Geosci. Remote Sens. Lett. 2021, 19, 3502805. [Google Scholar] [CrossRef]
- Luo, M.; Ji, S.; Wei, S. A diverse large-scale building dataset and a novel plug-and-play domain generalization method for building extraction. IEEE J. Sel. Top. Appl. Earth Obs. Remote Sens. 2023, 16, 4122–4138. [Google Scholar] [CrossRef]
- Long, Y.; Gong, Y.; Xiao, Z.; Liu, Q. Accurate object localization in remote sensing images based on convolutional neural networks. IEEE Trans. Geosci. Remote Sens. 2017, 55, 2486–2498. [Google Scholar] [CrossRef]
- Zhang, Y.; Li, H.; Wang, R.; Zhang, M.; Hu, X. Constrained-SIoU: A metric for horizontal candidates in multi-oriented object detection. IEEE J. Sel. Top. Appl. Earth Obs. Remote Sens. 2021, 15, 956–967. [Google Scholar] [CrossRef]
- Zhang, S.; Li, C.; Jia, Z.; Liu, L.; Zhang, Z.; Wang, L. Diag-IoU loss for object detection. IEEE Trans. Circuits Syst. Video Technol. 2023, 33, 7671–7683. [Google Scholar] [CrossRef]
- Ni, X.; Ma, Z.; Liu, J.; Shi, B.; Liu, H. Attention network for rail surface defect detection via consistency of intersection-over-union (IoU)-guided center-point estimation. IEEE Trans. Ind. Inform. 2021, 18, 1694–1705. [Google Scholar] [CrossRef]
- Liang, B.; Su, J.; Feng, K.; Liu, Y.; Zhang, D.; Hou, W. SCDFMixer: Spatial–channel dual-frequency mixer based on satellite optical sensors for remote sensing multiobject detection. IEEE Sens. J. 2024, 24, 5383–5398. [Google Scholar] [CrossRef]
- Sun, H.; Yao, G.; Zhu, S.; Zhang, L.; Xu, H.; Kong, J. SOD-YOLOv10: Small Object Detection in Remote Sensing Images Based on YOLOv10. IEEE Geosci. Remote Sens. Lett. 2025, 22, 8000705. [Google Scholar] [CrossRef]
- Zhao, B.; Qin, Z.; Wu, Y.; Song, Y.; Yu, H.; Gao, L. A Fast Target Detection Model for Remote Sensing Images Leveraging Roofline Analysis on Edge Computing Devices. IEEE J. Sel. Top. Appl. Earth Obs. Remote Sens. 2024, 17, 19343–19360. [Google Scholar] [CrossRef]
- Yang, X.; Zhang, S.; Duan, S.; Yang, W. An effective and lightweight hybrid network for object detection in remote sensing images. IEEE Trans. Geosci. Remote Sens. 2023, 62, 5600711. [Google Scholar] [CrossRef]
- Yin, H.; Wang, H.; Zhu, Z. Progressive Dynamic Queries Reformation Based DETR for Remote Sensing Object Detection. IEEE Geosci. Remote Sens. Lett. 2025, 22, 6003705. [Google Scholar] [CrossRef]

| Data Source | Data Resolution | Actual Resolution | Number of Images | Image Size | Number of Buildings | |
|---|---|---|---|---|---|---|
| Building | Google map | 1 m | >1 m | 458 | 1024 × 1024 | About 68,130 |
| Greenhouse | Google map | 1 m | >1 m | 170 | 1024 × 1024 | About 32,080 |
| Method | Aircraft | Oil Tank | Playground | Overpass | mAP |
|---|---|---|---|---|---|
| Faster R-CNN [56] | 81.3 | 96.7 | 95.4 | 85.4 | 89.7 |
| YOLOv10 [57] | 95.8 | 96.9 | 98.2 | 75.0 | 91.5 |
| CF2PN [56] | 89.7 | 96.5 | 100 | 85.0 | 92.8 |
| Casade R-CNN [56] | 92.2 | 97.2 | 99.7 | 87.4 | 94.1 |
| FTD-RLE [58] | 92.0 | 98.3 | 99.9 | 90.5 | 95.2 |
| CANet [56] | 91.7 | 97.0 | 97.9 | 94.1 | 95.2 |
| BAC-FSAR [59] | - | - | - | - | 95.6 |
| YOLOv8 [56] | 96.8 | 98.1 | 99.3 | 88.6 | 95.7 |
| SOD-YOLOv10 [57] | 97.0 | 98.6 | 99.0 | 89.0 | 95.9 |
| SCDFMixer [56] | 97.8 | 98.1 | 99.5 | 89.4 | 96.2 |
| Relation DETR [60] | - | - | - | - | 97.4 |
| EW-YOLOv8 | 97.9 | 99.5 | 99.5 | 97.6 | 98.6 |
| AP (Buildings) | AP (Greenhouses) | mAP | mAP@50-95 | |
|---|---|---|---|---|
| YOLOv8 | 54.2% | 81.6% | 67.9% | 40.1% |
| YOLOv9 | 44.3% | 77.0% | 60.6% | 33.1% |
| YOLOv10 | 40.7% | 69.8% | 55.2% | 29.9% |
| YOLOv11 | 49.3% | 82.3% | 65.8% | 37.7% |
| YOLOv12 | 53.0% | 83.3% | 68.2% | 40.3% |
| YOLOv8 + NWD | 54.2% | 82.5% | 68.4% | 40.1% |
| YOLOv8 + NWD + DySample | 54.6% | 82.7% | 68.7% | 41.1% |
| EW-YOLOv8 | 54.6% | 82.9% | 68.8% | 41.2% |
| Parameters | Gradients | GFLOPs | |
|---|---|---|---|
| YOLOv8 | 2,690,598 | 2,690,582 | 6.9 |
| YOLOv9 | 2,005,798 | 2,005,782 | 7.8 |
| YOLOv10 | 2,707,820 | 2,707,804 | 8.4 |
| YOLOv11 | 2,590,230 | 2,590,214 | 6.4 |
| YOLOv12 | 2,538,486 | 2,538,470 | 6.0 |
| EW-YOLOv8 | 914,870 | 914,854 | 9.4 |
Disclaimer/Publisher’s Note: The statements, opinions and data contained in all publications are solely those of the individual author(s) and contributor(s) and not of MDPI and/or the editor(s). MDPI and/or the editor(s) disclaim responsibility for any injury to people or property resulting from any ideas, methods, instructions or products referred to in the content. |
© 2025 by the authors. Licensee MDPI, Basel, Switzerland. This article is an open access article distributed under the terms and conditions of the Creative Commons Attribution (CC BY) license (https://creativecommons.org/licenses/by/4.0/).
Share and Cite
Wang, B.; Liu, Z.; Xi, J.; Gao, S.; Cong, M.; Shang, H. Detection of Greenhouse and Typical Rural Buildings with Efficient Weighted YOLOv8 in Hebei Province, China. Remote Sens. 2025, 17, 1883. https://doi.org/10.3390/rs17111883
Wang B, Liu Z, Xi J, Gao S, Cong M, Shang H. Detection of Greenhouse and Typical Rural Buildings with Efficient Weighted YOLOv8 in Hebei Province, China. Remote Sensing. 2025; 17(11):1883. https://doi.org/10.3390/rs17111883
Chicago/Turabian StyleWang, Bingkun, Zhiyuan Liu, Jiangbo Xi, Siyan Gao, Ming Cong, and Haixing Shang. 2025. "Detection of Greenhouse and Typical Rural Buildings with Efficient Weighted YOLOv8 in Hebei Province, China" Remote Sensing 17, no. 11: 1883. https://doi.org/10.3390/rs17111883
APA StyleWang, B., Liu, Z., Xi, J., Gao, S., Cong, M., & Shang, H. (2025). Detection of Greenhouse and Typical Rural Buildings with Efficient Weighted YOLOv8 in Hebei Province, China. Remote Sensing, 17(11), 1883. https://doi.org/10.3390/rs17111883