
Lightweight Multilevel Feature-Fusion Network for Built-Up Area Mapping from Gaofen-2 Satellite Images

Abstract
1. Introduction
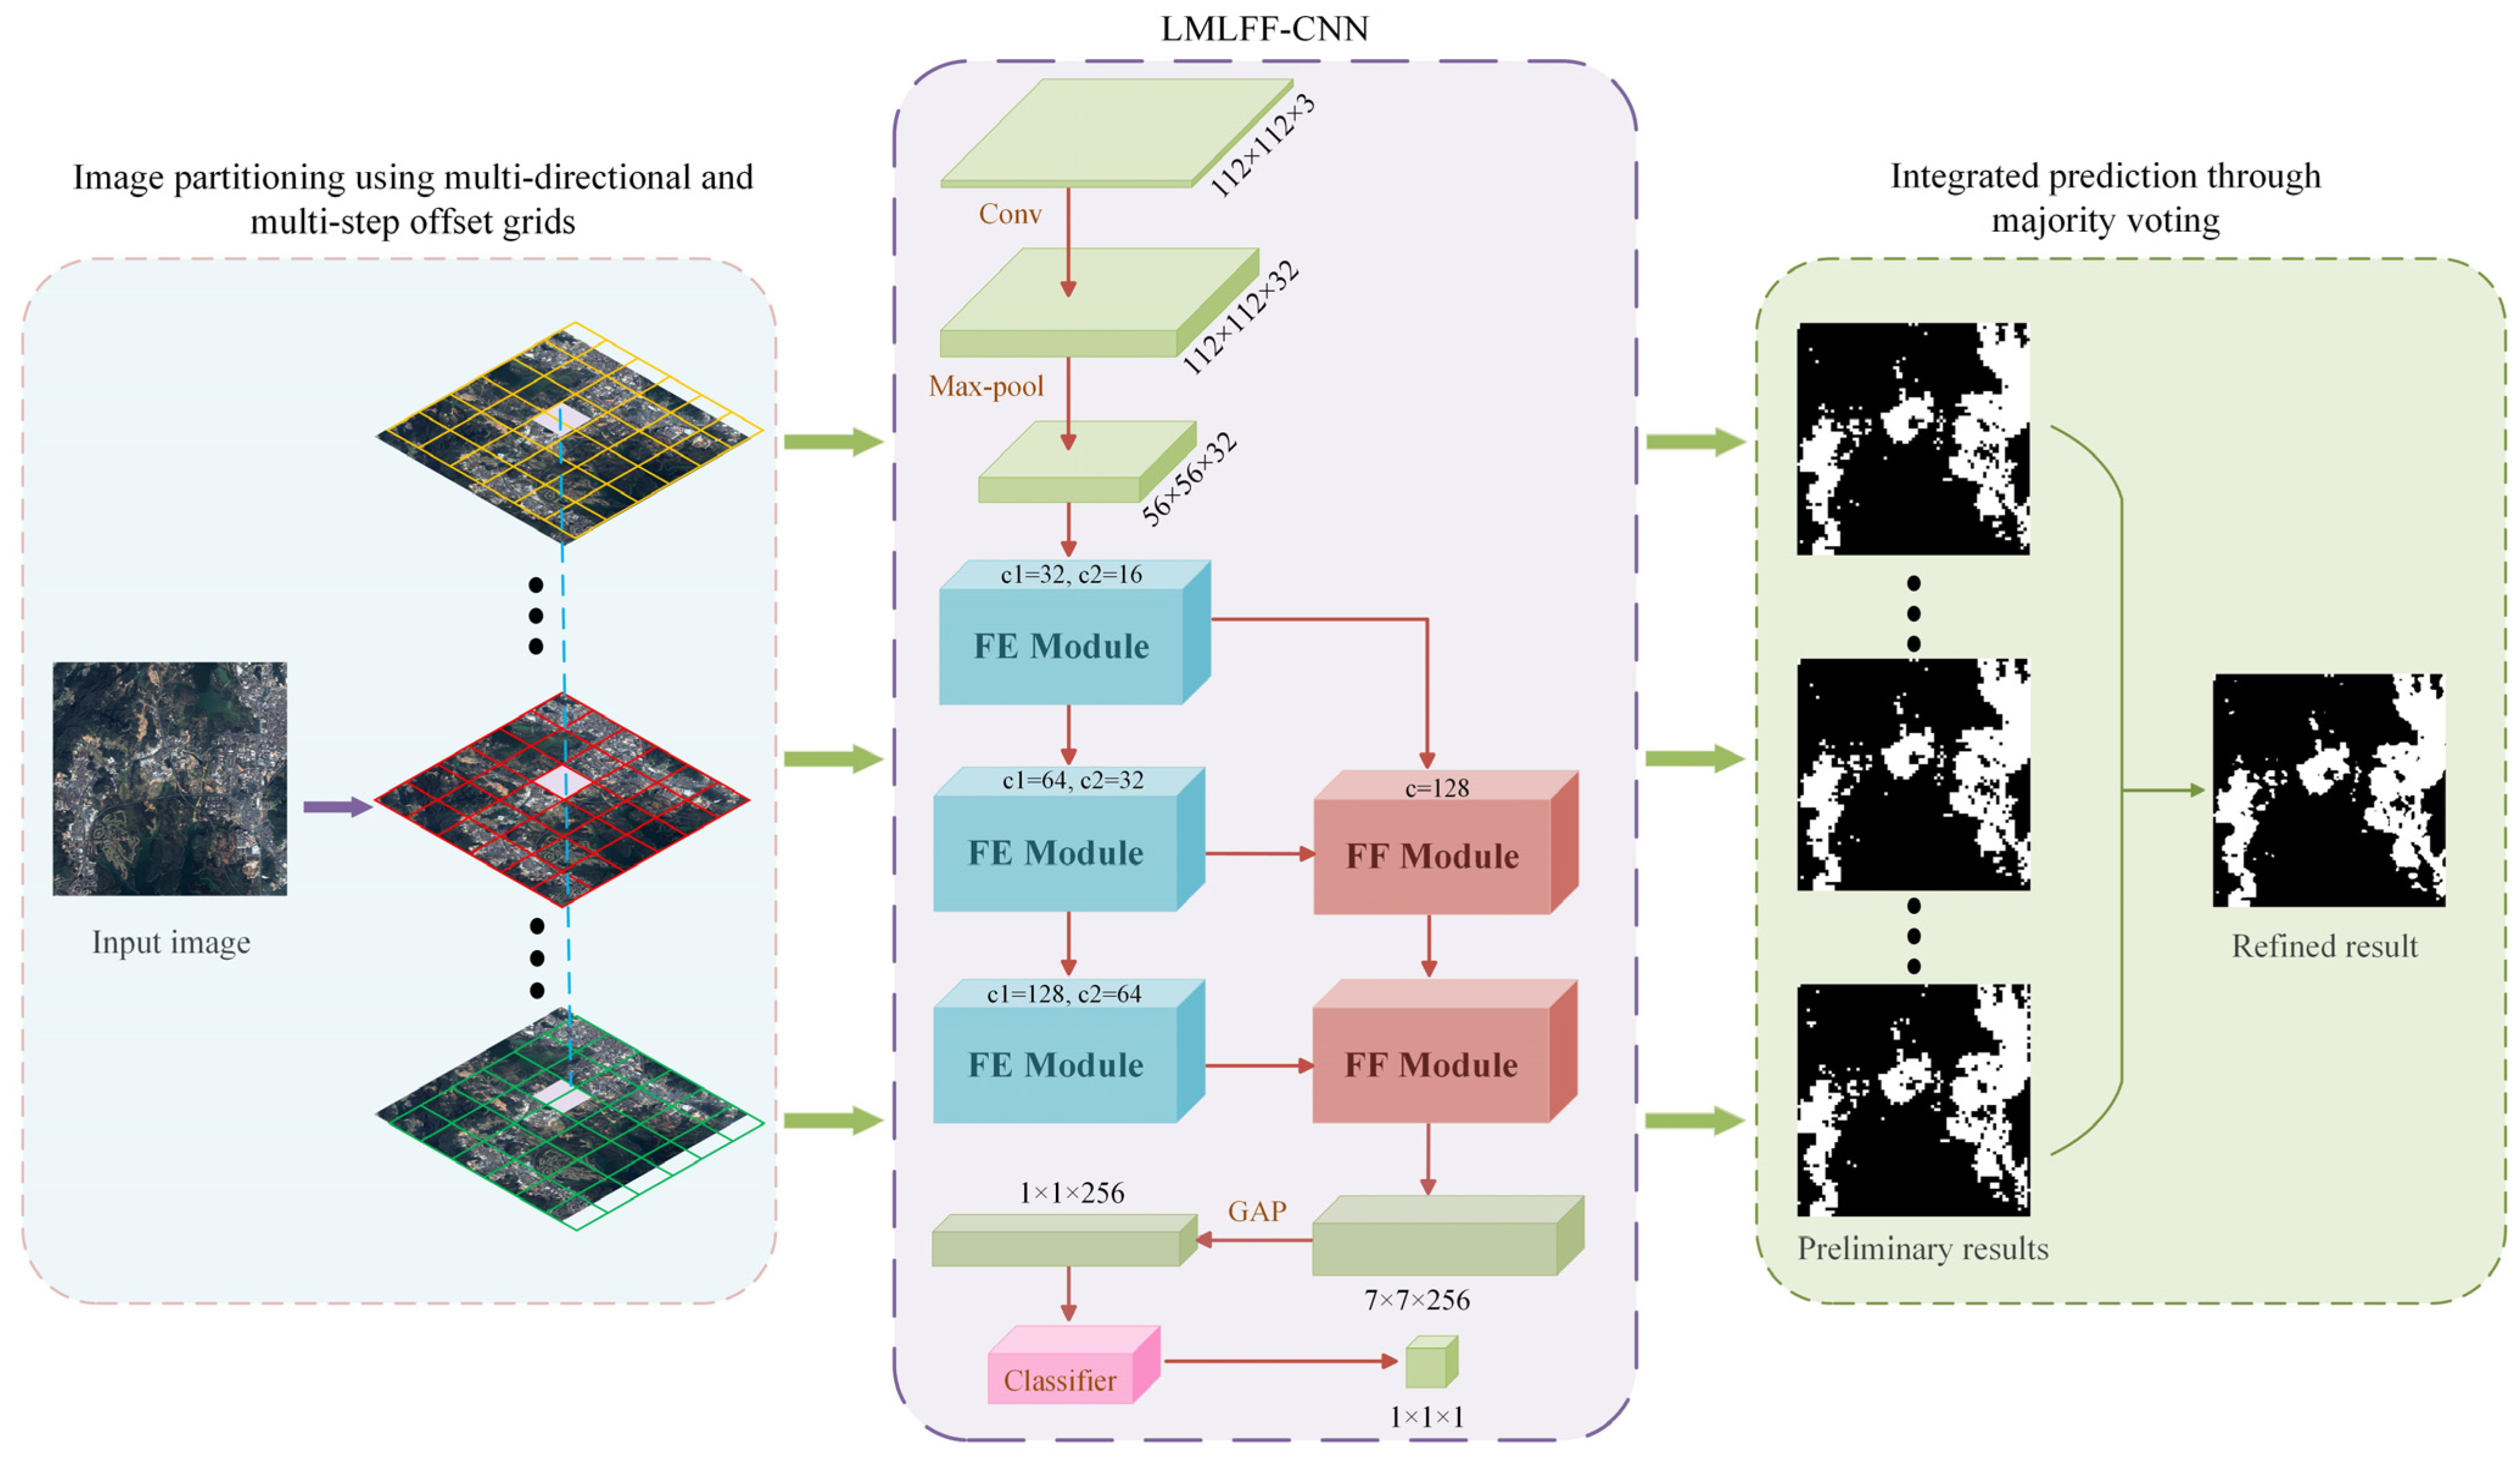
2. Methods
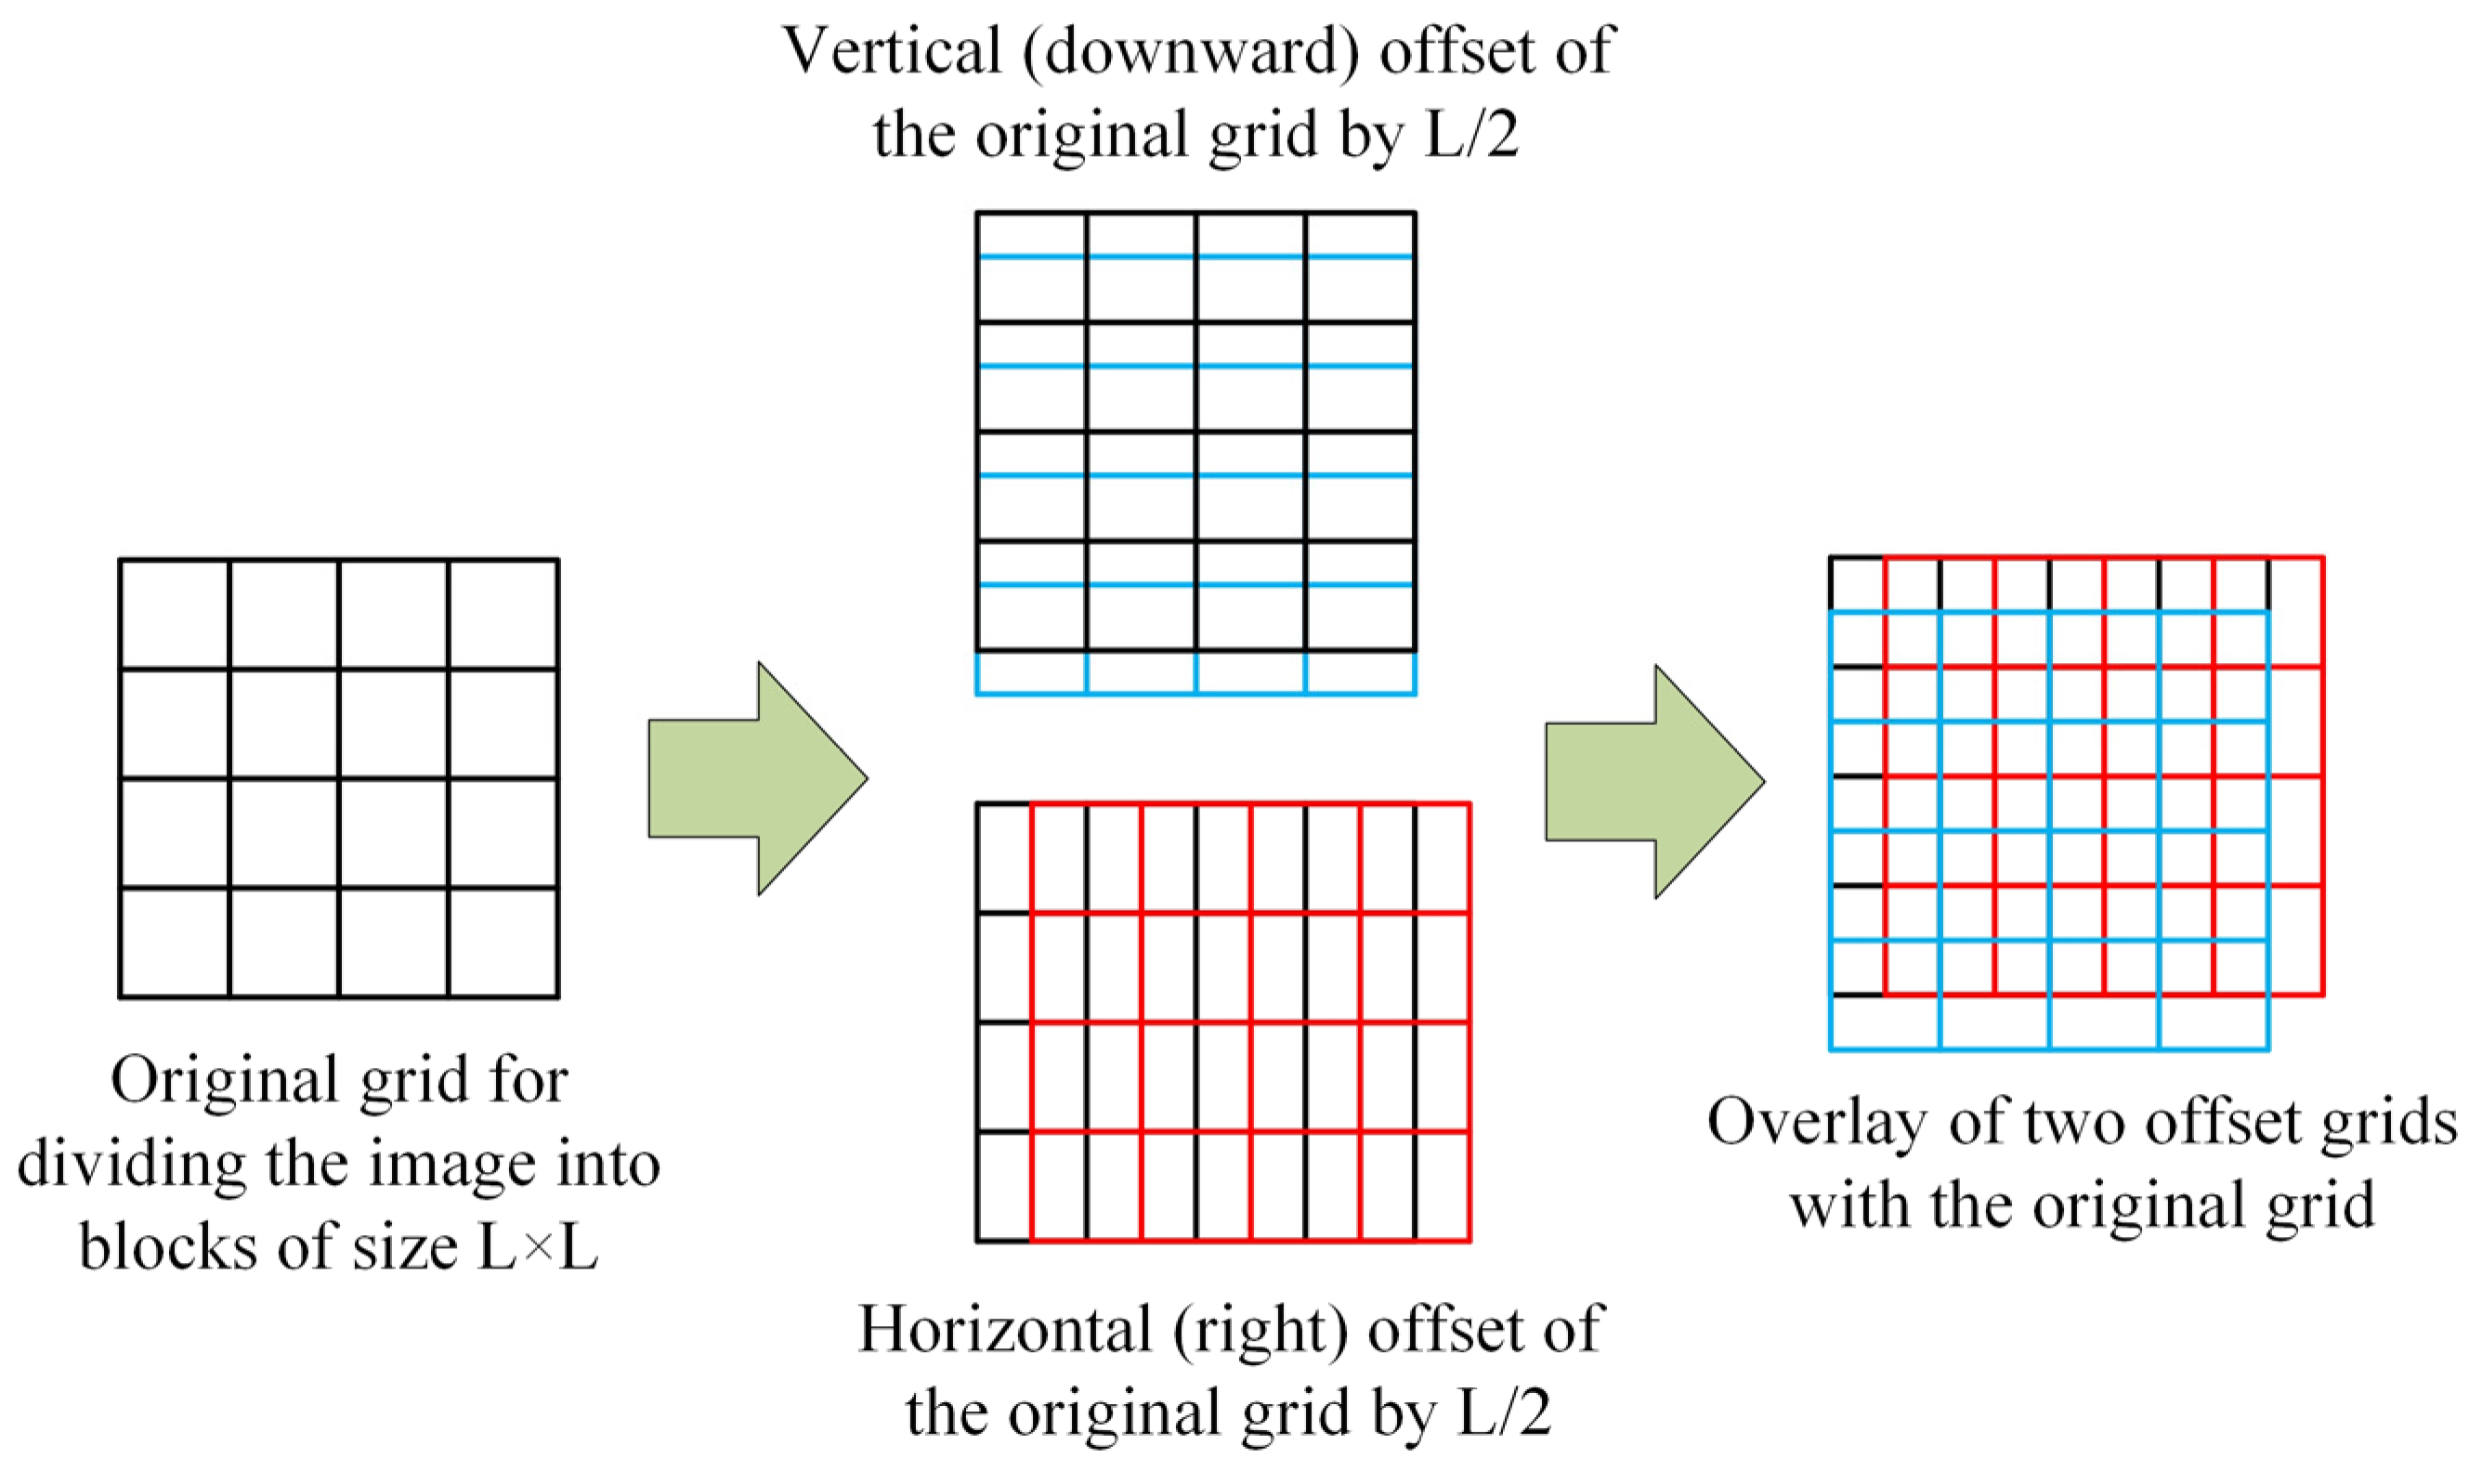
2.1. Image Partitioning Using Multi-Directional and Multi-Step Offset Grids
2.2. LMLFF-CNN Model
- (1)
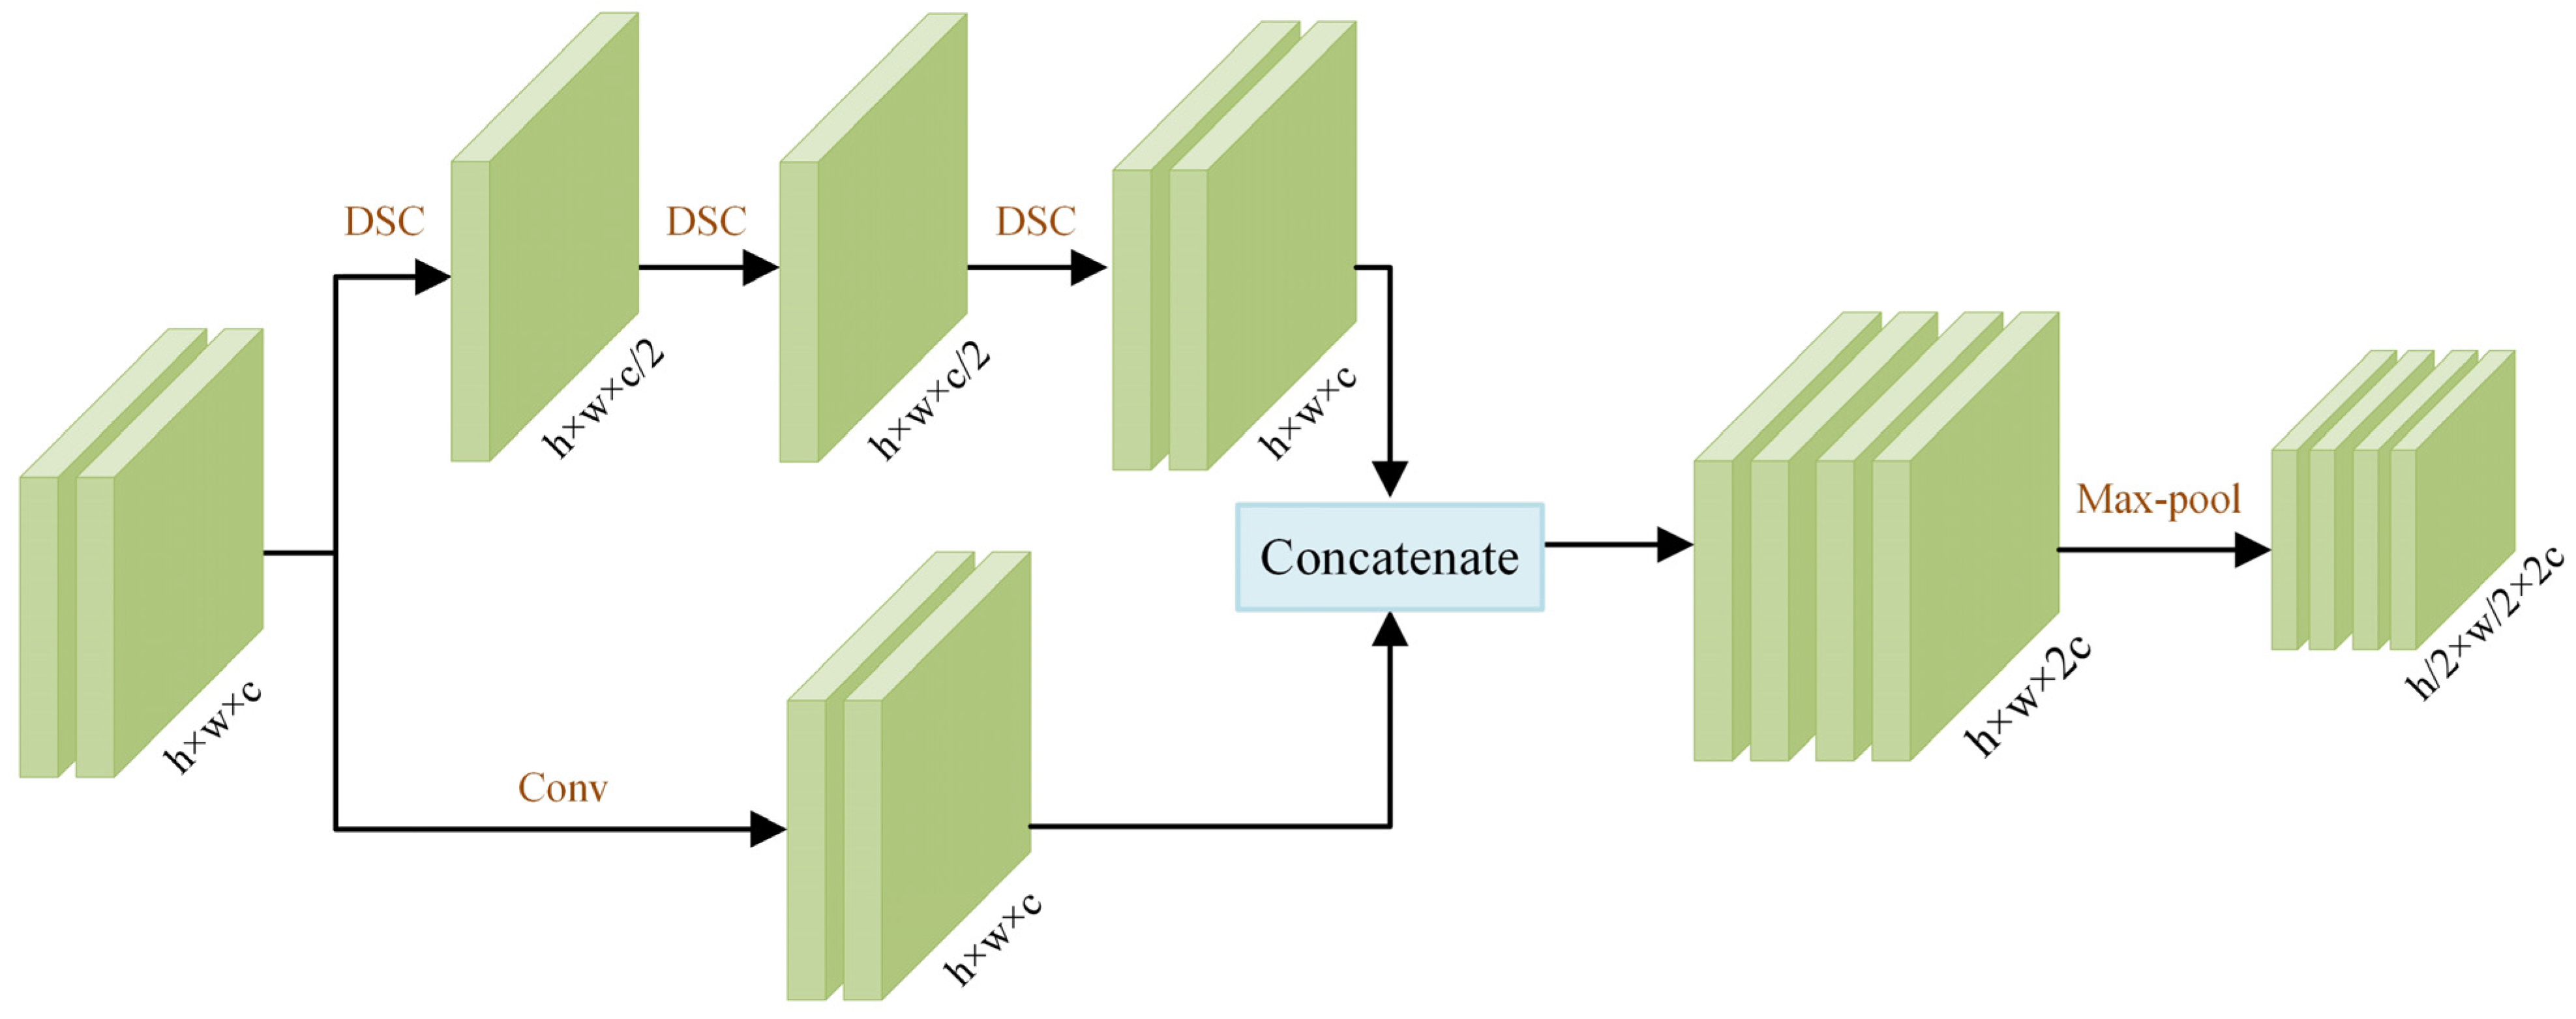
- Feature Extraction Module
- (2)
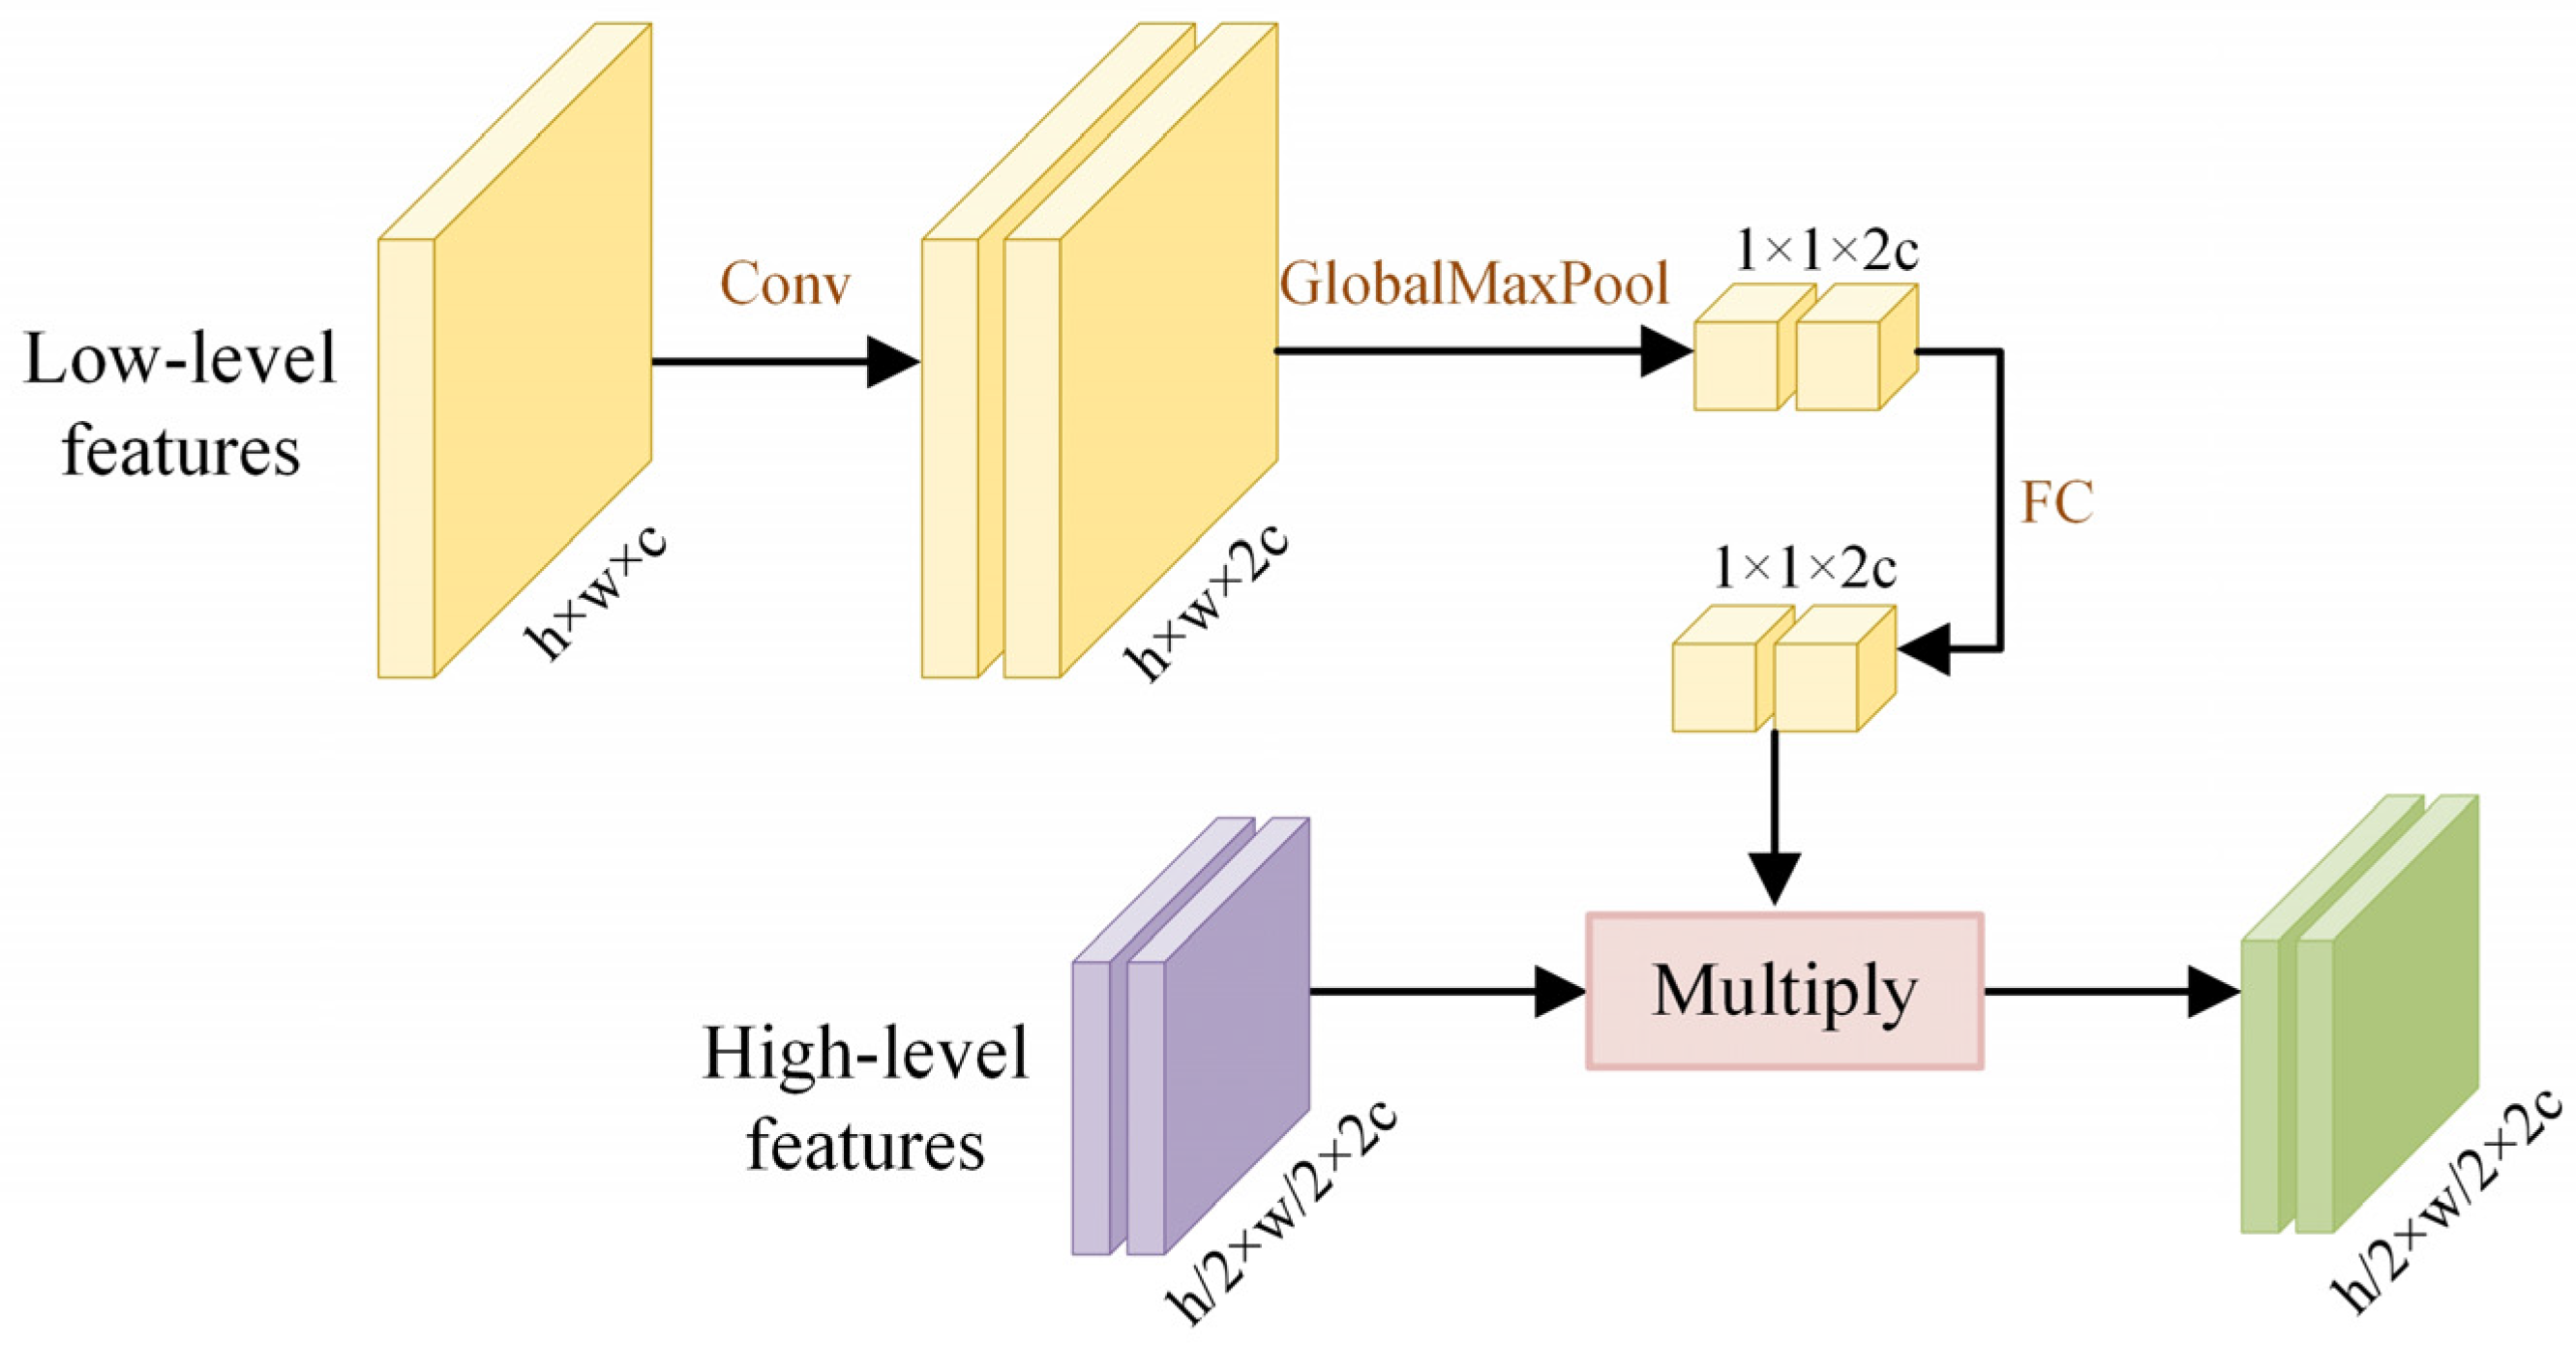
- Multilevel Feature-Fusion Module
2.3. Integrated Prediction through Majority Voting
3. Results
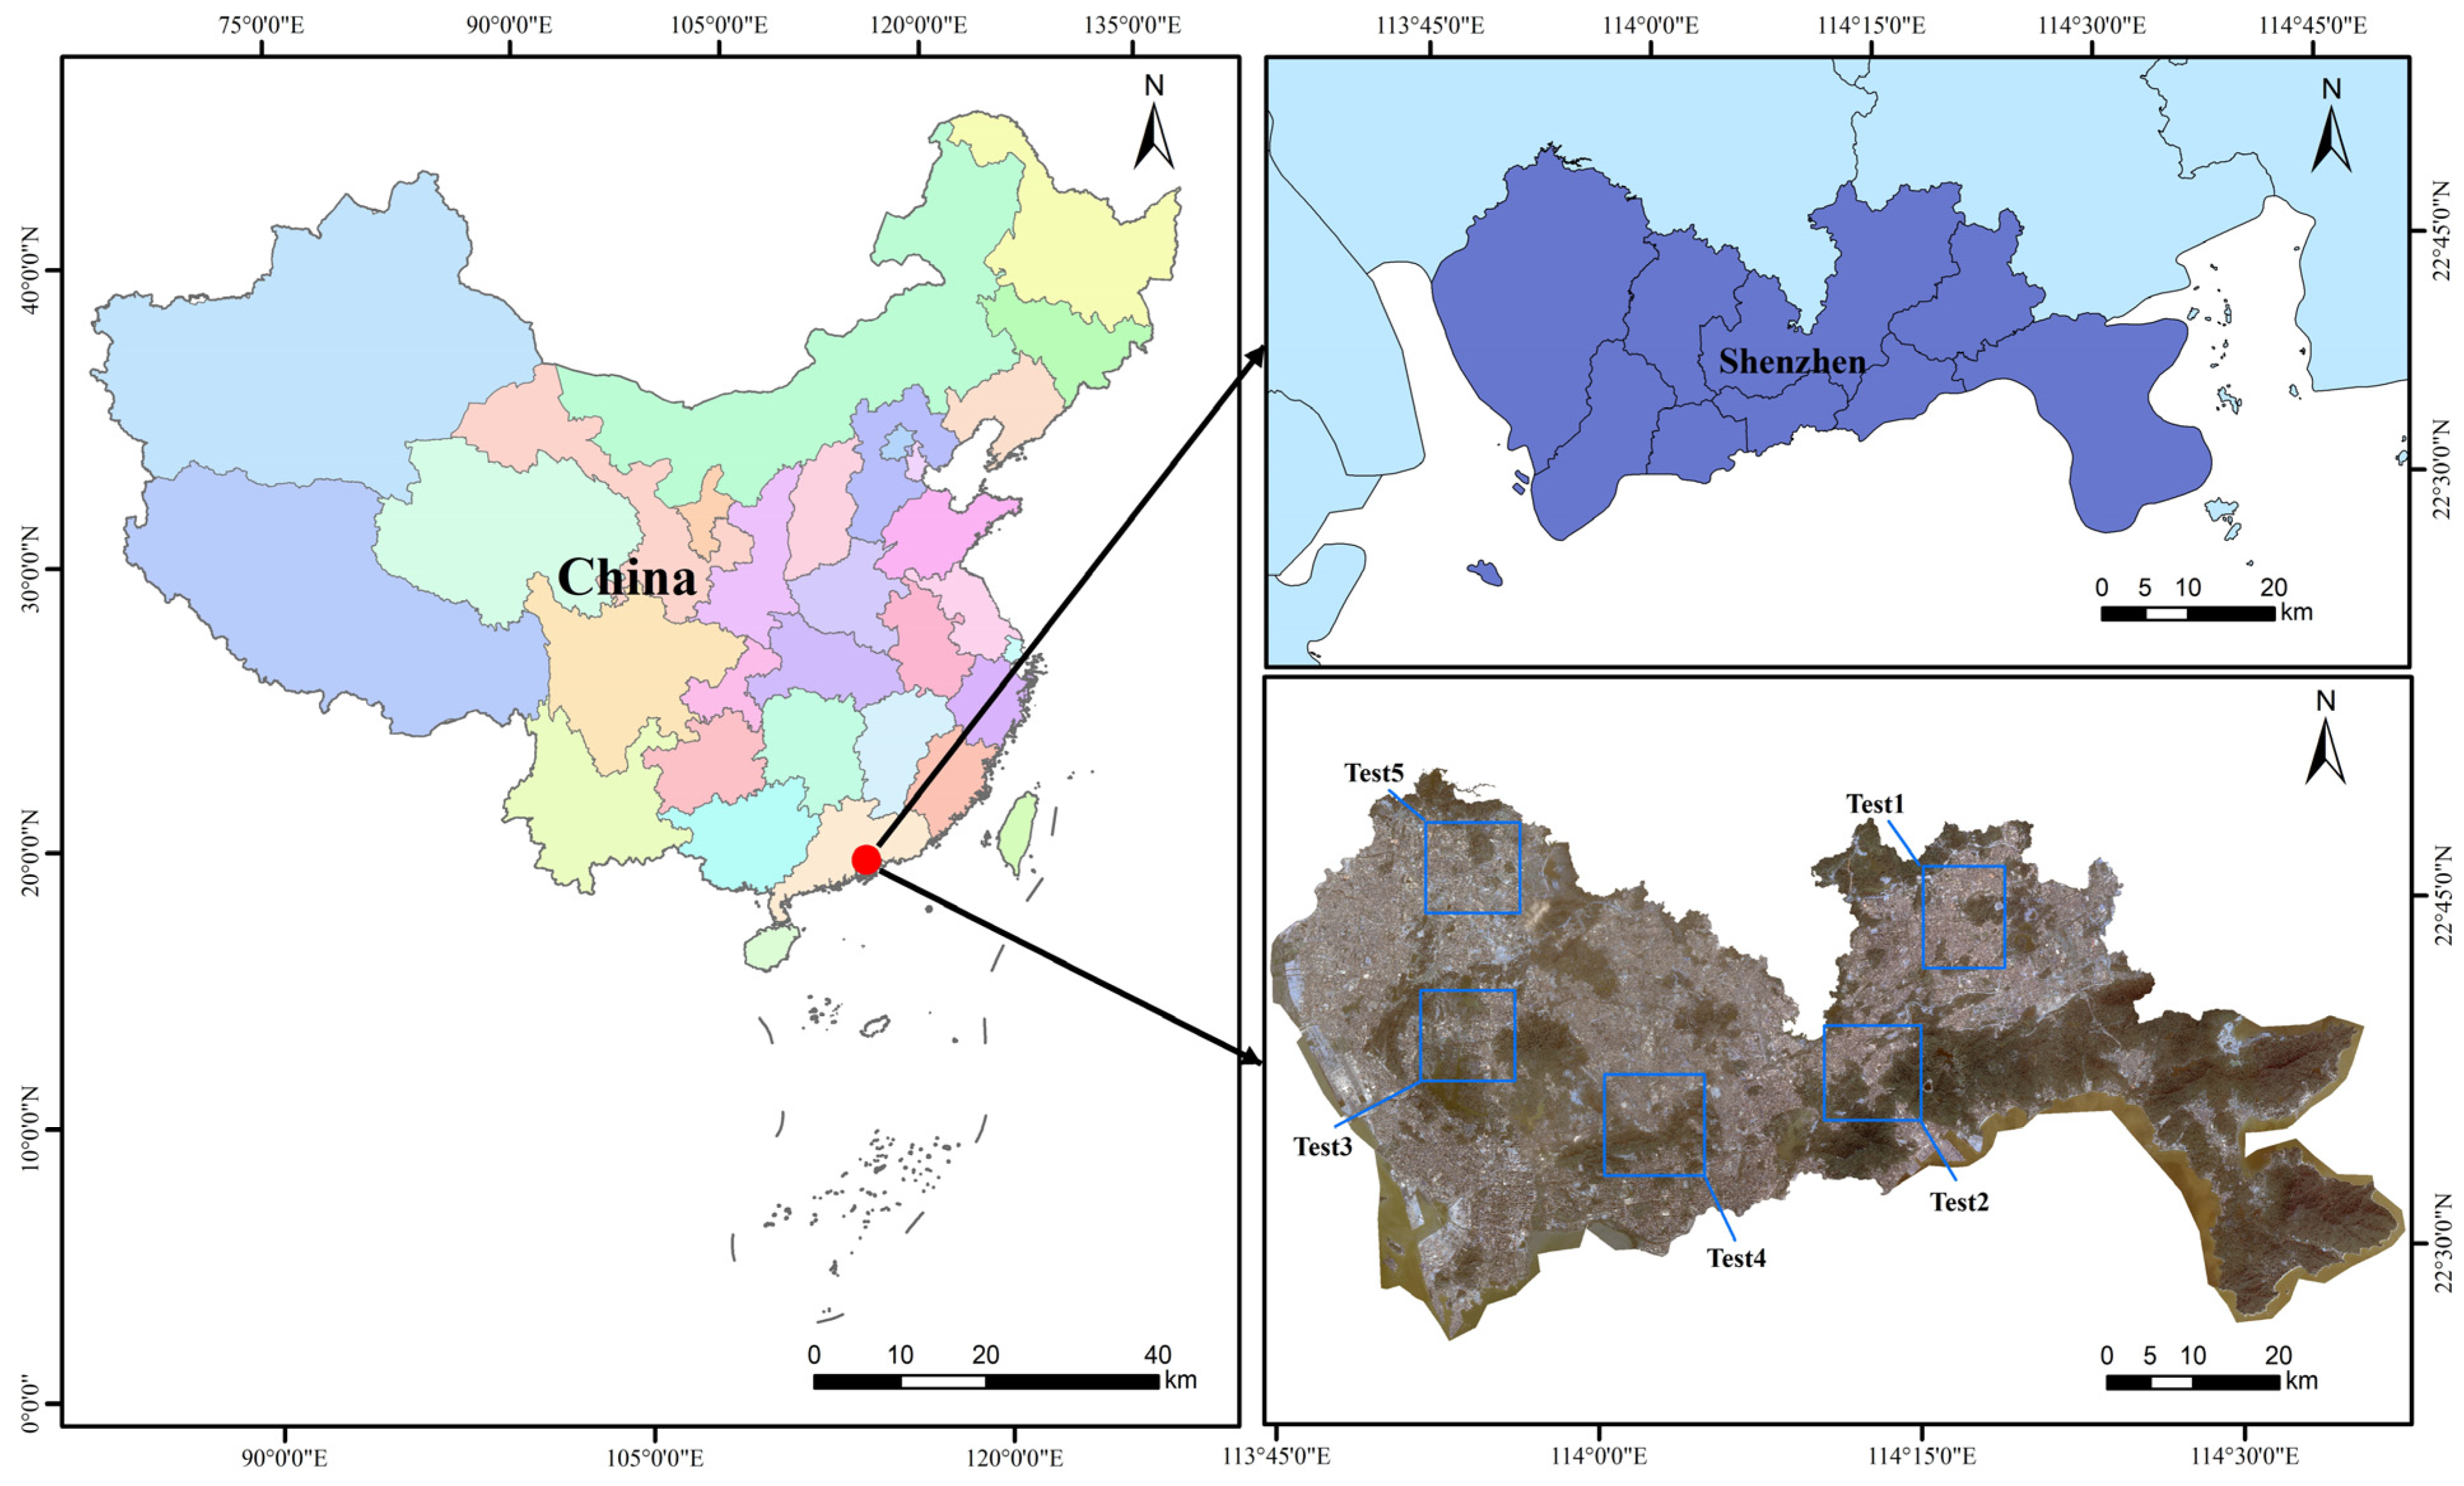
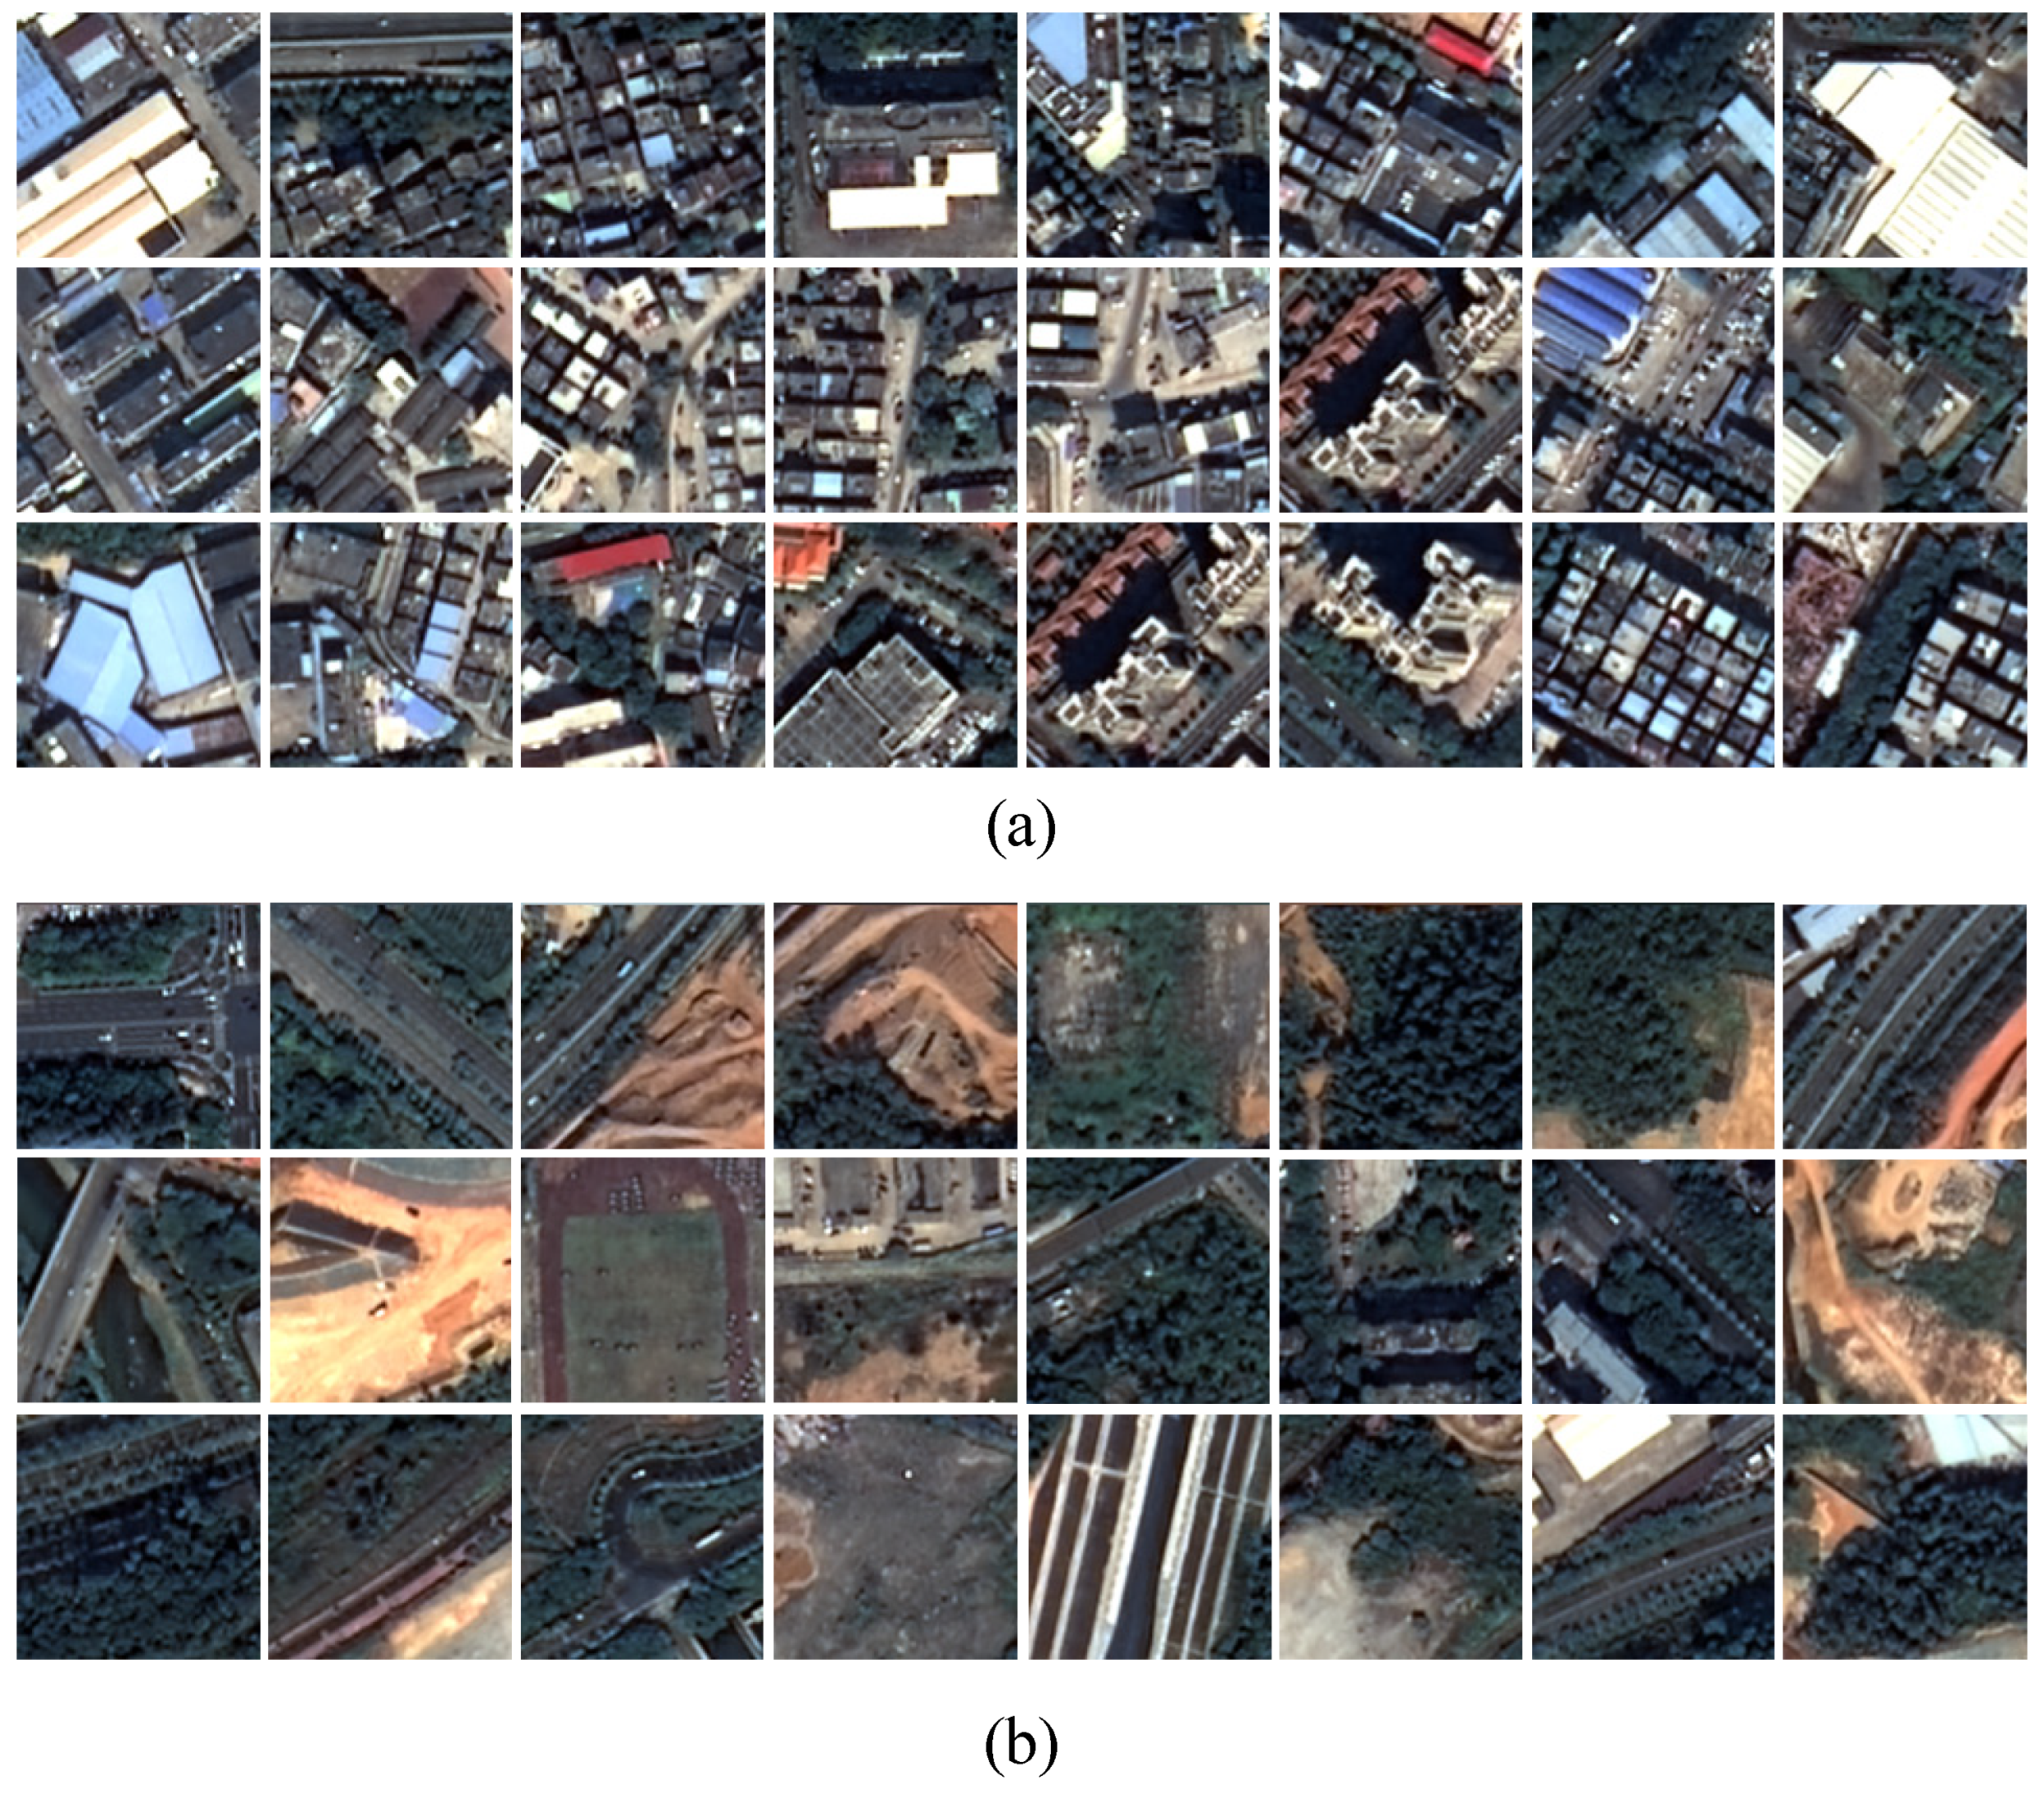
3.1. Study Area and Dataset
3.2. Experimental Setup
3.3. Evaluation Metrics
3.4. Experimental Results and Analysis
3.4.1. Performance of the Proposed LMLFF-CNN
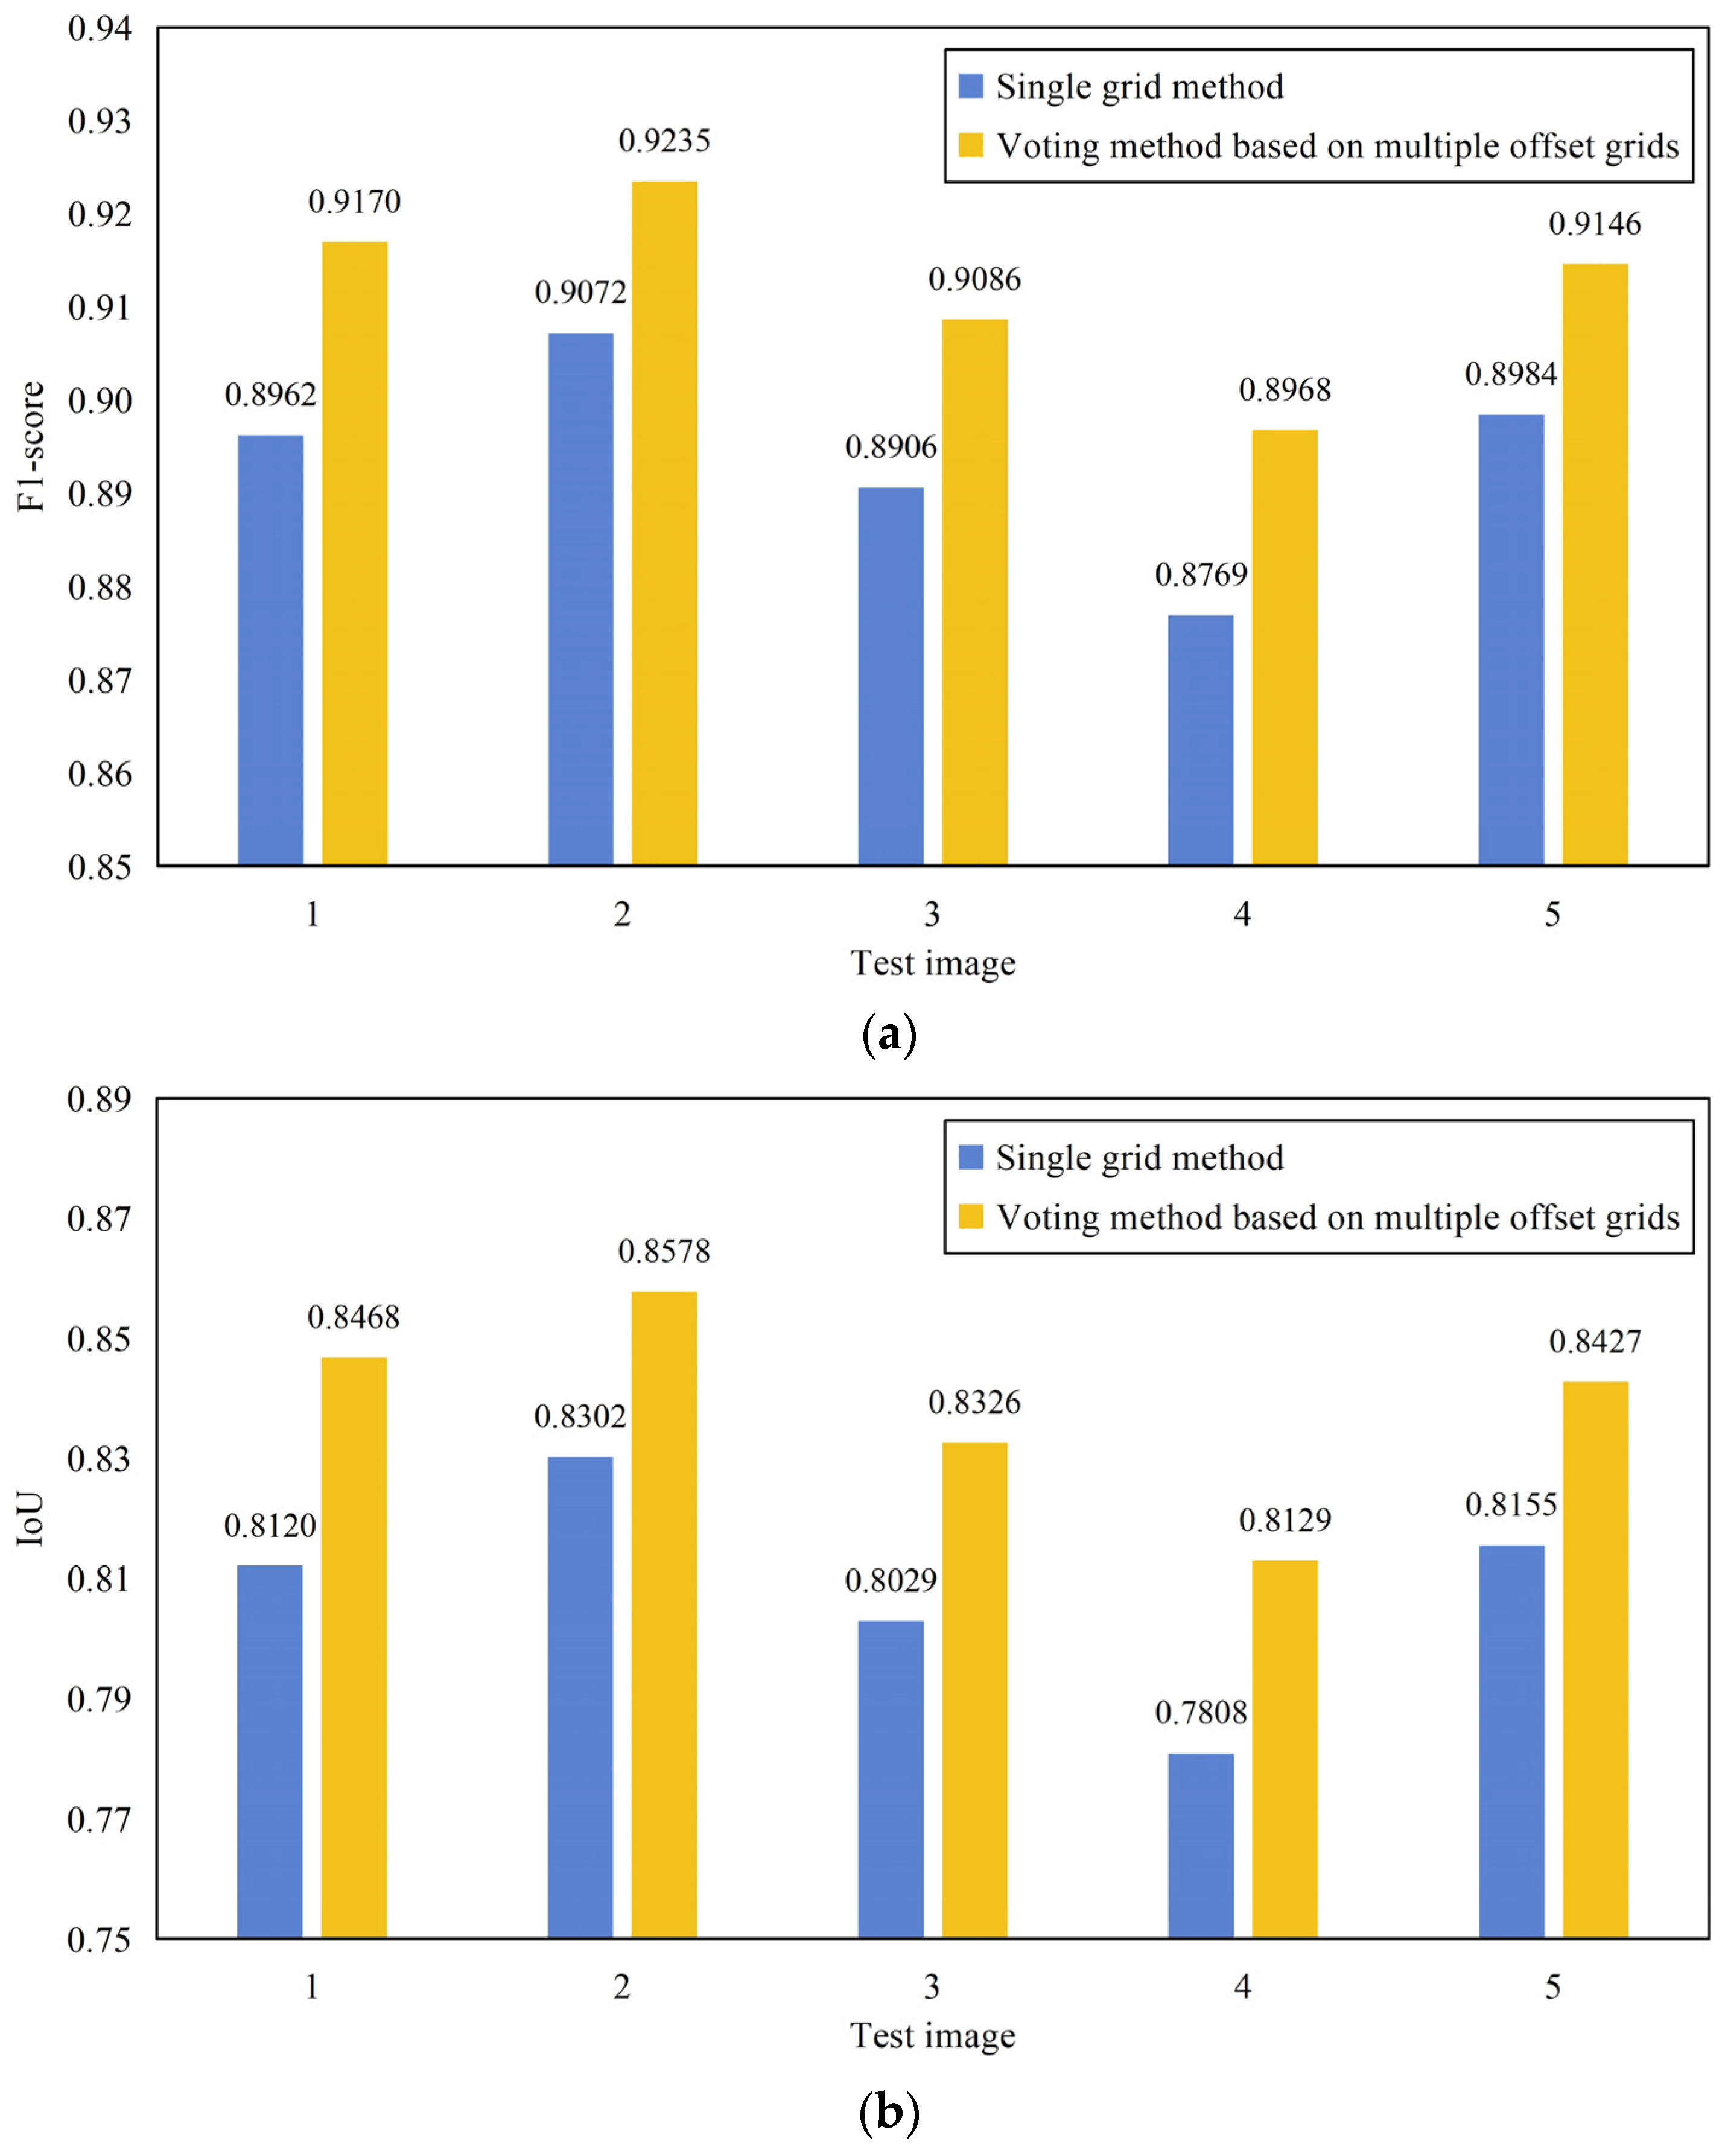
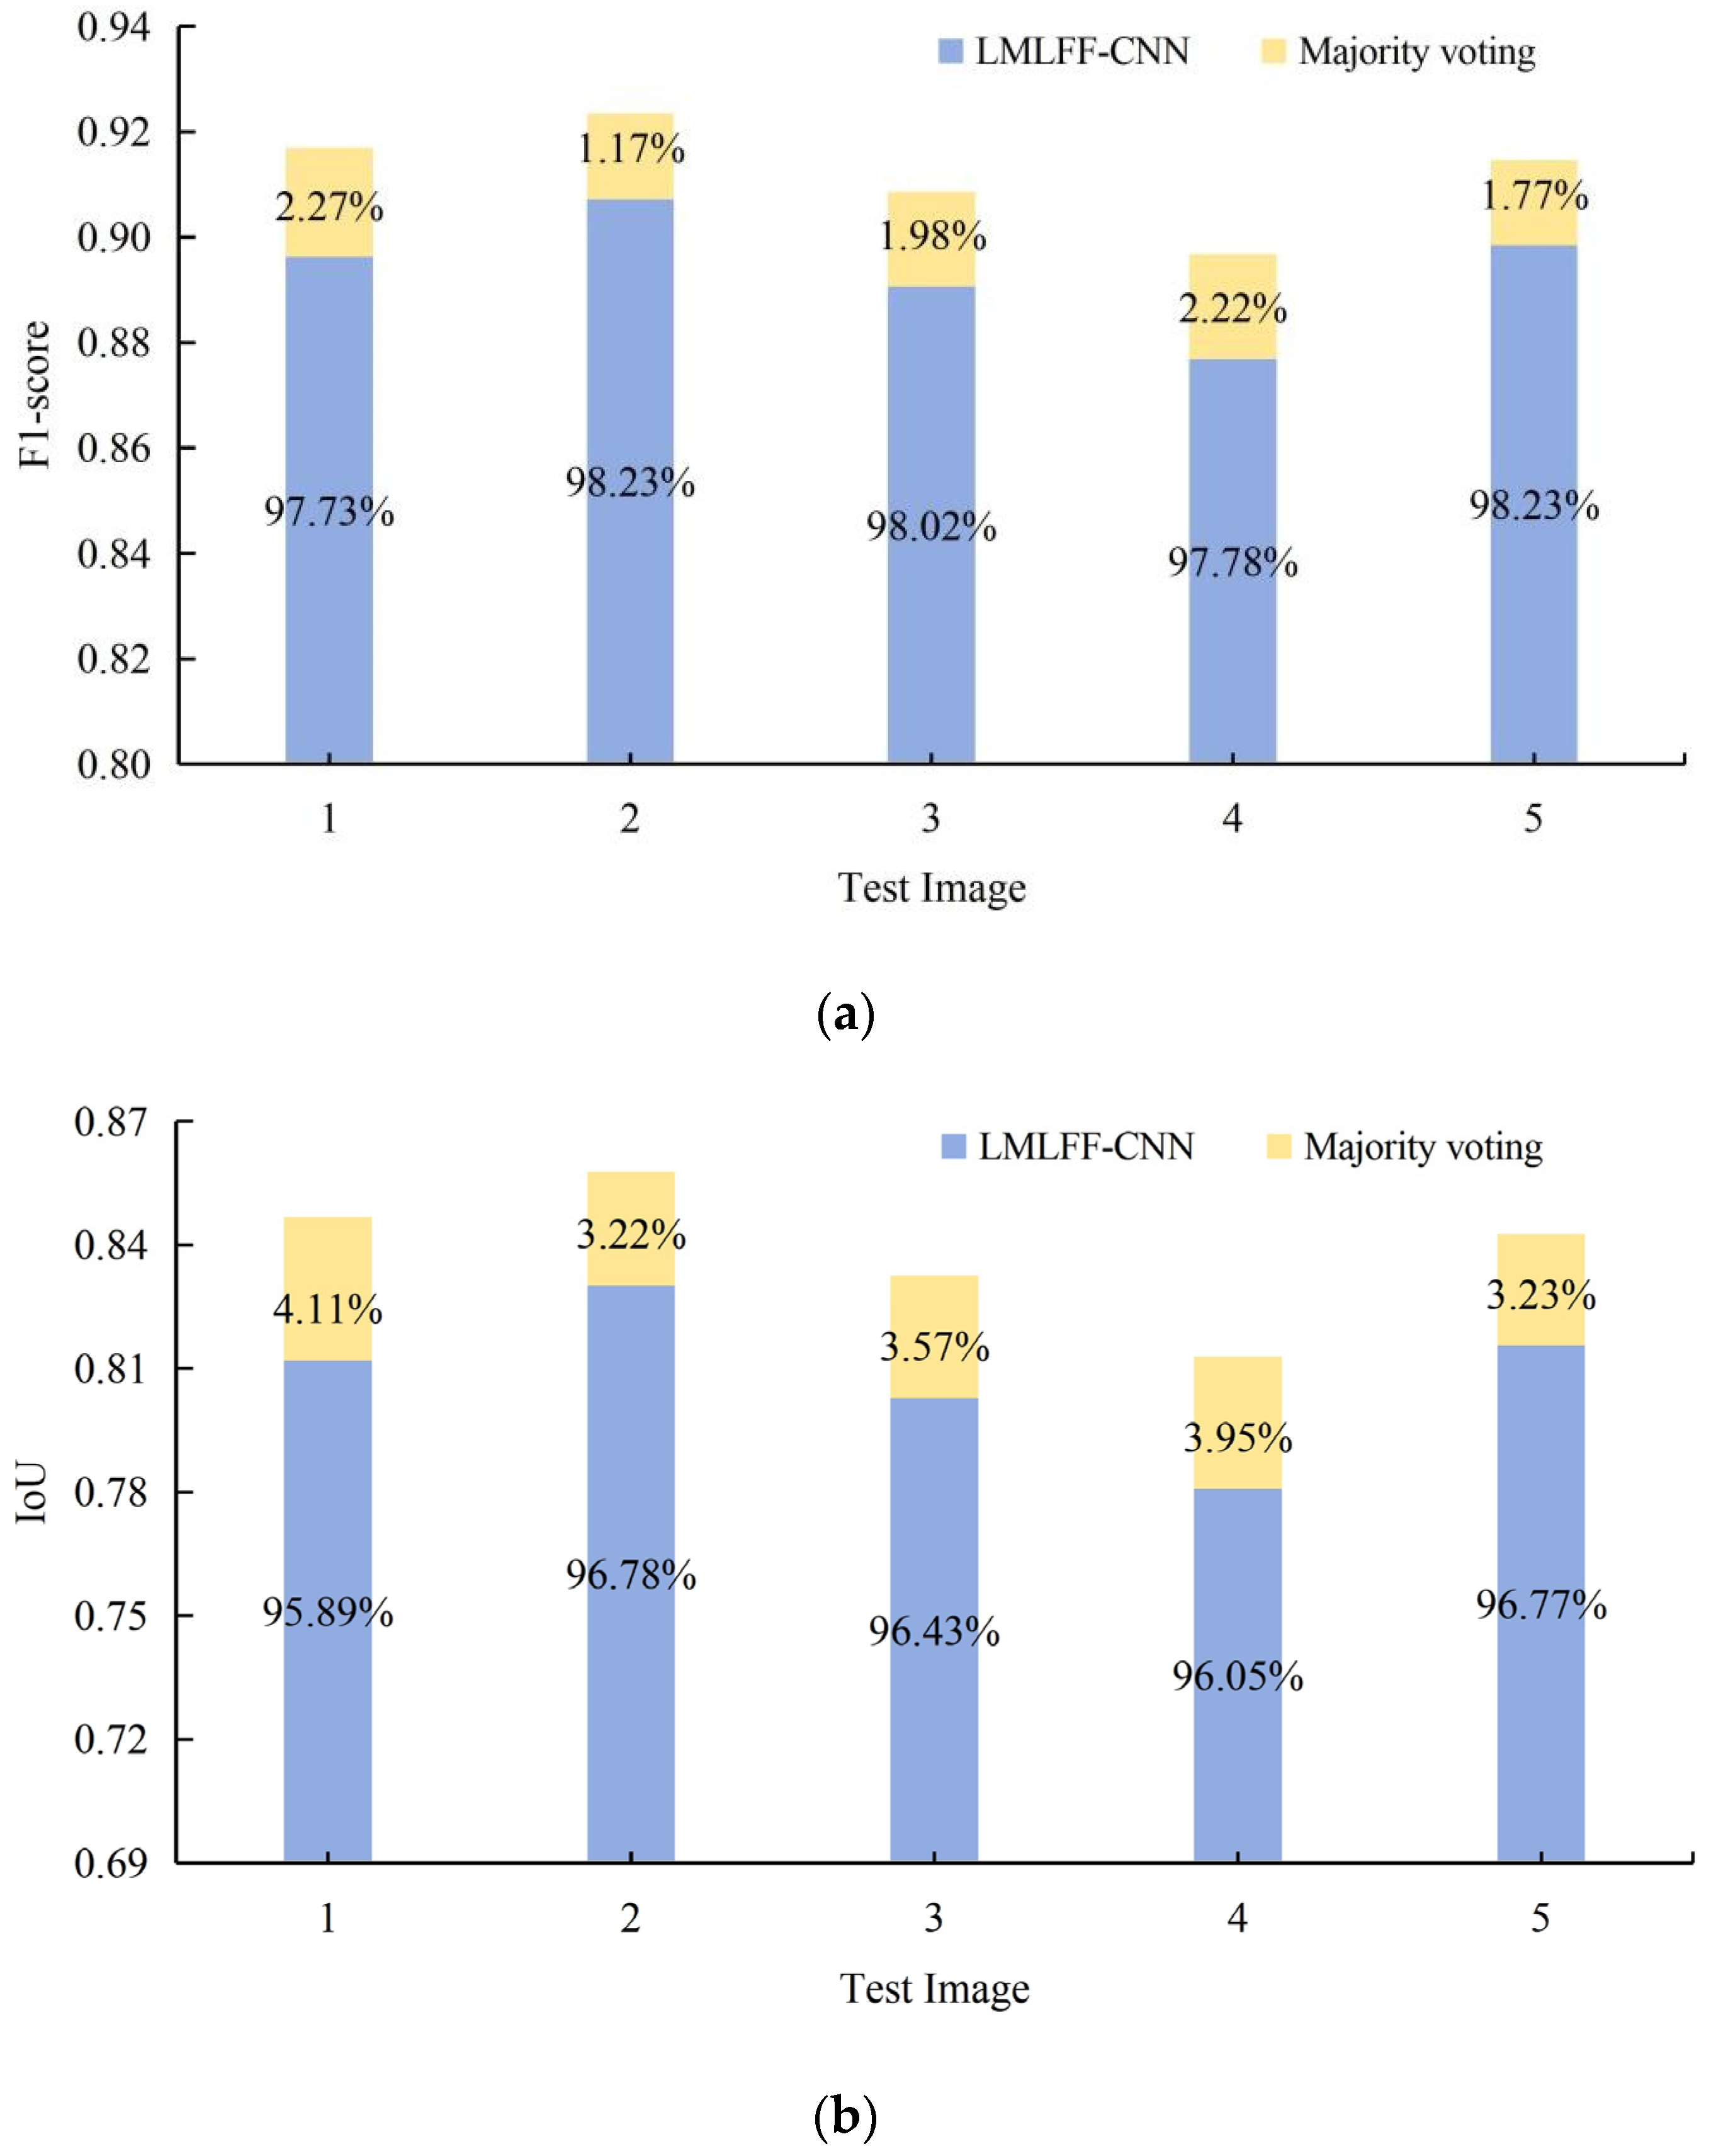
3.4.2. Integrated Prediction through Majority Voting
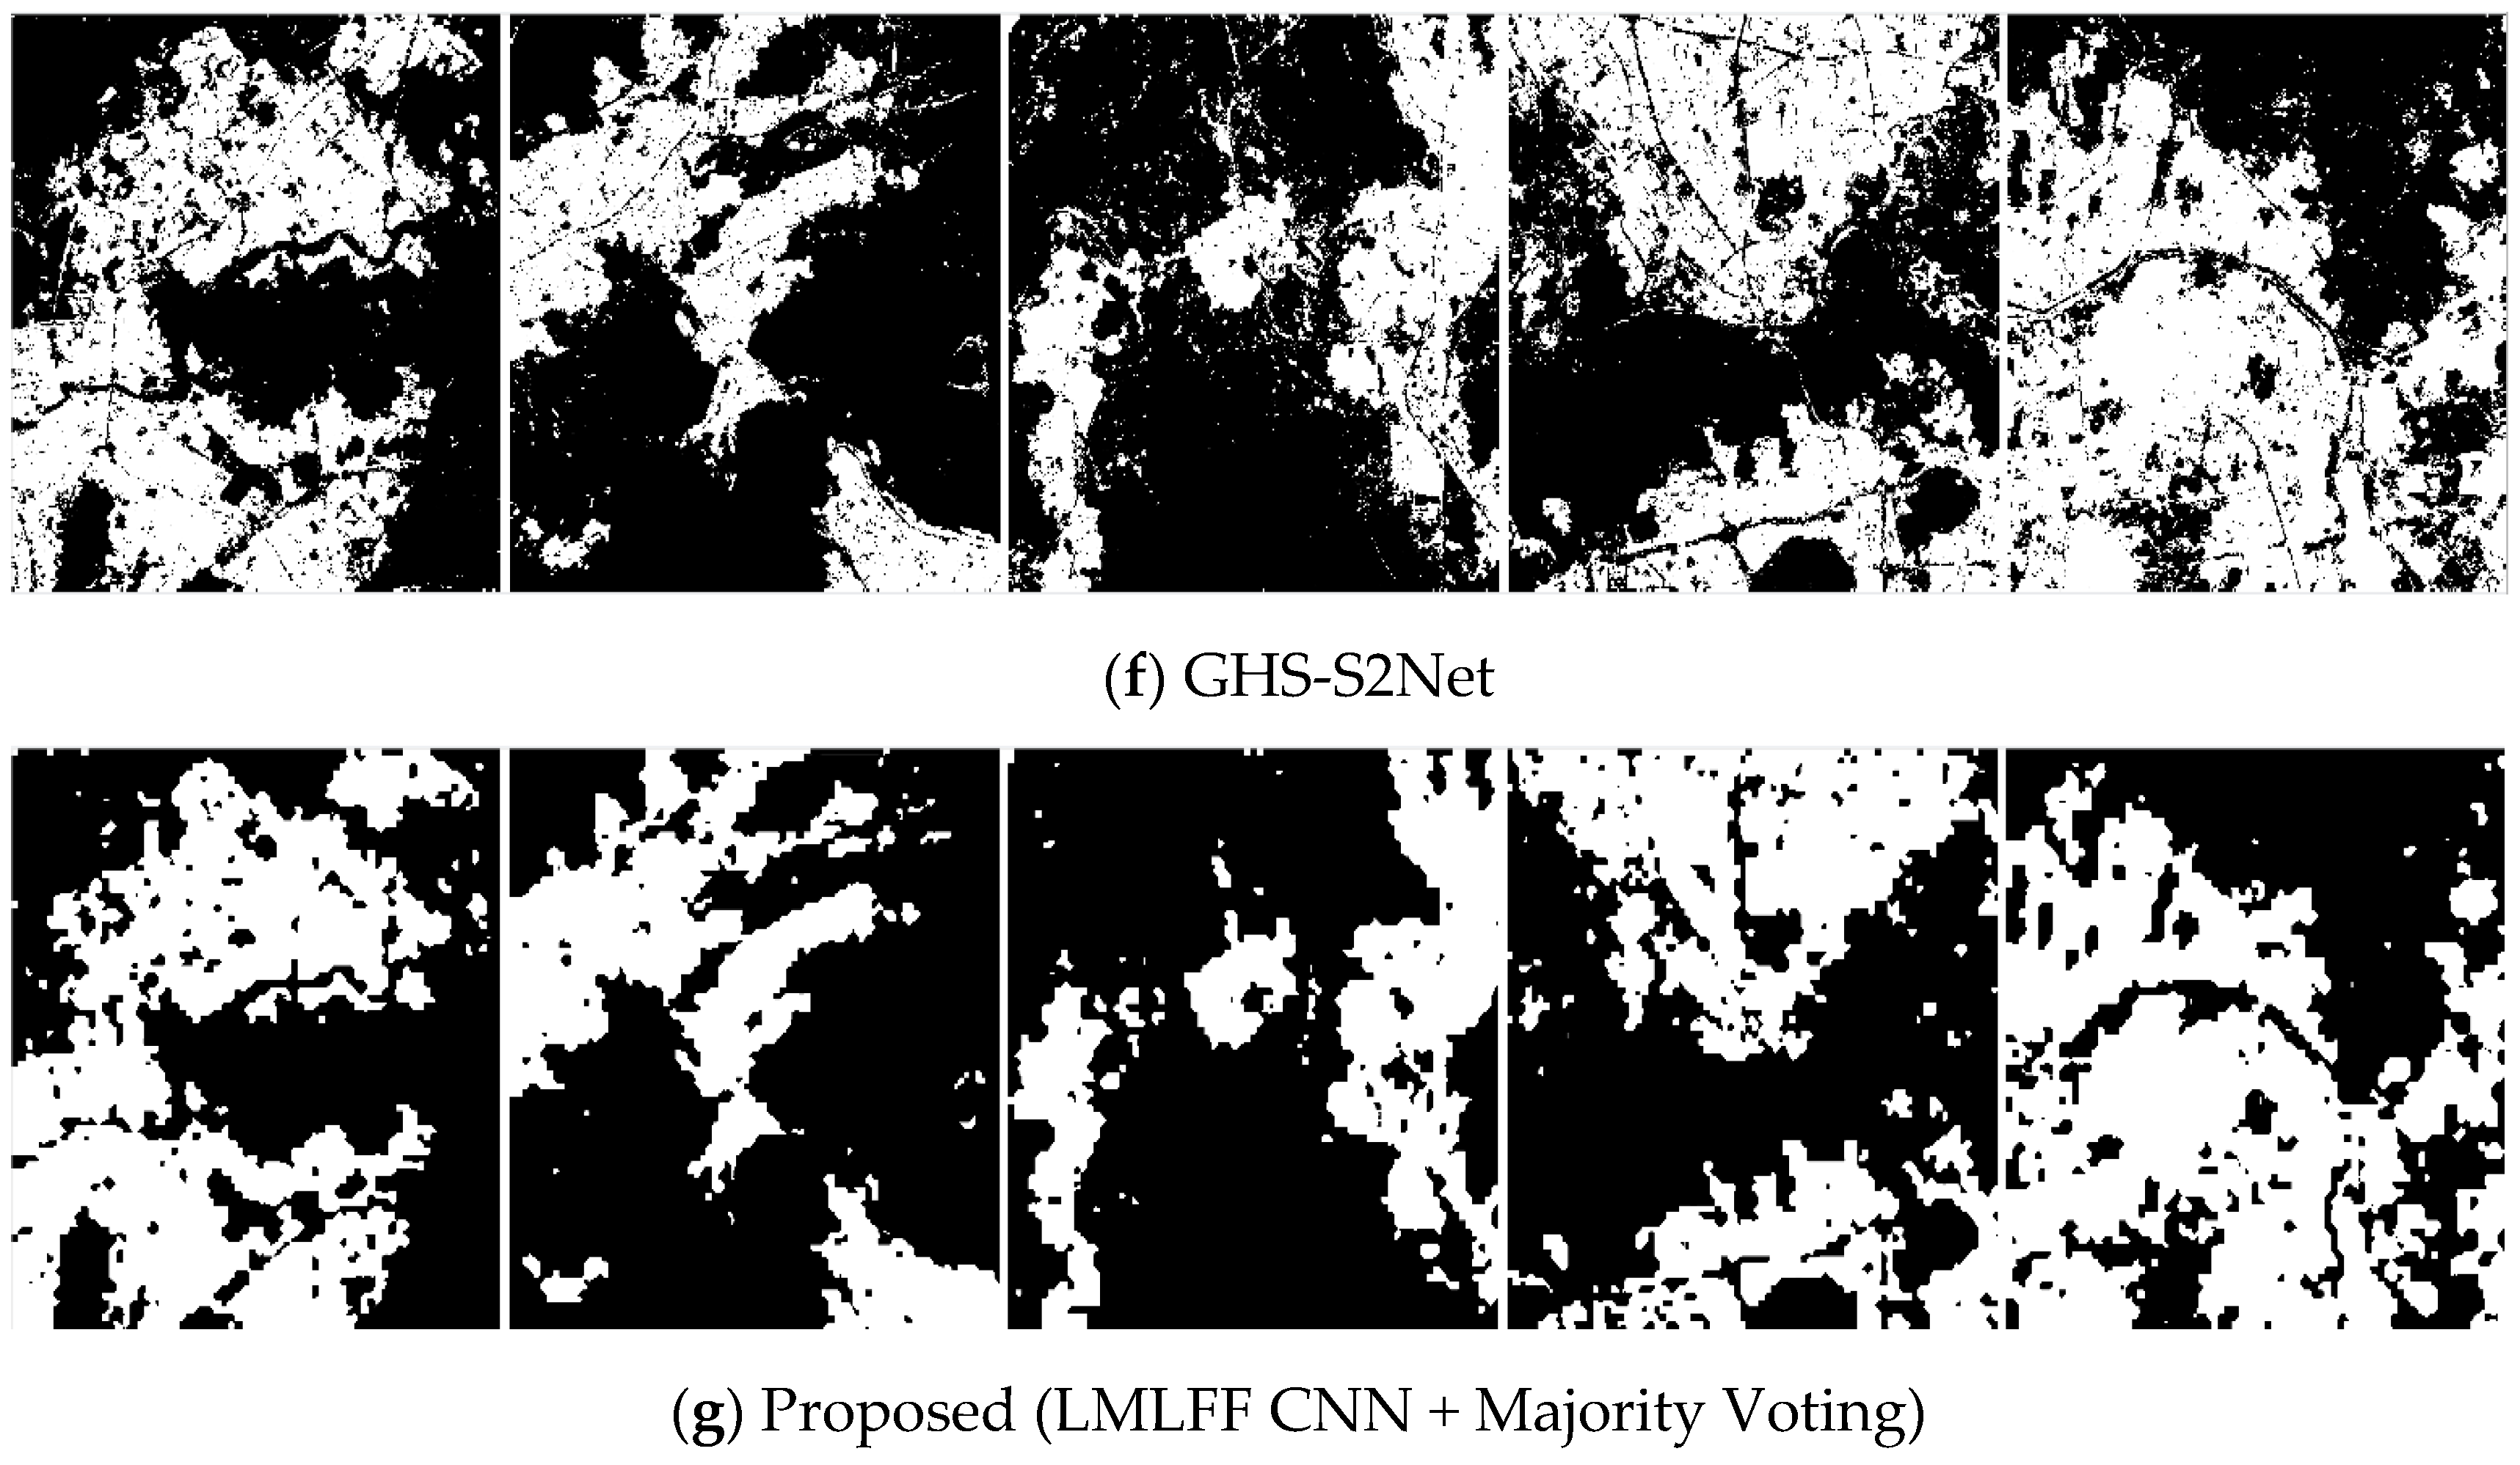
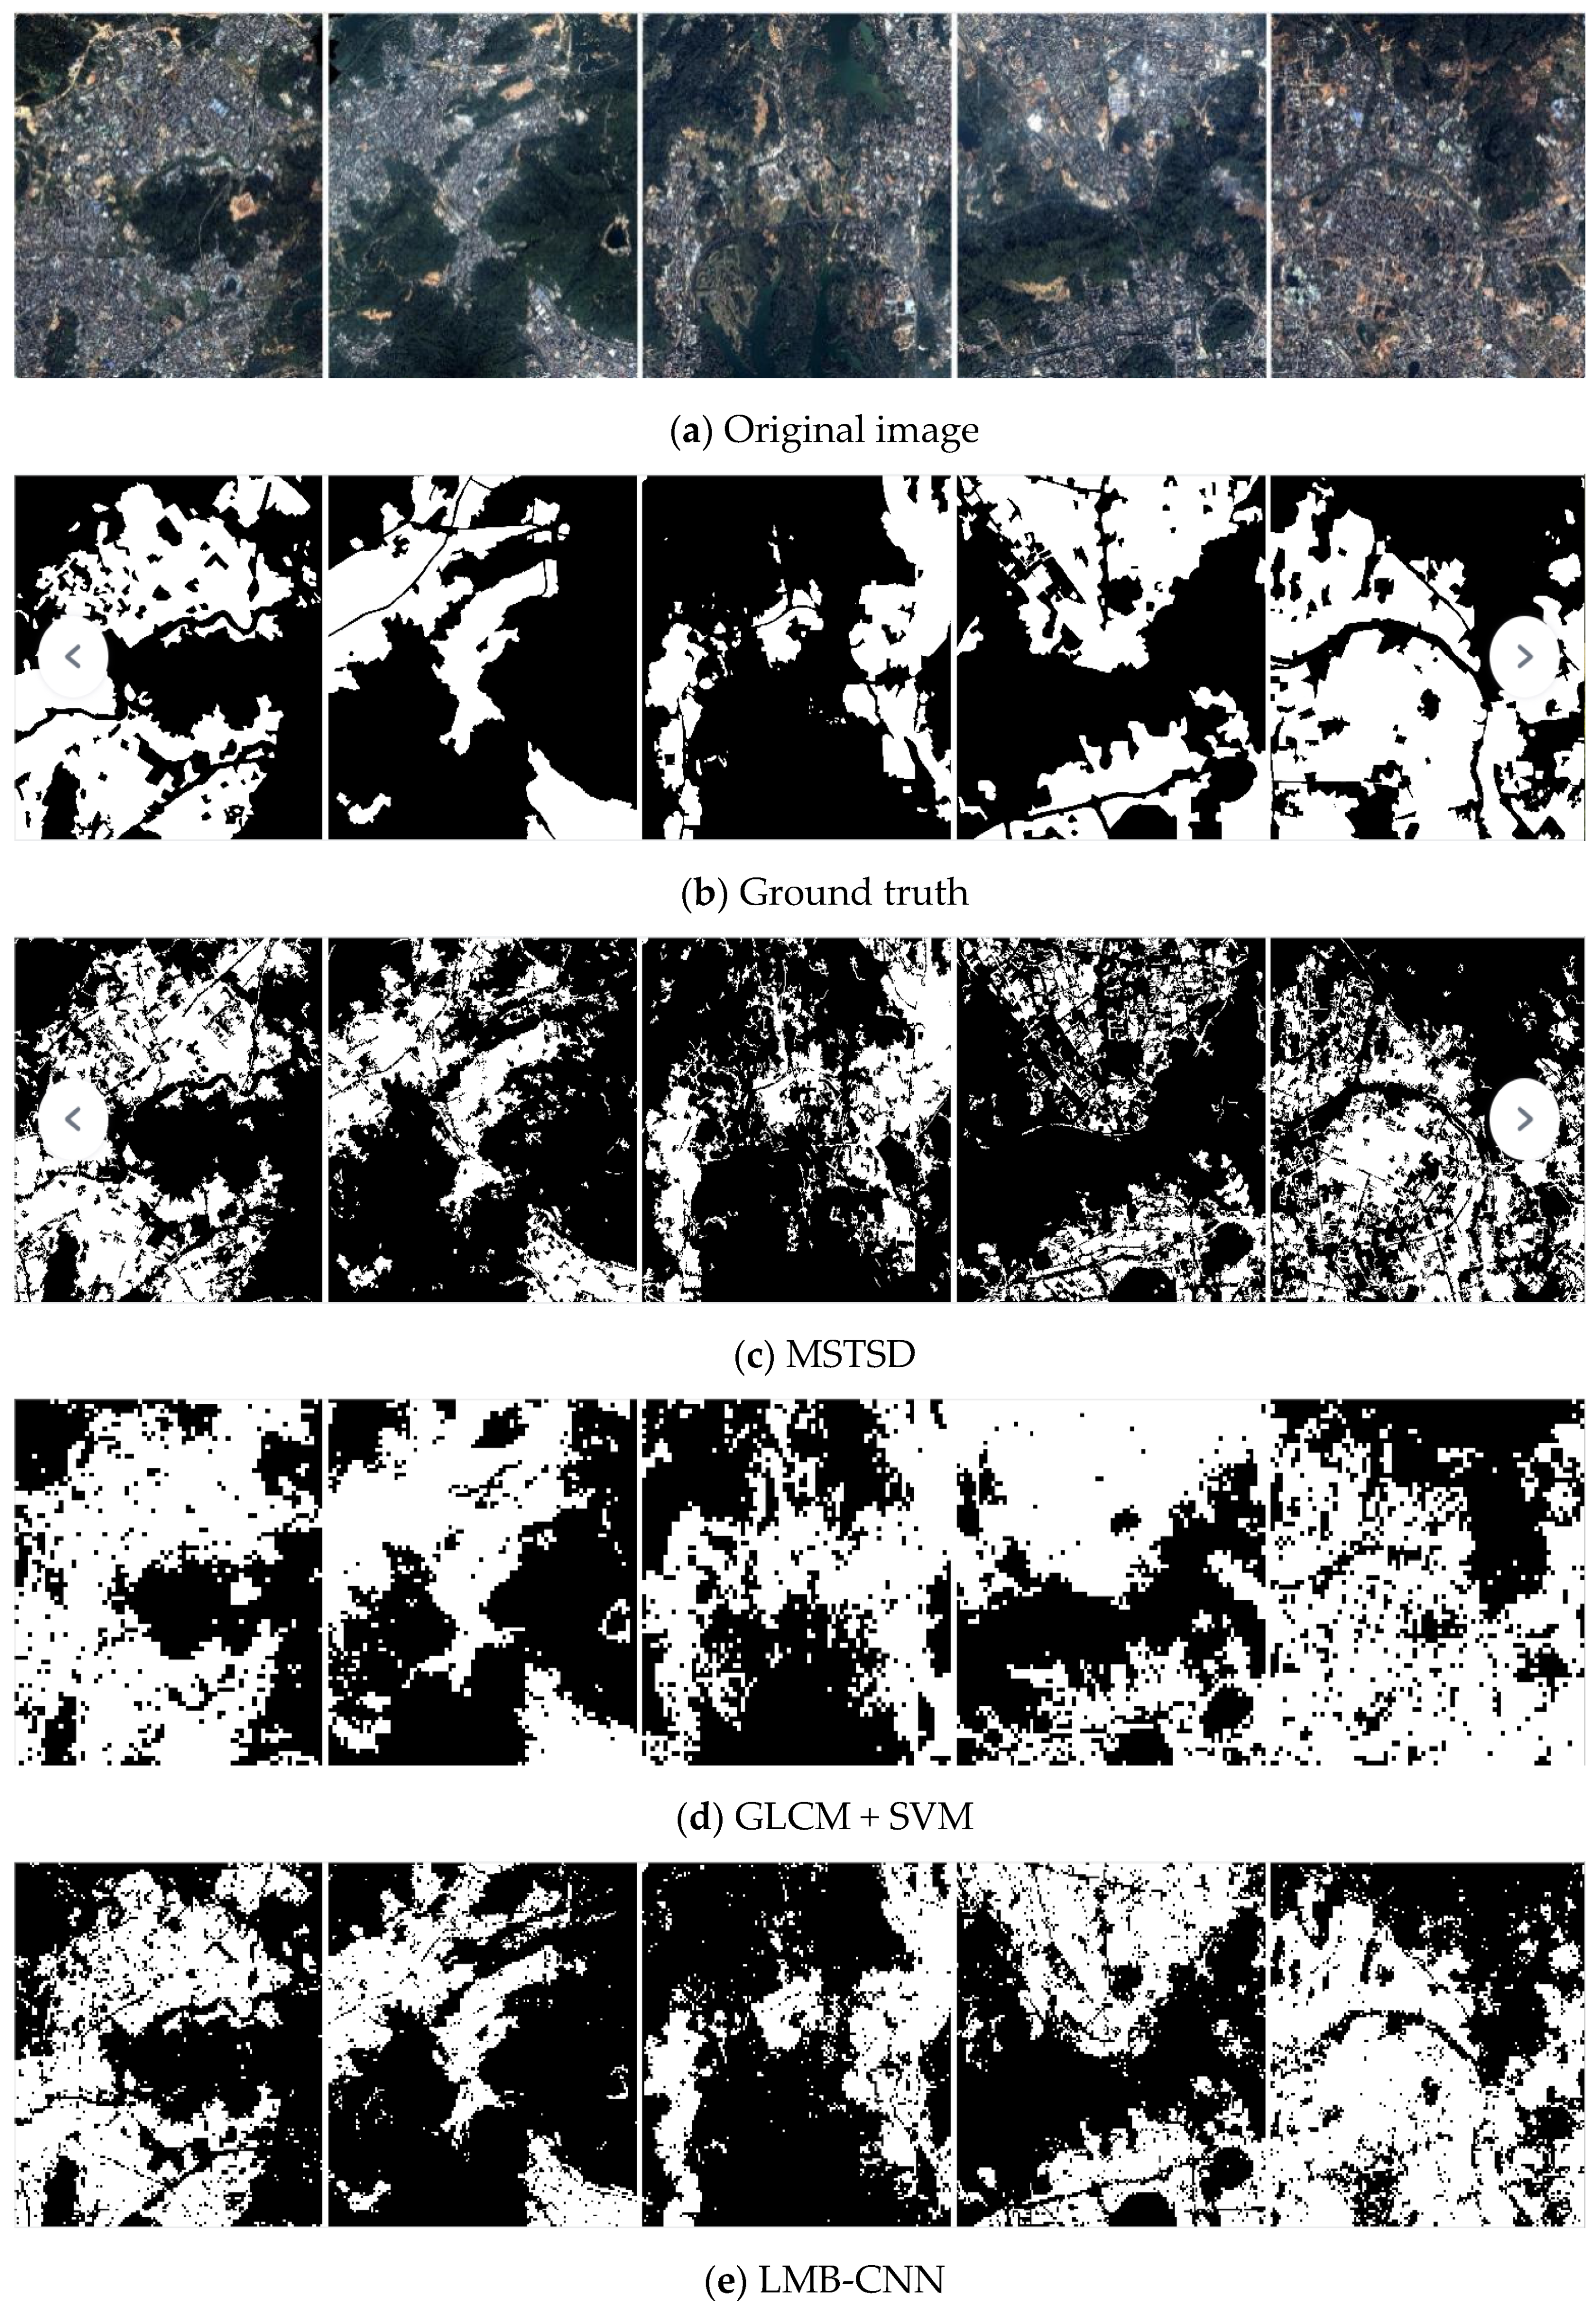
3.4.3. Comparison with State-of-the-Art Built-Up Area Detection Methods
4. Discussion
4.1. Ablation Study on FF Module
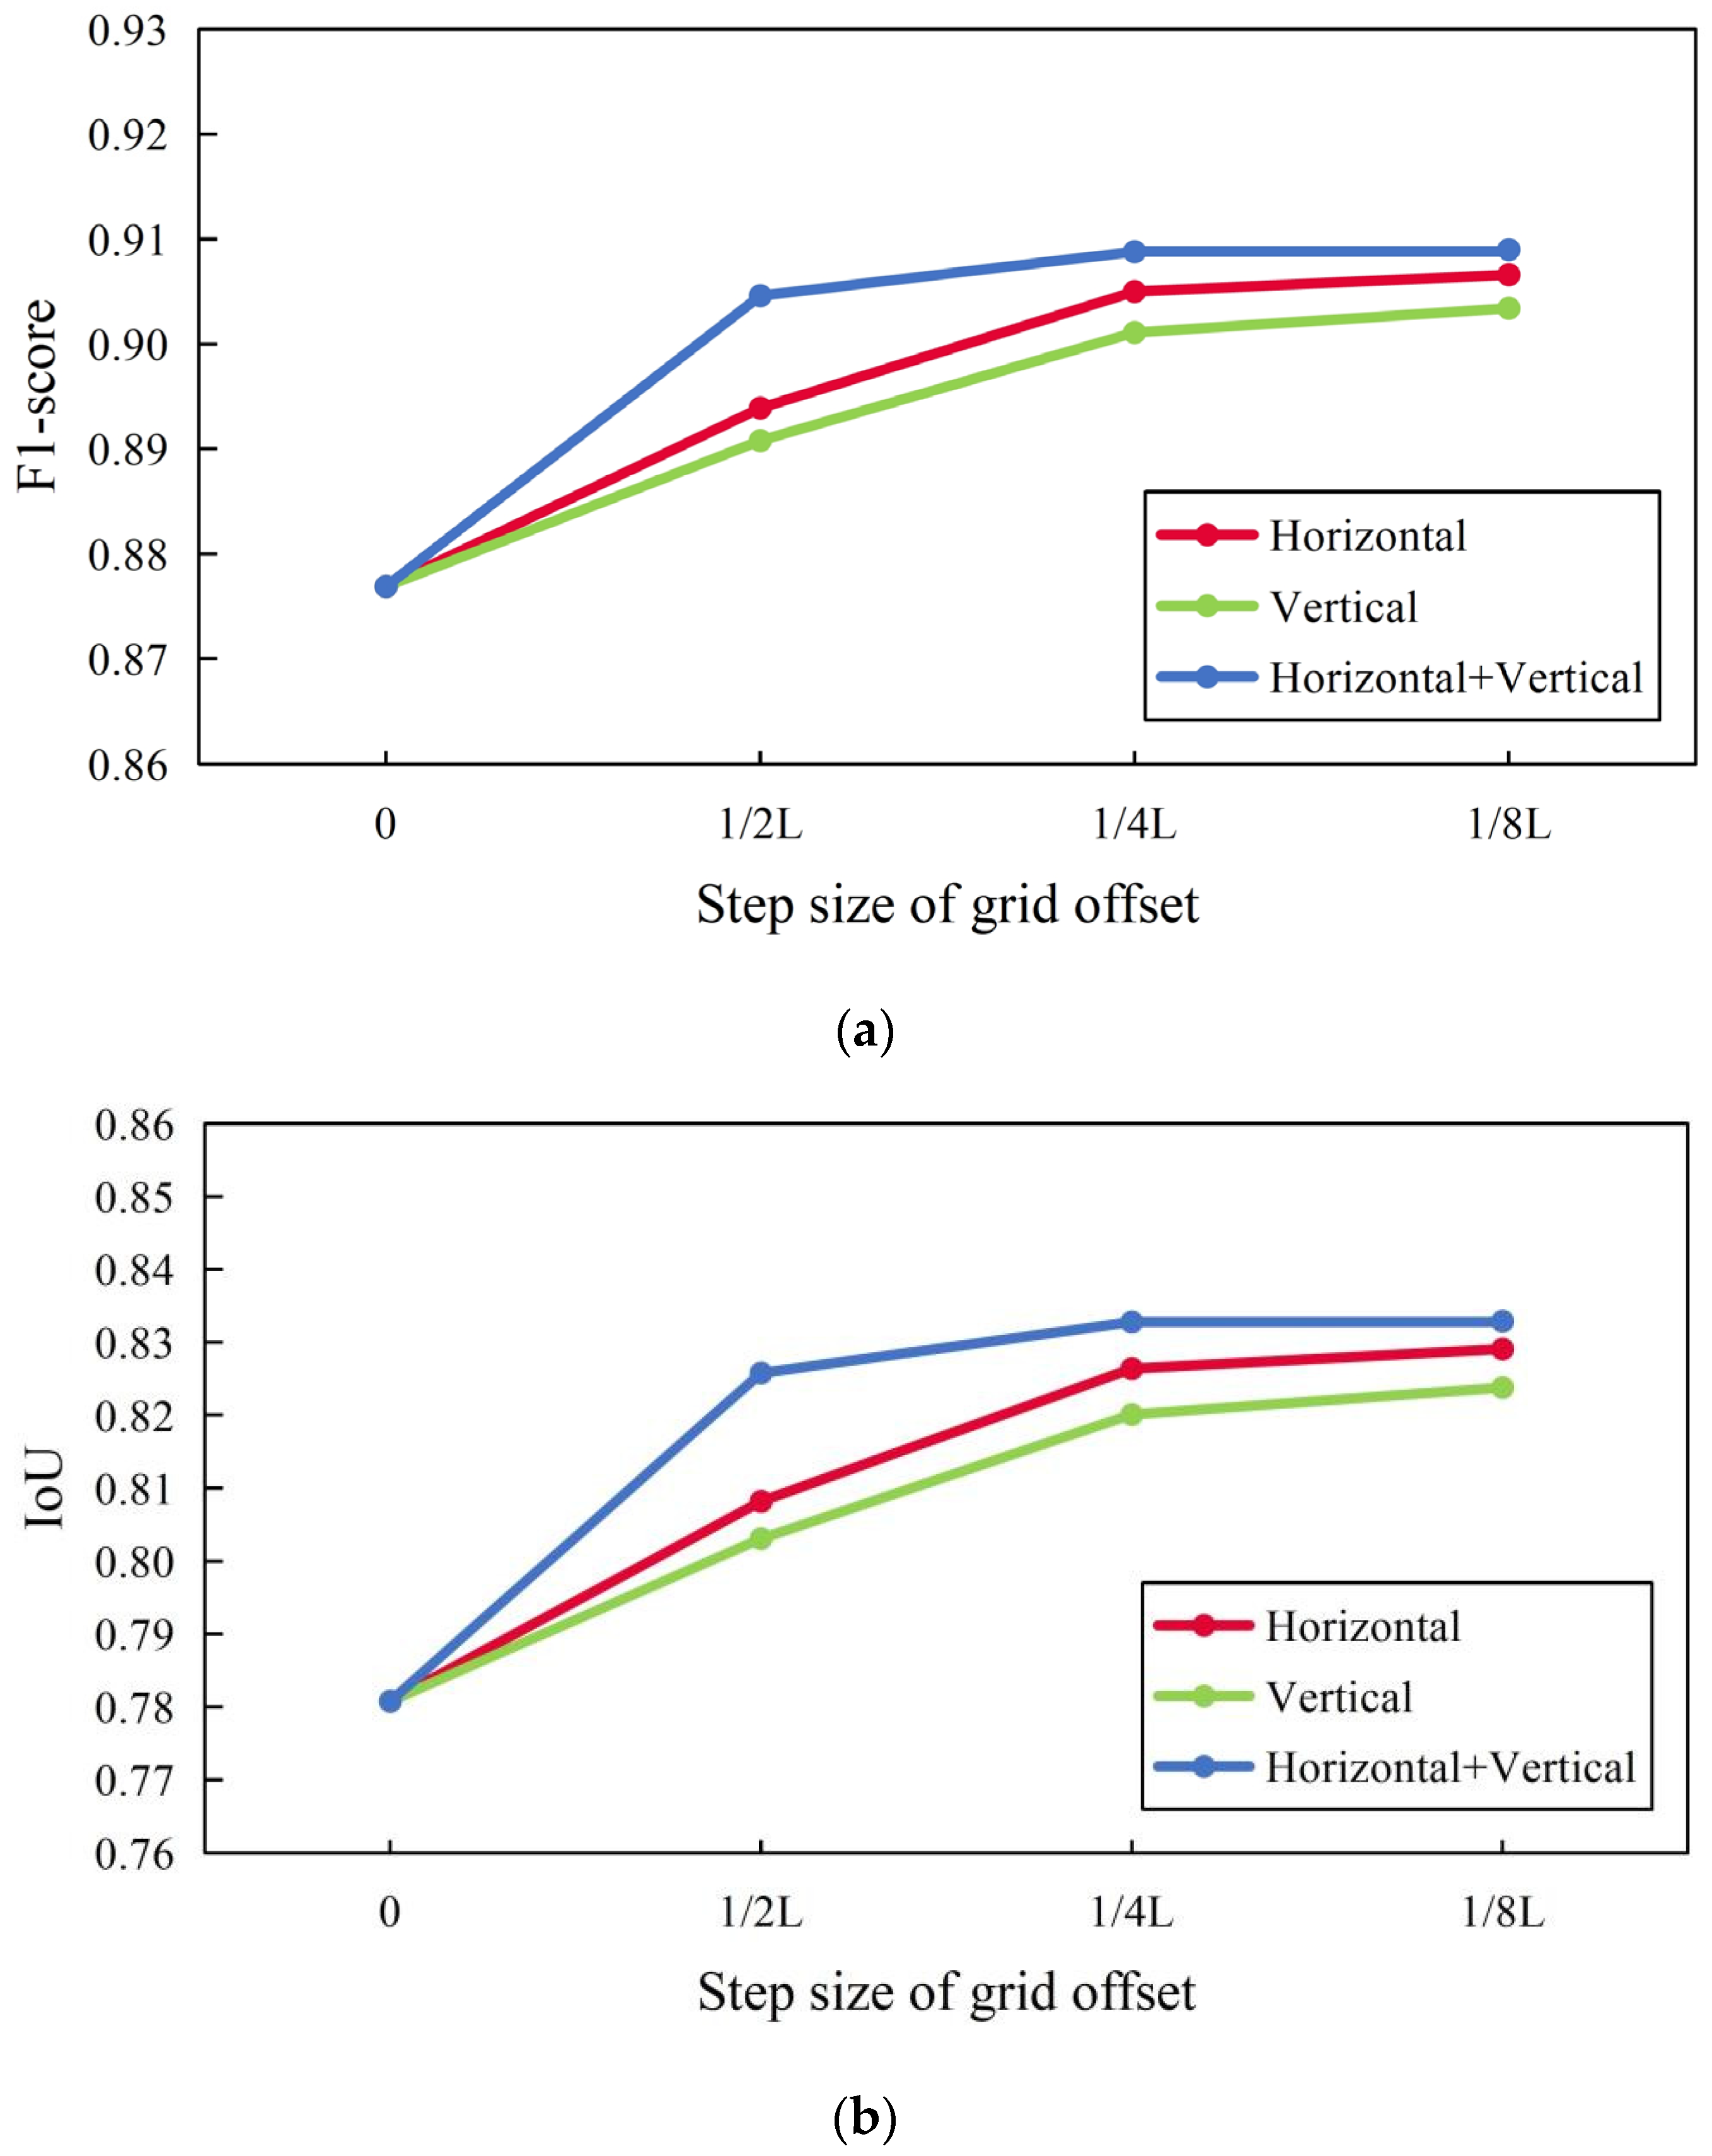
4.2. Effect of Grid Offset Parameters on Extraction Results
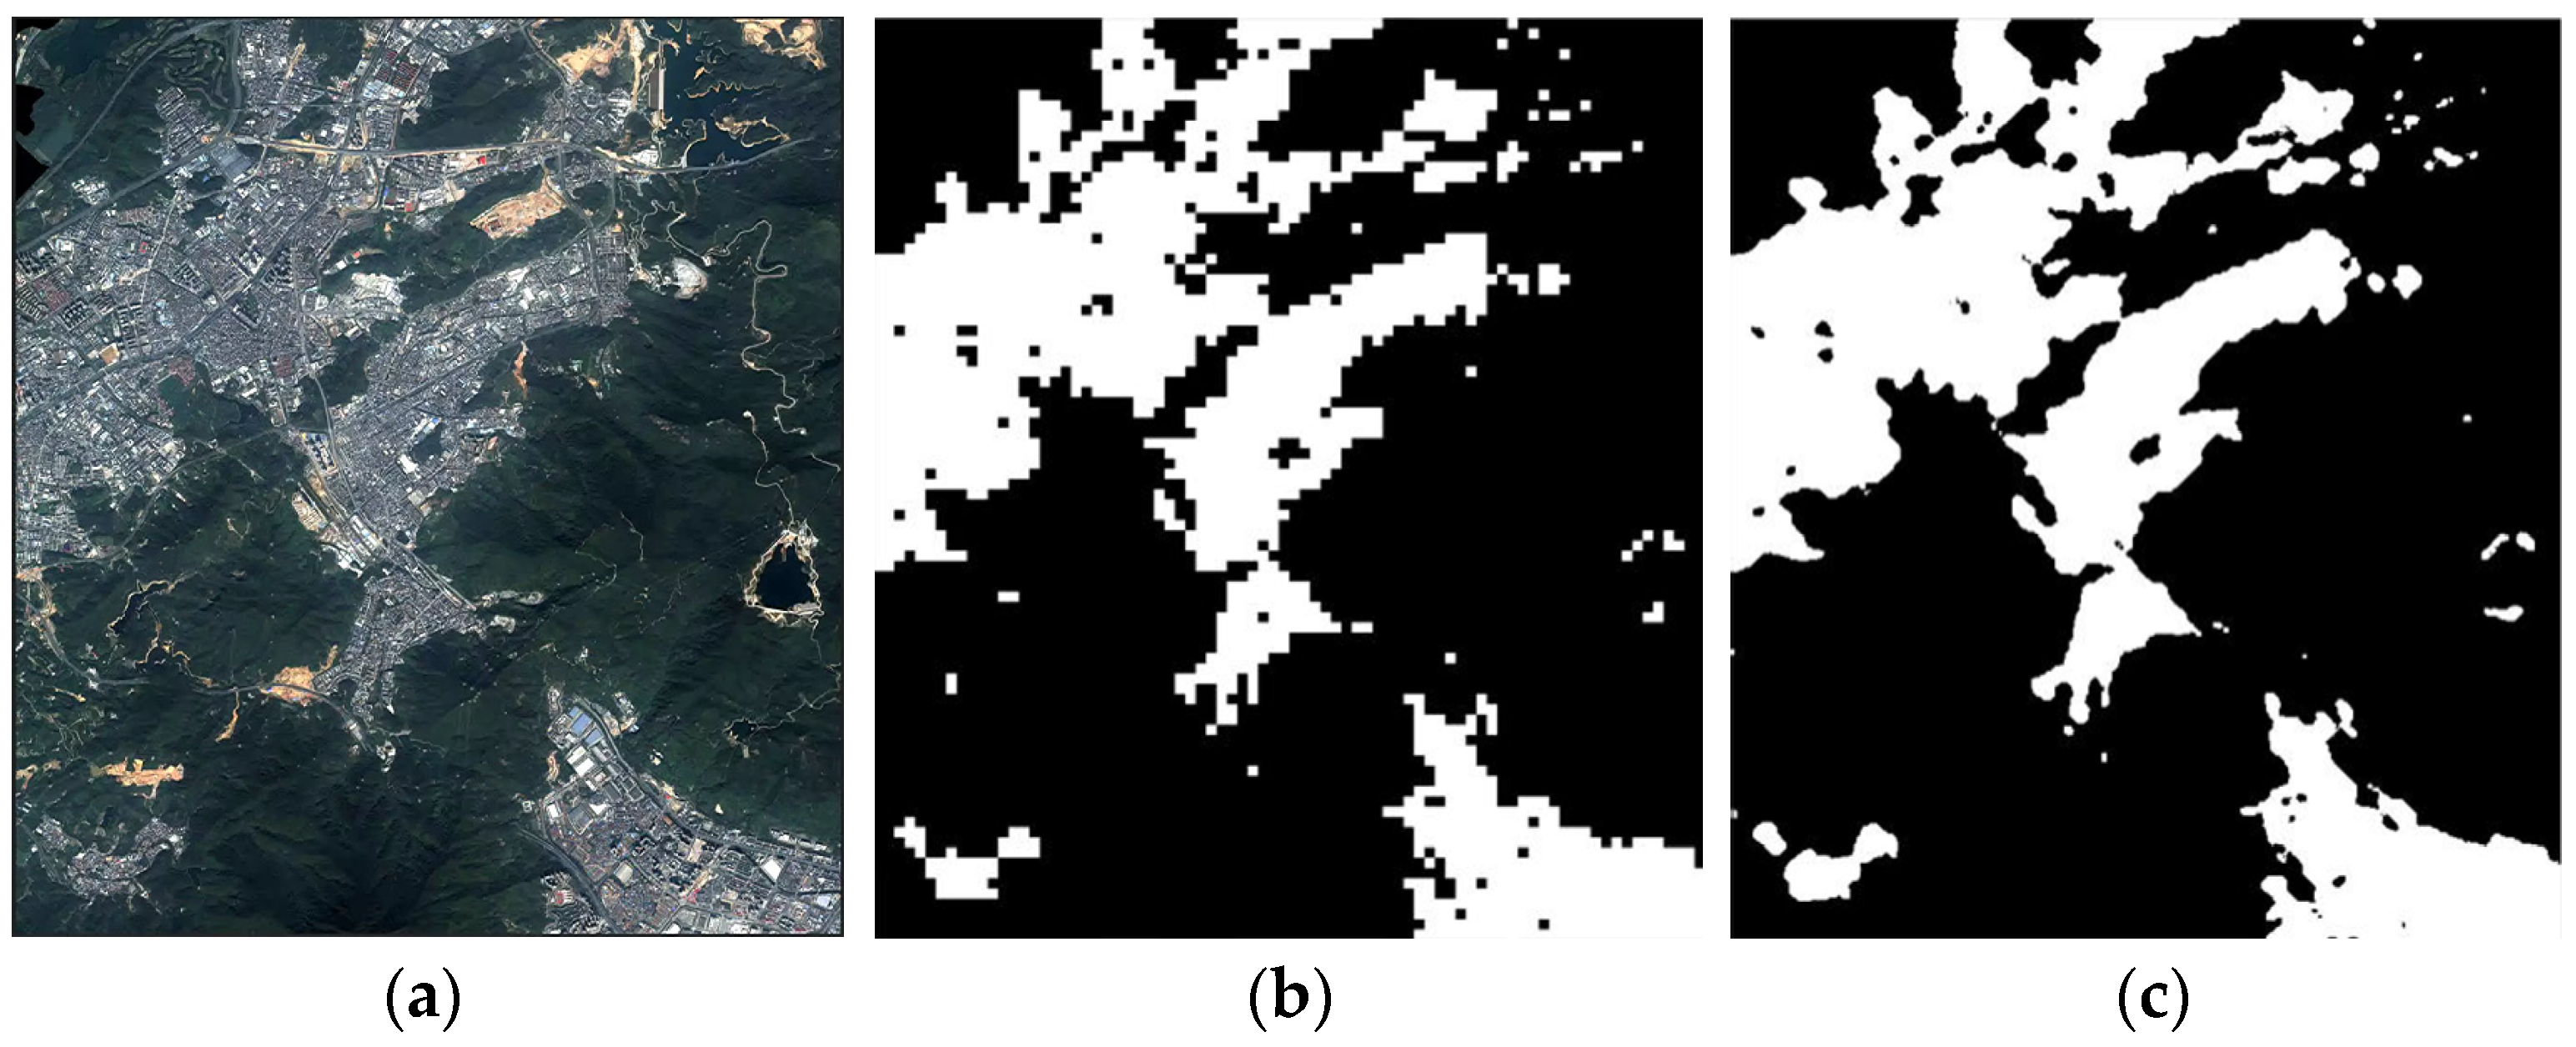
4.3. Generation of Urban-Scale Built-Up Area Maps with a Resolution of 1 m
5. Conclusions
Author Contributions
Funding
Data Availability Statement
Acknowledgments
Conflicts of Interest
References
- Liu, C.; Huang, X.; Zhu, Z.; Chen, H.; Tang, X.; Gong, J. Automatic extraction of built-up area from ZY3 multi-view satellite imagery: Analysis of 45 global cities. Remote Sens. Environ. 2019, 226, 51–73. [Google Scholar] [CrossRef]
- Wang, H.; Gong, X.; Wang, B.; Deng, C.; Cao, Q. Urban development analysis using built-up area maps based on multiple high-resolution satellite data. Int. J. Appl. Earth Obs. Geoinf. 2021, 103, 102500. [Google Scholar] [CrossRef]
- Verma, A.; Bhattacharya, A.; Dey, S.; López-Martínez, C.; Gamba, P. Built-up area mapping using Sentinel-1 SAR data. ISPRS J. Photogramm. Remote Sens. 2023, 203, 55–70. [Google Scholar] [CrossRef]
- Hu, Z.; Li, Q.; Zhang, Q.; Wu, G. Representation of block-based image features in a multi-scale framework for built-up area detection. Remote Sens. 2016, 8, 155. [Google Scholar] [CrossRef]
- Pesaresi, M.; Gerhardinger, A.; Kayitakire, F. A robust built-up area presence index by anisotropic rotation-invariant textural measure. IEEE J. Sel. Top. Appl. Earth Obs. Remote Sens. 2008, 1, 180–192. [Google Scholar] [CrossRef]
- Shao, Z.; Tian, Y.; Shen, X. BASI: A new index to extract built-up areas from high-resolution remote sensing images by visual attention model. Remote Sens. Lett. 2014, 5, 305–314. [Google Scholar] [CrossRef]
- Tao, C.; Tan, Y.; Zou, Z.-r.; Tian, J. Unsupervised detection of built-up areas from multiple high-resolution remote sensing images. IEEE Geosci. Remote Sens. Lett. 2013, 10, 1300–1304. [Google Scholar] [CrossRef]
- Chen, Y.; Lv, Z.; Huang, B.; Jia, Y. Delineation of built-up areas from very high-resolution satellite imagery using multi-scale textures and spatial dependence. Remote Sens. 2018, 10, 1596. [Google Scholar] [CrossRef]
- Chen, Y.; Lv, Z.; Huang, B.; Zhang, P.; Zhang, Y. Automatic extraction of built-up areas from very high-resolution satellite imagery using patch-level spatial features and gestalt laws of perceptual grouping. Remote Sens. 2019, 11, 3022. [Google Scholar] [CrossRef]
- Ali, A.; Nayyar, Z.A. A Modified Built-up Index (MBI) for automatic urban area extraction from Landsat 8 Imagery. Infrared Phys. Technol. 2021, 116, 103769. [Google Scholar] [CrossRef]
- Misra, M.; Kumar, D.; Shekhar, S. Assessing machine learning based supervised classifiers for built-up impervious surface area extraction from sentinel-2 images. Urban For. Urban Green. 2020, 53, 126714. [Google Scholar] [CrossRef]
- Chen, Y.; Yao, S.; Hu, Z.; Huang, B.; Miao, L.; Zhang, J. Built-up Area Extraction Combing Densely Connected Dual-Attention Network and Multi-Scale Context. IEEE J. Sel. Top. Appl. Earth Obs. Remote Sens. 2023, 16, 5128–5143. [Google Scholar] [CrossRef]
- Tan, Y.; Xiong, S.; Li, Y. Automatic extraction of built-up areas from panchromatic and multispectral remote sensing images using double-stream deep convolutional neural networks. IEEE J. Sel. Top. Appl. Earth Obs. Remote Sens. 2018, 11, 3988–4004. [Google Scholar] [CrossRef]
- Ma, L.; Liu, Y.; Zhang, X.; Ye, Y.; Yin, G.; Johnson, B.A. Deep learning in remote sensing applications: A meta-analysis and review. ISPRS J. Photogramm. Remote Sens. 2019, 152, 166–177. [Google Scholar] [CrossRef]
- Wahbi, M.; El Bakali, I.; Ez-zahouani, B.; Azmi, R.; Moujahid, A.; Zouiten, M.; Alaoui, O.Y.; Boulaassal, H.; Maatouk, M.; El Kharki, O. A deep learning classification approach using high spatial satellite images for detection of built-up areas in rural zones: Case study of Souss-Massa region-Morocco. Remote Sens. Appl. Soc. Environ. 2023, 29, 100898. [Google Scholar] [CrossRef]
- Simonyan, K.; Zisserman, A. Very deep convolutional networks for large-scale image recognition. arXiv 2014, arXiv:1409.1556. [Google Scholar]
- Szegedy, C.; Liu, W.; Jia, Y.; Sermanet, P.; Reed, S.; Anguelov, D.; Erhan, D.; Vanhoucke, V.; Rabinovich, A. Going deeper with convolutions. In Proceedings of the IEEE Conference on Computer Vision and Pattern Recognition, Boston, MA, USA, 7–12 June 2015; pp. 1–9. [Google Scholar]
- He, K.; Zhang, X.; Ren, S.; Sun, J. Deep residual learning for image recognition. In Proceedings of the IEEE conference on computer vision and pattern recognition, Las Vegas, NV, USA, 26 June–1 July 2016; pp. 770–778. [Google Scholar]
- Huang, G.; Liu, Z.; Van Der Maaten, L.; Weinberger, K.Q. Densely connected convolutional networks. In Proceedings of the IEEE Conference on Computer Vision and Pattern Recognition, Honolulu, HI, USA, 21–26 July 2017; pp. 4700–4708. [Google Scholar]
- Yuan, X.; Shi, J.; Gu, L. A review of deep learning methods for semantic segmentation of remote sensing imagery. Expert Syst. Appl. 2021, 169, 114417. [Google Scholar] [CrossRef]
- Long, J.; Shelhamer, E.; Darrell, T. Fully convolutional networks for semantic segmentation. In Proceedings of the IEEE Conference on Computer Vision and Pattern Recognition, Boston, MA, USA, 7–12 June 2015; pp. 3431–3440. [Google Scholar]
- Ronneberger, O.; Fischer, P.; Brox, T. U-net: Convolutional networks for biomedical image segmentation. In Proceedings of the Medical Image Computing and Computer-Assisted Intervention–MICCAI 2015: 18th International Conference, Proceedings, Part III 18, Munich, Germany, 5–9 October 2015; pp. 234–241. [Google Scholar]
- Persello, C.; Stein, A. Deep fully convolutional networks for the detection of informal settlements in VHR images. IEEE Geosci. Remote Sens. Lett. 2017, 14, 2325–2329. [Google Scholar] [CrossRef]
- Wurm, M.; Stark, T.; Zhu, X.X.; Weigand, M.; Taubenböck, H. Semantic segmentation of slums in satellite images using transfer learning on fully convolutional neural networks. ISPRS J. Photogramm. Remote Sens. 2019, 150, 59–69. [Google Scholar] [CrossRef]
- Wu, F.; Wang, C.; Zhang, H.; Li, J.; Li, L.; Chen, W.; Zhang, B. Built-up area mapping in China from GF-3 SAR imagery based on the framework of deep learning. Remote Sens. Environ. 2021, 262, 112515. [Google Scholar] [CrossRef]
- Li, T.; Wang, C.; Wu, F.; Zhang, H.; Tian, S.; Fu, Q.; Xu, L. Built-Up area extraction from GF-3 SAR data based on a dual-attention transformer model. Remote Sens. 2022, 14, 4182. [Google Scholar] [CrossRef]
- Lv, Z.; Zhang, P.; Sun, W.; Benediktsson, J.A.; Lei, T. Novel Land-Cover Classification Approach with Nonparametric Sample Augmentation for Hyperspectral Remote Sensing Images. IEEE Trans. Geosci. Remote Sens. 2023, 61, 4407613. [Google Scholar] [CrossRef]
- Lv, Z.; Zhang, P.; Sun, W.; Lei, T.; Benediktsson, J.A.; Li, P. Sample Iterative Enhancement Approach for Improving Classification Performance of Hyperspectral Imagery. IEEE Geosci. Remote Sens. Lett. 2023. [Google Scholar] [CrossRef]
- Cao, Y.; Huang, X.; Weng, Q. A multi-scale weakly supervised learning method with adaptive online noise correction for high-resolution change detection of built-up areas. Remote Sens. Environ. 2023, 297, 113779. [Google Scholar] [CrossRef]
- Hafner, S.; Ban, Y.; Nascetti, A. Unsupervised domain adaptation for global urban extraction using sentinel-1 SAR and sentinel-2 MSI data. Remote Sens. Environ. 2022, 280, 113192. [Google Scholar] [CrossRef]
- Cheng, G.; Xie, X.; Han, J.; Guo, L.; Xia, G.-S. Remote sensing image scene classification meets deep learning: Challenges, methods, benchmarks, and opportunities. IEEE J. Sel. Top. Appl. Earth Obs. Remote Sens. 2020, 13, 3735–3756. [Google Scholar] [CrossRef]
- Mboga, N.; Persello, C.; Bergado, J.R.; Stein, A. Detection of informal settlements from VHR images using convolutional neural networks. Remote Sens. 2017, 9, 1106. [Google Scholar] [CrossRef]
- Corbane, C.; Syrris, V.; Sabo, F.; Politis, P.; Melchiorri, M.; Pesaresi, M.; Soille, P.; Kemper, T. Convolutional neural networks for global human settlements mapping from Sentinel-2 satellite imagery. Neural Comput. Appl. 2021, 33, 6697–6720. [Google Scholar] [CrossRef]
- Huang, F.; Yu, Y.; Feng, T. Automatic extraction of impervious surfaces from high resolution remote sensing images based on deep learning. J. Vis. Commun. Image Represent. 2019, 58, 453–461. [Google Scholar] [CrossRef]
- Li, Y.; Huang, X.; Liu, H. Unsupervised deep feature learning for urban village detection from high-resolution remote sensing images. Photogramm. Eng. Remote Sens. 2017, 83, 567–579. [Google Scholar] [CrossRef]
- Tan, Y.; Xiong, S.; Li, Z.; Tian, J.; Li, Y. Accurate detection of built-up areas from high-resolution remote sensing imagery using a fully convolutional network. Photogramm. Eng. Remote Sens. 2019, 85, 737–752. [Google Scholar] [CrossRef]
- Tan, Y.; Xiong, S.; Yan, P. Multi-branch convolutional neural network for built-up area extraction from remote sensing image. Neurocomputing 2020, 396, 358–374. [Google Scholar] [CrossRef]
- Howard, A.G.; Zhu, M.; Chen, B.; Kalenichenko, D.; Wang, W.; Weyand, T.; Andreetto, M.; Adam, H. Mobilenets: Efficient convolutional neural networks for mobile vision applications. arXiv 2017, arXiv:1704.04861 2017. [Google Scholar]
- Lv, Z.; Liu, J.; Sun, W.; Lei, T.; Benediktsson, J.A.; Jia, X. Hierarchical Attention Feature Fusion-Based Network for Land Cover Change Detection With Homogeneous and Heterogeneous Remote Sensing Images. IEEE Trans. Geosci. Remote Sens. 2023, 61, 1–15. [Google Scholar] [CrossRef]
- Szegedy, C.; Vanhoucke, V.; Ioffe, S.; Shlens, J.; Wojna, Z. Rethinking the inception architecture for computer vision. In Proceedings of the IEEE Conference on Computer Vision and Pattern Recognition, Las Vegas, NV, USA, 27–30 June 2016; pp. 2818–2826. [Google Scholar]
- Ma, N.; Zhang, X.; Zheng, H.-T.; Sun, J. Shufflenet v2: Practical guidelines for efficient cnn architecture design. In Proceedings of the European Conference on Computer Vision (ECCV), Munich, Germany, 8–14 September 2018; pp. 116–131. [Google Scholar]
- Tan, M.; Le, Q. Efficientnet: Rethinking model scaling for convolutional neural networks. In Proceedings of the International Conference on Machine Learning, Long Beach, CA, USA, 9–15 June 2019; pp. 6105–6114. [Google Scholar]
- Zhang, X.; Wu, H.; Sun, H.; Ying, W. Multireceiver SAS imagery based on monostatic conversion. IEEE J. Sel. Top. Appl. Earth Obs. Remote Sens. 2021, 14, 10835–10853. [Google Scholar] [CrossRef]
- Yang, P. An imaging algorithm for high-resolution imaging sonar system. Multimed. Tools Appl. 2023, 1–17. [Google Scholar] [CrossRef]


| Test Image | Model | P | R | F1-Score | IoU |
|---|---|---|---|---|---|
| 1 | InceptionV3 | 0.7461 | 0.9740 | 0.8450 | 0.7316 |
| MobileNet | 0.8986 | 0.8747 | 0.8865 | 0.7962 | |
| ShuffleNetV2 | 0.8854 | 0.8973 | 0.8913 | 0.8039 | |
| EfficientNet-B0 | 0.8865 | 0.8957 | 0.8911 | 0.8036 | |
| LMLFF-CNN | 0.8930 | 0.8995 | 0.8962 | 0.8120 | |
| 2 | InceptionV3 | 0.7544 | 0.9686 | 0.8481 | 0.7364 |
| MobileNet | 0.8952 | 0.9103 | 0.9027 | 0.8226 | |
| ShuffleNetV2 | 0.9016 | 0.8831 | 0.8923 | 0.8056 | |
| EfficientNet-B0 | 0.9097 | 0.8807 | 0.8949 | 0.8099 | |
| LMLFF-CNN | 0.9039 | 0.9106 | 0.9072 | 0.8302 | |
| 3 | InceptionV3 | 0.7946 | 0.9603 | 0.8696 | 0.7483 |
| MobileNet | 0.8468 | 0.9153 | 0.8797 | 0.7852 | |
| ShuffleNetV2 | 0.8417 | 0.9110 | 0.8750 | 0.7778 | |
| EfficientNet-B0 | 0.8731 | 0.8848 | 0.8789 | 0.7840 | |
| LMLFF-CNN | 0.8657 | 0.9171 | 0.8906 | 0.8029 | |
| 4 | InceptionV3 | 0.7754 | 0.9708 | 0.8623 | 0.7565 |
| MobileNet | 0.8863 | 0.8622 | 0.8741 | 0.7764 | |
| ShuffleNetV2 | 0.8840 | 0.8556 | 0.8696 | 0.7692 | |
| EfficientNet-B0 | 0.9030 | 0.8139 | 0.8562 | 0.7485 | |
| LMLFF-CNN | 0.8825 | 0.8714 | 0.8769 | 0.7808 | |
| 5 | InceptionV3 | 0.7295 | 0.9800 | 0.8364 | 0.7488 |
| MobileNet | 0.9147 | 0.8710 | 0.8923 | 0.8056 | |
| ShuffleNetV2 | 0.9023 | 0.8825 | 0.8923 | 0.8055 | |
| EfficientNet-B0 | 0.9174 | 0.8668 | 0.8914 | 0.8041 | |
| LMLFF-CNN | 0.9048 | 0.8920 | 0.8984 | 0.8155 |
| Model | Params (G) | Flops (M) |
|---|---|---|
| InceptionV3 | 3.51 | 0.102 |
| MobileNet | 2.24 | 0.583 |
| ShuffleNetV2 | 5.015 | 0.957 |
| EfficientNet-B0 | 5.288 | 0.705 |
| LMLFF-Net | 0.18 | 0.068 |
| Model | Time (s) |
|---|---|
| InceptionV3 | 96.7 |
| MobileNet | 208.3 |
| ShuffleNetV2 | 159.6 |
| EfficientNet-B0 | 241 |
| LMLFF-Net | 42.2 |
| Test Image | Method | P | R | F1-Score | IoU |
|---|---|---|---|---|---|
| 1 | MSTSD | 0.8938 | 0.8171 | 0.8537 | 0.7448 |
| GLCM + SVM | 0.7180 | 0.9296 | 0.8102 | 0.6810 | |
| LMB-CNN | 0.8974 | 0.8922 | 0.8948 | 0.8096 | |
| GHS-S2Net | 0.9182 | 0.8747 | 0.8959 | 0.8115 | |
| Proposed (LMLFF CNN + Majority Voting) | 0.9101 | 0.9241 | 0.9170 | 0.8468 | |
| 2 | MSTSD | 0.8401 | 0.8033 | 0.8213 | 0.6968 |
| GLCM + SVM | 0.6576 | 0.9814 | 0.7875 | 0.6495 | |
| LMB-CNN | 0.8988 | 0.8880 | 0.8933 | 0.8072 | |
| GHS-S2Net | 0.8933 | 0.9039 | 0.8986 | 0.8158 | |
| Proposed (LMLFF CNN + Majority Voting) | 0.9169 | 0.9301 | 0.9235 | 0.8578 | |
| 3 | MSTSD | 0.6940 | 0.7848 | 0.7366 | 0.5830 |
| GLCM + SVM | 0.5195 | 0.9287 | 0.6663 | 0.4996 | |
| LMB-CNN | 0.8110 | 0.9244 | 0.8640 | 0.7606 | |
| GHS-S2Net | 0.7838 | 0.9327 | 0.8518 | 0.7419 | |
| Proposed (LMLFF CNN + Majority Voting) | 0.8844 | 0.9342 | 0.9086 | 0.8326 | |
| 4 | MSTSD | 0.8977 | 0.5232 | 0.6611 | 0.4938 |
| GLCM + SVM | 0.6471 | 0.9043 | 0.7544 | 0.6056 | |
| LMB-CNN | 0.8522 | 0.8693 | 0.8607 | 0.7555 | |
| GHS-S2Net | 0.7991 | 0.8970 | 0.8452 | 0.7320 | |
| Proposed (LMLFF CNN + Majority Voting) | 0.8985 | 0.8951 | 0.8968 | 0.8129 | |
| 5 | MSTSD | 0.9130 | 0.6545 | 0.7625 | 0.6161 |
| GLCM + SVM | 0.7527 | 0.8530 | 0.7997 | 0.6663 | |
| LMB-CNN | 0.8650 | 0.9278 | 0.8953 | 0.8105 | |
| GHS-S2Net | 0.8812 | 0.9038 | 0.8923 | 0.8056 | |
| Proposed (LMLFF CNN + Majority Voting) | 0.9182 | 0.9111 | 0.9146 | 0.8427 |
| Test Image | Models | P | R | F1-Score | IoU |
|---|---|---|---|---|---|
| 1 | With FF | 0.8930 | 0.8995 | 0.8962 | 0.8120 |
| Without FF | 0.8007 | 0.9812 | 0.8818 | 0.7886 | |
| 2 | With FF | 0.9039 | 0.9106 | 0.9072 | 0.8302 |
| Without FF | 0.8179 | 0.9671 | 0.8862 | 0.7958 | |
| 3 | With FF | 0.8657 | 0.9171 | 0.8906 | 0.8029 |
| Without FF | 0.7853 | 0.9647 | 0.8658 | 0.7634 | |
| 4 | With FF | 0.8825 | 0.8714 | 0.8769 | 0.7808 |
| Without FF | 0.6733 | 0.9782 | 0.7976 | 0.6634 | |
| 5 | With FF | 0.9048 | 0.8920 | 0.8984 | 0.8155 |
| Without FF | 0.7943 | 0.9701 | 0.8734 | 0.7754 |
Disclaimer/Publisher’s Note: The statements, opinions and data contained in all publications are solely those of the individual author(s) and contributor(s) and not of MDPI and/or the editor(s). MDPI and/or the editor(s) disclaim responsibility for any injury to people or property resulting from any ideas, methods, instructions or products referred to in the content. |
© 2024 by the authors. Licensee MDPI, Basel, Switzerland. This article is an open access article distributed under the terms and conditions of the Creative Commons Attribution (CC BY) license (https://creativecommons.org/licenses/by/4.0/).
Share and Cite
Chen, Y.; Peng, F.; Yao, S.; Xie, Y. Lightweight Multilevel Feature-Fusion Network for Built-Up Area Mapping from Gaofen-2 Satellite Images. Remote Sens. 2024, 16, 716. https://doi.org/10.3390/rs16040716
Chen Y, Peng F, Yao S, Xie Y. Lightweight Multilevel Feature-Fusion Network for Built-Up Area Mapping from Gaofen-2 Satellite Images. Remote Sensing. 2024; 16(4):716. https://doi.org/10.3390/rs16040716
Chicago/Turabian StyleChen, Yixiang, Feifei Peng, Shuai Yao, and Yuxin Xie. 2024. "Lightweight Multilevel Feature-Fusion Network for Built-Up Area Mapping from Gaofen-2 Satellite Images" Remote Sensing 16, no. 4: 716. https://doi.org/10.3390/rs16040716
APA StyleChen, Y., Peng, F., Yao, S., & Xie, Y. (2024). Lightweight Multilevel Feature-Fusion Network for Built-Up Area Mapping from Gaofen-2 Satellite Images. Remote Sensing, 16(4), 716. https://doi.org/10.3390/rs16040716