Abstract
Utilizing data from the Tropical Rainfall Measuring Mission (TRMM) satellite’s precipitation radar (PR) and lightning imaging sensor (LIS), this study explores the spatiotemporal distributions of thunderstorm and lightning structures over the Qinghai–Tibet Plateau (QTP), an aspect that has not been explored previously. The structural aspects are crucial when considering the impact of thunderstorm and lightning activity in the atmospheric processes. Thunderstorms over the QTP show clear spatial variations in both vertical height and horizontal extension. In the southern region, the average heights of 20 dBZ and 30 dBZ echo tops typically exceed 11.2 and 9.3 km, respectively. Meanwhile, in the eastern part, the average coverage areas for reflectivity greater than 20 dBZ and 30 dBZ consistently surpass 1000 and 180 km2, respectively. The spatial distribution of thunderstorm vertical development height relative to the surface aligns more closely with the horizontal extension, indicating stronger convection in the eastern QTP. The thunderstorm flash rate shows an eastward and northward prevalence, while the thunderstorm flash density peaks in the western and northeastern QTP, with a minimum in the southeast. Furthermore, in the eastern QTP, lightning duration, spatial expansion, and radiance are more pronounced, with the average values typically exceeding 0.22 s, 14.5 km, and 0.50 J m−2 sr−1 μm−1, respectively. Monthly variations reveal heightened values during the summer season for thunderstorm vertical extension, areas with reflectivity greater than 30 dBZ, and lightning frequency. Diurnal variations highlight an afternoon increase in thunderstorm vertical and horizontal extension, lightning frequency, duration, and spatial scale. From a statistical perspective, under weak convective conditions, lightning length exhibits a positive correlation with thunderstorm convection intensity, contrasting with the opposite relationship suggested by previous studies. This article further analyzes and discusses the correlations between various thunderstorm and lightning structural parameters, enhancing our understanding of the distinctive features of thunderstorm and lightning activities in the QTP.
1. Introduction
The Qinghai–Tibet Plateau (QTP) exerts a significant influence on atmospheric circulation and climate change owing to its expansive topography and thermal effects [1,2,3,4,5,6]. Thunderstorms, as convective cloud systems that generate lightning activity, play a crucial role in various aspects, including QTP precipitation, the global radiation budget, and the exchange of materials between the troposphere and stratosphere [5,7,8]. Additionally, lightning activity serves as a major natural source of nitrogen oxides in the QTP, contributing to atmospheric chemical processes [9,10]. Beyond its meteorological significance, lightning over the QTP poses a notable natural disaster, with the per capita probability of lightning strike casualties ranking among the highest in China [11]. Consequently, meteorologists have taken their attention to QTP thunderstorms and lightning activities in recent years.
Previous studies have noted that the number of thunderstorm days and the frequency of thunderstorm events in the central and eastern QTP approaches the levels seen in South China [4,12]. However, the lightning activity in the QTP is visibly weak and is only significantly higher than that in the northwest arid regions of China [13,14]. Studies indicate that QTP thunderstorms exhibit weaker convection, smaller scale, shorter lifespans (around 1 h), and lower lightning frequency when compared to thunderstorms in the regions to the east and south of the QTP [15,16,17,18]. Additionally, lightning discharges in QTP thunderstorms are primarily associated with the lower positive and middle negative charge regions [15,19,20]. This is in contrast to normal thunderstorms on plains where the upper positive and middle negative charge layers contribute more lightning, especially intracloud (IC) lightning [21,22]. Furthermore, research indicates that lightning on the QTP exhibits shorter duration, smaller spatial extension scale, and weaker radiance than that observed in Central and Eastern China [17,18].
Some studies have explored the spatiotemporal distributions of thunderstorm and lightning activity across the QTP. Du et al. [23] examined the spatial and temporal patterns of thunderstorm activity on the QTP using the thunderstorm feature dataset established by Ma et al. [24]. This dataset was based on black body temperature (TBB) and cloud classification (CLC) products from the Fengyun-2E (FY-2E) geostationary satellite, along with lightning data from the World Wide Lightning Location Network (WWLLN). They identified three centers with frequent thunderstorms in the QTP: southeast (around 100°E, 29°N), south–central (around 92°E, 30°N), and southwest (around 88°E, 30°N), with the southeast exhibiting the highest frequency of thunderstorms. However, based on observations from the precipitation radar (PR) carried by the Tropical Rainfall Measuring Mission (TRMM) satellite, Qie et al. [25] suggested that the highest frequency of thunderstorms occurs in the central QTP (approximately 87–93°E, 31–35°N). It is evident that the spatial distribution of thunderstorm activity over the QTP, as provided by different datasets, varies.
Due to the limited availability of ground-based data on the QTP, much of the existing research on lightning activities in the QTP relies on data from the lightning imaging sensor (LIS) aboard the TRMM [26,27]. These studies indicate that approximately 95% of lightning in the QTP occurs from May to September, with peak activity in the months from June to August in different regions. The peak diurnal variation in lightning activity is around 17:00 (local time, LT). Moreover, the density in lightning activity is highest in the eastern and central QTP and lowest in the western and northern QTP. The spatial distribution of lightning activity exhibits the characteristic of advancing from east to west starting in May and then retreating from west to east starting in September. Ma et al. [28] found discrepancies in the spatiotemporal distributions of lightning between the observations of WWLLN and TRMM/LIS. For instance, WWLLN indicates relatively weak lightning activity in the northeastern QTP, while a region of relatively strong lightning activity is observed in the southwestern QTP, differing from the spatial distribution of LIS lightning. The primary and secondary monthly peaks of WWLLN lightning are in August and September, respectively, while those of LIS lightning occur in July and June. They proposed that the disparities in spatiotemporal distributions between LIS lightning and WWLLN lightning could be attributed to differences in their observation models and to the structural difference of the thunderstorms between different QPT regions.
In comparison to the extensive research on the spatial and temporal distributions of thunderstorm and lightning activities in the QTP, the spatiotemporal distributions of thunderstorm and lightning structures in the QTP remain largely unknown. The term “thunderstorm structure” here refers to the vertical and horizontal expansion as well as the parameters associated with the convective characteristics of thunderstorms, while “lightning structure” encompasses flash duration, spatial extension, flash radiance, and other aspects representing the scale and intensity of the lightning. Only Qie et al. [25] divided the QTP into three parts (east, central, and west) based on active regions of thunderstorm activity and compared the differences in the structure of thunderstorm clouds across these regions. Their findings revealed that the area of thunderstorm clouds is the largest in the east and the smallest in the west. Additionally, the echo depth of 40 dBZ exhibits the most significant difference among the three regions, with values of 3.0 km in the east, 2.5 km in the center, and 2.3 km in the west. Meanwhile, the structural aspects of thunderstorms and lightning play a crucial role in assessing the impact of thunderstorm and lightning activity in the QTP on weather, climate, and atmospheric chemistry. For instance, the larger scale and higher vertical development of thunderstorms undoubtedly exert a greater influence on the radiation budget and material transport. Additionally, the size and energy of lightning directly correlate with the quantity of nitrogen oxides produced [29,30,31]. Therefore, this study aims to unravel the spatiotemporal distribution characteristics of thunderstorm and lightning structures in the QTP and explore the relationship between different structural parameters and the potential explanations behind them. The ideal outcome of this study is to further refine our understanding of the distinctive features of thunderstorm and lightning activities in the QTP, deepening our comprehension of the unique relationship between these activities.
2. Data and Methodology
2.1. Data Description
The data utilized herein were originally derived from observations of the TRMM [32,33,34]. The TRMM satellite was launched in November 1997, and the mission was terminated in April 2015, contributing an approximately 17-year dataset of rainfall and lightning in tropical and subtropical areas worldwide. The utilized datasets cover from 1998 to 2014 in this study, and the data from August 2001, in which the orbit of the TRMM satellite increased from 350 km to 403 km, were excluded.
2.1.1. RPF Dataset
The TRMM-based radar precipitation feature (RPF) dataset was built by the University of Utah by collecting multiple observational datasets from several instruments aboard the TRMM satellite, including the PR, LIS, TRMM Microwave Imager (TMI), and Visible and Infrared Radiometers (VIRS) [35]. An RPF was defined as a contiguous area in which the rainfall rate observed by the PR was greater than zero [36]. The PR identified the cloud with a horizontal resolution of approximately 5 km and vertical resolution of 0.25 km. The RPFs over the QTP were divided into two categories, namely those with and without LIS lightning. The former corresponds to the thunderstorms. In this study, the position of the RPF, PR reflectivity-related vertical and horizontal extensions of the thunderstorm cloud, and information such as the flash rate and flash density of the thunderstorm obtained by combining with LIS observations are used; they are collectively referred to as the thunderstorm structure.
2.1.2. LIS Data
The lightning data utilized in this study were acquired from the LIS, one of the instruments aboard the TRMM satellite. The LIS captured light signals using a CCD with a resolution of 128 × 128 pixels. The field width of the LIS spanned approximately 500–550 km on the Earth’s surface, with a spatial resolution ranging from 3 to 6 km [37,38], covering latitudes approximately between 38°N and 38°S. According to Boccippio et al. [32], the detection efficiency of the LIS was 73 ± 11% and 93 ± 4% during the day and night, respectively, and 88 ± 9% throughout the entire day.
The primary flash product of the LIS comprised events, groups, flashes, and so on. An event corresponded to a single detected pixel surpassing the background radiance threshold. Spatially continuous or single events within the same ~2 ms LIS frame were designated as a group, and groups occurring within 5.5 km and 330 ms of each other were clustered together as a flash [39]. LIS data not only provided information on lightning frequency and location but also included flash duration, footprint (area of the region illuminated by lightning), and radiance. Additionally, we calculated the flash length by extracting the largest horizontal distance between any two events involved in a flash. Flash duration, horizontal extension (footprint and length), and radiance are all characteristics associated with the lightning discharge process and channel development; collectively, they are referred to as lightning structure in this analysis. Following the methodology used in the work by You et al. [17], extreme flashes with durations greater than 3 s or equal to 0 s, as well as lengths larger than 1000 km or smaller than 4 km, were excluded.
2.1.3. Matching of RPF and LIS Data
When examining the relationship between thunderstorm structure and lightning structure, the alignment of RPF data and LIS data is essential. We employed the same methodology as You et al. [17]. Initially, parameters describing the shape (long axis, short axis, and rotation angle) and position of the thunderstorm were extracted from the RPF data to define an ellipse simulating the thunderstorm shape. Subsequently, the long and short axes of the original ellipse were extended by one-third to create a new elliptical region. Lightning falling within this extended elliptical region was then identified as associated with the respective RPF. You et al. [17] justified the one-third extension of the ellipse’s short and long axes based on the following reasons: (1) the minimum detectable signal of TRMM/PR that constrained the RPF range was approximately above 17–18 dBZ [40], implying that the outer regions of storms potentially involved in lightning discharges were not encompassed in the RPF, and (2) the referenced position of flashes in the matching process was the centroid of pixels with radiance weighted, potentially located outside the RPF, with parts of flash channels even propagating through the RPF. Their tests indicated that the proportion of lightning ultimately matched with the RPF to the total lightning was comparable to considering PR and LIS swath widths (about 250 km and 600 km, respectively).
2.2. Analysis Region
The delineation of the analysis regions is indicated by the red lines in Figure 1a. While this region essentially covers the primary body of the QTP, it does not perfectly align with the entire QTP area. The determination of this region considered both terrain features and the comprehensive distribution characteristics of RPF data. The brown line in Figure 1b roughly follows the 3000 m isoheight, and the RPFs with lightning are denoted by gray dots on the map based on their locations. A distinct edge, approximately outlined by the red lines in Figure 1b, exhibits low-density RPFs with lightning and serves as a division between the samples over the QTP and those over the southern Himalayan front. Previous studies have highlighted significant differences in the properties and mechanisms of deep convection and lightning activity between the QTP and the southern Himalayan front [12,16,17,18,41,42]. Thus, to minimize contamination of our study area, it is essential to exclude thunderstorms over the latter region. The red line in Figure 1b is employed as the boundary for the south and west sides of the research region, while the 3000 m contour lines demarcate the boundaries for the north, east, and southeast sides. As an inherent limitation of the observation range of TRMM/PR, the effective northern analysis boundary is positioned at approximately 36°N (Figure 1b).
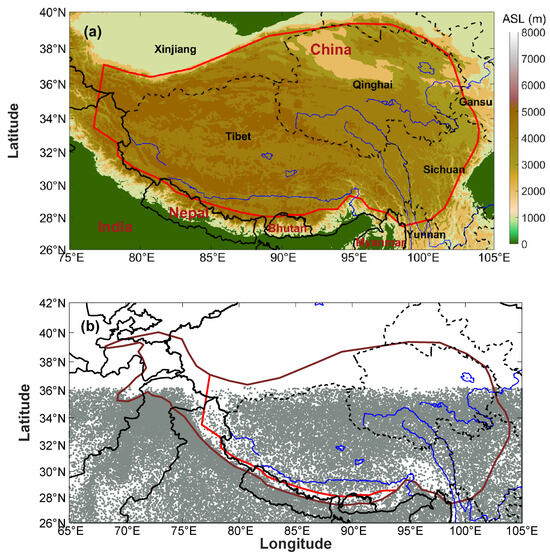
Figure 1.
Study region in the Qinghai–Tibet Plateau (QTP). (a) Topographic map depicting the study area enclosed by the red line, with altitude represented by color shading. (b) Visualization of the study area selection. Gray dots represent samples of RPFs with lightning, brown solid lines indicate 3000 m contours, and red solid lines represent the adjusted analytical boundaries for the southern and western areas of the QTP.
A total of 18,745 RPF thunderstorm samples were finally extracted in the analysis region, accounting for about 2.0% of all RPF samples there. There were 137,492 original LIS lightning samples, while 123,592 LIS flashes remained after quality control. The numbers of RPFs and flashes matched together are 14,650 and 40,762, respectively.
2.3. Analysis Methods
The analysis of thunderstorm structure encompasses its vertical and horizontal extension, flash rate, and flash density. Simultaneously, the lightning structure is characterized by flash duration, length, footprint, and radiance. Our focus lies on their spatial and temporal distributions in the QTP. For spatial distribution analysis, we employed a 1° × 1° grid, ensuring that the sample number of thunderstorms or flashes in a statistical grid was no less than 10. In examining monthly and diurnal changes in thunderstorm and lightning structure, a requirement was set that the number of thunderstorms and flashes in each statistical period should be no less than 20, with diurnal changes counted in 2 h intervals. Section 5 addresses the spatiotemporal correlation of different parameters, utilizing both Pearson correlation and Spearman correlation tests. The Pearson correlation gauges the linear correlation between two variables. The Spearman correlation evaluates the strength of the monotone relationship between two random variables, that is, the extent to which the two variables follow a trend of increasing or decreasing, even if no proportional relationship is maintained. Only results with the largest correlation coefficients are presented, and it is important to note that all shown correlation results have passed the significance level test of 5%.
3. Spatiotemporal Distributions of Thunderstorm Structure over the QTP
3.1. Vertical and Horizontal Extensions of Thunderstorms
We utilized the 20 and 30 dBZ PR echo top heights (abbreviated as H20dBZ and H30dBZ, respectively) and heights at the 20 and 30 dBZ PR echo tops relative to the ground (abbreviated as RH20dBZ and RH30dBZ, respectively) to characterize the vertical development characteristics of thunderstorms in the QTP. The areas of regions with PR reflectivity greater than 20 (A>20dBZ) and 30 dBZ (A>30dBZ) within thunderstorms were employed to characterize the horizontal extension of QTP thunderstorms.
It is worth noting that H20dBZ and H30dBZ were directly provided in the RPF data, while RH20dBZ and RH30dBZ were obtained by subtracting the topographic height of the corresponding location from H20dBZ and H30dBZ. Additionally, the RPF only provides the area of the region with a composite reflectivity greater than 20 dBZ. A>30dBZ was derived by selecting the maximum areas with reflectivity greater than 30 dBZ at all 16 altitude levels (1 km apart) provided by the RPF. Zheng and Zhang [18] reported, based on TRMM/RPF, that the maximum A>30dBZ of QTP thunderstorms tends to occur at an altitude of 5 km.
It is important to mention that we chose to analyze the echo top height and regional area defined by 30 rather than 40 dBZ, a threshold commonly used in the analysis of plain thunderstorms and typically associated with lightning occurrence. Among the RPFs with lightning in the analysis region, only about 42.2% had reflectivity greater than 40 dBZ, while approximately 96.2% had reflectivity greater than 30 dBZ. In comparison, Zheng and Zhang [18] reported that, among thunderstorms in Central and Eastern China and the southern Himalaya foothills, samples with reflectivity exceeding 40 and 30 dBZ both exceeded 90%. This highlights that the 30 dBZ threshold for QTP thunderstorms is more representative.
3.1.1. Spatial Distribution
Figure 2a,b depict the spatial distributions of the H20dBZ and H30dBZ of thunderstorms in the QTP, respectively. A noticeable north–south contrast in the vertical development of QTP thunderstorm clouds is evident, with southern thunderstorms generally reaching higher altitudes than their northern counterparts. In the regions to the south of the 32°N latitude, H20dBZ generally exceeds 11.2 km, and H30dBZ generally surpasses 9.3 km. H20dBZ reveals two distinct regions with average values greater than 12 km (Figure 2a). One is situated in the southeastern QTP, centered around approximately 98°E, 29.5°N, coinciding with several prominent northwest–southeast-oriented mountain ranges. The other center is around 86.5°E, 29.5°N, with an average H20dBZ exceeding 12.2 km at its core. These locations also represent centers with high values for H30dBZ, averaging over 9.8 km (Figure 2b). Additionally, other significant centers with high H30dBZ values are found at 95.5°E, 32°N; 100.5°E, 32°N; and 84.5°E, 30°N in the southern QTP. Regions with lower average H20dBZ and H30dBZ values are primarily located in the northeastern and northwestern QTP and on the west side of the great bend of the Brahmaputra River. In these areas, the average H20dBZ is generally below 10.5 km, and the average H30dBZ is generally below 9 km. Zheng and Zhang [18] reported that the average echo top heights for thunderstorms across the entire QTP was approximately 11.1 km for 20 dBZ and 9.3 km for 30 dBZ. Qie et al. [25], who divided the QTP into eastern, central, and western regions, found that the average 20 dBZ echo top heights of thunderstorms were about 11.1, 11.1, and 10.8 km, respectively, while the average 30 dBZ echo top heights were about 9.5, 9.4, and 9.2 km, respectively. Their results indicated no significant differences among these regions. This may be attributed to their division of regions in the east–west direction, which failed to capture the north–south contrast characteristic of the vertical development of thunderstorms in the QTP. Furthermore, the high-value region of thunderstorm vertical development in Figure 2a,b exhibit a spatial correlation with the high-value center of the probability distribution with a brightness temperature lower than −52 °C, as provided by Ma et al. [28] in their figure 4, based on geostationary satellite data.
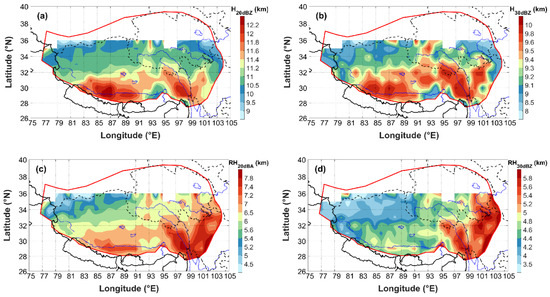
Figure 2.
Geographic distributions of average (a) H20dBZ, (b) H30dBZ, (c) RH20dBZ, and (d) RH30dBZ of thunderstorms over the QTP.
Figure 2c,d illustrate the spatial distributions of RH20dBZ and RH30dBZ of QTP thunderstorms, respectively. As these values account for terrain height, they can offer insights into the depth of the updraft in QTP thunderstorms. In the region to the south of 32°N and east of 99°E on the QTP, the mean value of RH20dBZ generally exceeds 6.5 km. Correspondingly, in the southeastern QTP where RH20dBZ exceeds 7 km, RH30dBZ is generally greater than 5 km. Lower values of RH20dBZ and RH30dBZ are primarily found in the northwestern QTP, specifically to the north of 30°N and west of 91°E, where values are generally below 6 km and 4.4 km, respectively. Overall, the distribution of RH20dBZ and RH30dBZ in the QTP is characterized by both north–south contrast (more noticeable in RH20dBZ) and east–west contrast (more apparent in RH30dBZ).
Comparing the spatial distribution of H20dBZ and H30dBZ with RH20dBZ and RH30dBZ reveals significant differences in the northeast and east border regions of the QTP. While H20dBZ and H30dBZ are low in these regions, RH20dBZ and RH30dBZ are relatively high. In the southwestern QTP, specifically at 83–91°E and 29–31°N, local centers with high values of H20dBZ and H30dBZ are observed, but the values of RH20dBZ and RH30dBZ are moderate and not particularly prominent.
Figure 3 illustrates a significant east–west contrast in the horizontal extension of thunderstorms over the QTP. Specifically, the eastern QTP exhibits a larger horizontal extension of thunderstorms compared to the western QTP. In the eastern QTP, the average A>20dBZ is generally greater than 1000 km2, and A>30dBZ is generally greater than 180 km2. Conversely, the western QTP shows smaller values for both A>20dBZ and A>30dBZ. The mean values of A>20dBZ and A>30dBZ exhibit highly similar spatial distribution patterns. The maximum value center is situated near the eastern boundary of the analysis region, around longitude 102°E and latitude 29–34°N. Here, A>20dBZ can exceed 2000 km2, and A>30dBZ can surpass 600 km2. Notably, there is a localized area centered around 97°E, 29.5°N where A>20dBZ is less than 1000 km2, and A>30dBZ is less than 200 km2, despite the high vertical development of thunderstorms (Figure 2). Thunderstorms in the western QTP exhibit minimal horizontal expansion and are generally smaller in the westward direction. For instance, in regions to the west of 85°E, A>20dBZ is generally less than 700 km2, and A>30dBZ is generally less than 140 km2.
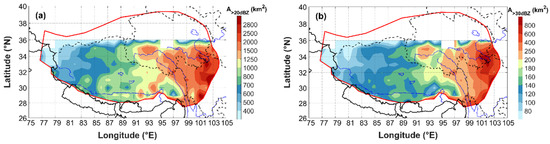
Figure 3.
Geographic distributions of average (a) A>20dBZ and (b) A>30dBZ of thunderstorms over the QTP.
Zheng and Zhang [18] reported an average A>20dBZ of 1182 km2 for QTP thunderstorms. Qie et al. [25] highlighted significant variations in the horizontal expansion of thunderstorm clouds across the eastern, central, and western QTP, with the largest expansion observed in the east and the smallest in the west, aligning with the overall geographical distribution pattern presented in Figure 3. Additionally, Zheng et al. [43] discovered that the A>20dBZ regional statistical value for deep convective clouds, as observed by TRMM PR, was approximately one order of magnitude higher than that observed by the ground-based radar in their analysis of deep convection clouds in Naqu (a city located in the central QTP). They attributed this difference to the lower horizontal spatial resolution of TRMM PR compared to the ground-based radar, suggesting that smaller-scale convective clouds may not be captured by TRMM PR. Moreover, they found similarities between TRMM PR and ground-based radar observations at 20 and 30 dBZ echo top heights. Based on these findings, it is speculated that if smaller thunderstorm samples are considered, the actual horizontal expansion of QTP thunderstorms could be smaller than currently indicated in Figure 3a,b.
3.1.2. Temporal Variation
The monthly variations in the vertical and horizontal extensions of thunderstorms over the QTP are illustrated in Figure 4a. Both H20dBZ and H30dBZ exhibit a single-peak pattern in their monthly variations. Their average values increase from 9.5 and 7.8 km in March to a peak of 11.7 and 9.7 km in August, followed by a decline to 10.2 and 9.0 km in October, respectively. Similar to the monthly variation in H20dBZ and H30dBZ, RH20dBZ and RH30dBZ peak at 7.0 km and 5.0 km in August. However, the difference lies in the fact that RH20dBZ and RH30dBZ demonstrate an oscillating change trend from March to May. The valley value of RH20dBZ is 5.5 km, occurring in May, while RH30dBZ has a valley value of 4.0 km in March. In contrast, A>20dBZ and A>30dBZ display entirely different monthly variation patterns. A>20dBZ reaches its maximum value of about 2200 km2 in March, subsequently dropping to around 1100 km2 in May. It then fluctuates between approximately 1000 and 1400 km2 from May to October, showing no distinct trend. The lowest value occurs in August, at about 1070 km2. A>30dBZ experiences a rapid rise from June to approximately 240 km2, fluctuating between about 230 km2 and 250 km2 until September. It then begins to decline, with the lowest value appearing in May (about 150 km2). The variation observed, with A>20dBZ being smaller from May to October and larger in March and April, may be attributed to the predominance of thermally driven thunderstorms with smaller-scale samples during the former period. Conversely, thunderstorms in the latter period are more likely to occur under favorable circulation conditions, potentially exhibiting a larger horizontal extension but a weaker lightning yield. During their data control processes, Du et al. [23] and Ma and Zheng [24] both identified abnormal thunderstorm samples characterized by a relatively large area but a relatively low frequency of flashes, predominantly correlating with thunderstorms in cold seasons. On the other hand, the variation pattern of A>30dBZ suggests the sensitivity of 30 dBZ reflectivity to convective enhancement over the QTP.
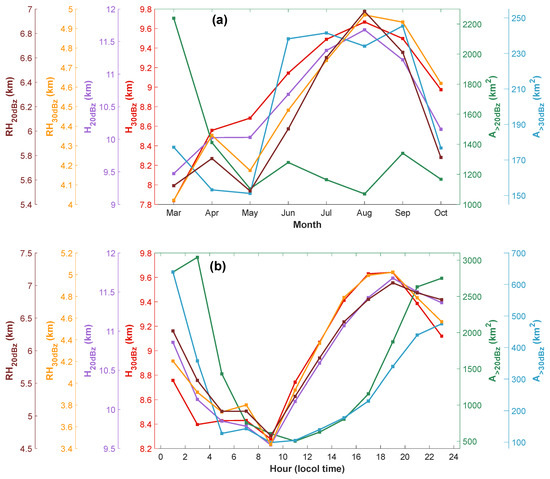
Figure 4.
Temporal variations in average vertical and horizontal expansion characteristics of QTP thunderstorms: (a) monthly variation and (b) diurnal variation. The corresponding standard deviations are shown in Tables S1 and S2 in the Supplementary Materials.
The diurnal variations in thunderstorm vertical and horizontal extent parameters are depicted in Figure 4b. Both the mean vertical and horizontal extensions of thunderstorms exhibit similar diurnal patterns. For instance, they all reach their lowest values between 8:00 and 10:00 LT (H20dBZ, H30dBZ, RH20dBZ, RH30dBZ, and A>30dBZ) or 10:00 and 12:00 LT (A>20dBZ) and show a general increase during the afternoon. H20dBZ, H30dBZ, RH20dBZ, and RH30dBZ peak at 18:00–20:00 LT (11.7, 9.6, 7.0, and 5.0 km, respectively), while the peaks of A>20dBZ and A>30dBZ (3000 and 640 km2, respectively) are reached at 2:00–4:00 LT and 0:00–2:00 LT, respectively. All parameters exhibit a decreasing trend between 4:00 LT and 10:00 LT. The diurnal variation in the vertical and horizontal extensions of thunderstorms underscores the significant role of solar heating in the development of QTP convection, which is a key factor contributing to the evident diurnal variation in thunderstorms, deep convection, and lightning activities [16,43,44].
3.2. Flash Rate and Density of Thunderstorm
We explored two parameters: flash rate and flash density of the thunderstorms. Flash rate of thunderstorm denotes the frequency of lightning flashes per minute within the thunderstorm, while flash density of thunderstorm is computed by dividing the flash rate by A>20dBZ and A>30dBZ, respectively.
3.2.1. Spatial Distribution
The geographic distributions of parameters related to lightning activity within thunderstorms are presented in Figure 5. The flash rate of thunderstorms exhibits an initial west–east contrast followed by a north–south contrast (Figure 5a). Across most areas of central and western QTP, the average flash rates of thunderstorms are below 2.0 flashes per minute (fl min−1), while near the southern and western borders of the analysis area, thunderstorms have average flash rates smaller than 1.4 fl min−1. Over the eastern boundary area, average flash rates of thunderstorms can exceed 2.5 fl min−1. Notably, over Naqu City (approximately located around 92°E, 32°N), the average flash rate of thunderstorm ranges between approximately 1.6 and 2.0 fl min−1, aligning with the range of 1.0–2.0 fl min−1 suggested by Zhang et al. [45], who derived the range from investigations of thunderstorm cases over Naqu. Zheng and Zhang [18] reported an average flash rate of 1.82 fl min−1 for QTP thunderstorms, with a median of 0.95 fl min−1.
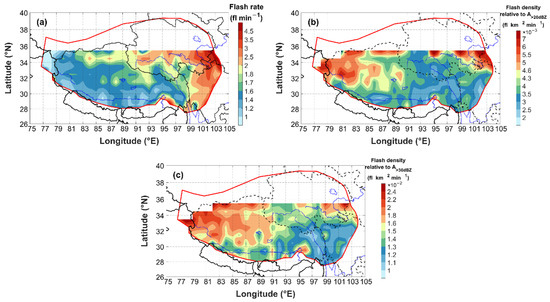
Figure 5.
Geographic distributions of average (a) flash rate per minute, (b) flash density relative to A>20dBZ per minute, and (c) flash density relative to A>30dBZ per minute for thunderstorms over the QTP.
The flash densities of thunderstorms over the QTP (Figure 5b,c) show a distinct geographic distribution pattern compared to the flash rate of thunderstorm. Generally, thunderstorms over the western QTP and the northeastern corner of the analysis region exhibit higher flash density, with average flash densities relative to A>20dBZ and A>30dBZ generally exceeding 4 × 10⁻³ and 1.6 × 10⁻² fl km−2 min−1, respectively. Most areas over the central and eastern QTP have lower flash densities. The southeastern QTP features the lowest flash density of thunderstorms. Zheng and Zhang [18] reported a flash density relative to A>20dBZ of approximately 4.01 × 10⁻³ fl km−2 min−1 for thunderstorms in the QTP.
3.2.2. Temporal Variation
In the monthly variation (Figure 6a), the flash rate of thunderstorms strengthens from March to June, reaching its peak value of 2.1 fl min−1 in June. Subsequently, it gradually declines, with a brief increase in September before another decline. The peak flash density of thunderstorms relative to A>20dBZ occurs in July (4.3 × 10⁻³ fl km−2 min−1). During the same period, A>20dBZ does not show substantial changes from May to September (the primary lightning season) (Figure 4a). The flash densities of thunderstorms relative to A>30dBZ peaks in May (1.8 × 10⁻² fl km−2 min−1) but decreases in the subsequent months when thunderstorms and lightning activity are relatively high.
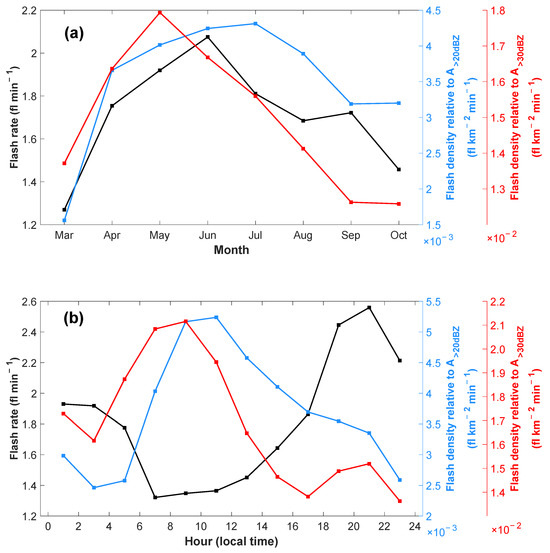
Figure 6.
Temporal variations in average flash rate and flash density of thunderstorms: (a) monthly variation and (b) diurnal variation. The corresponding standard deviations are shown in Tables S1 and S2 in the Supplementary Materials.
The diurnal variation in the flash rate of thunderstorms (Figure 6b) exhibits a peak value at 20:00–22:00 LT (2.6 fl min−1) and a valley value at 6:00–8:00 LT (1.3 fl min−1), indicating a continuous enhancement trend after solar heating. The peak average flash densities relative to A>20dBZ and A>30dBZ (5.2 × 10⁻³ and 2.1 × 10⁻² fl km−2 min−1, respectively) occur at 10:00–12:00 LT and 8:00–10:00 LT, respectively, and show a decreasing trend in the afternoon. This pattern is likely influenced by the continuous increase in A>20dBZ and A>30dBZ in the afternoon (Figure 3b).
4. Spatiotemporal Distributions of Lightning Structure over the QTP
4.1. Spatial Distribution
Figure 7 illustrates the geographical distribution pattern of lightning structure concerning flash duration, length, footprint, and radiance. While these parameters exhibit a general trend of being larger in the east compared to the west, notable differences persist in the distribution details.
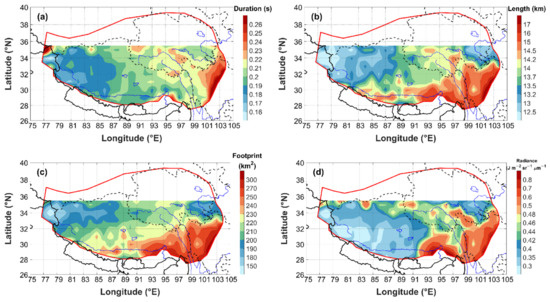
Figure 7.
Geographic distributions of average (a) flash duration, (b) flash length, (c) flash footprint, and (d) flash radiance over the QTP.
Figure 7a reveals that flash duration is highest in the eastern part of the analysis area, particularly near the boundary, where the maximum can exceed 0.22 s. In the regions to the east of 87°N, the average flash duration generally surpasses 0.2 s. Moreover, in areas to the east of 92°N, there is a northwest–southeast band with an average flash duration greater than 0.21 s. Conversely, in the western QTP, roughly corresponding to the Ali region, flash duration is the smallest, with the average value generally below 0.19 s.
The spatial distributions of flash length and footprint, representing the horizontal extension of lightning, are depicted in Figure 7b,c. Their patterns exhibit similarities, showing larger values in the east and smaller values in the west. Furthermore, there is a decreasing trend from southeast to northwest. In the southeastern QTP (approximately 92–103°E and 28–33°N), the average spatial extension of lightning is the greatest, with flash lengths generally exceeding 14.5 km, and footprints reaching over 230 km2. In the central region to the north of 30°N, the average flash length approximately ranges from about 13.5 to 14.5 km, with footprints between 200 and 230 km2. The minimum lightning spatial extension is observed in the northeast and west of the analysis region, where the average flash length is generally less than 13.5 km and, in some areas, even less than 12.5 km. The average flash footprint is generally less than 200 km2 in these regions. According to Zheng and Zhang [18], the median and mean flash lengths over the entire QTP are 12.6 and 13.9 km, respectively.
Figure 7d illustrates the spatial distribution of flash radiance. Overall, this pattern is more analogous to the spatial distribution of lightning spatial extension. In the southeastern region near the boundary of the analysis area, the average flash radiance generally exceeds 0.48 J m−2 sr−1 μm−1, with maximum values surpassing 0.8 J m−2 sr−1 μm−1. Conversely, the northeastern area of the analysis region exhibits lower flash radiance, with average values generally below 0.46 J m−2 sr−1 μm−1. Unlike the spatial distribution pattern of lightning spatial extension, a notable low flash radiance is observed in the southwestern area of the analysis region, approximately corresponding to the region to the south of 33°N and between 79 and 90°E. Here, the average flash radiance is generally lower than 0.35 J m−2 sr−1 μm−1.
4.2. Temporal Variation
Figure 8a presents the monthly variations in flash structure, revealing distinctive patterns for lightning spatial extension compared to flash duration and radiance. Lightning spatial extension exhibit a large mean from November to March, corresponding to a period of reduced lightning activity [26,28]. Subsequently, it rapidly decreases from March to May, with the smallest recorded mean flash length (13.1 km) and footprint (201.6 km2) occurring in May. As lightning activity increases from May to September [26,28], lightning spatial extension demonstrates an increasing trend, reaching a phased peak in September. During this peak, the average flash length is 14.6 km, and the average flash footprint is 235 km2. The monthly variation trend of flash duration closely mirrors that of flash radiance (Figure 8a). Both parameters reach their valleys in July, coinciding with the peaks of thunderstorm and lightning activities [26]. During this period, the average flash duration and flash radiance are approximately 0.19 s and 0.39 J m−2 sr−1 μm−1, respectively. In contrast, flash duration peaks in November, aligning with the highest values observed for flash spatial extension, with values of 0.29 s, and flash radiance peaks in March with value of 1 J m−2 sr−1 μm−1.
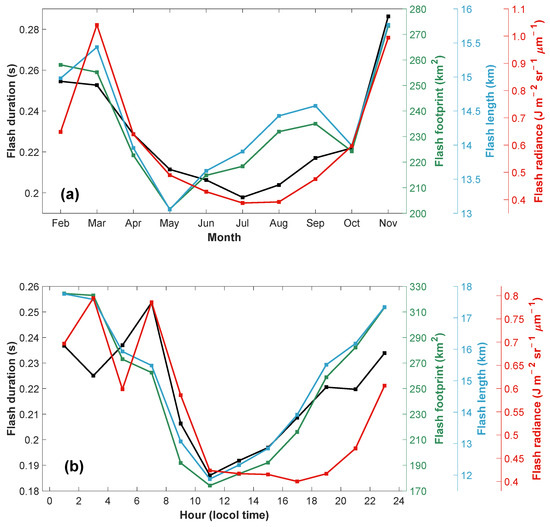
Figure 8.
Monthly (a) and diurnal (b) variations in average lightning structural parameters. The corresponding standard deviations are shown in Tables S1 and S2 in the Supplementary Materials.
The diurnal variation in lightning structure is evident (Figure 8b). The spatial extension of lightning reaches its valley value at 10:00–12:00 LT, corresponding to mean flash length and footprint values of 11.9 km and 174.1 km2, respectively. Prior to midnight, there is a noticeable growth trend in the spatial extension of lightning, with flash length and footprint peaking at 0:00 to 2:00 LT (17.8 km and 324.4 km2, respectively), followed by a gradual decline. The diurnal variation in flash duration closely resembles that of the spatial extension of lightning, particularly the general increasing trend in the afternoon after reaching the valley (approximately 0.19 s) at 10:00–12:00 LT. In the early morning hours, flash duration exhibits fluctuations and ultimately peaks at 6:00–8:00 LT with a value of about 0.25 s. Flash radiance attains its peak value of 0.8 J m−2 sr−1 μm−1 at 2:00–4:00 LT, experiences fluctuations, and rapidly decreases at 6:00–12:00 LT. Unlike the spatial extension and duration of lightning, flash radiance exhibits a gradual decline after 12:00 LT until reaching the minimum value of 0.42 J m−2 sr−1 μm−1 at 16:00–18:00 LT, followed by a rapid increase to the peak value at 2:00–4:00 LT.
5. Discussion on the Correlations between Thunderstorm and Lightning Structures
5.1. Correlation between Vertical and Horizontal Extension of Thunderstorms
Upon comparing Figure 2 and Figure 3, it becomes evident that RH20dBZ and RH30dBZ (Figure 2c,d) share similarities with A>20dBZ and A>30dBZ in their spatial distributions. All parameters exhibit larger values in the east and smaller values in the west, differing from H20dBZ and H30dBZ, which demonstrate larger values in the south and smaller values in the north. Computed based on parameter averages within 1° × 1° grid boxes, the spatial correlations of RH20dBZ with A>20dBZ and A>30dBZ yield coefficients of 0.61 (Spearman correlation) and 0.68 (Spearman correlation), respectively. Similarly, the spatial correlation coefficients of RH30dBZ with A>20dBZ and A>30dBZ are 0.75 (Spearman correlation) and 0.83 (Spearman correlation), respectively. Based on the analysis, it is evident that a fixed threshold reflectivity echo top height may not accurately capture the convective intensity differences in thunderstorms across various regions of the QTP, given the potential kilometer-level variations in topographic heights. RH20dBZ and RH30dBZ emerge as more reliable indicators of the convective intensity characteristics of QTP thunderstorms. This stems from their ability to account for the influence of ground height, providing a clearer reflection of the vertical extension depth of airflow. The thermodynamic driving forces play a pivotal role in QTP convective activity. In thermally driven individual thunderstorms, robust updrafts not only vertically transport hydrometeors but also induce horizontal diffusion of hydrometeors in the middle and upper layers, thereby expanding the cloud area. Even if the vertical development of the thunderstorm cloud remains relatively constant (potentially limited by the troposphere top), the horizontal expansion may continue to grow, especially during prolonged thunderstorm durations. Consequently, the positive correlation between the area of the QTP thunderstorm cloud and the strength and duration of the updraft becomes apparent. Therefore, the overall convection intensity in the eastern QTP should surpass that in the western QTP.
5.2. Correlations of Flash Rate and Density with Vertical and Horizontal Extension of Thunderstorms
The flash rate of a thunderstorm serves as a measure of its capacity to produce lightning. A comparison between Figure 2, Figure 3, and Figure 5a reveals a notable similarity in the spatial distribution patterns of the thunderstorm’s flash rate and its horizontal extension. Broadly speaking, regions characterized by a large (small) horizontal extension of the thunderstorm tend to exhibit a high (low) flash rate of thunderstorm. Calculating the spatial correlation coefficients based on the mean flash rate of the thunderstorm and the means of A>20dBZ and A>30dBZ in 1° × 1° grids, we determined these coefficients to be 0.73 (Pearson correlation) and 0.80 (Pearson correlation), respectively. Furthermore, their diurnal correlation coefficients were found to be 0.81 (Spearman correlation) and 0.84 (Spearman correlation), respectively. These findings align with the positive correlation between horizontal expansion and convective intensity. Intense convection induces the horizontal diffusion of hydrometeors, leading to the spread of high-density charges and the enlargement of high-density charge regions capable of supporting lightning discharges. Consequently, this results in a greater number of lightning flashes during periods of relatively strong convection.
The flash density of thunderstorms can be considered as a metric for assessing the efficiency of lightning generation by thunderstorms. It generally exhibits a larger magnitude in the west and a smaller magnitude in the east, inversely correlating with the relative height, horizontal extension, and flash rate of thunderstorms. Specifically, the spatial correlation coefficients of flash densities relative to A>30dBZ with RH20dBZ and RH30dBZ are −0.75 (Spearman correlation) and −0.74 (Spearman correlation), respectively. In diurnal variations, when convection intensifies in the afternoon (Figure 6b), the flash density of thunderstorms shows a decreasing trend, contrary to the variation trends observed in other thunderstorm structural parameters. As the charging region of thunderstorms is predominantly situated in the convective area, the horizontal expansion of thunderstorms, while extending the range of charged particles, results in a decrease in charge concentration with distance. This phenomenon contributes to a reduction in the average charge concentration across the entire area of thunderstorms and may be a significant factor underlying the overall inverse correlation between flash density and the flash rate of thunderstorms.
5.3. Relationships among Different Lightning Structural Parameters
The flash duration, horizontal extension scale, and radiance are roughly consistent in spatiotemporal distributions (Figure 7 and Figure 8). In the spatial distribution in 1° × 1° grid boxes, the correlation coefficient between flash length and flash radiance is 0.75 (Pearson correlation) and that between flash length and flash duration is 0.69 (Spearman correlation); meanwhile, the correlation coefficient between flash radiance and flash duration is 0.71 (Spearman correlation). Analysis based on flash samples shows the corresponding correlations of 0.76 (Spearman correlation), 0.41 (Pearson correlation), and 0.54 (Spearman correlation), respectively. It can be seen that flash spatial extension is more correlated with flash radiance, while they have relatively weak relationships with flash duration, which agrees with previous studies employed in other regions [17,46] or the thunderstorm case [47].
The lack of a significant correlation between flash duration and flash spatial extension can be attributed to various factors. Certain discharge processes may occur within pre-existing channels, resulting in limited channel extension but prolonged flash duration. Additionally, variations in the propagation speed of the lightning channel can occur in different environments [47]. Hence, even if the lightning channel expands to the same scale, the time required for this expansion may differ. The relatively strong association between flash spatial expansion and radiance may be explained by a larger lightning scale indicating a broader range and involvement of more charges in the discharge, thereby contributing to an intensified cumulative flash radiance.
5.4. Association of Lightning Structure with Thunderstorm Structure
In recent years, several studies have investigated the relationship between lightning structure and thunderstorm structure. Bruning and MacGorman [48] reported that, in supercell thunderstorms, the horizontal extension of lightning is small in the region around and near the updraft, while in the region far away from the updraft, the horizontal extension of lightning is large. Subsequent studies have supported similar findings [47,49,50,51,52,53]. Some studies [47,50,54,55] proposed that, in areas with intense convection, strong updraft, wind shear, and entrainment can result in fragmented charge regions. They use the term “charge pockets” to describe this charge distribution pattern, where lightning is frequently initiated due to the proximity of different-polarity charge regions. However, lightning tends to have a small horizontal extension because its channels are constrained by the small scale of the charge regions. Conversely, in regions with relatively weak convection, a vertically layered charge structure predominates. In this case, charge regions mainly expand in the horizontal direction, leading to a relatively large horizontal extension. In such situations, the flash rate of the thunderstorm is relatively low, but the lightning channels can propagate over a considerable range, forming a large horizontal extension. Studies have noted that this inverse correspondence between convection intensity and flash extension also holds when comparing some different types of thunderstorms, such as winter and summer thunderstorms [56], marine and land thunderstorms [17,46,57,58,59], supercells and normal thunderstorms [47,60], and morning and afternoon thunderstorms [61]. This forementioned concept is utilized to explain differences in convection intensity, flash rate of thunderstorm, and flash spatial extension between various types of thunderstorms; specifically, thunderstorms characterized by strong and weak convections are more likely to be dominated by the patterns of charge pockets and horizontally broad charge regions, respectively [18,61].
Interestingly, when examining the spatial and temporal distributions of thunderstorm structure and lightning structure over the QTP, the relationship between thunderstorm convection intensity and flash extension is not strictly inverse. For the subsequent analysis, we utilize flash length as a representation of the spatial extension of lightning.
In the spatial distributions, the flash length (Figure 7b) exhibits a rough similarity to the RH20dBZ and RH30dBZ of thunderstorms (Figure 2c,d). For instance, they all indicate large values in the southeastern QTP, secondary large values in the southern QTP, and small values in the western and northwestern QTP. Considering their mean values on the 1° × 1° grid, the Spearman correlation coefficients between flash length and RH20dBZ, as well as between flash length and RH30dBZ, are 0.50 and 0.44, respectively, indicating a somewhat positive correlation.
In terms of temporal variation, the extension of lightning and the convection intensity of the thunderstorm also exhibit somewhat synchronous changes. For instance, in their monthly variations, the vertical extension of thunderstorms (Figure 4a) and lightning extension (Figure 8a) both show an overall increasing trend from May to September. Concerning diurnal variation, the correlation appears to be even more pronounced; flash length (Figure 8b) and the vertical and horizontal extension of thunderstorms (Figure 4b) all demonstrate an increasing trend in the afternoon and a decreasing trend in the early morning. We observed that the thunderstorm structural parameters slightly precede the lightning extension in diurnal variation (comparing peak and valley). If the relevant thunderstorm structural parameters were shifted backward by 2 h, the correlation coefficients of flash length with RH20dBZ, RH30dBZ, A>20dBZ, and A>30dBZ were 0.69 (Pearson correlation), 0.69 (Pearson correlation), 0.91 (Spearman correlation), and 0.94 (Spearman correlation), respectively.
In terms of climatic statistics, the convection intensity and lightning extension seem to be positively correlated in QTP, contrary to the inverse correspondence suggested by previous studies. Both You et al. [17] and Zheng and Zhang [18] expressed a view in their discussions: within the context of generally weak convective intensity, convective enhancement primarily causes intensifying microphysical and electrification processes. This leads to an increase in the electrification rate within the cloud and the expansion of the high charge concentration region, resulting in a simultaneous increase in lightning rate and the spatial extension of lightning. Only when the convective intensity surpasses a certain threshold does the charge region begin to fragment, leading to an increase in lightning rate and a decrease in lightning scale.
Generally, the convection intensity of QTP thunderstorms or convective systems is weaker than that in other regions [16,18,42,43]. Additionally, Zheng and Zhang [18] compared the scales of lightning extension and the regions with radar echo greater than 30 dBZ of QTP thunderstorms in the mixed-phase region, found them to be comparable, and suggested that the charge region within QTP thunderstorms should be relatively intact in distribution rather than fragmented. Therefore, we speculate that the positive correspondence between thunderstorm convection intensity and lightning extension in spatiotemporal distributions on QTP may be related to the overall weak convection of QTP thunderstorms, supporting the explanation by You et al. [17] and Zheng and Zhang [18].
Furthermore, from the perspective of thunderstorm samples, we matched each thunderstorm structural parameter to its corresponding average lightning extension scale to understand the correlation between them. However, we found that the correlation was very weak. Possible reasons for this weak correlation include significant differences in the structures of thunderstorms and flashes among different regions of QTP and the limited representativeness of lightning structure due to the short TRMM/LIS observation time (80–90 s) with the typically low lightning frequency of QTP thunderstorms (usually 1–2 fl min−1), leading to a small lightning sample number for an RPF with lightning. To pursue statistical regularity, we sorted the samples based on the values of the thunderstorm structural parameters, divided the samples into 10 categories using the 10, 20, …, 90 deciles of the values as thresholds, and then calculated the average values of the thunderstorm structure parameters and flash length in each category, analyzing their linear correlations. The result is shown in Figure 9.
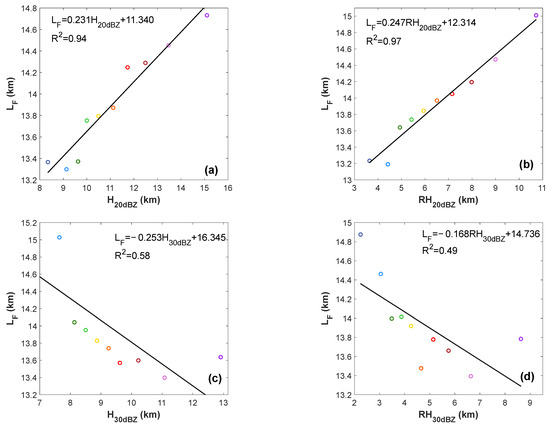
Figure 9.
The correlation between the mean value of flash length (LF) and (a) H20dBZ, (b) RH20dBZ, (c) H30dBZ, and (d) RH30dBZ based on sample classification.
Figure 9 presents compelling information. Firstly, it is evident that, as thunderstorms H20dBZ and RH20dBZ increase, there is a corresponding upward trend in flash length (Figure 9a,b). Conversely, as thunderstorms H30dBZ and RH30dBZ increase, there is an overall decreasing trend in flash length (Figure 9c,d).
These analytical findings may suggest the intricate relationship between the convective intensity of thunderstorms and lightning extension on the QTP when considering individual samples. H20dBZ and RH20dBZ, as well as H30dBZ and RH30dBZ, could be associated with varying levels of convection intensity. For example, in the study of deep convective clouds in Naqu using ground-based radar, Zheng et al. [43] discovered that, although H20dBZ and H30dBZ exhibit similar diurnal variation trends, H30dBZ experiences slower growth during its intensification stage and declines more rapidly during its decay stage compared to H20dBZ. This suggests that weak updrafts may contribute to H20dBZ having higher values, but for QTP thunderstorms, only relatively strong updrafts may support H30dBZ in reaching significant heights. Consequently, the positive correlation between H20dBZ, RH20dBZ, and lightning extension may imply that, for QTP thunderstorms with weak convection, enhanced convection positively corresponds to the lightning extension. Conversely, thunderstorms with relatively strong convection in the QTP may follow the trend of increasing convection and decreasing lightning extension scale, aligning with the suggestion from previous studies.
6. Conclusions
Utilizing the TRMM/RPF dataset and TRMM/LIS lightning observation data, we investigated the spatiotemporal distributions of thunderstorm and lightning structures over the QTP and examined the interrelationships among various structural parameters. This aspect, crucial when assessing the impact of thunderstorm and lightning activity on atmospheric processes, had not been explored previously. The following conclusions were drawn.
The vertical extension of southern QTP thunderstorms surpasses that in the northern region, with average H20dBZ and H30dBZ generally exceeding 11.2 and 9.3 km, respectively, south of 32°N latitude. The thunderstorm vertical extension relative to the surface shows a discernible east–high and west–low pattern, with average RH20dBZ above 7 km and RH30dBZ above 5 km in the eastern and southeastern QTP. Monthly variations indicate an increase in the thunderstorm vertical extension from May to August. Diurnal variations show an upward trend in the afternoon and a decline in the early morning for the thunderstorm vertical extension.
The horizontal extension of thunderstorms is larger in the eastern QTP than the western QTP. East of 91°E, the average A>20dBZ and A>30dBZ consistently exceed 1000 and 180 km2, respectively. During the summer season, the average A>20dBZ and A>30dBZ fluctuate between approximately 1000 and 1400 km2 and between about 230 and 250 km2, respectively. In diurnal variation, the horizontal extension of thunderstorms increases in the afternoon and diminishes in the early morning, with the peak and valley showing a lag compared to the vertical extension.
Thunderstorm flash rates are higher in the eastern QTP than the western QTP, and in the northern QTP compared to the southern QTP. Central–western QTP thunderstorms mostly have flash rates below 2.0 fl min−1, while the thunderstorm in specific areas in the eastern QTP exceed 2.5 fl min−1. Conversely, flash density of thunderstorms is greater in the western and northeastern QTP and smaller in the southeast. Both flash rate and density of thunderstorms experience an initial increase followed by a decline from March to October. In diurnal variation, the thunderstorm flash rate rises from 8:00 to 22:00 LT, while the thunderstorm flash density peaks in the morning and declines in the afternoon.
Flash duration, spatial extension, and radiance show larger averages in the eastern QTP than the western QTP. The average flash duration can exceed 0.22 s near the eastern border, and in the southeastern QTP, the average flash length and radiance may exceed 14.5 km and 0.50 J m−2 sr−1 µm−1, respectively. Flash duration in the western QTP, flash length in the northeastern and western QTP, and flash radiance in the southwestern QTP are relatively smaller, generally below 0.19 s, 13.5 km, and 0.35 J m−2 sr−1 µm−1, respectively. Flash duration and radiance are smaller in the season with active lightning, while the horizontal extension of lightning increases from May to September. In the afternoon, lightning structural parameters exhibit an overall increasing trend, except for flash radiance.
The 20 and 30 dBZ echo top heights relative to the surface are effective indicators of thunderstorm convective intensity. In spatial distribution, RH20dBZ and RH30dBZ show similarities to A>20dBZ and A>30dBZ, indicating stronger convective intensity in the eastern QTP than in the western QTP. The thunderstorm flash rate (density) generally correlates positively (negatively) with the relative vertical and horizontal extensions of thunderstorms in their spatiotemporal distributions. Among lightning structure parameters, horizontal extension and radiance exhibit a stronger correlation. Flash length shows a positive spatial and temporal correlation with the RH20dBZ and RH30dBZ of QTP thunderstorms. In classified statistical analysis, flash length correlates positively with H20dBZ and RH20dBZ and negatively with H30dBZ and RH30dBZ. This outcome suggests that the lightning extension and convection intensity may change in the same direction when the convection intensity is relatively weak, and in the opposite direction when the convection intensity is relatively strong.
Supplementary Materials
The following supporting information can be downloaded at: https://www.mdpi.com/article/10.3390/rs16030468/s1.
Author Contributions
Conceptualization, D.Z.; methodology, D.Z. and Y.D.; software and validation, Y.D. and X.F.; formal analysis, Y.D. and D.Z.; investigation, D.Z., Y.D., Y.Z., W.Y. and L.X.; resources, D.Z., Y.D., Y.Z., W.Y., L.X. and X.F.; data curation, Y.D. and D.Z.; writing—original draft preparation, Y.D., D.Z. and Y.Z.; writing—review and editing, D.Z. and Y.Z.; visualization, Y.D.; supervision, D.Z., Y.Z., W.Y. and L.X.; project administration, D.Z., Y.Z. and W.Y.; funding acquisition, D.Z., Y.Z. and X.F. All authors have read and agreed to the published version of the manuscript.
Funding
This study is funded by the National Natural Science Foundation of China (U2342215), the Second Tibetan Plateau Scientific Expedition and Research Program (2019QZKK0104) and Regional Collaborative Innovation Project of Science and Technology of Tibet Autonomous Region (QYXTZX-NQ2023-01).
Data Availability Statement
The data associated with this paper can be accessed from https://doi.org/10.5281/zenodo.10408363 (accessed on 12 December 2023) or from the corresponding author.
Conflicts of Interest
The authors declare no conflicts of interest.
References
- Bian, J.; Li, D.; Bai, Z.; Li, Q.; Lyu, D.; Zhou, X. Transport of Asian surface pollutants to the global stratosphere from the Tibetan Plateau region during the Asian summer monsoon. Natl. Sci. Rev. 2020, 7, 516–533. [Google Scholar] [CrossRef]
- Liu, Y.; Lu, M.; Yang, H.; Duan, A.; He, B.; Yang, S.; Wu, G. Land–atmosphere–ocean coupling associated with the Tibetan Plateau and its climate impacts. Natl. Sci. Rev. 2020, 7, 534–552. [Google Scholar] [CrossRef] [PubMed]
- Wu, G. Land–air coupling over the Tibetan Plateau and its climate impacts. Natl. Sci. Rev. 2020, 7, 485. [Google Scholar] [CrossRef] [PubMed]
- Xu, X.D.; Zhou, M.Y.; Chen, J.Y.; Bian, L.G.; Zhang, G.Z.; Liu, H.Z.; Li, S.M.; Zhang, H.S.; Zhao, Y.J.; Suolongduoji; et al. A comprehensive physical pattern of land-air dynamic and thermal structure on the Qinghai-Xizang Plateau. Sci. China Ser. D-Earth Sci. 2002, 45, 577–594. [Google Scholar] [CrossRef]
- Zhao, P.; Li, Y.; Guo, X.; Xu, X.; Liu, Y.; Tang, S.; Xiao, W.; Shi, C.; Ma, Y.; Yu, X.; et al. The Tibetan Plateau Surface-Atmosphere Coupling System and Its Weather and Climate Effects: The Third Tibetan Plateau Atmospheric Science Experiment. J. Meteorol. Res. 2019, 33, 375–399. [Google Scholar] [CrossRef]
- Zhao, P.; Xu, X.; Chen, F.; Guo, X.; Zheng, X.; Liu, L.; Hong, Y.; Li, Y.; La, Z.; Peng, H.; et al. The Third Atmospheric Scientific Experiment for Understanding the Earth–Atmosphere Coupled System over the Tibetan Plateau and Its Effects. Bull. Am. Meteorol. Soc. 2018, 99, 757–776. [Google Scholar] [CrossRef]
- Fu, Y.; Ma, Y.; Zhong, L.; Yang, Y.; Guo, X.; Wang, C.; Xu, X.; Yang, K.; Xu, X.; Liu, L.; et al. Land-surface processes and summer-cloud-precipitation characteristics in the Tibetan Plateau and their effects on downstream weather: A review and perspective. Natl. Sci. Rev. 2020, 7, 500–515. [Google Scholar] [CrossRef]
- Fu, Y.F.; Liu, G.S.; Wu, G.X.; Yu, R.C.; Xu, Y.P.; Wang, Y.; Li, R.; Liu, Q. Tower mast of precipitation over the central Tibetan Plateau summer. Geophys. Res. Lett. 2006, 33. [Google Scholar] [CrossRef]
- Gordillo-Vázquez, F.J.; Pérez-Invernón, F.J.; Huntrieser, H.; Smith, A.K. Comparison of Six Lightning Parameterizations in CAM5 and the Impact on Global Atmospheric Chemistry. Earth Space Sci. 2019, 6, 2317–2346. [Google Scholar] [CrossRef]
- Guo, F.X.; Ju, X.Y.; Bao, M.; Lu, G.Y.; Liu, Z.P.; Li, Y.W.; Mu, Y.J. Relationship between lightning activity and tropospheric nitrogen dioxide and the estimation of lightning-produced nitrogen oxides over China. Adv. Atmos. Sci. 2017, 34, 235–245. [Google Scholar] [CrossRef]
- Zhang, W.J.; Meng, Q.; Ma, M.; Zhang, Y.J. Lightning casualties and damages in China from 1997 to 2009. Nat. Hazards 2011, 57, 465–476. [Google Scholar] [CrossRef]
- Li, J.L.; Wu, X.K.; Yuan, T.; Qie, X.S.; Yang, J. The temporal and spatial distribution of thunderstorms in Asia Monsoon Region based on the TRMM multi-sensor database. Chin. J. Geophys. Chin. Ed. 2019, 62, 4098–4109. [Google Scholar] [CrossRef]
- Xu, M.Y.; Qie, X.S.; Pang, W.J.; Shi, G.Y.; Liang, L.; Sun, Z.L.; Yuan, S.F.; Zhu, K.X.; Zhao, P.T. Lightning climatology across the Chinese continent from 2010 to 2020. Atmos. Res. 2022, 275, 106251. [Google Scholar] [CrossRef]
- Yuan, T.; Qie, X. Spatial and temporal distributions of lightning activities in China from satellite observation. Plateau Meteorol. 2024, 23, 488–494. [Google Scholar]
- Qie, X.S.; Zhang, T.L.; Chen, C.P.; Zhang, G.S.; Zhang, T.; Wei, W.Z. The lower positive charge center and its effect on lightning discharges on the Tibetan Plateau. Geophys. Res. Lett. 2005, 32. [Google Scholar] [CrossRef]
- Wu, X.; Qie, X.; Yuan, T. Regional distribution and diurnal variation of deep convective systems over the Asian monsoon region. Sci. China-Earth Sci. 2013, 56, 843–854. [Google Scholar] [CrossRef]
- You, J.; Zheng, D.; Zhang, Y.; Yao, W.; Meng, Q. Duration, spatial size and radiance of lightning flashes over the Asia-Pacific region based on TRMM/LIS observations. Atmos. Res. 2019, 223, 98–113. [Google Scholar] [CrossRef]
- Zheng, D.; Zhang, Y. New Insights Into the Correlation Between Lightning Flash Rate and Size in Thunderstorms. Geophys. Res. Lett. 2021, 48, e2021GL096085. [Google Scholar] [CrossRef]
- Guo, F.; Wang, M.; Huang, Z.; Li, Y.; Mu, Y.; Lian, C.; Zeng, F. The model analysis of lightning charge structure characters and attributions over Qinghai-Tibet Plateau. Plateau Meteorol. 2018, 37, 911–922. [Google Scholar]
- Li, Y.J.; Zhang, G.S.; Zhang, Y.J. Evolution of the Charge Structure and Lightning Discharge Characteristics of a Qinghai-Tibet Plateau Thunderstorm Dominated by Negative Cloud-to-Ground Flashes. J. Geophys. Res. Atmos. 2020, 125, e2019JD031129. [Google Scholar] [CrossRef]
- Proctor, D.E. Regions where lightning flashes began. J. Geophys. Res. Atmos. 1991, 96, 5099–5112. [Google Scholar] [CrossRef]
- Williams, E.R. The tripole structure of thunderstorms. J. Geophys. Res. Atmos. 1989, 94, 13151–13167. [Google Scholar] [CrossRef]
- Du, Y.; Zheng, D.; Ma, R.; Zhang, Y.; Lyu, W.; Yao, W.; Zhang, W.; Ciren, L.; Cuomu, D. Thunderstorm Activity over the Qinghai–Tibet Plateau Indicated by the Combined Data of the FY-2E Geostationary Satellite and WWLLN. Remote Sens. 2022, 14, 2855. [Google Scholar] [CrossRef]
- Ma, R.; Zheng, D. A dataset of thunderstorm features of the FY-2E full-disc observation area from 2010 to 2018. China Sci. Data 2023, 8. [Google Scholar] [CrossRef]
- Qie, X.; Wei, L.; Zhu, K.; Qie, K.; Xu, C.; Sun, Z.; Jiang, R.; Zhang, H.; Yuan, S. Regional differences of convection structure of thunderclouds over the Tibetan Plateau. Atmos. Res. 2022, 278, 106338. [Google Scholar] [CrossRef]
- Qie, X.S.; Toumi, R.; Yuan, T. Lightning activities on the Tibetan Plateau as observed by the lightning imaging sensor. J. Geophys. Res. Atmos. 2003, 108. [Google Scholar] [CrossRef]
- Qie, X.S.; Toumi, R.; Zhou, Y.J. Lightning activity on the central Tibetan Plateau and its response to convective available potential energy. Chin. Sci. Bull. 2003, 48, 296–299. [Google Scholar] [CrossRef]
- Ma, R.; Zheng, D.; Zhang, Y.; Yao, W.; Zhang, W.; Cuomu, D. Spatiotemporal Lightning Activity Detected by WWLLN over the Tibetan Plateau and Its Comparison with LIS Lightning. J. Atmos. Ocean. Technol. 2021, 38, 511–523. [Google Scholar] [CrossRef]
- Bruning, E.C.; Thomas, R.J. Lightning channel length and flash energy determined from moments of the flash area distribution. J. Geophys. Res. Atmos. 2015, 120, 8925–8940. [Google Scholar] [CrossRef]
- Mecikalski, R.M.; Carey, L.D. Radar Reflectivity and Altitude Distributions of Lightning as a Function of IC, CG, and HY Flashes: Implications for LNOx Production. J. Geophys. Res. Atmos. 2018, 123, 12796–12813. [Google Scholar] [CrossRef]
- Zhang, R.; Zhang, G.S.; Li, Y.J.; Wang, Y.H.; Wu, B.; Yu, H.; Liu, Y.X. Estimate of NOx production in the lightning channel based on three-dimensional lightning locating system. Sci. China-Earth Sci. 2014, 57, 1613–1625. [Google Scholar] [CrossRef]
- Boccippio, D.J.; Koshak, W.J.; Blakeslee, R.J. Performance assessment of the optical transient detector and lightning Imaging sensor. Part I: Predicted diurnal variability. J. Atmos. Ocean. Technol. 2002, 19, 1318–1332. [Google Scholar] [CrossRef]
- Kummerow, C.; Barnes, W.; Kozu, T.; Shiue, J.; Simpson, J. The tropical rainfall measuring mission (TRMM) sensor package. J. Atmos. Ocean. Technol. 1998, 15, 809–817. [Google Scholar] [CrossRef]
- Kummerow, C.; Simpson, J.; Thiele, O.; Barnes, W.; Chang, A.T.C.; Stocker, E.; Adler, R.F.; Hou, A.; Kakar, R.; Wentz, F.; et al. The status of the Tropical Rainfall Measuring Mission (TRMM) after two years in orbit. J. Appl. Meteorol. 2000, 39, 1965–1982. [Google Scholar] [CrossRef]
- Liu, C.; Zipser, E.J.; Cecil, D.J.; Nesbitt, S.W.; Sherwood, S. A Cloud and Precipitation Feature Database from Nine Years of TRMM Observations. J. Appl. Meteorol. Climatol. 2008, 47, 2712–2728. [Google Scholar] [CrossRef]
- Iguchi, T.; Meneghini, R.; Awaka, J.; Kozu, T.; Okamoto, K. Rain profiling algorithm for TRMM precipitation radar data. In Remote Sensing and Applications: Earth, Atmosphere and Oceans; Igarashi, T., Nakamura, K., Shimoda, H., Tanaka, T., Burrows, J.P., Nakajima, T., Talagrand, O., Naeije, M.C., Eds.; Advances in Space Research-Series; Elsevier: Amsterdam, The Netherlands, 2000; Volume 25, pp. 973–976. [Google Scholar]
- Cecil, D.J.; Buechler, D.E.; Blakeslee, R.J. Gridded lightning climatology from TRMM-LIS and OTD: Dataset description. Atmos. Res. 2014, 135, 404–414. [Google Scholar] [CrossRef]
- Christian, H.J.; Blakeslee, R.J.; Boccippio, D.J.; Boeck, W.L.; Buechler, D.E.; Driscoll, K.T.; Goodman, S.J.; Hall, J.M.; Koshak, W.J.; Mach, D.M.; et al. Global frequency and distribution of lightning as observed from space by the Optical Transient Detector. J. Geophys. Res. Atmos. 2003, 108, ACL4-1–ACL4-15. [Google Scholar] [CrossRef]
- Mach, D.M.; Christian, H.J.; Blakeslee, R.J.; Boccippio, D.J.; Goodman, S.J.; Boeck, W.L. Performance assessment of the Optical Transient Detector and Lightning Imaging Sensor. J. Geophys. Res. Atmos. 2007, 112. [Google Scholar] [CrossRef]
- Park, S.; Jung, S.-H.; Lee, G. Cross validation of TRMM PR reflectivity profiles using 3D reflectivity composite from the ground-based radar network over the Korean Peninsula. J. Hydrometeorol. 2015, 16, 668–687. [Google Scholar] [CrossRef]
- Houze, R.A.; Wilton, D.C.; Smull, B.F. Monsoon convection in the Himalayan region as seen by the TRMM Precipitation Radar. Q. J. R. Meteorol. Soc. 2007, 133, 1389–1411. [Google Scholar] [CrossRef]
- Qie, X.; Wu, X.; Yuan, T.; Bian, J.; Lu, D. Comprehensive pattern of deep convective systems over the Tibetan Plateau–South Asian monsoon region based on TRMM data. J. Clim. 2014, 27, 6612–6626. [Google Scholar] [CrossRef]
- Zheng, D.; Fan, P.; Zhang, Y.; Yao, W.; Fang, X.; Ran, R. Deep convective clouds observed by ground-based radar over Naqu, Qinghai–Tibet Plateau. Atmos. Res. 2023, 293, 106930. [Google Scholar] [CrossRef]
- Chen, G.; Zheng, Y.; Xiao, T. Distribution and spatiotemporal variations of deep convective clouds over China during the warm season. Meteorolog. Mon. 2011, 37, 75–84. [Google Scholar]
- Zhang, T.; Qie, X.; Yan, M. The lightning characteristics of thunderstorm over Tibetan Plateau and its origin discussion. Plateau Meteorol. 2007, 26, 774–782. [Google Scholar]
- Peterson, M.; Liu, C.T. Characteristics of lightning flashes with exceptional illuminated areas, durations, and optical powers and surrounding storm properties in the tropics and inner subtropics. J. Geophys. Res. Atmos. 2013, 118, 11727–11740. [Google Scholar] [CrossRef]
- Zheng, D.; Zhang, Y.; Meng, Q. Properties of Negative Initial Leaders and Lightning Flash Size in a Cluster of Supercells. J. Geophys. Res. Atmos. 2018, 123, 12857–12876. [Google Scholar] [CrossRef]
- Bruning, E.C.; MacGorman, D.R. Theory and Observations of Controls on Lightning Flash Size Spectra. J. Atmos. Sci. 2013, 70, 4012–4029. [Google Scholar] [CrossRef]
- Bruning, E.; Salinas, V.; Nixon, C.; Berksth, S.; Brothers, M.; Mansell, E.; Chmielewski, V.C. The coupling of thunderstorm kinetic and electrical energetics. In Proceedings of the XVI International Conference on Atmospheric Electricity, Nara, Japan, 17–22 June 2018. [Google Scholar]
- Calhoun, K.M.; MacGorman, D.R.; Ziegler, C.L.; Biggerstaff, M.I. Evolution of Lightning Activity and Storm Charge Relative to Dual-Doppler Analysis of a High-Precipitation Supercell Storm. Mon. Weather Rev. 2013, 141, 2199–2223. [Google Scholar] [CrossRef]
- MacGorman, D. Meteorological aspects of lightning and thunderstorm electrification. In Proceedings of the XVI International Conference on Atmospheric Electricity, Nara, Japan, 17–22 June 2018. [Google Scholar]
- Schultz, C.J.; Carey, L.D.; Schultz, E.V.; Blakeslee, R.J. Insight into the Kinematic and Microphysical Processes that Control Lightning Jumps. Weather Forecast. 2015, 30, 1591–1621. [Google Scholar] [CrossRef]
- Souza, J.C.S.; Bruning, E.C. Assessment of Turbulence Intensity in Different Spots of Lightning Flash Propagation. Geophys. Res. Lett. 2021, 48, e2021GL095923. [Google Scholar] [CrossRef]
- Calhoun, K.M.; Mansell, E.R.; MacGorman, D.R.; Dowell, D.C. Numerical Simulations of Lightning and Storm Charge of the 29–30 May 2004 Geary, Oklahoma, Supercell Thunderstorm Using EnKF Mobile Radar Data Assimilation. Mon. Weather Rev. 2014, 142, 3977–3997. [Google Scholar] [CrossRef]
- Thiel, K.C.; Calhoun, K.M.; Reinhart, A.E.; MacGorman, D.R. GLM and ABI Characteristics of Severe and Convective Storms. J. Geophys. Res. Atmos. 2020, 125, e2020JD032858. [Google Scholar] [CrossRef]
- López, J.A.; Pineda, N.; Montanyà, J.; van der Velde, O.; Fabró, F.; Romero, D. Spatio-temporal dimension of lightning flashes based on three-dimensional Lightning Mapping Array. Atmos. Res. 2017, 197, 255–264. [Google Scholar] [CrossRef]
- Beirle, S.; Koshak, W.; Blakeslee, R.; Wagner, T. Global patterns of lightning properties derived by OTD and LIS. Nat. Hazards Earth Syst. Sci. 2014, 14, 2715–2726. [Google Scholar] [CrossRef]
- Peterson, M.; Deierling, W.; Liu, C.T.; Mach, D.; Kalb, C. The properties of optical lightning flashes and the clouds they illuminate. J. Geophys. Res. Atmos. 2017, 122, 423–442. [Google Scholar] [CrossRef]
- Said, R.K.; Cohen, M.B.; Inan, U.S. Highly intense lightning over the oceans: Estimated peak currents from global GLD360 observations. J. Geophys. Res. Atmos. 2013, 118, 6905–6915. [Google Scholar] [CrossRef]
- Mecikalski, R.M.; Carey, L.D. Radar Reflectivity and Altitude Distributions of Lightning Flashes as a Function of Three Main Storm Types. J. Geophys. Res. Atmos. 2018, 123, 12814–12828. [Google Scholar] [CrossRef]
- Chronis, T.; Cummins, K.; Said, R.; Koshak, W.; McCaul, E.; Williams, E.R.; Stano, G.T.; Grant, M. Climatological diurnal variation of negative CG lightning peak current over the continental United States. J. Geophys. Res. Atmos. 2015, 120, 582–589. [Google Scholar] [CrossRef]
Disclaimer/Publisher’s Note: The statements, opinions and data contained in all publications are solely those of the individual author(s) and contributor(s) and not of MDPI and/or the editor(s). MDPI and/or the editor(s) disclaim responsibility for any injury to people or property resulting from any ideas, methods, instructions or products referred to in the content. |
© 2024 by the authors. Licensee MDPI, Basel, Switzerland. This article is an open access article distributed under the terms and conditions of the Creative Commons Attribution (CC BY) license (https://creativecommons.org/licenses/by/4.0/).