Abstract
This study highlights the importance of unmanned aerial vehicle (UAV) multispectral (MS) imagery for the accurate delineation and analysis of wetland ecosystems, which is crucial for their conservation and management. We present an enhanced semantic segmentation algorithm designed for UAV MS imagery, which incorporates thermal infrared (TIR) data to improve segmentation outcomes. Our approach, involving meticulous image preprocessing, customized network architecture, and iterative training procedures, aims to refine wetland boundary delineation. The algorithm demonstrates strong segmentation results, including a mean pixel accuracy (MPA) of 90.35% and a mean intersection over union (MIOU) of 73.87% across different classes, with a pixel accuracy (PA) of 95.42% and an intersection over union (IOU) of 90.46% for the wetland class. The integration of TIR data with MS imagery not only enriches the feature set for segmentation but also, to some extent, helps address data imbalance issues, contributing to a more refined ecological analysis. This approach, along with the development of a comprehensive dataset that reflects the diversity of wetland environments and advances the utility of remote sensing technologies in ecological monitoring. This research lays the groundwork for more detailed and informative UAV-based evaluations of wetland health and integrity.
1. Introduction
Wetlands [1] are not only breathtaking natural landscapes but also essential ecosystems that play a vital role in maintaining the ecological balance of our planet. These distinctive areas, marked by the presence of water, serve as a sanctuary for a diverse array of plant and animal species [2,3]. Among their most significant functions is their capacity to support biodiversity, providing a home for countless species including birds, fish, mammals, reptiles, and amphibians. The varied vegetation within wetlands offers a source of food and shelter for many animals, underpinning the survival of numerous species. Despite the extensive benefits they offer, wetlands face ongoing threats from human activities and natural disasters. Urbanization, agriculture, and pollution often lead to the degradation of wetland ecosystems, while the drainage of wetlands for development or the redirection of water for irrigation can have severe impacts on these delicate habitats. Natural disasters such as hurricanes, floods, and droughts also present significant challenges to wetland conservation and management efforts [4].
Effective conservation and management of wetlands require precise delineation and continuous monitoring of these areas [5,6]. Mapping wetlands and understanding their ecological attributes are crucial components of this process. Unmanned aerial vehicle (UAV) remote sensing technology has emerged as a powerful tool in this context, offering numerous advantages over satellite-based remote sensing. By tracking changes in wetlands over time, stakeholders such as conservationists and policymakers can make informed decisions and implement appropriate strategies for the protection and rehabilitation of wetland ecosystems [5,7]. As illustrated in Figure 1, UAVs provide high-resolution imagery, enabling the capture of detailed information about wetland surfaces. This high resolution is particularly important for accurately delineating wetland boundaries and identifying specific features such as vegetation types and water bodies. In addition to high resolution, UAVs offer flexibility in terms of deployment [8,9,10,11,12,13,14]. They can be flown at specific locations and times, providing targeted data collection for different wetland areas. This flexibility allows for customized monitoring approaches that can adapt to the unique characteristics of each wetland ecosystem. Cost-effectiveness is another advantage of UAVs. Compared to traditional methods such as ground surveys or manned aircraft, UAVs are more affordable to operate. They require lower operating costs and can be easily controlled by trained operators, reducing the need for extensive resources and personnel. Furthermore, UAVs can capture rich and detailed wetland surface information by carrying different sensors including RGB (red, green, and blue), multispectral (MS), and thermal infrared (TIR) sensors [15,16,17,18,19]. RGB sensors function similarly to the human eye. They capture visual information in these three primary colors, creating a comprehensive and vibrant image of the landscape. For example, they can reveal the rich diversity of a wetland’s flora and fauna or provide a clear view of the water’s surface. MS sensors are designed to capture data in specific spectral bands, which can be especially useful in analyzing vegetation health and stress. For instance, they can detect subtle changes in the color or reflectance of plant leaves, which may indicate disease or nutrient deficiency. In a wetland context, they might be used to monitor the health of aquatic plants or to identify areas of invasive species. TIR sensors measure thermal radiation, which can be used to assess water temperature and energy exchange processes in wetlands. These measurements can provide crucial insights into the wetland’s health and function. For example, changes in water temperature can affect the life cycles of many aquatic species, while understanding energy exchange processes can help scientists predict how the wetland might respond to environmental changes such as global warming.
Figure 1.
Wetland segmentation of UAV MS images based on deep learning (DL).
UAV-based MS imagery has emerged as a valuable tool across various domains, including agriculture, environmental monitoring, urban planning, and disaster management. This technology provides detailed spectral information that supports analysis and decision-making processes. However, extracting and interpreting this information from the complexity and variability of captured scenes remains a significant challenge. Ongoing research and advancements in image processing algorithms and techniques are essential to develop advanced methods capable of extracting meaningful data from UAV MS imagery, thereby maximizing the potential of UAV remote sensing for wetland monitoring. As illustrated in Figure 1, deep learning [20,21,22,23], image semantic segmentation methods offer great promise in this regard. Notably, deep learning models, such as fully convolutional networks (FCNs) [24], DeepLab [25,26,27,28], SegNet [29], Unet [30], MobilenetV3 [31], and those based on transformer methods [32,33,34,35,36], have demonstrated significant progress in image segmentation tasks. Among these, the Segformer [37] model stands out for its ability to achieve high accuracy efficiently. This makes it particularly suitable for processing the large-scale UAV datasets typically used in wetland studies. By training the model on extensive and diverse datasets, it can learn to recognize and classify different wetland classes, such as water bodies, vegetation types, and landforms. The application of the Segformer model to wetland monitoring can provide valuable insights into the dynamics and health of wetland ecosystems. Recent studies have demonstrated the capability of deep learning models to process complex datasets and provide detailed insights into wetland ecosystems, which is crucial for understanding their health and dynamics [38,39,40,41,42,43,44,45].
Despite the widespread use of deep learning methods for RGB three-channel visible images, these approaches are often constrained by weather variability and shadows, which obscure critical features and reduce segmentation accuracy. To address these limitations, MS imaging provides richer information compared to traditional RGB imaging. Additionally, TIR imaging captures thermal radiation emitted by objects, offering complementary data. The integration of TIR features with MS data can significantly enhance the robustness and accuracy of wetland segmentation.
This study introduces a novel approach to improve the semantic segmentation of MS UAV imagery for wetland monitoring by integrating TIR data with deep learning techniques. The key contributions of this paper are:
- (i)
- The study presents a novel deep learning approach for MS UAV imagery segmentation that integrates MS data and TIR features, significantly improving wetland segmentation accuracy and robustness.
- (ii)
- The validation, through an experimental comparison of loss functions, that the incorporation of TIR image features effectively addresses the issue of data imbalance, a common challenge that leads to reduced accuracy in segmentation tasks.
- (iii)
- The construction of a comprehensive dataset specifically designed for semantic segmentation of UAV MS remote sensing images. This dataset includes a diverse range of land cover types, providing a valuable resource for training and testing deep learning models.
2. Materials
The study area is situated in the northern suburb of Zhang Ye Wetland Park, Gansu Province, Northwest China, as depicted in Figure 2. This region, which is part of the Zhang Ye Wetland Park, covers a total area of approximately 1347.65 hectares. The park is known for its rich biodiversity and diverse ecosystems, including wetlands, grasslands, and various water bodies. The research focus is on the area’s ecological characteristics and land use patterns. As depicted in Figure 3, the experiment employed a UAV, specifically the DJI M600 Pro (SZ DJI Technology Co., Ltd., Shenzhen, China), equipped with both an MS camera (Red Edge-M) (MicaSense Inc., Seattle, WA, USA) and a TIR camera (WIRIS Pro Sc) (Workswell Corp., Prague, Czech Republic). The Red Edge-M camera features five bands—red, green, blue, NIR, and REG—with a spectral response range of 0.4–0.9 µm. The WIRIS Pro Sc camera operates within the spectral range of 7.5–13.5 µm and has a single band. During the flights, the UAV maintained an altitude of approximately 300 m above ground level, resulting in a ground resolution of 0.4 m. The dimensions of the MS and TIR images for the entire area are 5947 × 12,192 and 3390 × 6203, respectively [46,47].
Figure 2.
Location and the color position of the UAV image of the study area.
Figure 3.
(a) UAV M600 Pro; (b) MS camera (Red Edge-M); (c) TIR camera WIRIS.
3. Methods
3.1. Technical Route
Our proposed method is designed to incorporate TIR information and deep learning technology into the UAV MS remote sensing image segmentation. The framework of this method consists of several key components, including data preprocessing, segmentation model, and post-processing.
As illustrated in Figure 4, each component plays a pivotal role in the overall process. The input model primarily focuses on data preprocessing, ensuring that the input data are suitable for further analysis before passing them to the segmentation model. The segmentation model employs an advanced algorithm to analyze the input data and identify meaningful patterns or segments within them, grouping similar data points based on specific criteria or characteristics. The output model then takes the segmented data and performs additional analysis or generates the desired outputs. Detailed explanations follow.
Figure 4.
Technical route of the whole strategy Segformer* + Multispectral + TIR + Cross-Entropy.
3.1.1. Data Preprocessing
The input module of the Segmentation model is designed to accommodate both single-channel and multichannel inputs. This module primarily focuses on preprocessing the input data. Initially, the MS and TIR images are resized to a uniform dimension. Subsequently, a six-band MS image is generated through the concatenation of the TIR band with the other spectral bands. For model training, a UAV dataset was constructed through data annotation and slicing. As illustrated in Figure 5, five distinct objects within the study area were annotated. The UAV images utilized in this research are registered images sourced from a previous study [46,47]. The following is the flow chart of data processing:
Figure 5.
(a) TIR image; (b) MS image; (c) label image.
- (i)
- Image Acquisition: DJ600 Pro is equipped with a TIR and MS camera to capture TIR and MS images.
- (ii)
- Image Stitching: Stitch together all the smaller images to obtain a larger image of the entire study area.
- (iii)
- Image Resampling: The MS and thermal infrared images are resized to a consistent dimension using bilinear interpolation. This method calculates new pixel values by averaging the four nearest pixel values, ensuring a smooth transition and balancing performance with image quality.
- (iv)
- Band Concatenation: The different spectral bands are combined to create a six-channel MS image.
- (v)
- Data Annotation and Slicing: We annotated large images from the entire study area and composed a semantic segmentation dataset comprising 1000 cropped images. The dataset was partitioned into 60% for training, 30% for validation, and 10% for testing.
- (vi)
- Training: We employ stand-alone synchronized training methods with the Adam optimizer in PyTorch, leveraging the combined strengths of AdaGrad and RMSProp. The initial learning rate is set to 1 × 10⁻⁴, with a batch size of 2000 (comprising 8 images per chip) and a learning rate decay of 0.7 every 30 epochs. Dropout is applied at a rate of 0.5, and L2 weight decay is set to 1 × 10⁻⁵. Image preprocessing follows the same protocol as Inception. Additionally, we utilize an exponential moving average with a decay rate of 0.9999. All convolutional layers incorporate batch normalization with an average decay of 0.9.
It is worth mentioning that the wetland category also includes vegetation, which refers to plant species specially adapted to living in a humid environment, characterized by the presence of water on or near the soil surface at least part of the year, and we uniformly label it as a wetland. In contrast, the general category of vegetation excludes wetland areas and includes plant life that typically grows on well-drained soil with no permanent water table at or near the surface of the soil.
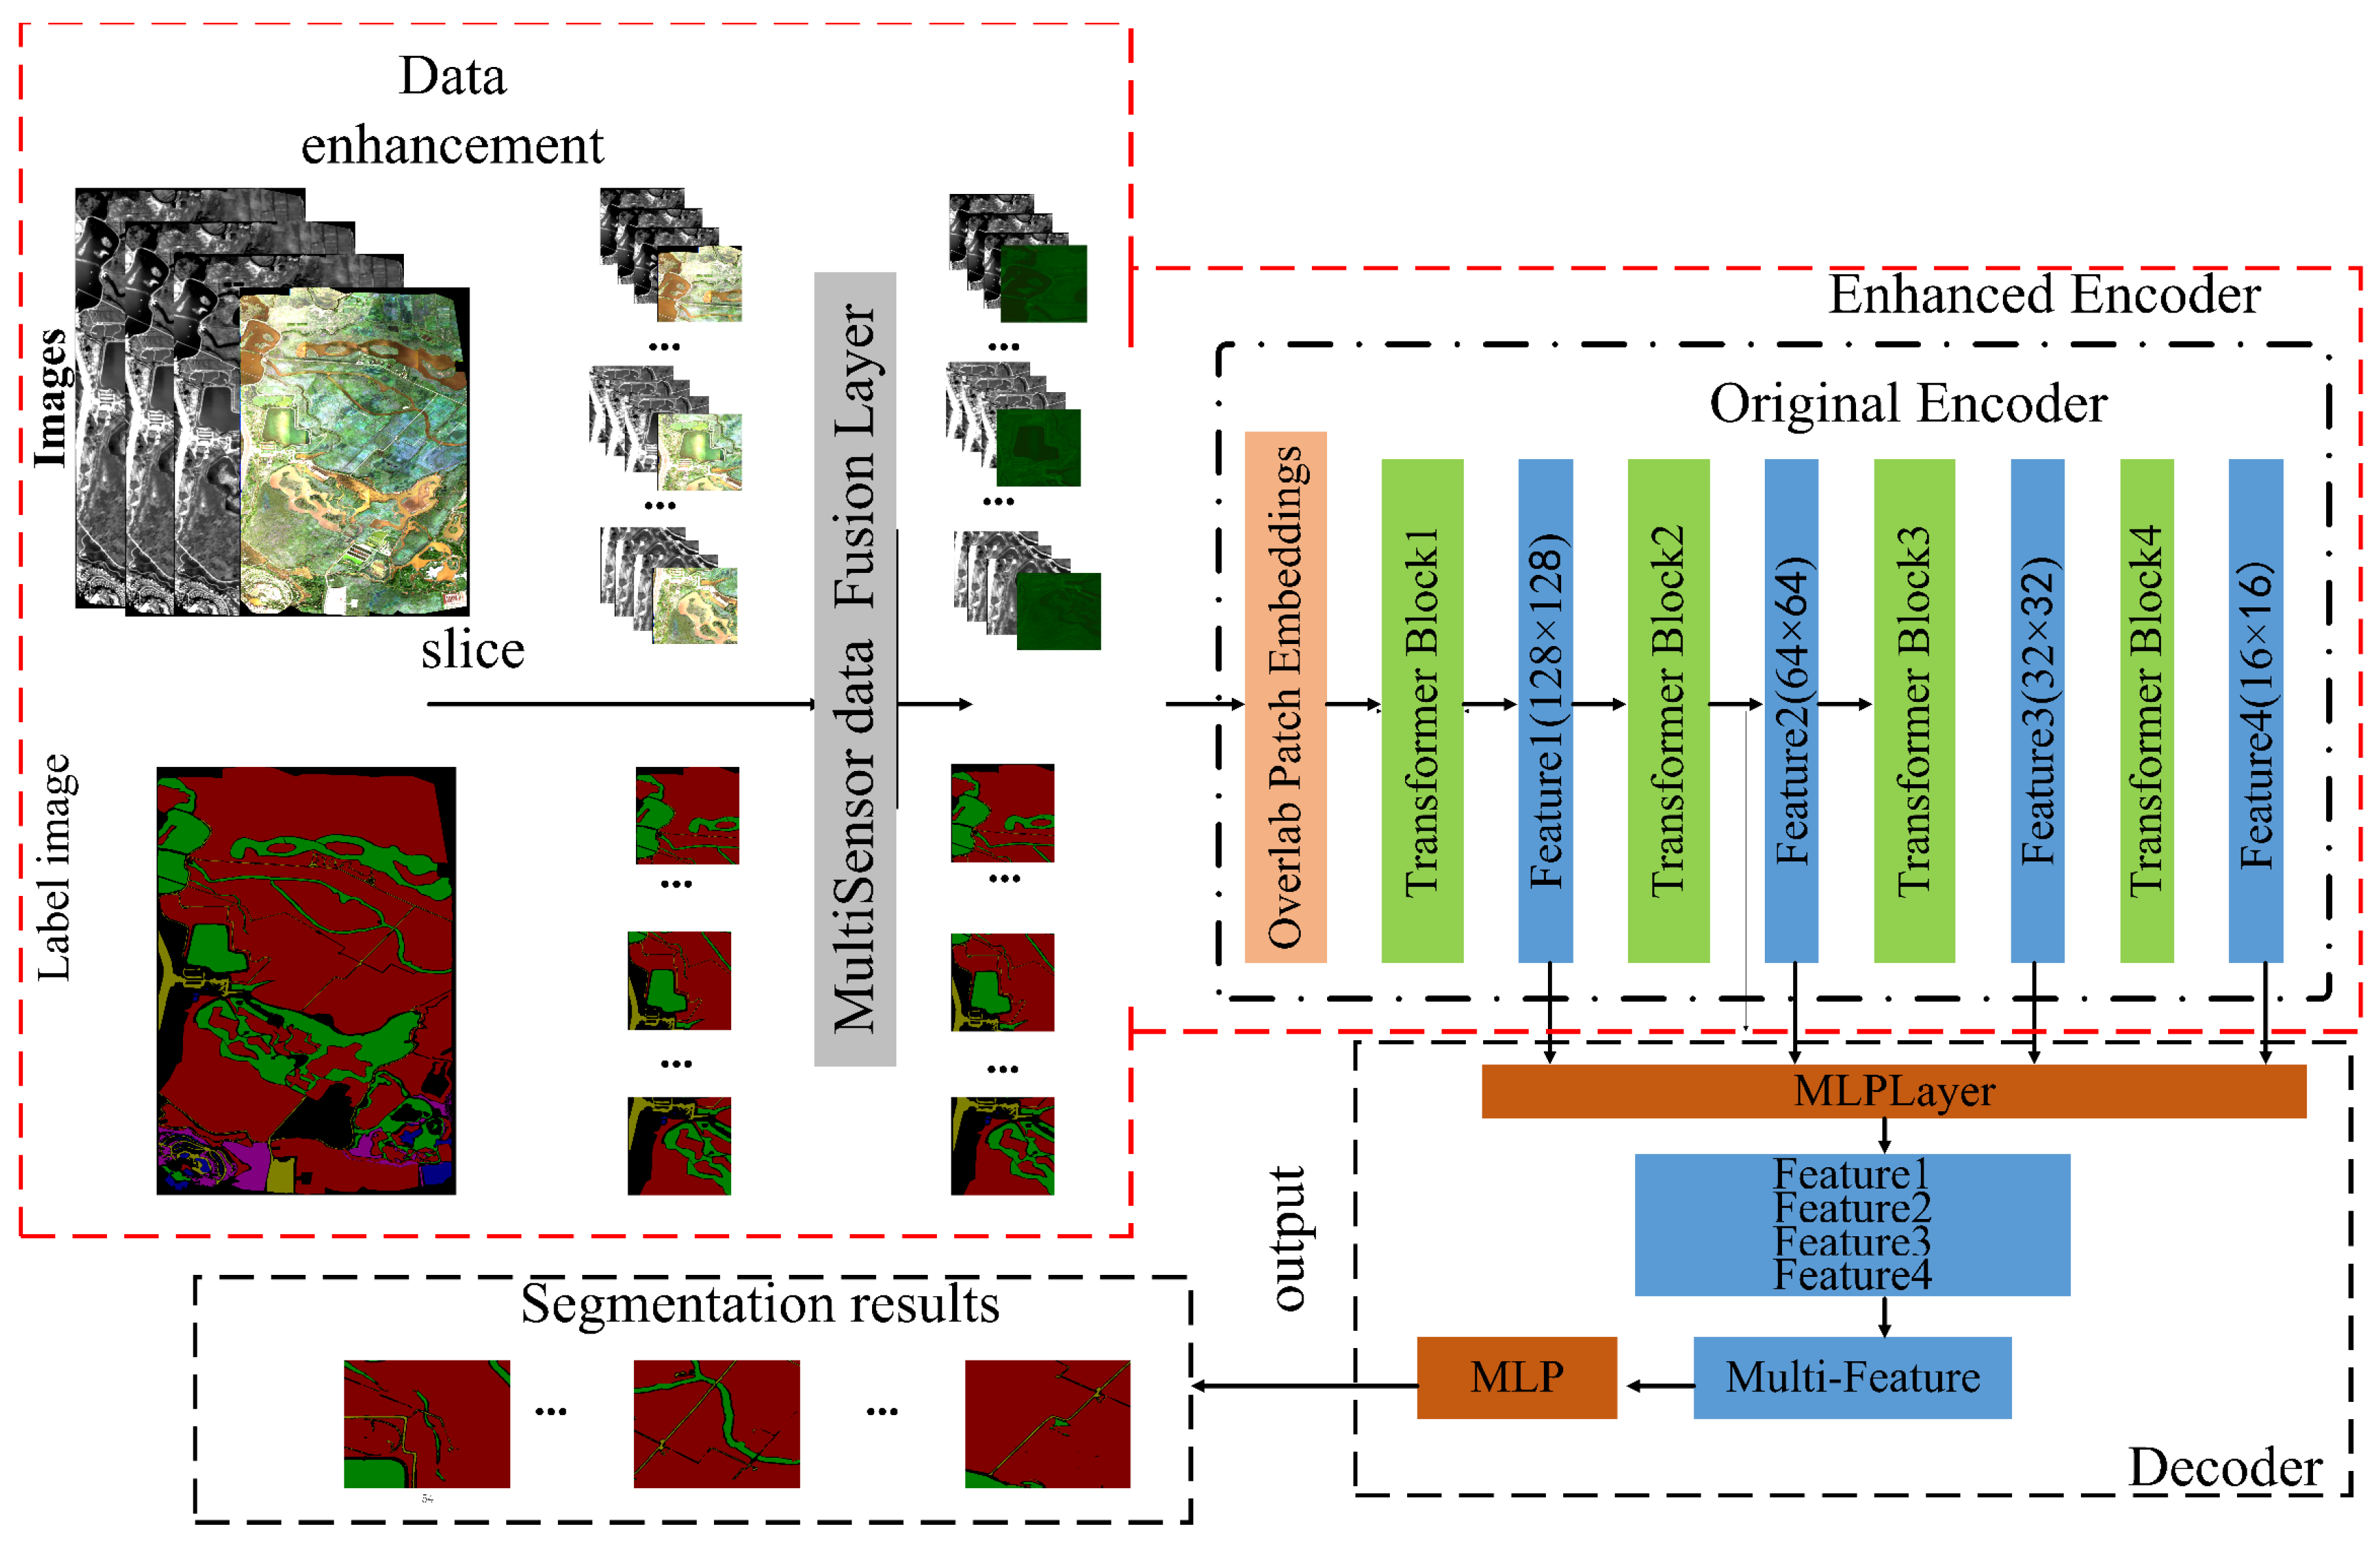
3.1.2. Segmentation Model
As shown in Figure 6, our segmentation model Segformer * is a fine-tuned version of the original Segformer model. It consists of two main components: an encoder and a decoder. The encoder plays a crucial role in extracting feature information from the input image. Based on the original Segformer encoder structure, we have made enhancements to better handle multisensor data in our Segformer * model. Specifically, we have added a convolutional layer to the input stage of the encoder, allowing us to fuse the multisensor data information through convolution. This approach enhances the locality of the extracted features and effectively preserves the spatial structure information. Our experiments have led us to choose the MixB2 encoder structure in the original Segformer. On the other hand, we have maintained the original lightweight All-MLP decoder in our model. The decoder is responsible for fusing the multi-level features extracted by the encoder with the predictive semantic segmentation mask. This fusion process enables the model to generate accurate and detailed segmentation results.
Figure 6.
Segformer* segmentation model.
It is important to note that the specific modifications and choices made in the encoder and decoder components were based on our experiments and the specific requirements of our segmentation task. These modifications enhance the capabilities of the SegFormer model in handling our specific use case. Let us elaborate on these aforementioned structures.
The encoder component of the Segformer incorporates a multilayer transformer block. A convolutional layer is integrated into the input stage of the encoder to facilitate the fusion of multisensor data. The encoder employs a transformer model known as MiT (multilayer in transformer), which utilizes the overlap patch embeddings (OPEs) structure for feature extraction and downsampling of the input image. The OPE structure involves dividing the input image into patches and applying linear projections to these patches. The resulting features are subsequently processed through the multi-headed self-attention layer and the Mix-FFN (feed-forward network) layer. In summary, the encoder can be described as follows:
where SE is the efficient self-attention mechanism; is the output features from SE; is the input image; OPM is the overlapped patch merging technique, utilized to merge overlapping patches into a complete image; Mix-FFN mixes a 3 × 3 convolution and a (multilayer perceptron) MLP into each FFN.
The lightweight All-MLP decoder is a compact decoder that processes the feature maps generated by the encoder output to obtain the final semantic segmentation outcome.
where are the multi-level features from the Mix-FFN encoder; MLP1 layer unified channel dimension for Fi; up-sampling represents features that are up-sampled to a 1/4th and concatenated together; the MLP2 layer is adopted to fuse the concatenated features; the MLP3 layer takes the fused feature to predict the segmentation mask M with a resolution; here, Ncls is the number of categories.
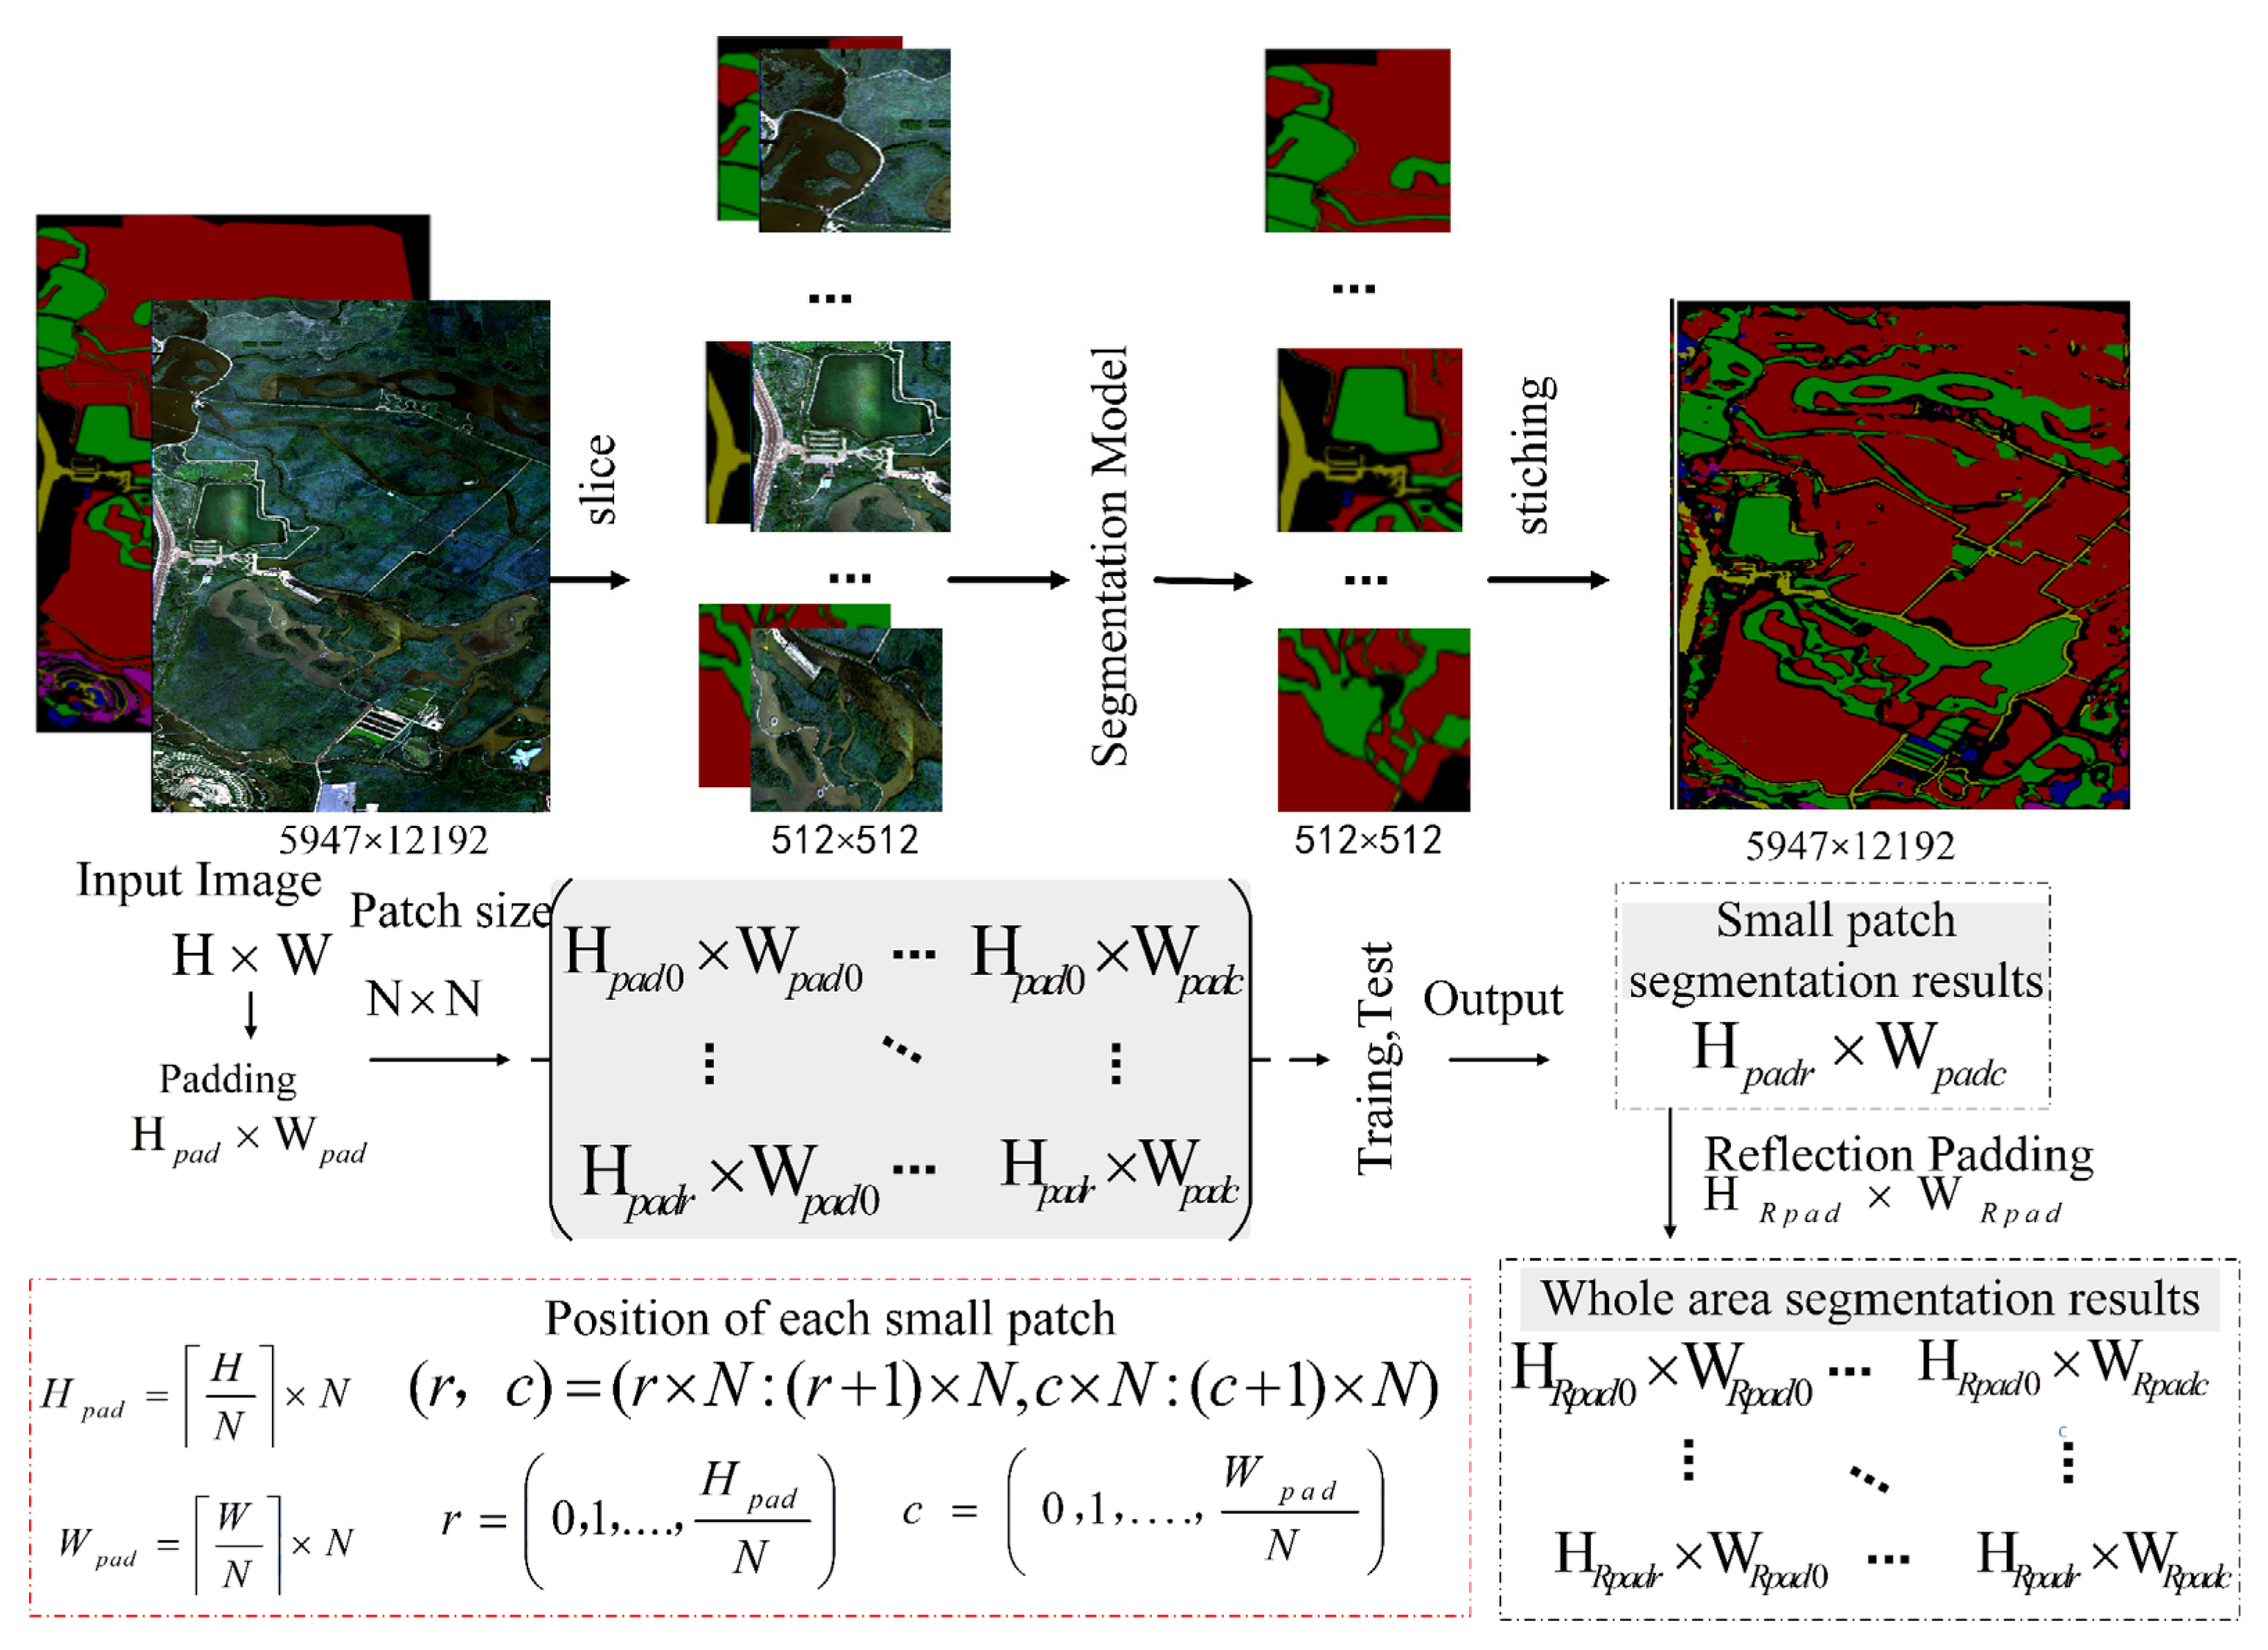
3.1.3. Data Post-Processing
The output module is responsible for image post-processing, as the original image is divided into smaller chunks during the training process to alleviate the computational burden on the model. Initially, the model predicts the category labels for each sub-chunk, and subsequently, these predictions are stitched together to form the final prediction for the entire image. The primary objective of the data post-processing phase is to aggregate the segmentation results of all small image segments to obtain the comprehensive segmentation of the entire area. This is achieved by directly stitching the small patches based on their pixel indices. The details of this process are illustrated in Figure 7.
Figure 7.
Data post-processing.
In Figure 7, the input image has dimensions H × W. To ensure that the sliced images maintain a consistent size, the original image is padded to dimensions Hpad × Wpad, which are divisible by the slice patch size N × N. The coordinates (r, c) denote the position of each sliced image in the original image, where r and c represent the row and column indices. The efficacy of our method is rooted in the pixel indexing technique, which leverages the original image’s pixel indices to segment and reassemble the small patches. This approach ensures that each patch is accurately placed in its original position, thereby eliminating the risk of misalignment or artifacts at the patch boundaries.
3.2. Evaluation Indexes
To assess the performance of the models, five evaluation indexes are employed here. These indexes serve as a means to attain more accurate and efficient semantic segmentation models. Their main objectives include identifying the best-performing models, comprehending performance levels in various application scenarios, recognizing model limitations and methods for enhancing their performance, as well as replicating the results obtained in prior experiments. The main metrics include intersection over union (IoU) and its mean (MIOU), as well as pixel accuracy (PA) and its mean (MPA), recall, F1 score, and precision. Detailed formulas and definitions can be found in the referenced literature [48].
3.3. Loss Function
In the pursuit of accurate wetland segmentation from multi-source remote sensing images captured by UAVs, the selection of an appropriate loss function is critical. This section delves into the rationale behind comparing two loss functions: Softmax Cross-Entropy Loss and Sigmoid Focal Loss. By conducting a thorough comparison, we aim to contribute to the existing body of knowledge by providing empirical evidence on the effectiveness of Softmax Cross-Entropy Loss and Focal Loss in the context of UAV-based multi-source remote sensing image segmentation. This will not only guide future research in similar ecological segmentation tasks but also offer practical insights for researchers and practitioners working in the field of remote sensing and environmental monitoring.
3.3.1. Cross-Entropy Loss
Softmax Cross-Entropy Loss [49] is a cornerstone in the field of semantic segmentation due to its simplicity and widespread adoption. It accepts two parameters: input data and labels. The input data are the data predicted by the model and the labels are the actual categories. The function first converts the input data to a probability distribution using the Softmax function and then calculates the Cross-Entropy loss. The Cross-Entropy loss is used to assess the difference between the probability distribution of the model output and the actual category distribution and can be used as an objective function for model optimization. The function returns a tensor representing the value of the Cross-Entropy loss, and its algorithmic process consists of two steps: Softmax and Cross-Entropy.
where P is the probability distribution generated by the Softmax function with xi denoting the output value associated with class i and n representing the total number of output categories. The Softmax function transforms the outputs into a probability distribution, assigning probabilities between 0 and 1 to each class and providing accuracy assessments for each respective category.
where c represents the label assigned to the sample; yc represents the one-hot encoding of the label. yc equals 1 if the sample falls into category c, and 0 otherwise. Pc represents the probability distribution obtained through the utilization of the softmax function.
3.3.2. Sigmoid Focal Loss
Sigmoid Focal Loss [50] is a loss function designed to address the data imbalance issue by reducing the weight of easily classified samples, allowing the model to focus more on hard-to-classify samples during training. In multi-label segmentation tasks, the Sigmoid Focal Loss is computed by calculating the loss for each class separately and then summing the weighted losses across all classes.
N is the total pixel number. C is the class number. is the model’s predicted probability for each class. α (Alpha) and γ (gamma) are the key parameters, which are used to adjust the model’s focus on different classes of samples, especially to improve the recognition of difficult samples to optimize the performance of the multi-class segmentation task. α controls the balance between the easy and hard examples, and γ focuses the model attention on the hard, misclassified examples.
4. Results
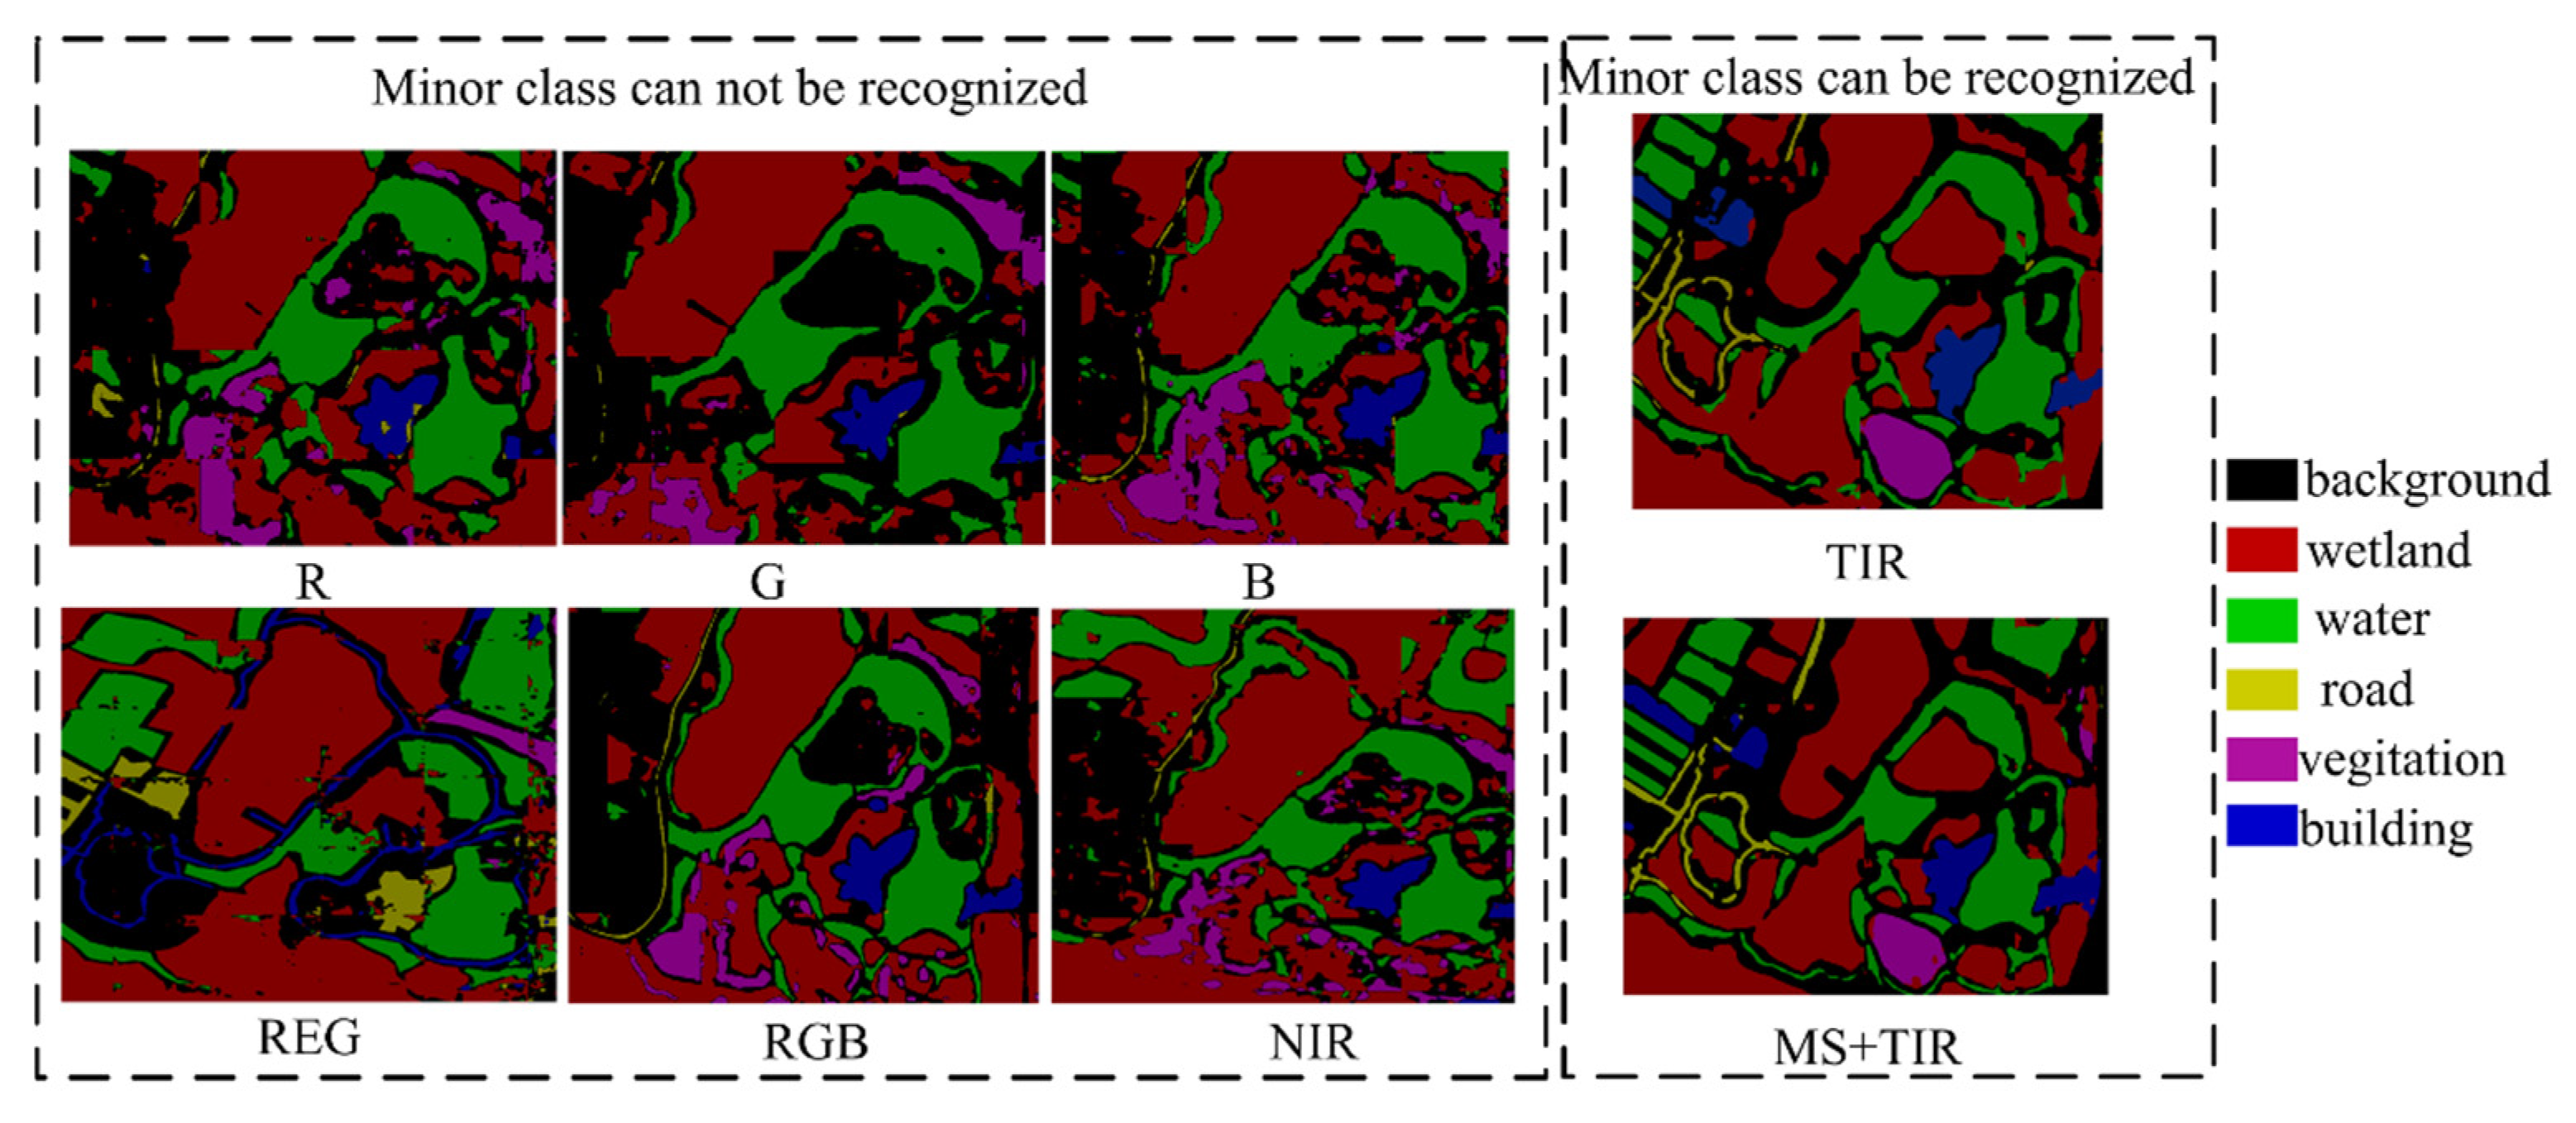
4.1. Comparative Analysis of Single-Channel Segmentation Performance
To analyze the role of thermal infrared image features in image semantic segmentation, comparison experiments were conducted on different single-band images.
Based on the experimental results presented in Figure 8 and Table 1 and Table 2, thermal infrared image features demonstrate superior performance compared to other single-channel segmentation methods. The incorporation of thermal data significantly enhances adaptability, accuracy, and robustness across various applications. To further assess the efficacy of our approach, we conducted a comparative analysis with other methods. Table 3 provides a comprehensive comparison of the performance of different techniques in thermal infrared (TIR) single-channel segmentation, evaluating their effectiveness in segmenting TIR images.
Figure 8.
Visualization of single-channel image segmentation. (Note: Segformer* represents the finetuned Segformer architecture in our research.).
Table 1.
Pixel accuracy of different single-channel image segmentations.
Table 2.
Intersection over union of different single-channel image segmentations.
Table 3.
Pixel accuracy of different methods in TIR single-channel segmentation.
As illustrated in Table 3 and Table 4, along with Figure 9, the Segformer* method demonstrates superior performance relative to other methods. Table 2 underscores the superior performance of TIR image features compared to other single-channel segmentation techniques. The performance metrics presented in the table provide valuable insights into the strengths and weaknesses of each method, thereby facilitating the selection of the most appropriate approach for TIR single-channel segmentation based on specific requirements.
Table 4.
Intersection over union of different methods in TIR single-channel segmentation.
Figure 9.
Different method comparison results of single-channel image segmentation.
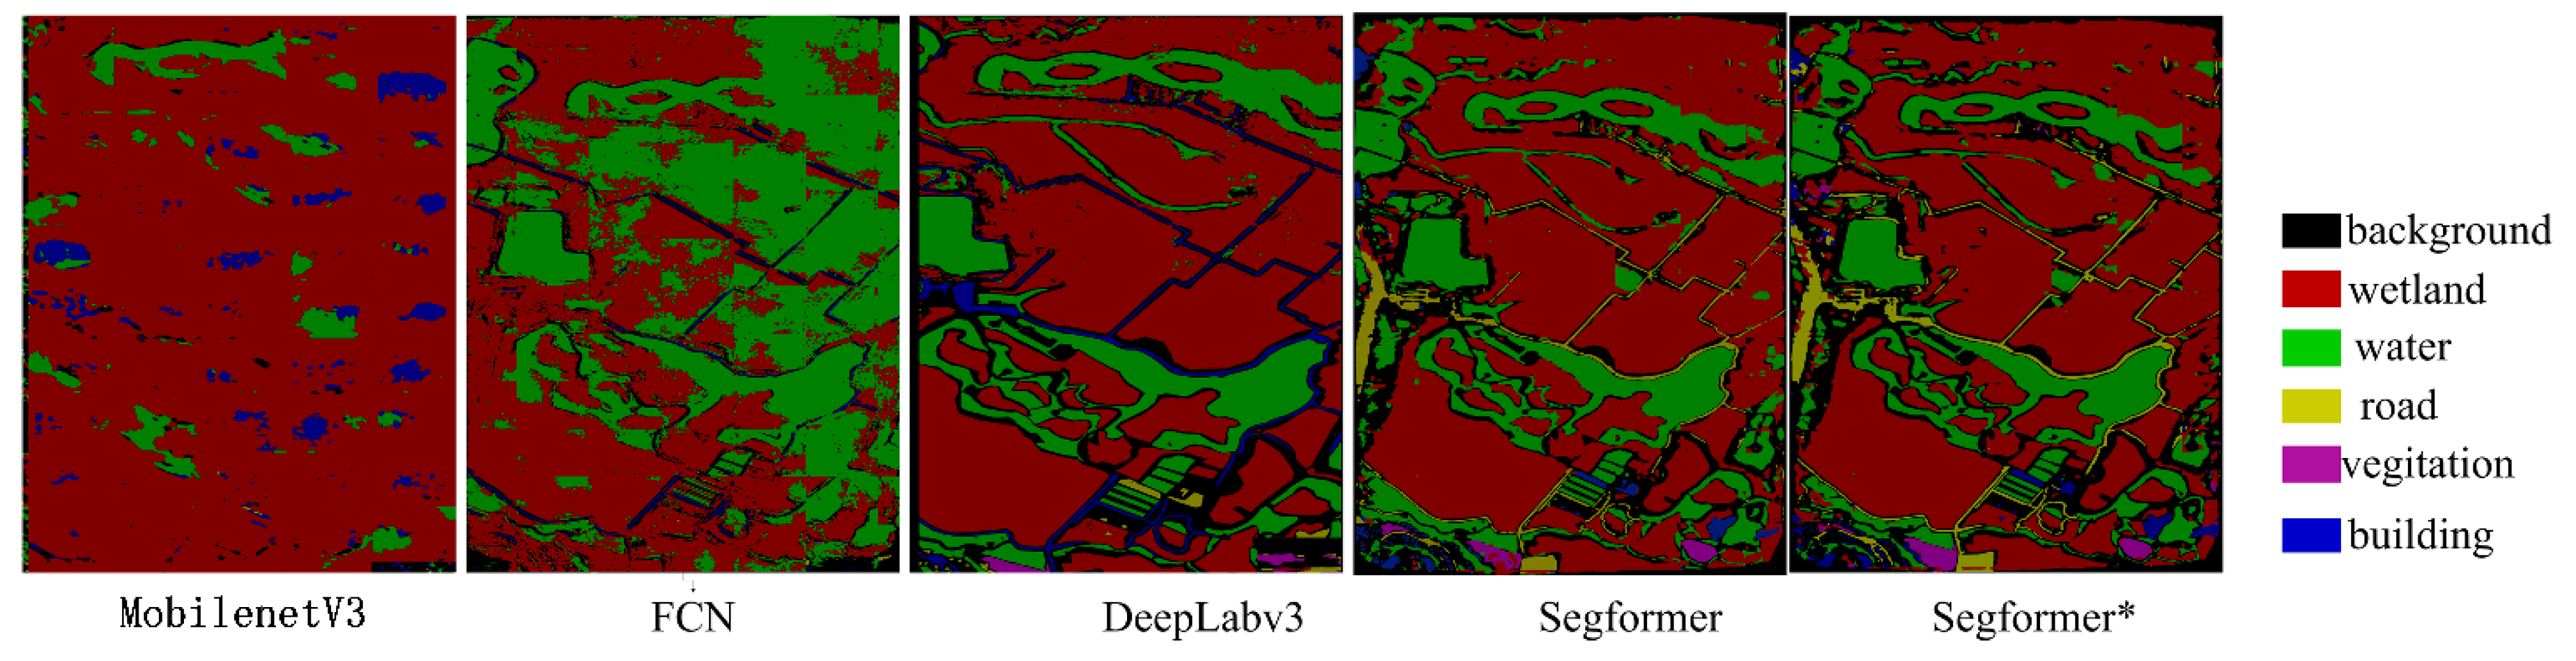
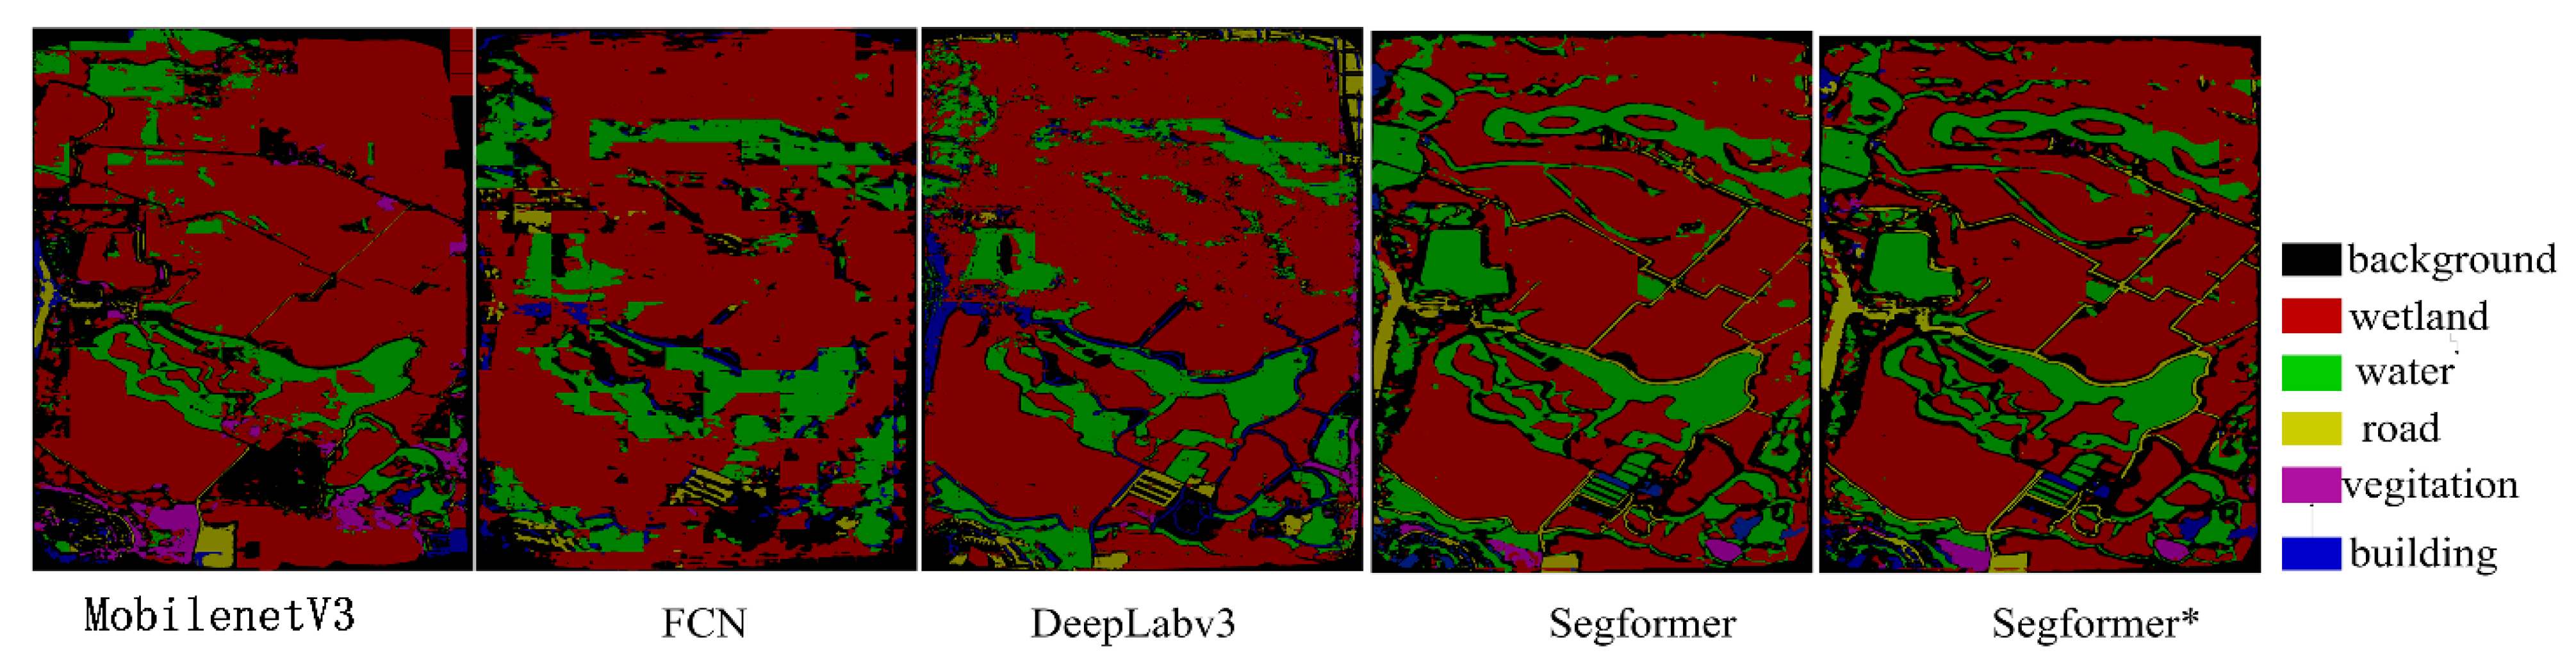
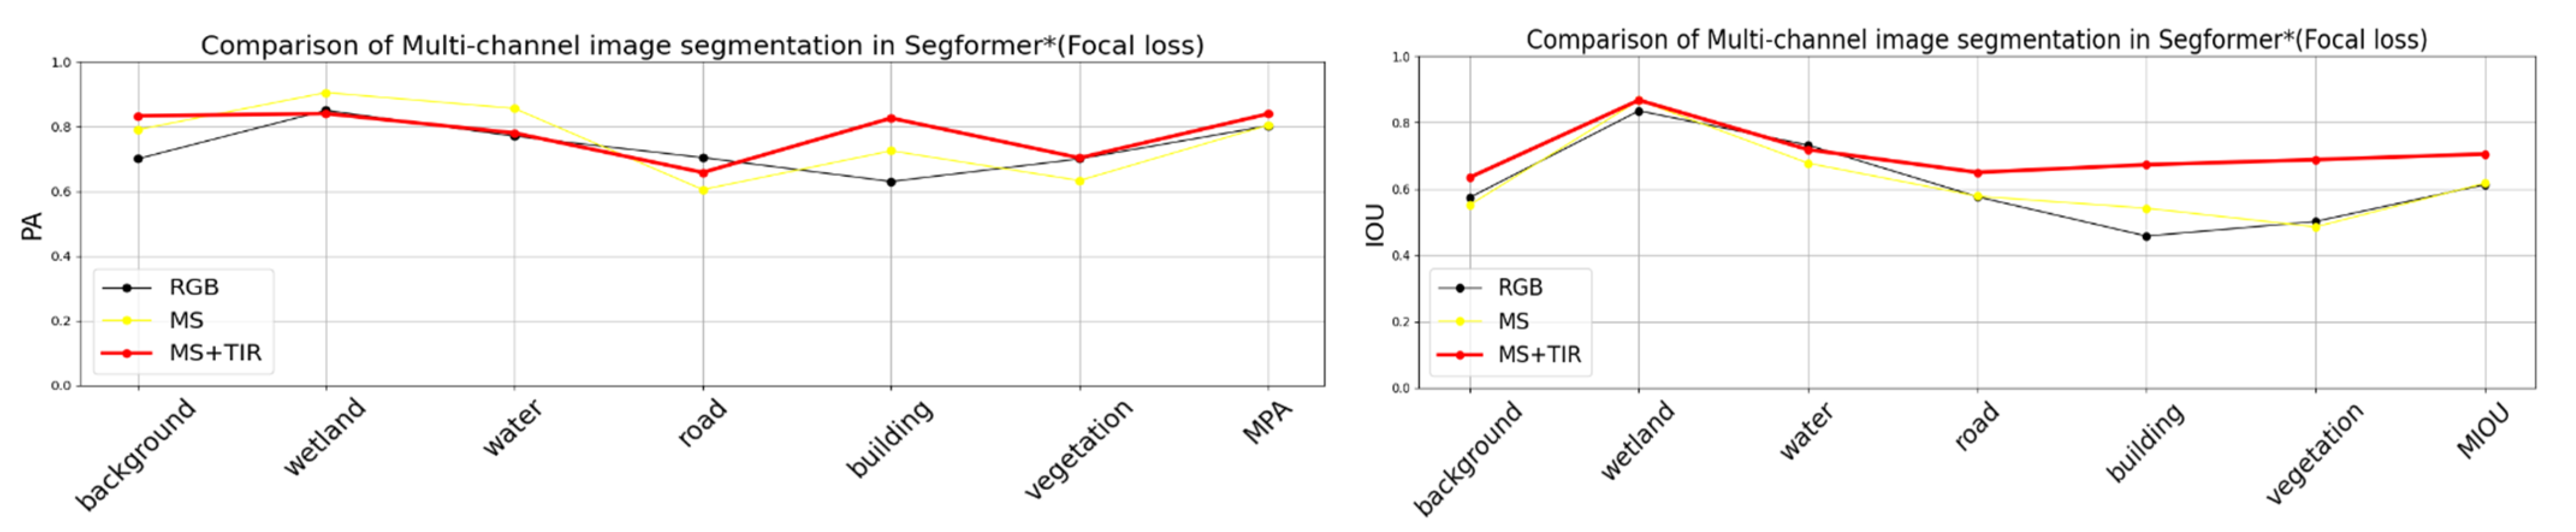
4.2. Comparative Analysis of Multichannel Segmentation
In this experiment, we conducted a comparative analysis of multichannel images to elucidate the role of thermal infrared (TIR) image features in multichannel segmentation tasks. The channels examined included RGB (three channels), MS (five channels), and MS+TIR (six channels). Specifically, we compared the performance of our strategy with that of the original Segformer in multichannel image segmentation. Our primary focus was to analyze the impact of TIR image features on segmentation outcomes and to compare the performance differences between models trained on RGB images and those trained on multichannel images.
From the results presented in Table 5, Table 6, Table 7 and Table 8, and Figure 10 and Figure 11, it is evident that the Segformer* model excels in multichannel image segmentation. This superior performance can be attributed to its unique encoder architecture and sophisticated training strategy. The model effectively leverages multichannel image information, achieving more accurate segmentation results through advanced feature extraction and segmentation techniques. By incorporating additional channels, the model can capture more comprehensive information, thereby enhancing the accuracy and robustness of the segmentation outcomes. The inclusion of thermal infrared channels notably boosts the model’s performance, as thermal images provide valuable insights into temperature variations, facilitating the identification of defects, precise segmentation of targets, and detection of material changes.
Table 5.
Pixel accuracy of multichannel image segmentation.
Table 6.
Intersection over union of multichannel image segmentation.
Table 7.
Pixel accuracy of different methods in multichannel image segmentation.
Table 8.
Intersection over union of different methods in multichannel image segmentation.
Figure 10.
Comparison results of multichannel image segmentation.
Figure 11.
Different method comparison results of multichannel image segmentation.
4.3. Limitations of the Proposed Method
Our strategy has effectively demonstrated the utility of thermal infrared imagery in enhancing segmentation accuracy. However, the approach is not without limitations, which we discuss in this section. Data imbalance is a significant challenge in the dataset we constructed, as illustrated in Table 9. This imbalance can lead to biased model performance, where the model may overfit the majority classes and underperform on the minority classes, potentially skewing the model’s predictive capabilities.
Table 9.
Class pixel number in our dataset.
Our strategy has effectively demonstrated the utility of thermal infrared imagery in enhancing segmentation accuracy. However, the approach is not without limitations, which we discuss in this section. Data imbalance is a significant challenge in the dataset we constructed, as illustrated in Table 9. This imbalance can lead to biased model performance, where the model may overfit the majority classes and underperform on the minority classes, potentially skewing the model’s predictive capabilities. The minor classes include roads, buildings, and vegetation, while the major classes are wetlands and water. To investigate the impact of the Segformer model, the loss function, and thermal infrared image features on addressing the class imbalance, we designed a series of comparative experiments. The following sections detail the experimental setup and findings. Initially, we identified the optimal values for α and γ in the Sigmoid Focal Loss function by conducting comparative experiments, testing various parameter combinations to determine the best hyperparameter settings for addressing class imbalance. Subsequently, we compared the Sigmoid Focal Loss function (with optimal values α = 0.90 and γ = 4) and the Cross-Entropy loss function within the Segformer* framework, focusing on their impact on channel segmentation results. This analysis aimed to determine whether the Focal Loss function could effectively mitigate data imbalance by prioritizing hard-to-classify examples.
As illustrated in Figure 12, we can elaborate on the impact of different loss functions on the segmentation outcomes. Specifically, the Sigmoid Focal Loss function was applied to address the data imbalance issue, particularly for the minority classes such as roads, buildings, and vegetation. The adoption of the Focal Loss function proved to be particularly effective in boosting the segmentation precision for the minority classes. This loss function is designed to focus on hard-to-classify examples and reduce the relative loss for well-classified examples, thereby providing a greater emphasis on the minority classes during the training process. As a result, the PA and IOU scores for roads, buildings, and vegetation showed a noticeable improvement when compared to the segmentation performance achieved with the standard Cross-Entropy loss. However, despite the Focal Loss’s efficacy in enhancing the segmentation accuracy for the minority classes, the overall segmentation performance, when evaluated across all categories, was found to be slightly inferior to the strategy that employed the Cross-Entropy loss in conjunction with thermal infrared data. This strategy demonstrated a more consistent improvement in segmentation metrics across the board, indicating that while the Focal Loss does address the issue of class imbalance, the complementary information provided by thermal infrared data may have a broader and more uniform positive impact on the segmentation results.

Figure 12.
Comparison results of different channel image segmentation algorithms with different loss functions.
In addition, combining the experimental results of Figure 12 and Figure 13, it is evident that the inclusion of thermal infrared image features significantly enhanced the segmentation performance across all classes. For the minority classes such as roads, buildings, and vegetation, the accuracy and IoU scores showed an increase when thermal infrared data were incorporated. This indicates that thermal information helped to distinguish between classes that may appear similar in visible light, thus aiding in the identification of minority classes, and which have a relatively stable trend in accuracy across all categories. In the case of wetland and water classes, which are the majority classes in our dataset, the addition of thermal infrared features also led to a slight improvement in segmentation performance. This indicates that thermal data can complement visible imagery even for well-represented classes.
Figure 13.
Examples of comparations of different single-channel segmentation for minor class.
In summary, the integration of thermal infrared features into the segmentation process yielded a relatively stable trend of increased accuracy for all classes, with particularly significant gains for the minority classes. Although the Focal Loss function successfully elevated the segmentation precision for the less represented classes, the comprehensive segmentation strategy that combined visible imagery with thermal infrared data and used the Cross-Entropy loss yielded superior overall segmentation performance, suggesting that a multifaceted approach to data and loss function selection is key to achieving optimal segmentation results.
As can be seen in Figure 14, there are some differences in the recall, precision, and F1 scores of the categories, but overall, the trend of precision changes in different categories is relatively balanced. Moreover, even on a few categories with small sample sizes, the model maintains relatively high-performance metrics, showing good generalization ability. Thus, our strategy performs satisfactorily on such unbalanced datasets, proving its effectiveness and robustness in dealing with the problem of data imbalance.
Figure 14.
Evaluation of Segformer* + MS +TIR+ Cross-Entropy strategy in the presence of data imbalance.
This performance is largely attributed to the Segformer* model’s ability to effectively integrate multi-scale features and the robustness of its transformer architecture, which allows it to capture long-range dependencies and contextual information more effectively. Additionally, the thermal infrared image features play a crucial role in addressing the issue of data imbalance by enriching the feature set with unique spectral signatures that are not available in the visible spectrum, thereby providing a more discriminative representation for both minority and majority classes.
This adaptability to varied data distributions and the utilization of rich spectral data underscore the model’s potential for advancing the state-of-the-art in remote sensing imagery analysis. The Segformer*’s innovative design is particularly well-suited for remote sensing applications where the distribution of classes in the dataset may be skewed, and additional spectral information from thermal infrared images can provide valuable insights for enhanced feature discrimination and more reliable land cover classification.
5. Conclusions
This study introduces a novel wetland semantic segmentation method for multispectral remote sensing images acquired from UAVs, augmented by thermal infrared (TIR) image features. Employing the Enhanced Segformer* model within a deep learning framework, our approach achieves exceptional segmentation accuracy, with a mean pixel accuracy (MPA) of 90.35% and a mean intersection over union (MIOU) of 73.87%. For wetland classification, we attained a pixel accuracy (PA) of 95.42% and an intersection over union (IOU) of 90.46%. The incorporation of TIR imagery has been pivotal in enhancing segmentation performance. However, the reliance on TIR data introduces additional costs and complexities, necessitating future research to explore alternatives such as synthetic thermal imagery generation and the use of thermal imagery as a supplementary tool. Additionally, while Focal Loss has enhanced segmentation precision for minority classes, its efficacy without TIR data remains uncertain. Thus, optimizing loss functions and addressing data imbalance are critical areas for future investigation. Overall, this study not only advances remote sensing analysis for wetland mapping but also lays the groundwork for integrating diverse data sources into deep learning models, thereby paving the way for more robust and versatile environmental monitoring solutions.
Author Contributions
Conceptualization, P.N.; Methodology, P.N., and F.M.; Validation, P.N., J.Z., G.Z. and F.M.; Formal analysis, P.N., J.Z., G.Z. and F.M.; Investigation, F.M.; Resources, P.N.; Data curation, P.N.; Writing—original draft, P.N.; Writing—review & editing, J.Z., G.Z. and F.M.; Visualization, P.N.; Supervision, F.M.; Funding acquisition, F.M. All authors have read and agreed to the published version of the manuscript.
Funding
This research received no external funding.
Data Availability Statement
The original contributions presented in the study are included in the article, further inquiries can be directed to the corresponding author.
Conflicts of Interest
The authors declare no conflict of interest.
References
- Mishra, N.B. Wetlands: Remote Sensing. In Wetlands and Habitats, 2nd ed.; Wang, Y., Ed.; CRC Press: Boca Raton, FL, USA, 2020; pp. 201–212. ISBN 978-0-429-44550-7. [Google Scholar]
- Maltby, E.; Acreman, M.C. Ecosystem services of wetlands: Pathfinder for a new paradigm. Hydrol. Sci. J. 2011, 56, 1341–1359. [Google Scholar] [CrossRef]
- Cui, M.; Zhou, J.X.; Huang, B. Benefit evaluation of wetlands resource with different modes of protection and utilization in the Dongting Lake region. Procedia Environ. Sci. 2012, 13, 2–17. [Google Scholar] [CrossRef]
- Erwin, K.L. Wetlands and global climate change: The role of wetland restoration in a changing world. Wetl. Ecol. Manag. 2009, 17, 71–84. [Google Scholar] [CrossRef]
- Du, Y.; Bai, Y.; Wan, L. Wetland information extraction based on UAV multispectral and oblique images. Arab. J. Geosci. 2020, 13, 1241. [Google Scholar] [CrossRef]
- Guan, X.; Wang, D.; Wan, L.; Zhang, J. Extracting Wetland Type Information with a Deep Convolutional Neural Network. Comput. Intell. Neurosci. 2022, 2022, 5303872. [Google Scholar] [CrossRef]
- Lu, T.; Wan, L.; Qi, S.; Gao, M. Land Cover Classification of UAV Remote Sensing Based on Transformer–CNN Hybrid Architecture. Sensors 2023, 23, 5288. [Google Scholar] [CrossRef] [PubMed]
- Bhatnagar, S.; Gill, L.; Ghosh, B. Drone Image Segmentation Using Machine and Deep Learning for Mapping Raised Bog Vegetation Communities. Remote Sens. 2020, 12, 2602. [Google Scholar] [CrossRef]
- Wang, Z.; Zhou, J.; Liu, S.; Li, M.; Zhang, X.; Huang, Z.; Dong, W.; Ma, J.; Ai, L. A Land Surface Temperature Retrieval Method for UAV Broadband Thermal Imager Data. IEEE Geosci. Remote Sens. Lett. 2022, 19, 7002805. [Google Scholar] [CrossRef]
- Deng, L.; Mao, Z.; Li, X.; Hu, Z.; Duan, F.; Yan, Y. UAV-based multispectral remote sensing for precision agriculture: A comparison between different cameras. ISPRS J. Photogramm. Remote Sens. 2018, 146, 124–136. [Google Scholar] [CrossRef]
- Feng, Q.; Liu, J.; Gong, J. UAV Remote Sensing for Urban Vegetation Mapping Using Random Forest and Texture Analysis. Remote Sens. 2015, 7, 1074–1094. [Google Scholar] [CrossRef]
- Ma, L.; Li, M.; Tong, L.; Wang, Y.; Cheng, L. Using unmanned aerial vehicle for remote sensing application. In Proceedings of the 2013 21st International Conference on Geoinformatics, Kaifeng, China, 20–22 June 2013; pp. 1–5. [Google Scholar]
- Matese, A.; Di Gennaro, S.F. Practical Applications of a Multisensor UAV Platform Based on Multispectral, Thermal and RGB High Resolution Images in Precision Viticulture. Agriculture 2018, 8, 116. [Google Scholar] [CrossRef]
- Khaliq, A.; Comba, L.; Biglia, A.; Ricauda Aimonino, D.; Chiaberge, M.; Gay, P. Comparison of Satellite and UAV-Based Multispectral Imagery for Vineyard Variability Assessment. Remote Sens. 2019, 11, 436. [Google Scholar] [CrossRef]
- Dash, J.P.; Watt, M.S.; Pearse, G.D.; Heaphy, M.; Dungey, H.S. Assessing very high resolution UAV imagery for monitoring forest health during a simulated disease outbreak. ISPRS J. Photogramm. Remote Sens. 2017, 131, 1–14. [Google Scholar] [CrossRef]
- Adão, T.; Hruška, J.; Pádua, L.; Bessa, J.; Peres, E.; Morais, R.; Sousa, J. Hyperspectral Imaging: A Review on UAV-Based Sensors, Data Processing and Applications for Agriculture and Forestry. Remote Sens. 2017, 9, 1110. [Google Scholar] [CrossRef]
- Wang, F.; Zheng, Y.; Lv, W.; Tang, J. Thermal infrared image semantic segmentation with Iightweight edge assisted context guided network. In Proceedings of the Third International Conference on Machine Learning and Computer Application (ICMLCA 2022), Shenyang, China, 16–18 December 2022; Zhou, F., Ba, S., Eds.; SPIE: Shenyang, China, 2023; p. 50. [Google Scholar]
- Weng, Q. Thermal infrared remote sensing for urban climate and environmental studies: Methods, applications, and trends. ISPRS J. Photogramm. Remote Sens. 2009, 64, 335–344. [Google Scholar] [CrossRef]
- Liu, Y.; Chen, X.; Cheng, J.; Peng, H.; Wang, Z. Infrared and visible image fusion with convolutional neural networks. Int. J. Wavelets Multiresolution Inf. Process. 2018, 16, 1850018. [Google Scholar] [CrossRef]
- Yuan, Q.; Shen, H.; Li, T.; Li, Z.; Li, S.; Jiang, Y.; Xu, H.; Tan, W.; Yang, Q.; Wang, J.; et al. Deep learning in environmental remote sensing: Achievements and challenges. Remote Sens. Environ. 2020, 241, 111716. [Google Scholar] [CrossRef]
- Yu, H.; Yang, Z.; Tan, L.; Wang, Y.; Sun, W.; Sun, M.; Tang, Y. Methods and datasets on semantic segmentation: A review. Neurocomputing 2018, 304, 82–103. [Google Scholar] [CrossRef]
- Osco, L.P.; Marcato Junior, J.; Marques Ramos, A.P.; De Castro Jorge, L.A.; Fatholahi, S.N.; De Andrade Silva, J.; Matsubara, E.T.; Pistori, H.; Gonçalves, W.N.; Li, J. A review on deep learning in UAV remote sensing. Int. J. Appl. Earth Obs. Geoinf. 2021, 102, 102456. [Google Scholar] [CrossRef]
- Santosh, K.; Das, N.; Ghosh, S. Deep learning: A review. In Deep Learning Models for Medical Imaging; Elsevier: Amsterdam, The Netherlands, 2022; pp. 29–63. ISBN 978-0-12-823504-1. [Google Scholar]
- Long, J.; Shelhamer, E.; Darrell, T. Fully Convolutional Networks for Semantic Segmentation. In Proceedings of the IEEE Conference on Computer Vision and Pattern Recognition, Boston, MA, USA, 7–12 June 2015; pp. 3431–3440. [Google Scholar]
- Chen, L.-C.; Papandreou, G.; Kokkinos, I.; Murphy, K.; Yuille, A.L. DeepLab: Semantic Image Segmentation with Deep Convolutional Nets, Atrous Convolution, and Fully Connected CRFs. IEEE Trans. Pattern Anal. Mach. Intell. 2018, 40, 834–848. [Google Scholar] [CrossRef]
- Chen, L.-C.; Papandreou, G.; Schroff, F.; Adam, H. Rethinking Atrous Convolution for Semantic Image Segmentation. arXiv 2017, arXiv:1706.05587. [Google Scholar]
- Chen, L.-C.; Papandreou, G.; Kokkinos, I.; Murphy, K.; Yuille, A.L. Semantic Image Segmentation with Deep Convolutional Nets and Fully Connected CRFs. arXiv 2014, arXiv:1412.7062. [Google Scholar]
- Chen, L.-C.; Zhu, Y.; Papandreou, G.; Schroff, F.; Adam, H. Encoder-Decoder with Atrous Separable Convolution for Semantic Image Segmentation. In Proceedings of the European Conference on Computer Vision (ECCV), Munich, Germany, 8–14 September 2018; pp. 801–818. [Google Scholar]
- Badrinarayanan, V.; Kendall, A.; Cipolla, R. SegNet: A Deep Convolutional Encoder-Decoder Architecture for Image Segmentation. IEEE Trans. Pattern Anal. Mach. Intell. 2017, 39, 2481–2495. [Google Scholar] [CrossRef]
- Ronneberger, O.; Fischer, P.; Brox, T. U-Net_: Convolutional Networks for Biomedical Image Segmentation. In Medical Image Computing and Computer-Assisted Intervention–MICCAI 2015, Proceedings of the 18th International Conference, Munich, Germany, 5–9 October 2015; Proceedings, Part III 18; Springer International Publishing: Cham, Switzerland, 2015; pp. 234–241. [Google Scholar]
- Howard, A.; Sandler, M.; Chu, G.; Chen, L.-C.; Chen, B.; Tan, M.; Wang, W.; Zhu, Y.; Pang, R.; Vasudevan, V.; et al. Searching for MobileNetV3 2019. In Proceedings of the IEEE/CVF International Conference on Computer Vision, Seoul, Republic of Korea, 27 October–2 November 2019; pp. 1314–1324. [Google Scholar]
- Han, K.; Wang, Y.; Chen, H.; Chen, X.; Guo, J.; Liu, Z.; Tang, Y.; Xiao, A.; Xu, C.; Xu, Y.; et al. A Survey on Vision Transformer. IEEE Trans. Pattern Anal. Mach. Intell. 2023, 45, 87–110. [Google Scholar] [CrossRef]
- Lombardi, A.; Nardo, E.D.; Ciaramella, A. Skip-SegFormer Efficient Semantic Segmentation for urban driving. In Proceedings of the Ital-IA 2023: 3rd National Conference on Artificial Intelligence, Organized by CINI, Pisa, Italy, 29–31 May 2023; pp. 54–59. [Google Scholar]
- Li, X.; Cheng, Y.; Fang, Y.; Liang, H.; Xu, S. 2DSegFormer: 2-D Transformer Model for Semantic Segmentation on Aerial Images. IEEE Trans. Geosci. Remote Sens. 2022, 60, 4709413. [Google Scholar] [CrossRef]
- Dosovitskiy, A.; Beyer, L.; Kolesnikov, A.; Weissenborn, D.; Zhai, X.; Unterthiner, T.; Dehghani, M.; Minderer, M.; Heigold, G.; Gelly, S.; et al. An Image is Worth 16x16 Words: Transformers for Image Recognition at Scale. arXiv 2020, arXiv:2010.11929. [Google Scholar]
- Bai, H.; Mao, H.; Nair, D. Dynamically Pruning Segformer for Efficient Semantic Segmentation. In Proceedings of the ICASSP 2022—2022 IEEE International Conference on Acoustics, Speech and Signal Processing (ICASSP), Singapore, 22–27 May 2022; pp. 3298–3302. [Google Scholar]
- Xie, E.; Wang, W.; Yu, Z.; Anandkumar, A.; Alvarez, J.M.; Luo, P. SegFormer: Simple and Efficient Design for Semantic Segmentation with Transformers. Adv. Neural Inf. Process. Syst. 2021, 34, 12077–12090. [Google Scholar]
- Knight, J.F.; Corcoran, J.M.; Rampi, L.P.; Pelletier, K.C. Theory and Applications of Object-Based Image Analysis and Emerging Methods in Wetland Mapping. In Remote Sensing of Wetlands; Tiner, R.W., Lang, M.W., Klemas, V.V., Eds.; CRC Press: Boca Raton, FL, USA, 2015; pp. 194–213. ISBN 978-0-429-18329-4. [Google Scholar]
- O’Neil, G.L.; Goodall, J.L.; Behl, M.; Saby, L. Deep learning Using Physically-Informed Input Data for Wetland Identification. Environ. Model. Softw. 2020, 126, 104665. [Google Scholar] [CrossRef]
- Lin, X.; Cheng, Y.; Chen, G.; Chen, W.; Chen, R.; Gao, D.; Zhang, Y.; Wu, Y. Semantic Segmentation of China’s Coastal Wetlands Based on Sentinel-2 and Segformer. Remote Sens. 2023, 15, 3714. [Google Scholar] [CrossRef]
- López-Tapia, S.; Ruiz, P.; Smith, M.; Matthews, J.; Zercher, B.; Sydorenko, L.; Varia, N.; Jin, Y.; Wang, M.; Dunn, J.B.; et al. Machine learning with high-resolution aerial imagery and data fusion to improve and automate the detection of wetlands. Int. J. Appl. Earth Obs. Geoinf. 2021, 105, 102581. [Google Scholar] [CrossRef]
- Cheng, J.; Deng, C.; Su, Y.; An, Z.; Wang, Q. Methods and datasets on semantic segmentation for Unmanned Aerial Vehicle remote sensing images: A review. ISPRS J. Photogramm. Remote Sens. 2024, 211, 1–34. [Google Scholar] [CrossRef]
- Zhang, Y.; Wang, X.; Cai, J.; Yang, Q. MW-SAM:Mangrove wetland remote sensing image segmentation network based on segment anything model. IET Image Process. 2024, 18, 4503–4513. [Google Scholar] [CrossRef]
- Musungu, K.; Dube, T.; Smit, J.; Shoko, M. Using UAV multispectral photography to discriminate plant species in a seep wetland of the Fynbos Biome. Wetl. Ecol. Manag. 2024, 32, 207–227. [Google Scholar] [CrossRef]
- Fu, Y.; Zhang, X.; Wang, M. DSHNet: A Semantic Segmentation Model of Remote Sensing Images Based on Dual Stream Hybrid Network. IEEE J. Sel. Top. Appl. Earth Obs. Remote Sens. 2024, 17, 4164–4175. [Google Scholar] [CrossRef]
- Meng, L.; Zhou, J.; Liu, S.; Wang, Z.; Zhang, X.; Ding, L.; Shen, L.; Wang, S. A robust registration method for UAV thermal infrared and visible images taken by dual-cameras. ISPRS J. Photogramm. Remote Sens. 2022, 192, 189–214. [Google Scholar] [CrossRef]
- Wang, Z.; Zhou, J.; Ma, J.; Wang, Y.; Liu, S.; Ding, L.; Tang, W.; Pakezhamu, N.; Meng, L. Removing temperature drift and temporal variation in thermal infrared images of a UAV uncooled thermal infrared imager. ISPRS J. Photogramm. Remote Sens. 2023, 203, 392–411. [Google Scholar] [CrossRef]
- Nuradili, P.; Zhou, G.; Zhou, J.; Wang, Z.; Meng, Y.; Tang, W.; Melgani, F. Semantic segmentation for UAV low-light scenes based on deep learning and thermal infrared image features. Int. J. Remote Sens. 2024, 45, 4160–4177. [Google Scholar] [CrossRef]
- Mao, A.; Mohri, M.; Zhong, Y. Cross-Entropy Loss Functions: Theoretical Analysis and Applications. In Proceedings of the International Conference on Machine Learning, PMLR, Honolulu, HI, USA, 23–29 July 2023; pp. 23803–23828. [Google Scholar]
- Jadon, S. A survey of loss functions for semantic segmentation. In Proceedings of the 2020 IEEE Conference on Computational Intelligence in Bioinformatics and Computational Biology (CIBCB), Vina del Mar, Chile, 27–29 October 2020; pp. 1–7. [Google Scholar]
Disclaimer/Publisher’s Note: The statements, opinions and data contained in all publications are solely those of the individual author(s) and contributor(s) and not of MDPI and/or the editor(s). MDPI and/or the editor(s) disclaim responsibility for any injury to people or property resulting from any ideas, methods, instructions or products referred to in the content. |
© 2024 by the authors. Licensee MDPI, Basel, Switzerland. This article is an open access article distributed under the terms and conditions of the Creative Commons Attribution (CC BY) license (https://creativecommons.org/licenses/by/4.0/).