
A Review of Lidar Technology in China’s Lunar Exploration Program

Abstract
1. Introduction
2. Altimeters for Chang’E-1 and Chang’E-2
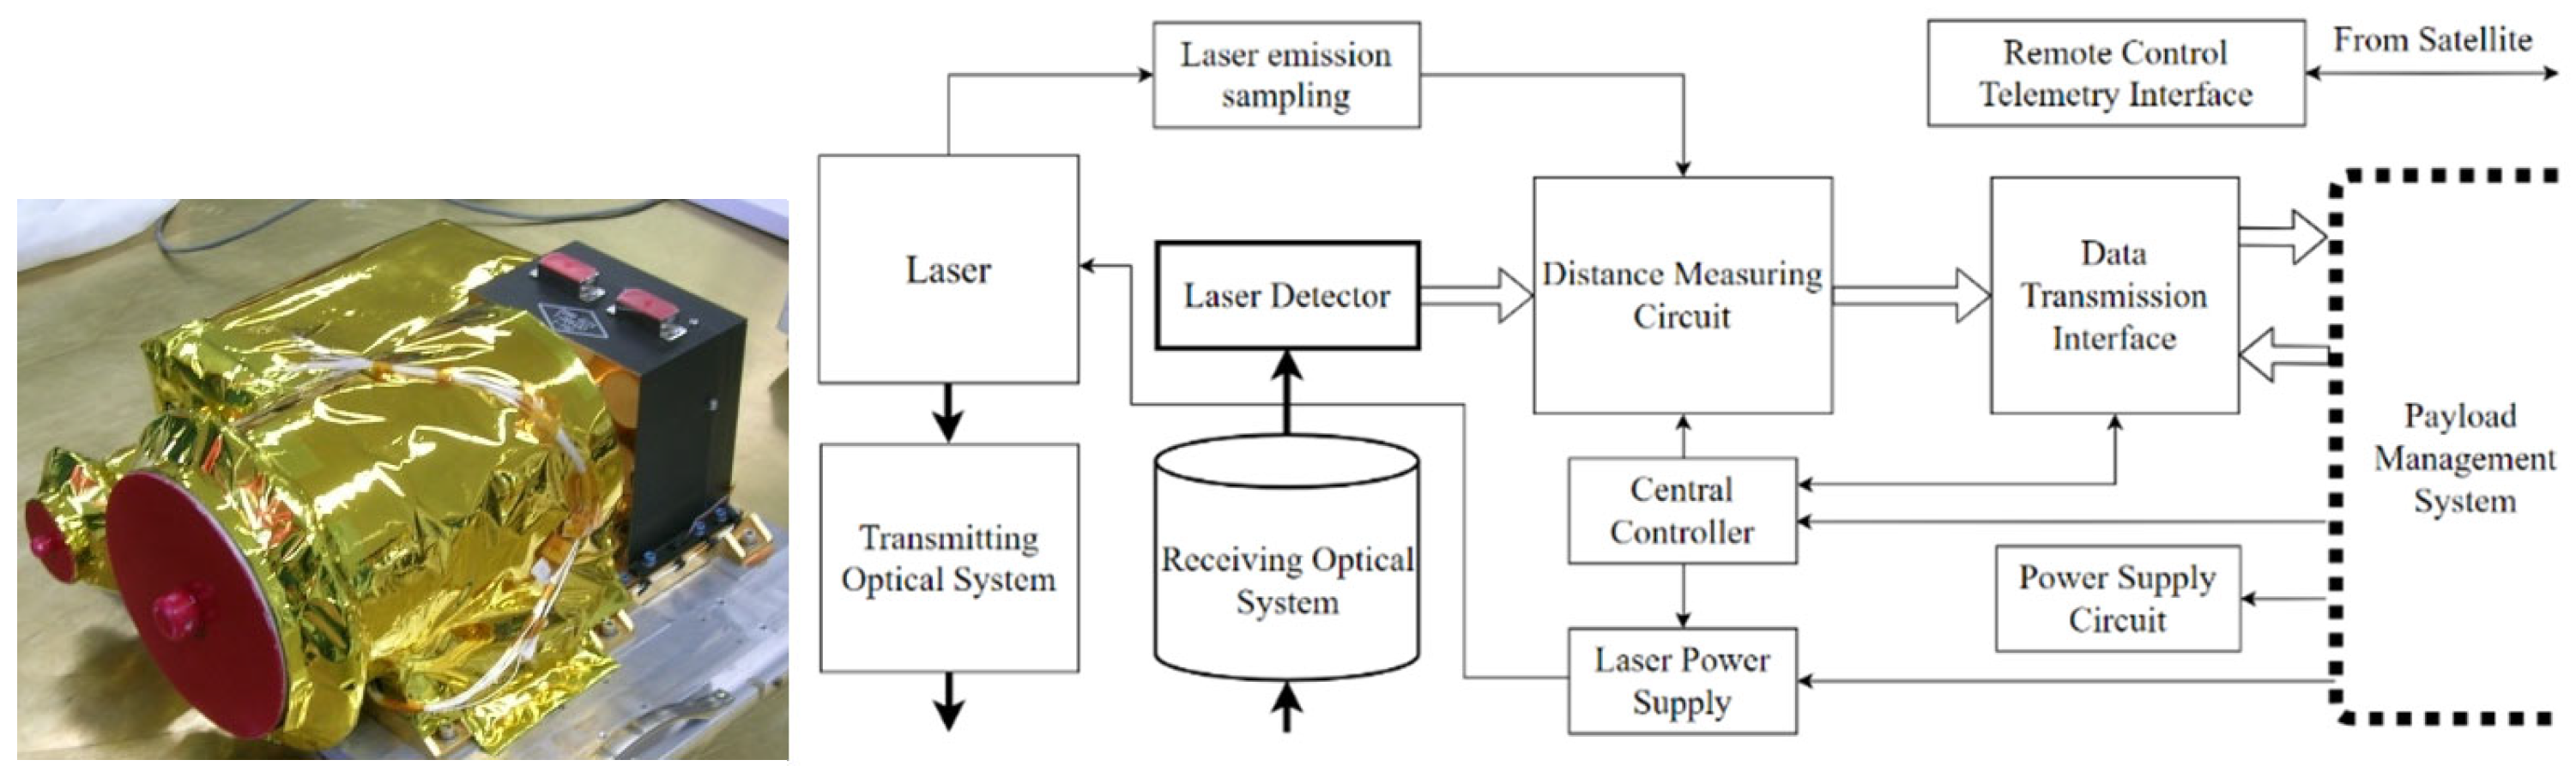
2.1. Instrument
2.1.1. Hardware Configuration
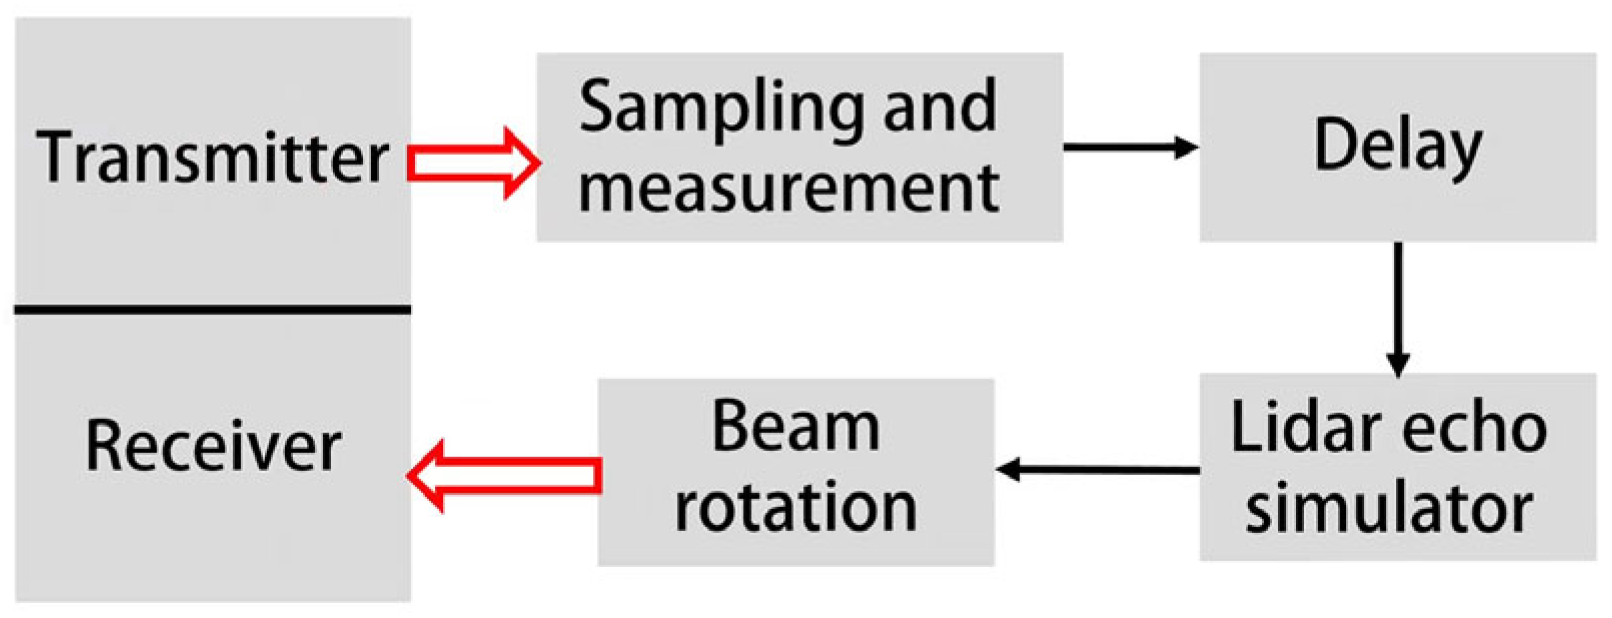
2.1.2. Critical Technologies
2.1.3. Algorithm Description
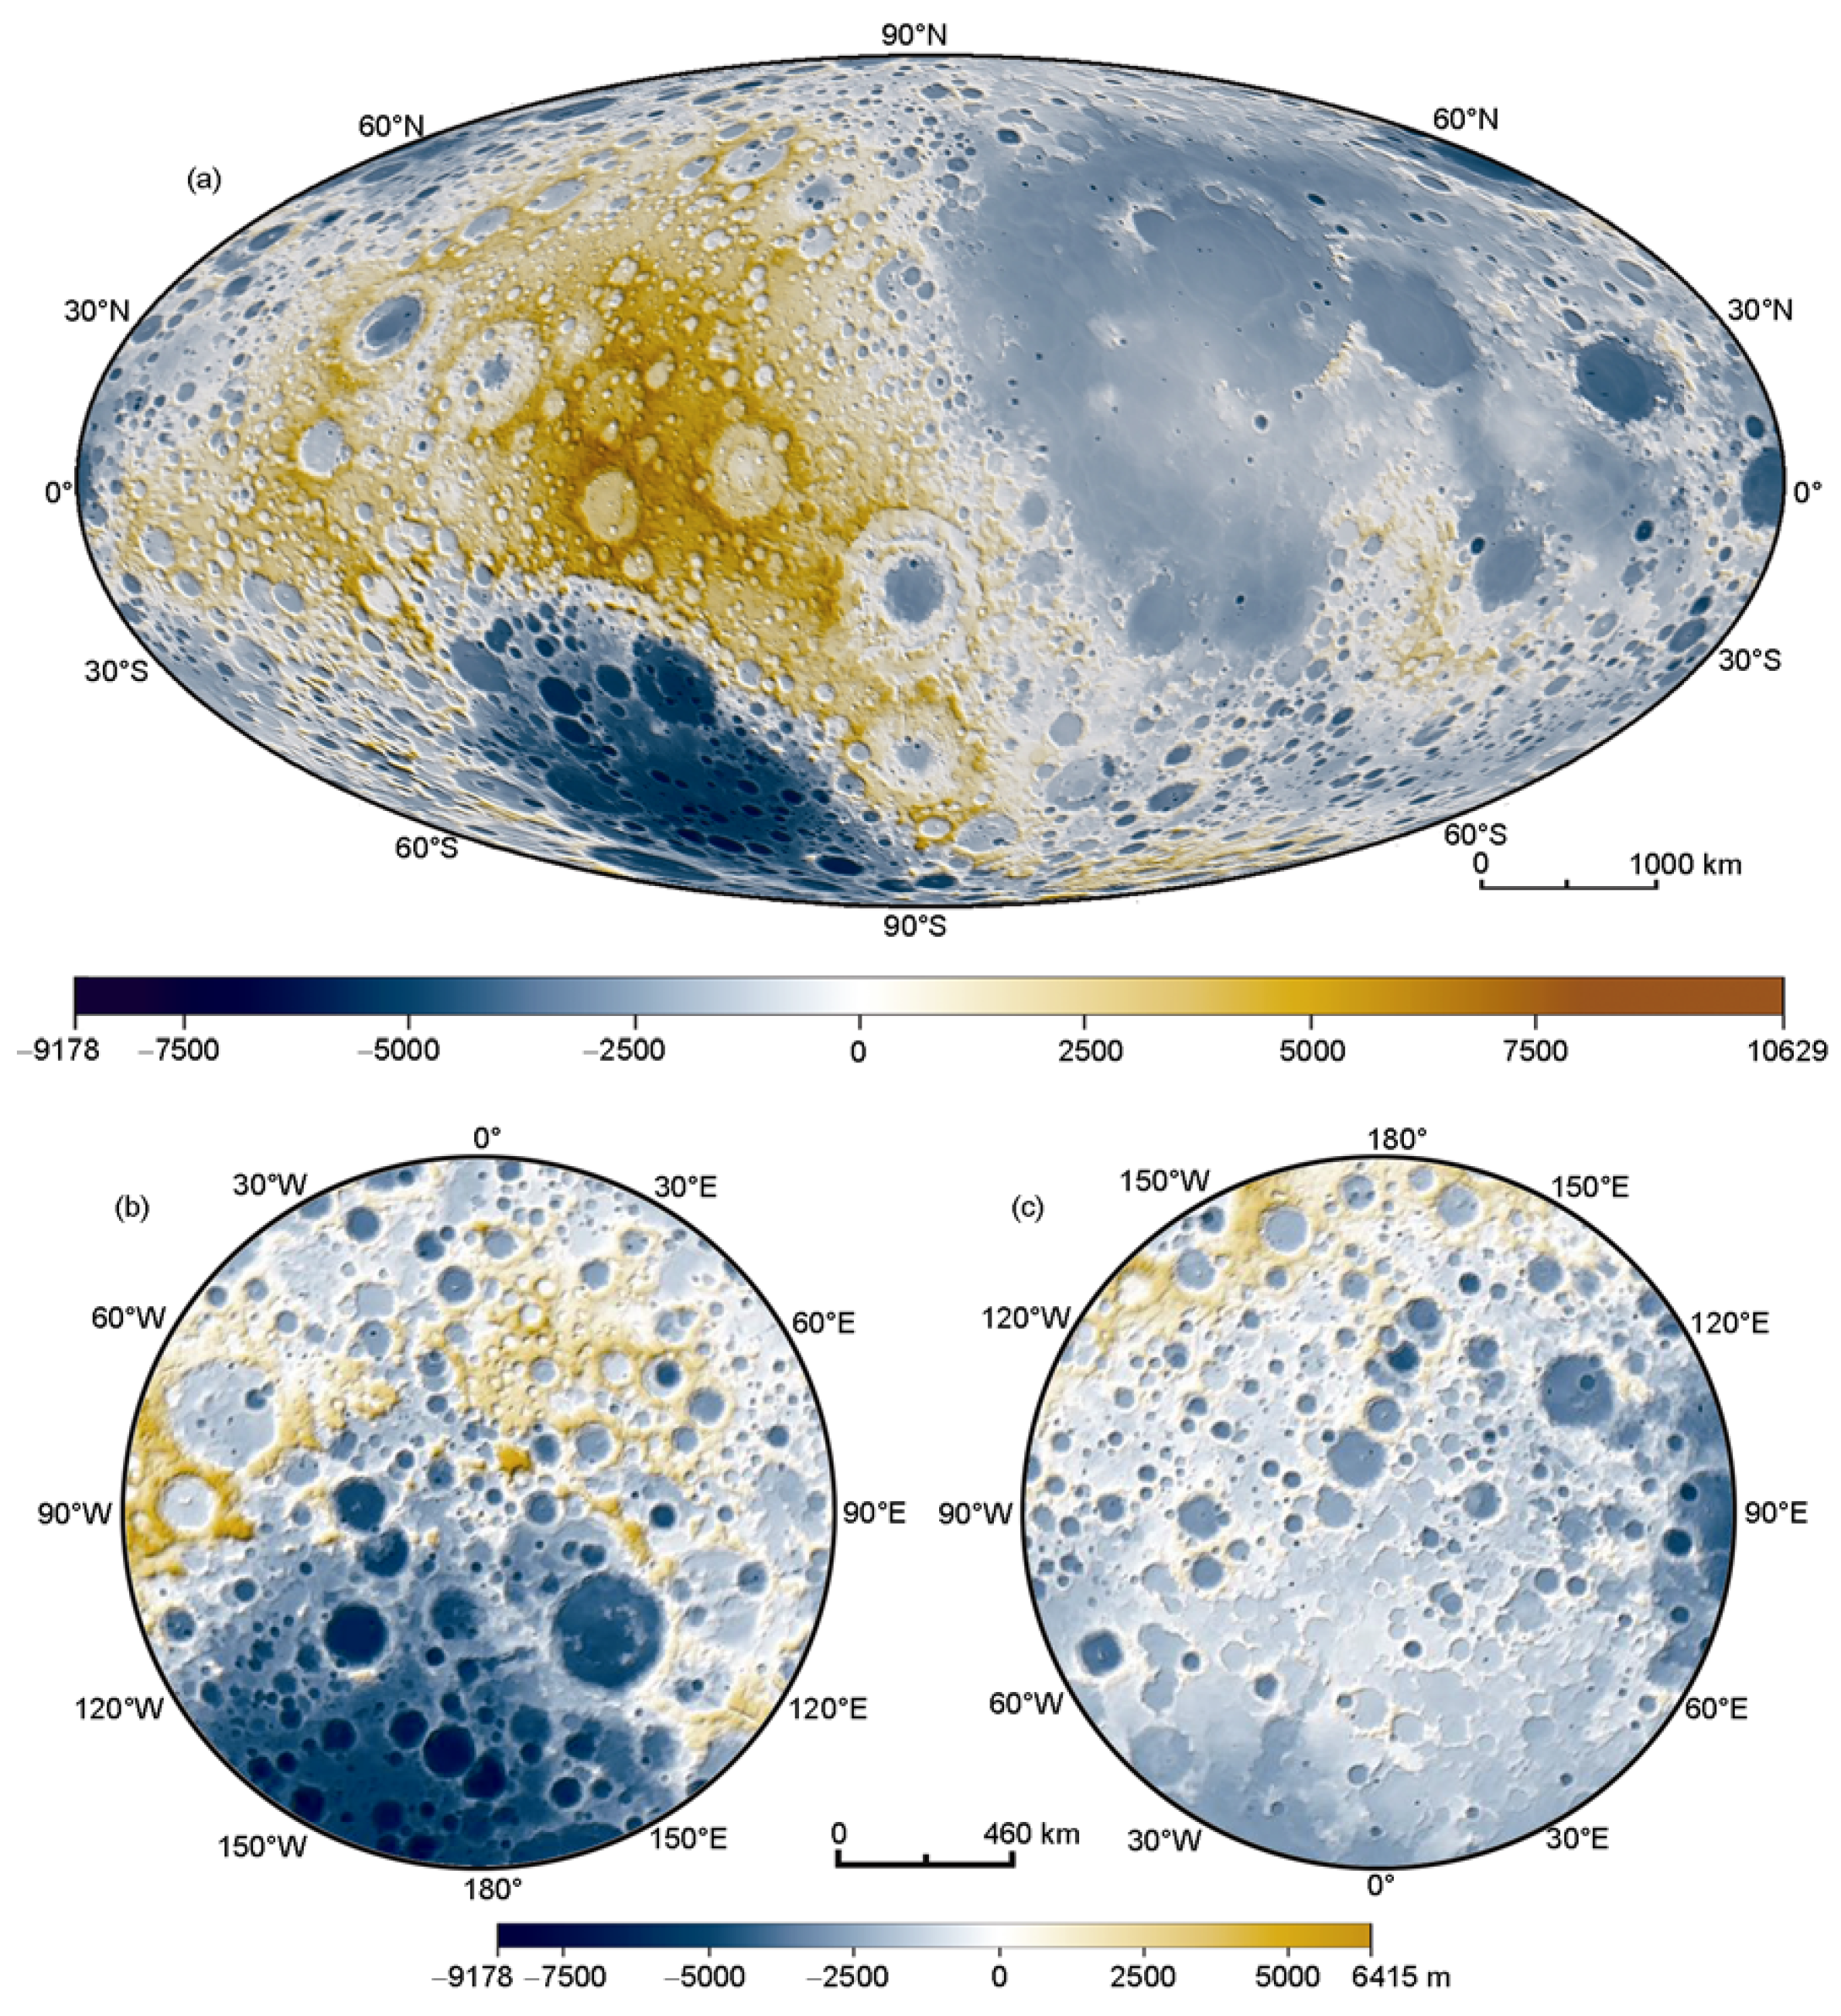
2.1.4. Results
2.2. Introduction to International Progress
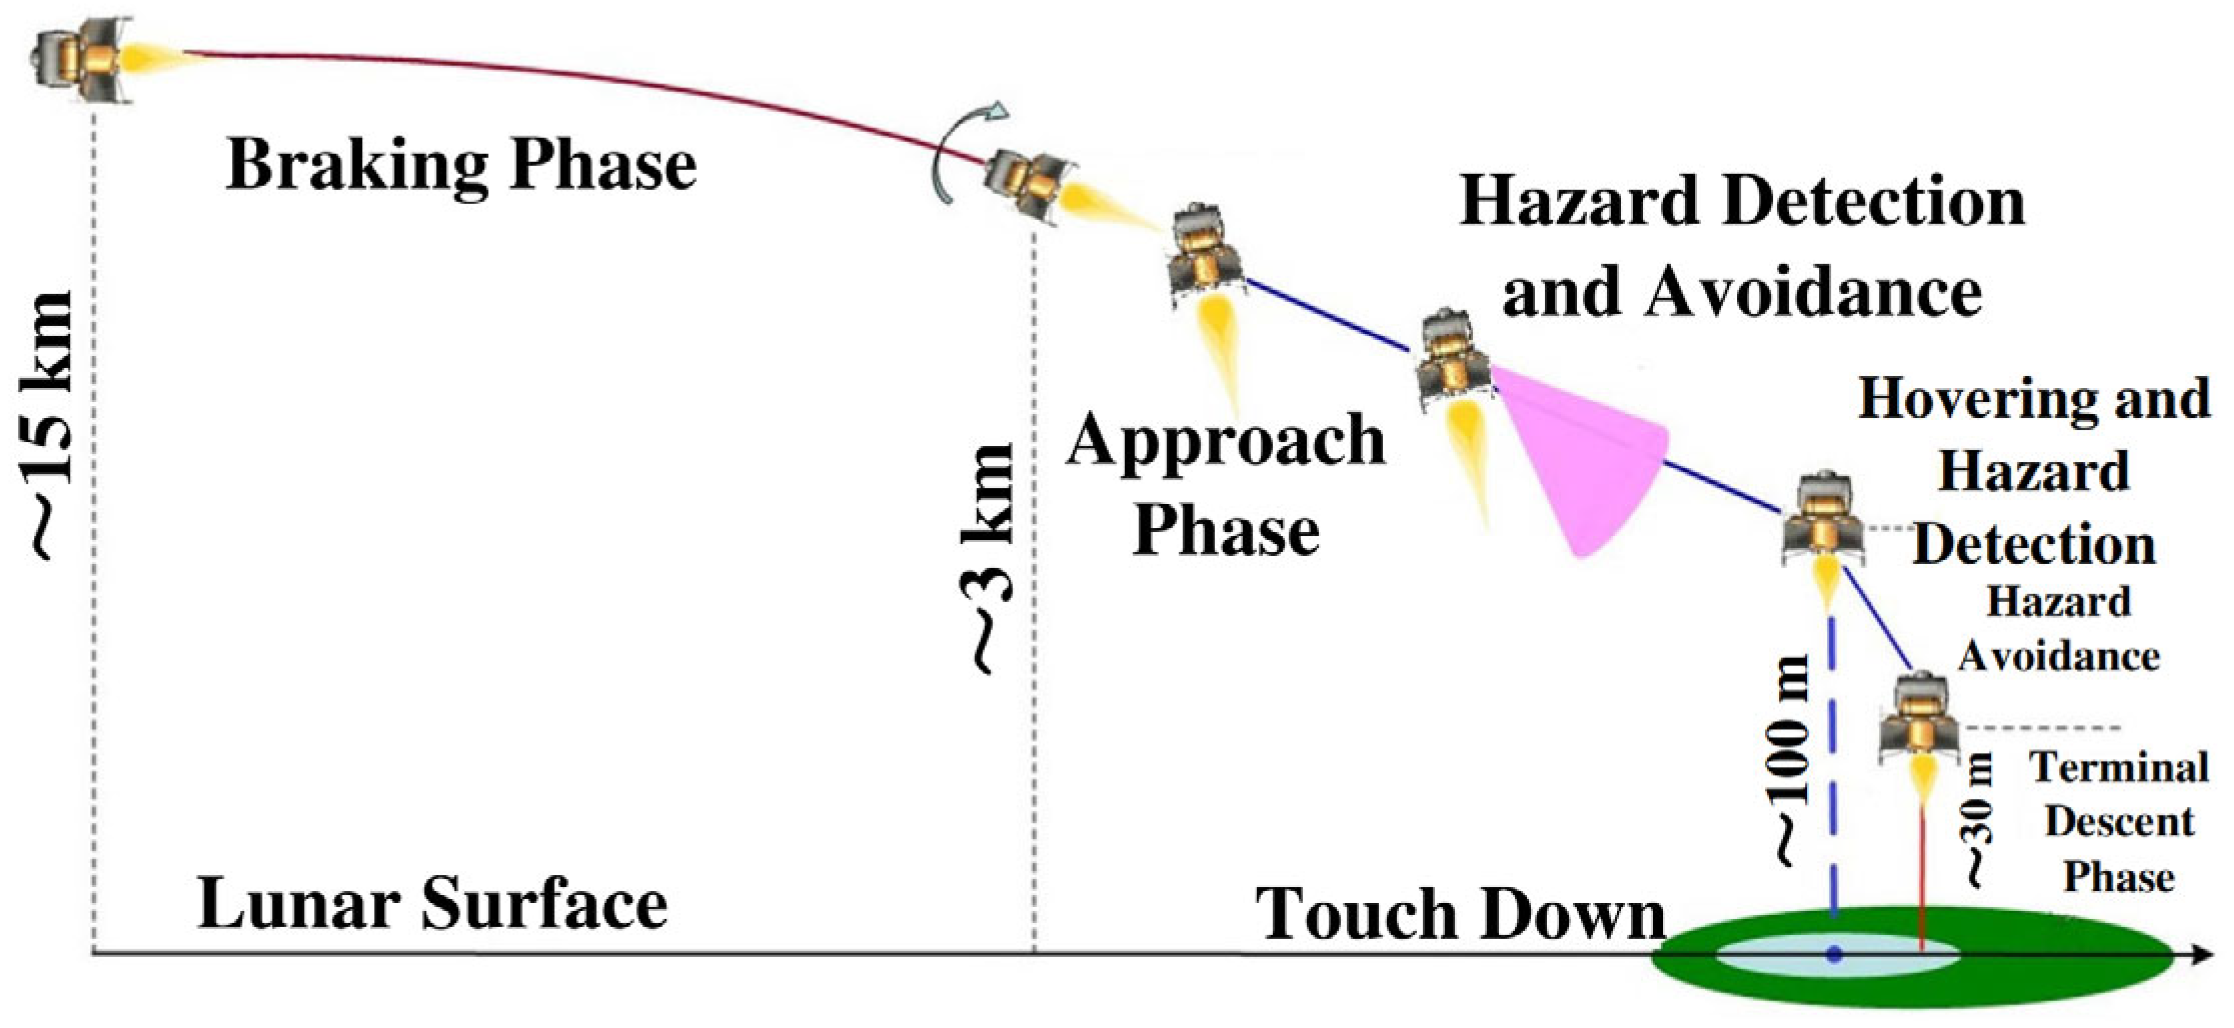
3. Laser 3D Imaging Sensor for Chang’E-3, Chang’E-4, and Chang’E-5
3.1. Instrument
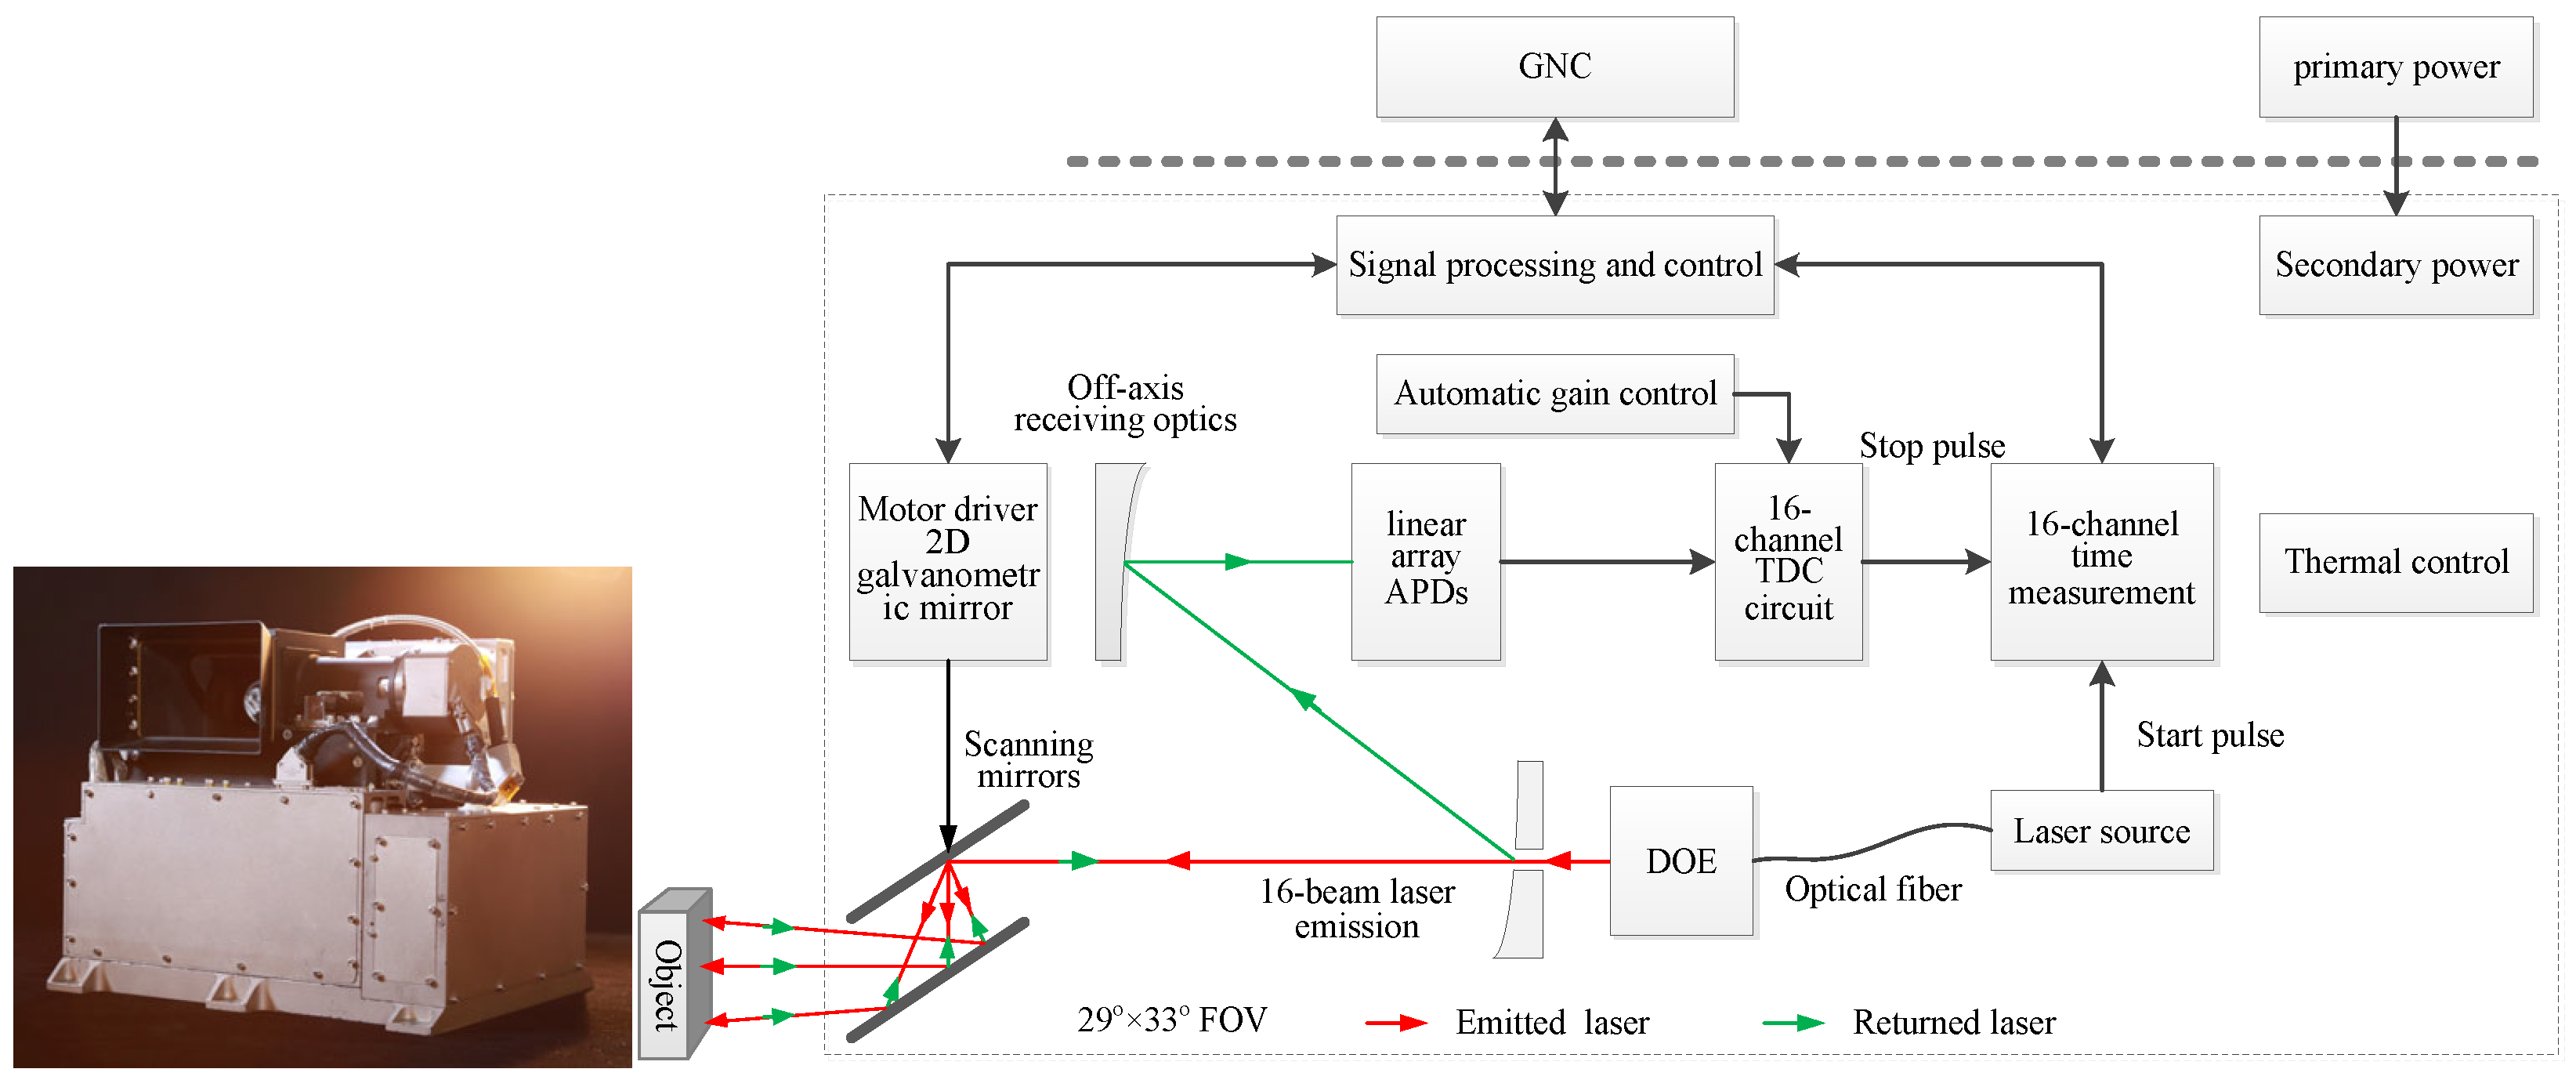
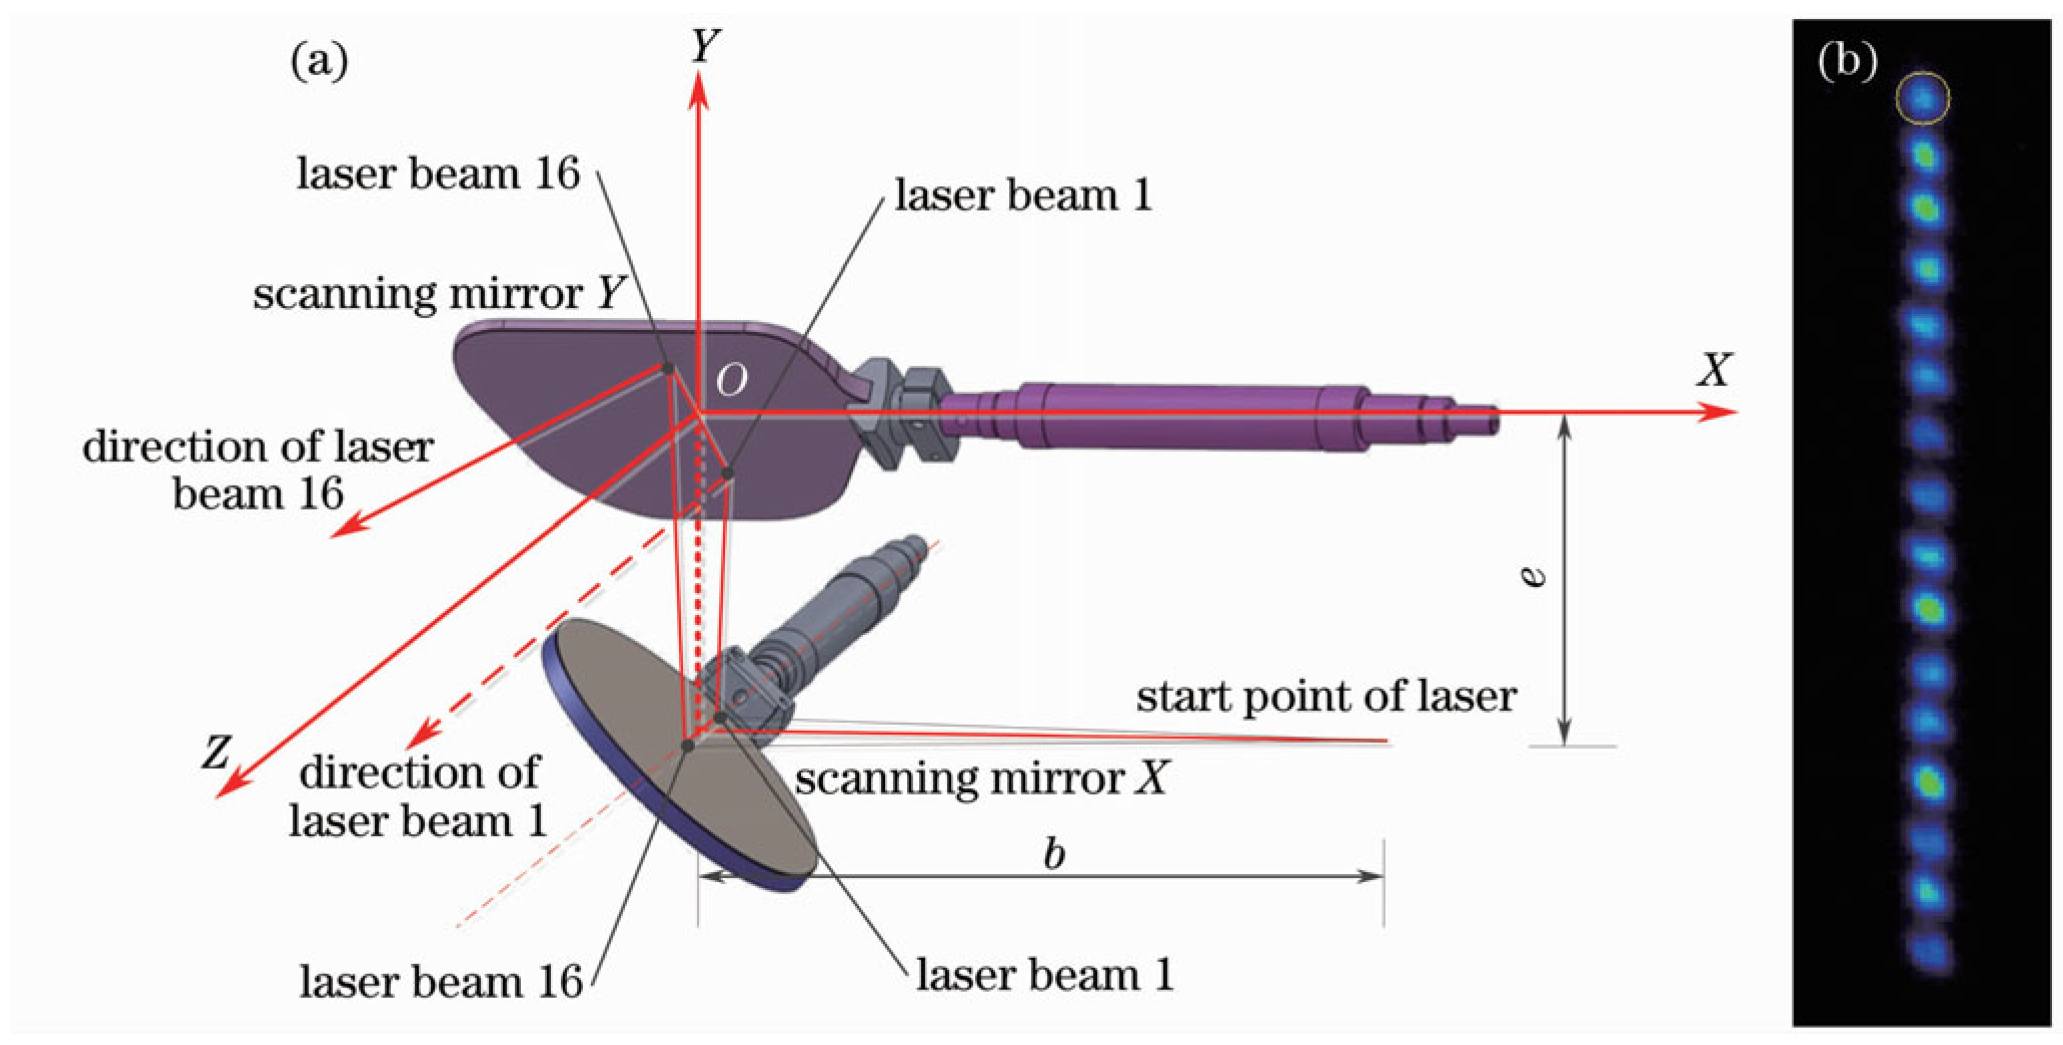
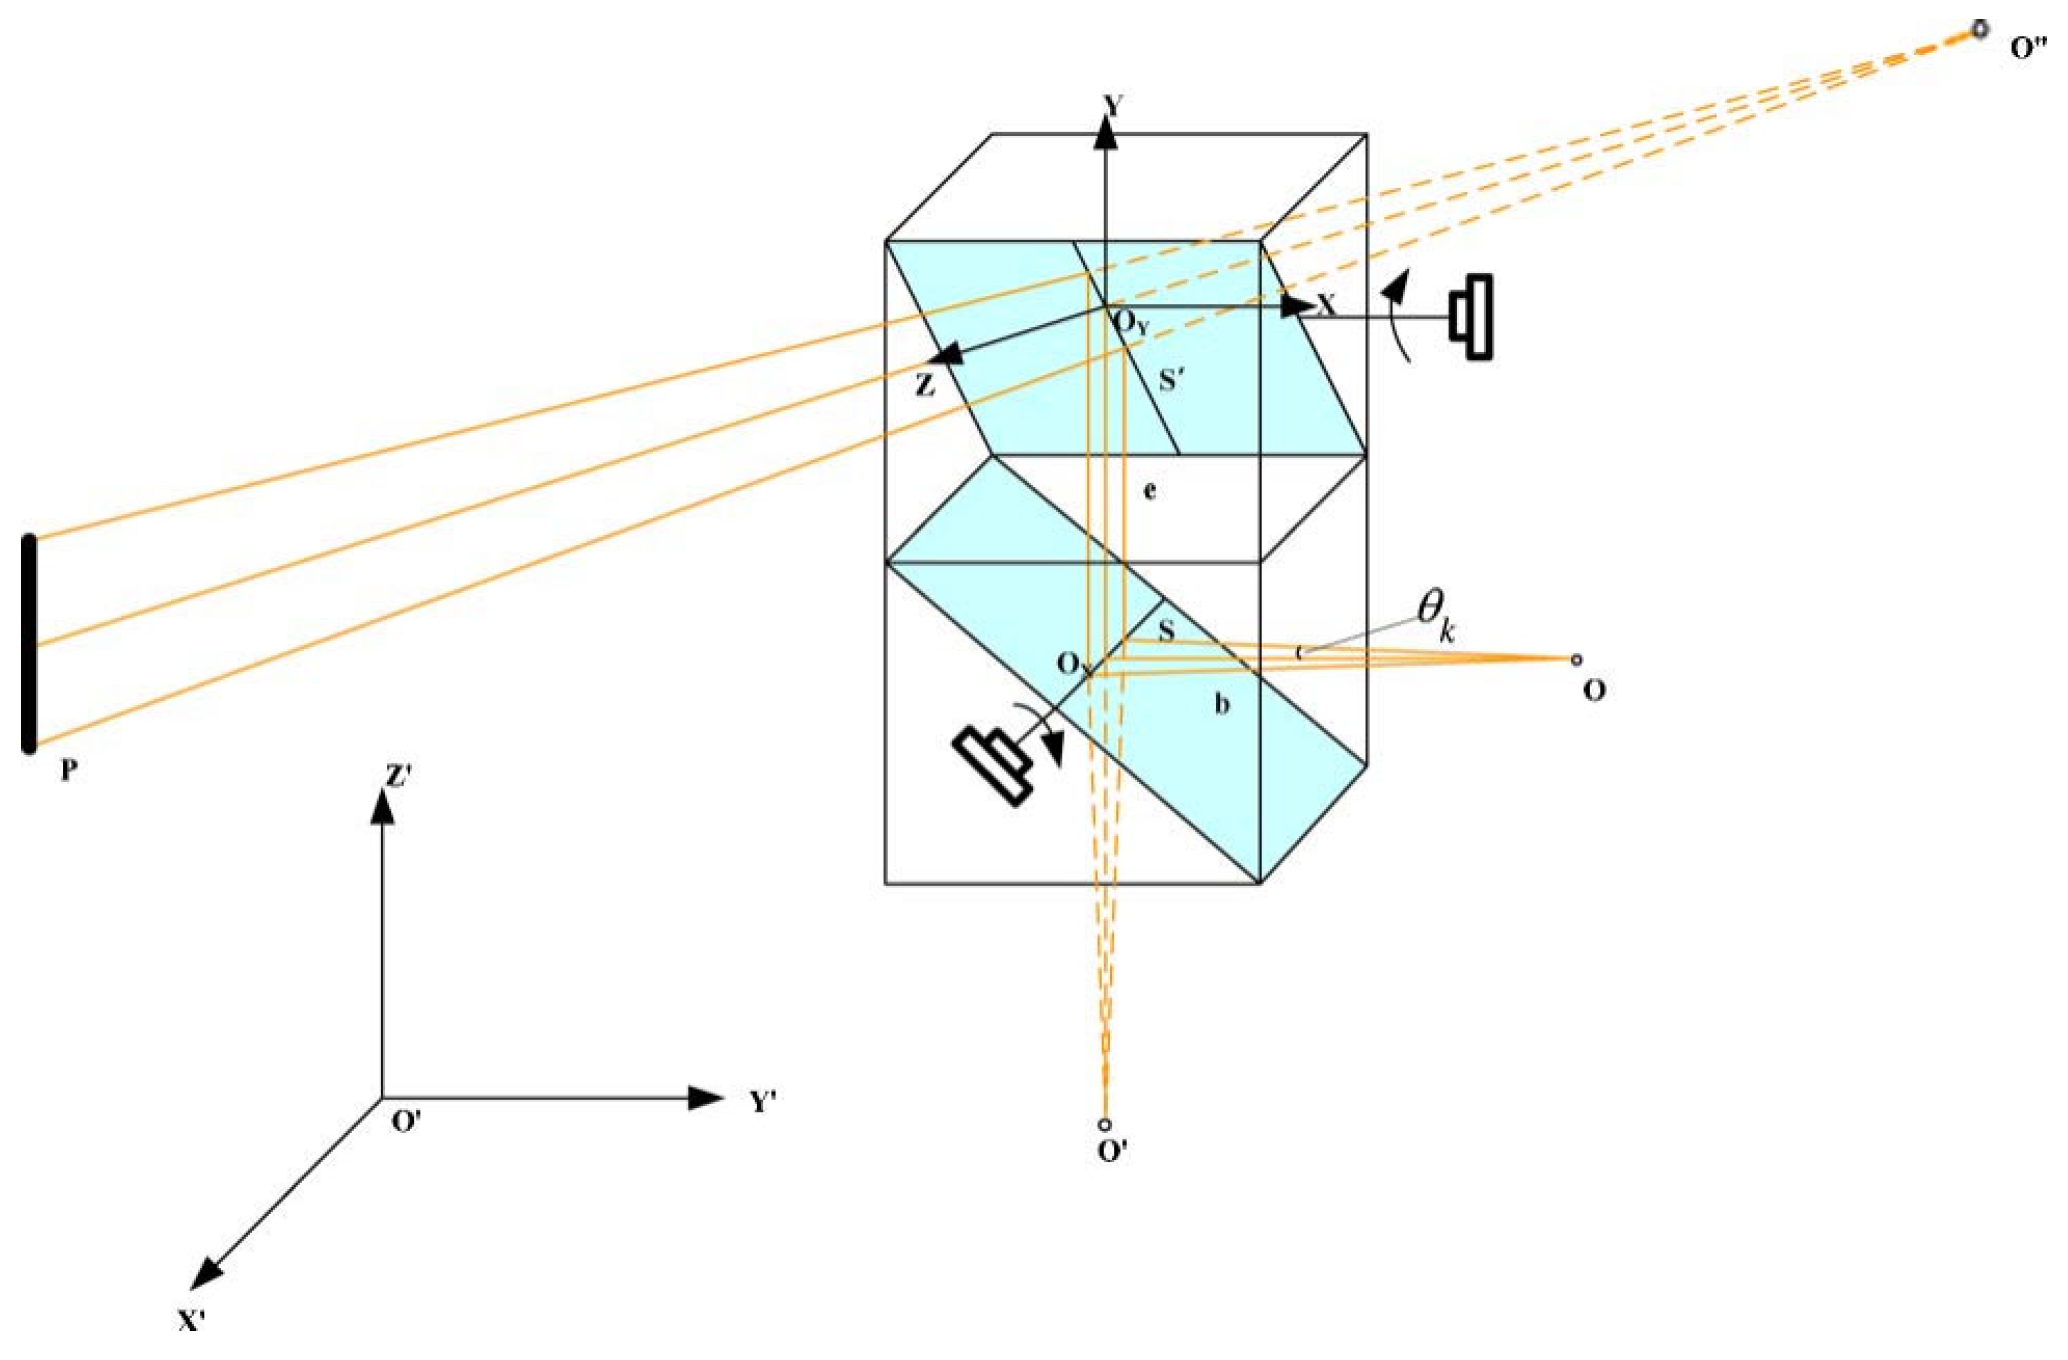
3.1.1. Hardware Configuration
3.1.2. Algorithm Description
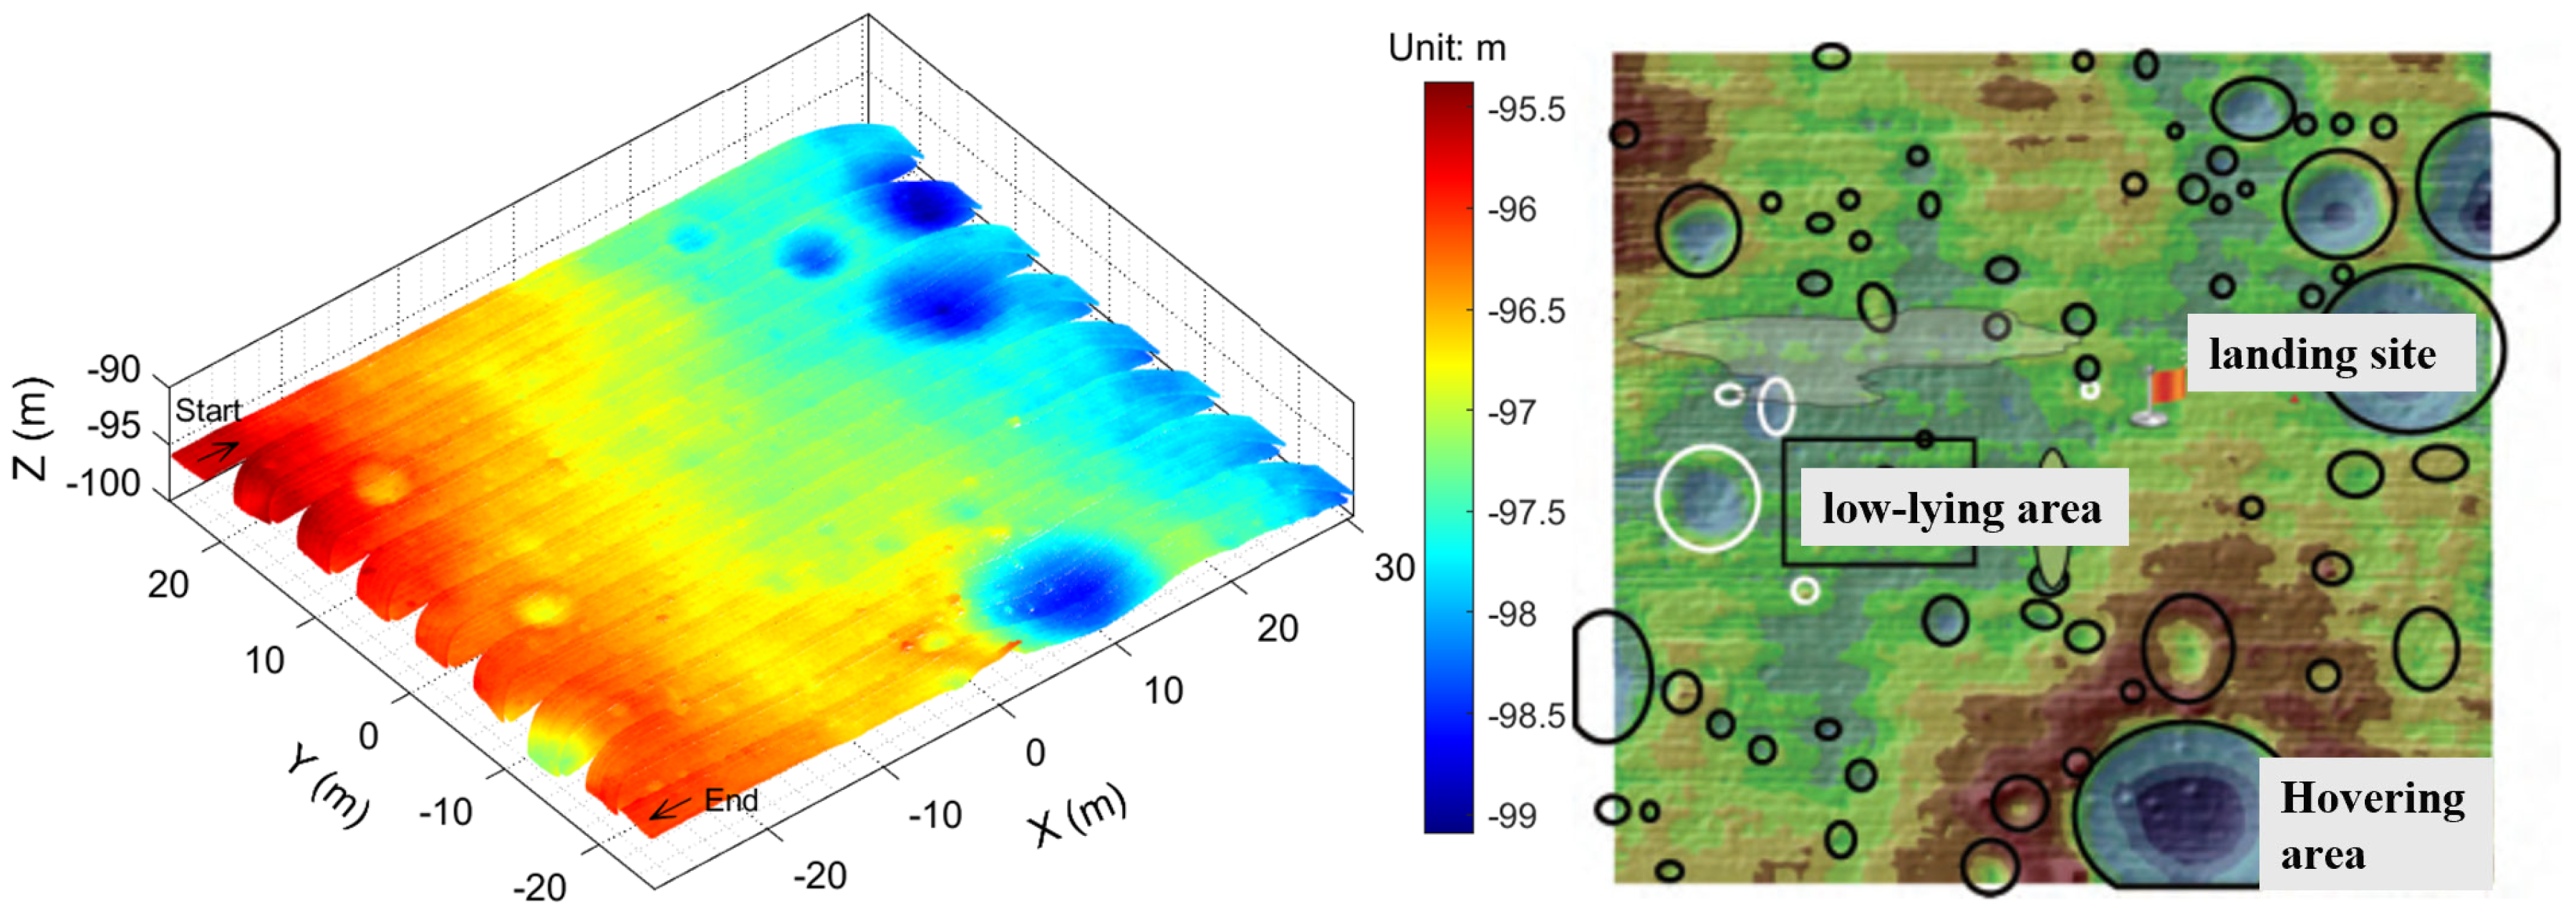
3.1.3. Results
3.2. Introduction to International Progress
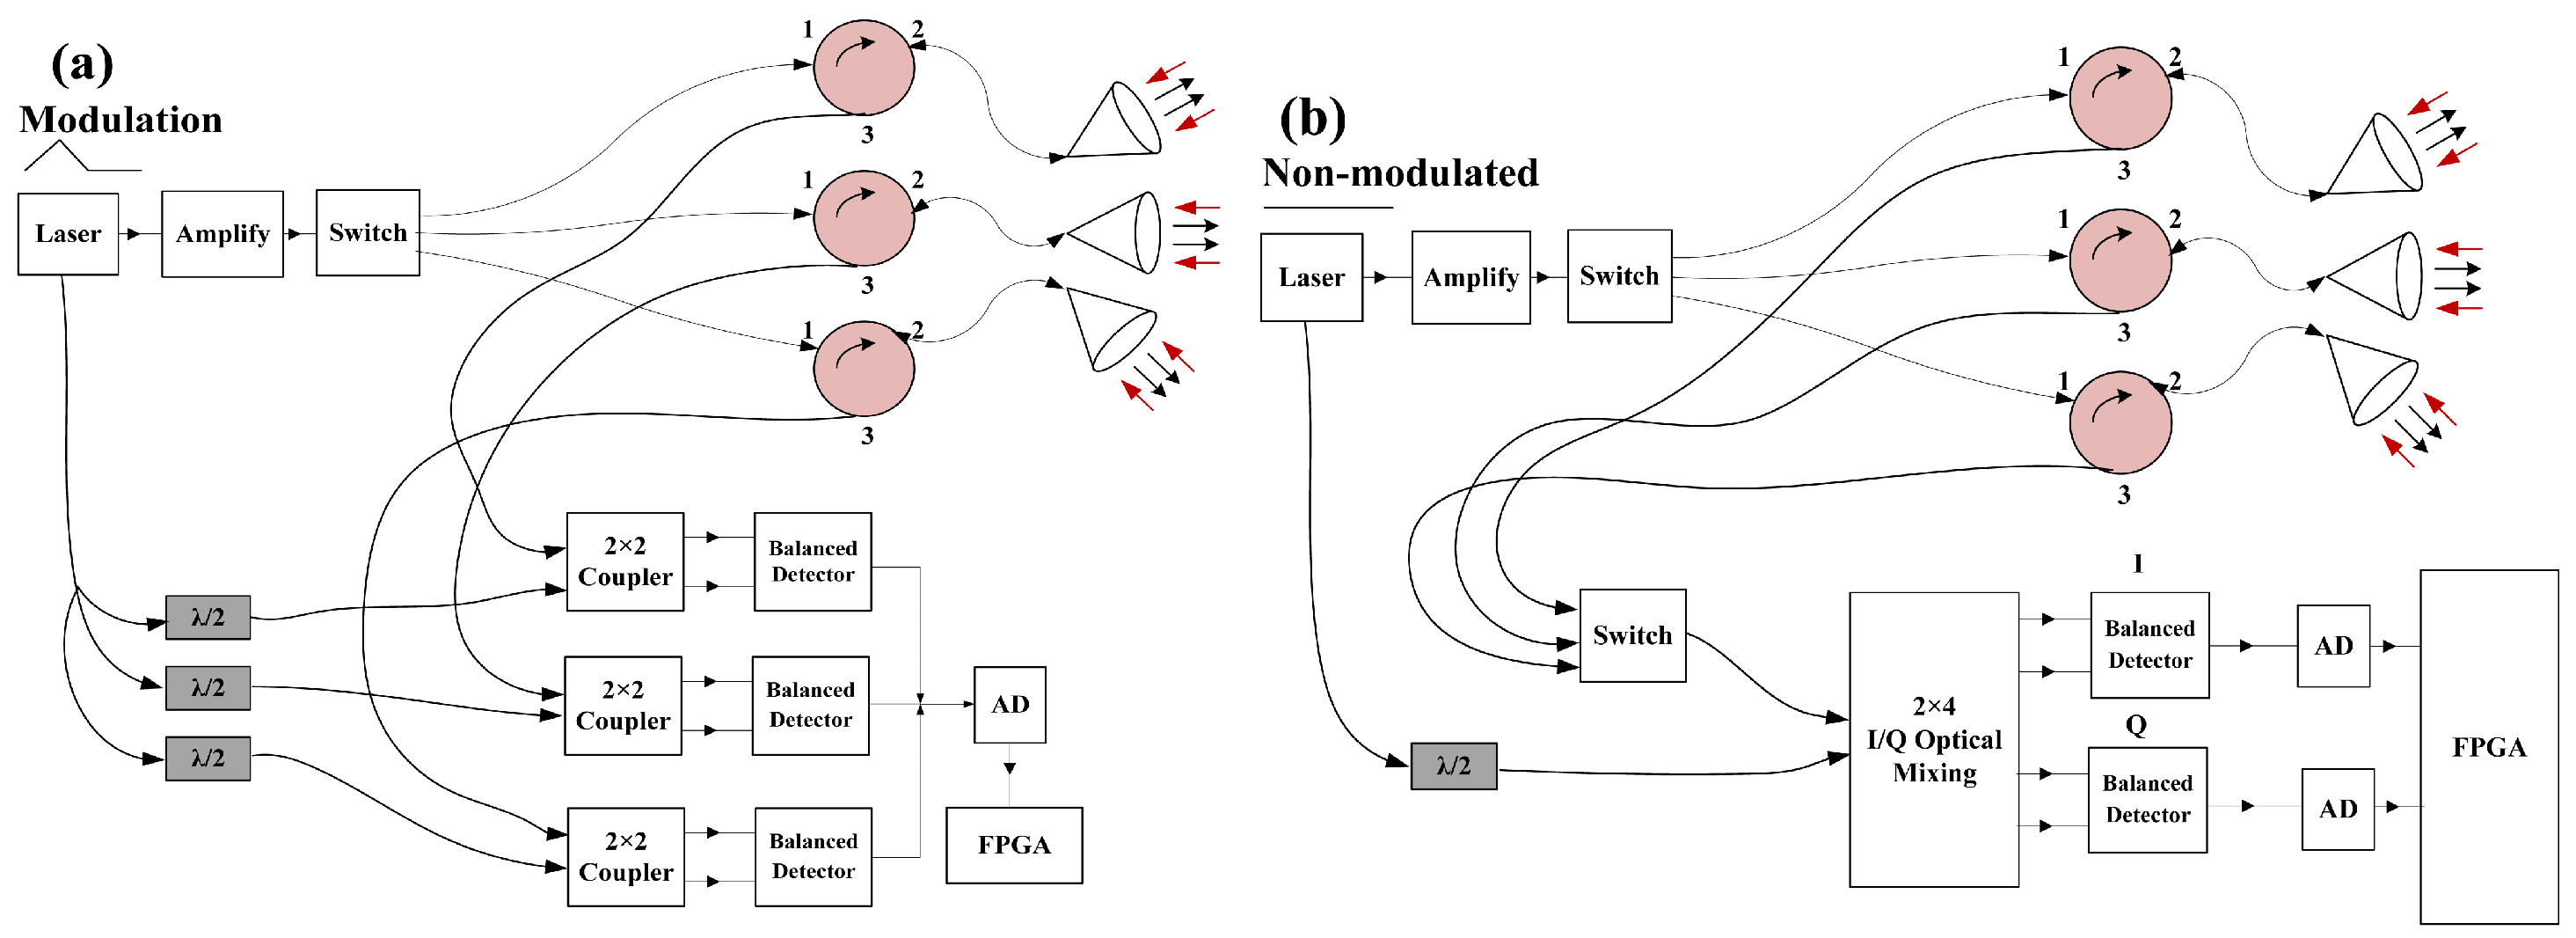
4. Navigation Doppler Lidar for Chang’E-5
4.1. Instrument
4.1.1. Hardware Configuration
4.1.2. Algorithm Description
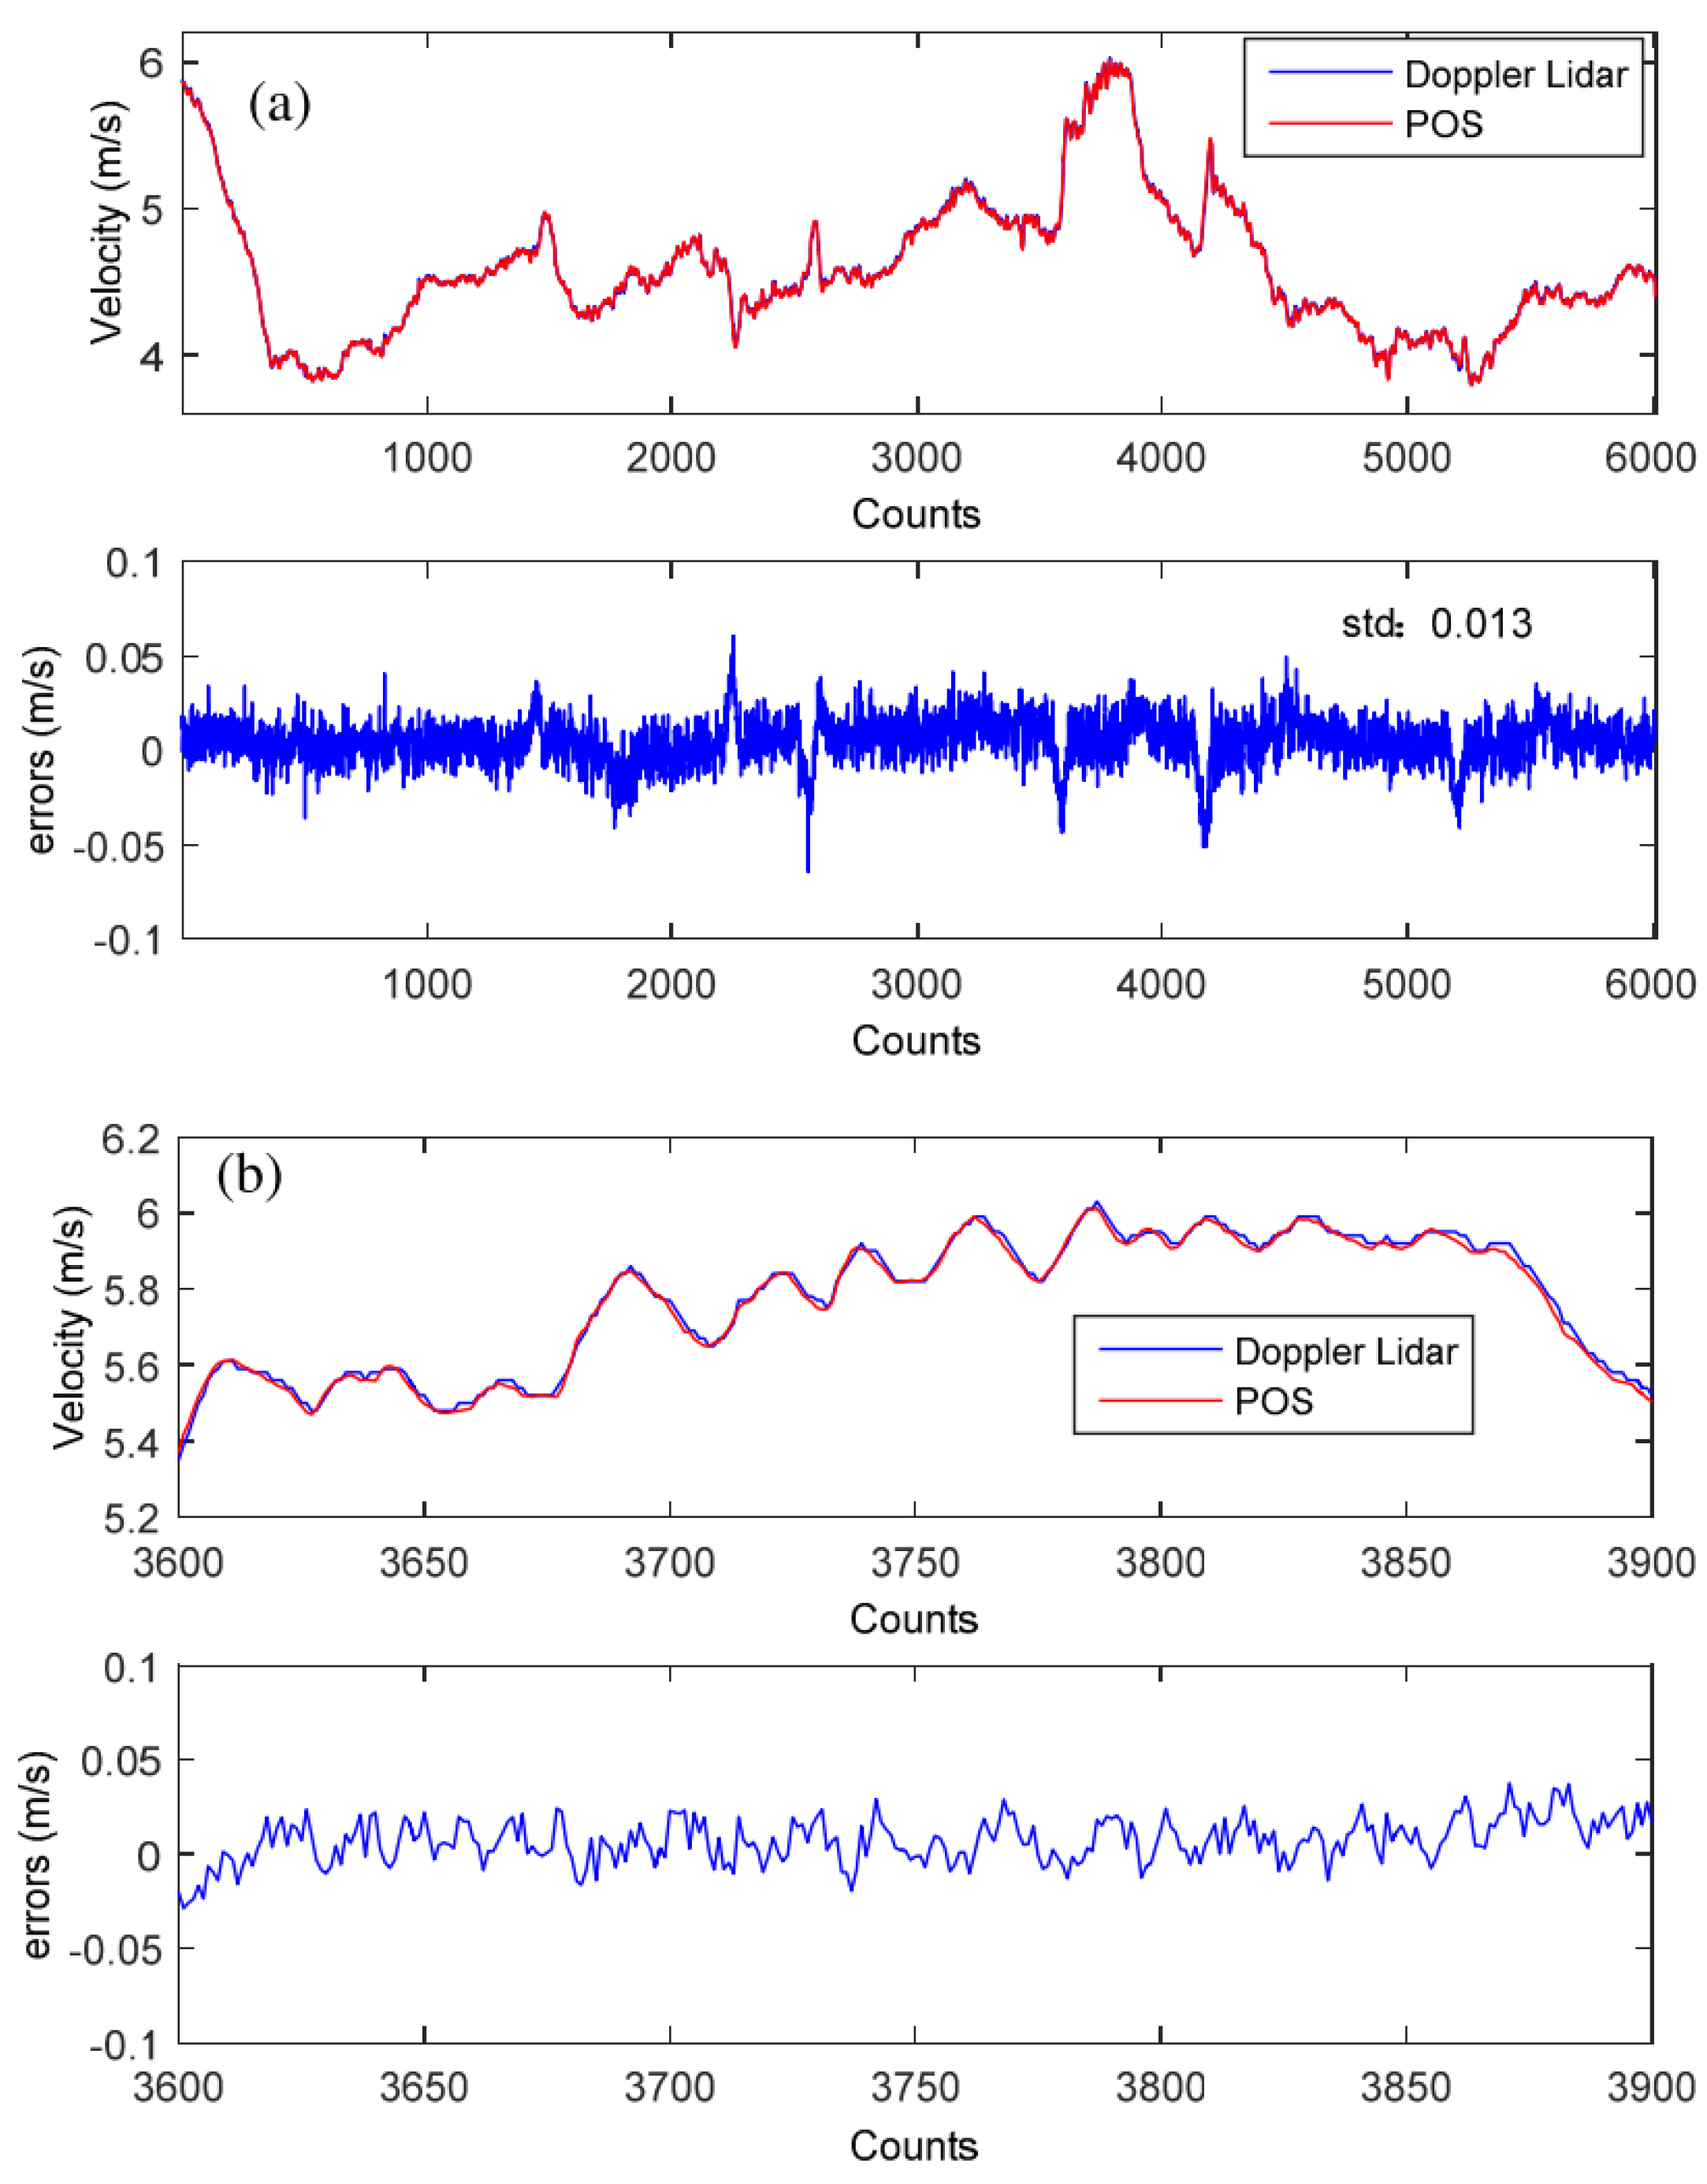
4.1.3. Results
4.2. Introduction to International Progress
5. Key Technological Development Trends
5.1. Novel Space Laser
5.2. Near-Infrared Single-Photon Detection
5.3. Multi-Beam Transmit–Receive Three-Dimensional Detection
5.4. Novel Laser Detection
6. Conclusions
Author Contributions
Funding
Data Availability Statement
Conflicts of Interest
References
- Slyuta, E. The Luna program. In Sample Return Missions; Elsevier: Amsterdam, The Netherlands, 2021; pp. 37–78. [Google Scholar]
- Zheng, Y.; Ouyang, Z.; Li, C.; Liu, J.; Zou, Y. China’s Lunar Exploration Program: Present and future. Planet. Space Sci. 2008, 56, 881–886. [Google Scholar] [CrossRef]
- Li, C.; Wang, C.; Wei, Y.; Lin, Y. China’s present and future lunar exploration program. Science 2019, 365, 238–239. [Google Scholar] [CrossRef]
- Rong, S.; Genghua, H.; Wei, K. Development and review of space-based laser altimetry technology. Infrared Laser Eng. 2020, 49, 20201047-1. [Google Scholar] [CrossRef]
- Jianyu, W.; Rong, S.; Weibiao, C.; Jianjun, J.; Genghua, H.; Binyong, W.; Xia, H. Chang’E-1 Satellite-Borne Laser Altimeter. Sci. China-Phys. Mech. Astron. 2010, 40, 1063–1070. [Google Scholar]
- Huang, G.; Wang, B.; Shu, R. Ground-based calibration and performance verification of the lunar observation laser altimeter. Infrared Laser Eng. 2006, 35, 375–377. [Google Scholar]
- Cai, Z.-C.; Liang, Y.-Y.; Li, J.; Tang, Z.-S.; Qi, D.-X. Digital elevation model of the Moon from the Chang’E-1 Laser altimeter. Prog. Geophys. 2010, 25, 1153–1160. [Google Scholar]
- Oliver, M.A.; Webster, R. Kriging: A method of interpolation for geographical information systems. Int. J. Geogr. Inf. Syst. 1990, 4, 313–332. [Google Scholar] [CrossRef]
- Kleijnen, J. Kriging: Methods and Applications. CentER Discussion Paper Series No. 2017-047. 2017. Available online: https://ssrn.com/abstract=3075151 (accessed on 12 September 2024).
- Zhang, Y.; Cao, J.; Zhang, B.; Zheng, X.; Chen, W. A comparative study of different radial basis function interpolation algorithms in the reconstruction and path planning of γ radiation fields. Nucl. Eng. Technol. 2024, 56, 2806–2820. [Google Scholar] [CrossRef]
- Sawaryn, S.J.; Thorogood, J.L. A Compendium of Directional Calculations Based on the Minimum Curvature Method. SPE Drill. Complet. 2005, 20, 24–36. [Google Scholar] [CrossRef]
- Xing, Y.; Song, Q.; Cheng, G. Benefit of Interpolation in Nearest Neighbor Algorithms. SIAM J. Math. Data Sci. 2022, 4, 935–956. [Google Scholar] [CrossRef]
- Watson, D.F.; Philip, G.M. Triangle based interpolation. J. Int. Assoc. Math. Geol. 1984, 16, 779–795. [Google Scholar] [CrossRef]
- Li, C.; Ren, X.; Liu, J.; Zou, X.; Mu, L.; Wang, J.; Shu, R.; Zou, Y.; Zhang, H.; Lü, C. Laser altimetry data of Chang’E-1 and the global lunar DEM model. Sci. China Earth Sci. 2010, 53, 1582–1593. [Google Scholar] [CrossRef]
- Snyder, J.P. Map Projections: A Working Manual; US Government Printing Office: Washington, DC, USA, 1987; Volume 1395. [Google Scholar]
- Smith, D.E.; Zuber, M.T.; Neumann, G.A.; Lemoine, F.G.; Mazarico, E.; Torrence, M.H.; McGarry, J.F.; Rowlands, D.D.; Head, J.W., III; Duxbury, T.H. Initial observations from the lunar orbiter laser altimeter (LOLA). Geophys. Res. Lett. 2010, 37, L18204. [Google Scholar] [CrossRef]
- Archinal, B.A.; Rosiek, M.R.; Kirk, R.L.; Redding, B.L. The Unified Lunar Control Network 2005; US Geological Survey: Sunrise Valley Drive Reston, VA, USA, 2006. [Google Scholar]
- Araki, H.; Tazawa, S.; Noda, H.; Ishihara, Y.; Goossens, S.; Sasaki, S.; Kawano, N.; Kamiya, I.; Otake, H.; Oberst, J.; et al. Lunar Global Shape and Polar Topography Derived from Kaguya-LALT Laser Altimetry. Science 2009, 323, 897–900. [Google Scholar] [CrossRef]
- Weiming, X.; Jun, L.; Ziqing, J.; Kuifeng, L.; Rong, S. Scanning Property Analysis and System Error Calibration of Dual Galvanometers Based Multi-Points Parallel Scanning Imaging Lidar. Chin. J. Lasers 2014, 41, 214002. [Google Scholar] [CrossRef]
- Liu, X.; Xu, W.; Xie, H.; Luan, K.; Zhang, Z.; Wang, F.; Jiang, Z.; Li, M.; Jiang, H.; Tong, P. Calibration and validation of a multi-beam LiDAR onboard China Chang’e lunar probe for landing obstacle avoidance. Opt. Laser Technol. 2025, 181, 111579. [Google Scholar] [CrossRef]
- Liu, X.; Tong, X.; Luan, K.; Xu, W.; Shu, R. Plane-based self-calibration and improvement of three-dimensional multi-beam laser scanning with two-axis-mirror. Meas. Sci. Technol. 2022, 33, 115015. [Google Scholar] [CrossRef]
- Lichti, D.D. Error modelling, calibration and analysis of an AM–CW terrestrial laser scanner system. ISPRS J. Photogramm. Remote Sens. 2007, 61, 307–324. [Google Scholar] [CrossRef]
- Rietdorf, A.; Gielsdorf, F.; Gruendig, L. A concept for the calibration of terrestrial laser scanners. In Proceedings of the INGEO 2004 and FIG Regional Central and Eastern European Conference of Engineering Surveying, Bratislava, Slovakia, 11–13 November 2004; p. 13. [Google Scholar]
- Glennie, C.; Lichti, D.D. Static Calibration and Analysis of the Velodyne HDL-64E S2 for High Accuracy Mobile Scanning. Remote Sens. 2010, 2, 1610–1624. [Google Scholar] [CrossRef]
- Lichti, D.D.; Chow, J.C. Inner constraints for planar features. Photogramm. Rec. 2013, 28, 74–85. [Google Scholar] [CrossRef]
- Wang, D.; Xu, C.; Huang, X. Overview of autonomous navigation based on sequential images for planetary landing. J. Harbin Inst. Technol. 2016, 48, 1–12. [Google Scholar]
- Johnson, A.; Klumpp, A.; Collier, J.; Wolf, A. Lidar-based hazard avoidance for landing on mars. In Proceedings of the AAS/AIAA Space Flight Machanics Meeting, Santa Barbara, CA, USA, 19–23 January 2025; p. 11. [Google Scholar]
- Wong, E.C.; Singh, G.; Masciarelli, J.P. Guidance and control design for hazard avoidance and safe landing on Mars. J. Spacecr. Rocket. 2006, 43, 378–384. [Google Scholar] [CrossRef]
- De Lafontaine, J.; Gueye, O. Autonomous Planetary Landing using a LIDAR sensor: The navigation function. Spacecr. Guid. Navig. Control. Syst. 2003, 516, 147. [Google Scholar]
- De Lafontaine, J.; Neveu, D.; Lebel, K. Autonomous planetary landing with obstacle avoidance: The quartic guidance revisited. In 14th AAS. In Proceedings of the AAIA Space Flight Mechanics Conference, Austin, TX, USA, 15–19 January 2023. [Google Scholar]
- De Lafontaine, J.; Neveu, D.; Lebel, K. Autonomous planetary landing using a lidar sensor: The closed-loop system. In Proceedings of the Guidance, Navigation and Control Systems, Loutraki, Greece, 17–20 October 2005. [Google Scholar]
- DE Lafontaine, J.; Ulitsky, A.; Tripp, J.W.; Richards, R.; Daly, M.; Sallaberger, C. LAPS: The development of a scanning lidar system with GNC for autonomous hazard avoidance and precision landing. In Proceedings of the Spaceborne Sensors, Orlando, FL, USA, 1 September 2004; pp. 81–93. [Google Scholar]
- Striepe, S.A.; Epp, C.D.; Robertson, E.A. Autonomous precision landing and hazard avoidance technology (ALHAT) project status as of May 2010. In Proceedings of the International Planetary Probe Workshop 2010 (IPPW-7), Barcelona, Spain, 14–18 June 2010. [Google Scholar]
- Keim, J.A.; Mobasser, S.; Da, K.; Yang, C.; Ivanov, T.; Johnson, A.E.; Goldberg, H.R.; Khanoyan, G.; Natzic, D.B. Field test implementation to evaluate a flash LIDAR as a primary sensor for safe lunar landing. In Proceedings of the 2010 IEEE Aerospace Conference, Big Sky, MT, USA, 6–13 March 2010; pp. 1–14. [Google Scholar]
- Johnson, A.E.; Keim, J.A.; Ivanov, T. Analysis of flash lidar field test data for safe lunar landing. In Proceedings of the 2010 IEEE Aerospace Conference, Big Sky, MT, USA, 6–13 March 2010; pp. 1–11. [Google Scholar]
- Roback, V.E.; Bulyshev, A.; Amzajerdian, F.; Brewster, P.; Barnes, B.; Kempton, K.; Reisse, R.A. Helicopter flight test of a compact, real-time 3-D flash lidar for imaging hazardous terrain during planetary landing. In Proceedings of the AIAA SPACE 2013 Conference and Exposition, San Diego, CA, USA, 12 September 2013; p. 5383. [Google Scholar]
- Epp, C.; Robertson, E.; Carson, J.M. Real-time hazard detection and avoidance demonstration for a planetary lander. In Proceedings of the AIAA SPACE 2014 Conference and Exposition, San Diego, CA, USA, 12 September 2013; p. 4312. [Google Scholar]
- Xu, W.; Hongxuan, Y.; Jiang, H.; Tong, P.; Kuang, Y.; Li, M.; Shu, R. Navigation Doppler lidar sensor for precision landing of China’s Chang’E-5 lunar lander. Appl. Opt. 2020, 59, 8167–8174. [Google Scholar] [CrossRef]
- Ahn, T.-J.; Kim, D.Y. Analysis of nonlinear frequency sweep in high-speed tunable laser sources using a self-homodyne measurement and Hilbert transformation. Appl. Opt. 2007, 46, 2394–2400. [Google Scholar] [CrossRef]
- Gragossian, A.; Pierrottet, D.F.; Estes, J.; Barnes, B.W.; Amzajerdian, F.; Hines, G.D. Navigation Doppler Lidar performance analysis at high speed and long range. In Proceedings of the AIAA Scitech 2020 Forum, Orlando, FL, USA, 6–10 January 2020; p. 0369. [Google Scholar]
- Amzajerdian, F.; Vanek, M.; Petway, L.; Pierrottet, D.; Busch, G.; Bulyshev, A. Utilization of 3D imaging flash lidar technology for autonomous safe landing on planetary bodies. In Proceedings of the Quantum Sensing and Nanophotonic Devices VII, San Francisco, CA, USA, 24–28 January 2010; pp. 685–695. [Google Scholar]
- Sanin, A.; Mitrofanov, I.; Litvak, M.; Malakhov, A.; Boynton, W.; Chin, G.; Droege, G.; Evans, L.; Garvin, J.; Golovin, D. Testing lunar permanently shadowed regions for water ice: LEND results from LRO. J. Geophys. Res. Planets 2012, 117, E00H26. [Google Scholar] [CrossRef]
- Hayne, P.O.; Hendrix, A.; Sefton-Nash, E.; Siegler, M.A.; Lucey, P.G.; Retherford, K.D.; Williams, J.-P.; Greenhagen, B.T.; Paige, D.A. Evidence for exposed water ice in the Moon’s south polar regions from Lunar Reconnaissance Orbiter ultraviolet albedo and temperature measurements. Icarus 2015, 255, 58–69. [Google Scholar] [CrossRef]


| Year | Country/Region | Payload Name | Launch Vehicle | Mission Status |
|---|---|---|---|---|
| 1971 | USA | Laser Altimeter | Apollo 15–17 | Conducted lunar elevation measurements, limited by laser technology, with only thousands of measurements completed across three missions. |
| 1994 | USA | Laser Altimeter | Clementine Lunar Orbiter | Achieved the first 3D terrain detection of the Moon’s surface. |
| 2007 | China | Laser Altimeter | Chang’E-1 | Conducted comprehensive 3D terrain detection of the entire lunar surface, including the poles, and operated until 2009, completing over 9 million measurements. |
| 2007 | Japan | Laser Rangefinder | Kaguya (SELENE) | Conducted 3D terrain detection of the Moon’s surface. |
| 2008 | India | Laser Rangefinder | Chandrayaan-1 | Conducted 3D terrain detection of the Moon’s surface but was lost during lunar orbit. |
| 2009 | USA | Orbiter Laser Altimeter | Lunar Reconnaissance Orbiter | Employed a 5-beam system to produce the highest resolution 3D topographic map of the lunar surface to date. |
| 2010 | China | Laser Altimeter | Chang’E-2 | China’s second lunar 3D terrain detection mission. |
| 2013 | China | Laser 3D Imaging Sensor | Chang’E-3 | China’s first soft lunar landing, the payload was used for obstacle avoidance during the final landing phase. |
| 2018 | China | Laser 3D Imaging Sensor | Chang’E-4 | The world’s first soft landing on the far side of the Moon, the payload was used for obstacle avoidance during the final landing phase. |
| 2019 | India | Laser Rangefinder | Chandrayaan-2 | Lost contact during the hard landing phase. |
| 2020 | China | Laser 3D Imaging Sensor | Chang’E-5 | The payload was used for obstacle avoidance during the final landing phase. |
| 2020 | China | Laser Velocity Sensor | Chang’E-5 | Measured the velocity of the lander. |
| 2023 | India | Laser Rangefinder | Chandrayaan-3 | Achieved a soft landing on the Moon’s surface. |
| Parameters | Values |
|---|---|
| Operating distance (km) | 200 ± 25 |
| Size of laser footprints (m) | <200 |
| Laser wavelength (nm) | 1064 |
| Laser energy (mJ) | 150 ± 10 |
| Laser pulse width (ns) | <7 |
| Effective receiving aperture (mm) | >120 |
| Repetition rate (Hz) | 1 |
| Ranging resolution (m) | 1 |
| Ranging uncertainty (m) | 5 (3δ) |
| Distance from the footprint in the direction of flight of the satellite (km) | ~1.4 |
| Parameters | Values |
|---|---|
| Wavelength (nm) | 1064 ± 1 |
| Single pulse energy (mJ) | 150, energy fluctuations of no more than 10% |
| Pulse width (ns) | 5~7 |
| Pulse Repetition Frequency (Hz) | 1 |
| Laser divergence angle (mrad) | <0.6 |
| Footprint diameter (mm) | <30 |
| Beam pointing stability (mrad) | 0.05 |
| Laser mode | Low order mode, >90% |
| Parameters | Values |
|---|---|
| Receiving telescope effective aperture (mm) | 128 |
| System focus (mm) | 533.33 |
| Field of view (mrad) | 1.5 |
| Optical efficiency | 0.82 |
| Diffuse spot diameter (μm) | <10 |
| Detector voltage response @1064 nm (V/W) | >0.7 × 10⁵ |
| Equivalent noise power @1064 nm (pW/Hz1/2) | <0.35 |
| Impulse response time (ns) | <10 |
| Operating temperature (°C) | −20~+50 |
| Launch Vehicle | Clementine Lunar Orbiter [17] | Chang’E-1 [14] | SELENE [18] | LRO [16] |
|---|---|---|---|---|
| Launch Year | 1994 | 2007 | 2007 | 2009 |
| The radial topographic error | 130 m | 20 m (1σ) a 60 m (1σ) b | ±4.1 m (1σ) | ~10 m |
| The horizontal topographic error | 20~60 km | 179.6 m (1σ) a 445 m (1σ) b | ±77 m (1σ) | ~100 m |
| The highest point on the Moon | +7.939 km | +10.629 km | +10.75 km | +10.7834 km |
| The coordinates of the highest point | 160.656°W, 3.344°N | 158.656°W, 5.441°N | 158.64°W, 5.44°N | 201.378°E, 5.401°N |
| The lowest point on the Moon | −8.910 km | −9.178 km | −9.06 km | −9.117 km |
| The coordinates of the lowest point | 169.719°W, 69.781°S | 172.413°W, 70.368°S | 172.58°W, 70.43°S | 187.5074°E, 70.360°S |
| Parameters | Values |
|---|---|
| Array size | 128 × 128 |
| Operational wavelength | 1.06 μm |
| Laser pulse energy | 50 mJ |
| Laser pulse width | 8 nsec |
| Receiver field of view | 1 deg. and 5 deg. |
| Receiver aperture diameter | 100 mm (75 mm for 5 deg. lens) |
| Frame rate | 20 Hz |
| Max operational range (natural terrain target) | 1500 m @ 90° look angle 950 m @ 30° look angle |
| Range precision | 8 cm |
| Parameters | Values |
|---|---|
| Operational altitude range | 4 m~3.5 km |
| Velocity range | −60 m/s~+60 m/s |
| Line-of-sight velocity error | ≤2 cm/s |
| Data rate | 33 Hz max. |
| Power | ≤100 W |
| Mass | ≤6.4 kg |
| Dimensions | 255 mm × 345 mm × 140 mm |
| Parameters | Values |
|---|---|
| Maximum LOS range | >10 km |
| Maximum LOS velocity | ±218 m/s |
| Line-of-sight velocity Error | 0.2 cm/s |
| Line-of-sight range Error | 12.5 cm |
| Data rate | 20 Hz |
| Power (28 VDC) | 78 W |
Disclaimer/Publisher’s Note: The statements, opinions and data contained in all publications are solely those of the individual author(s) and contributor(s) and not of MDPI and/or the editor(s). MDPI and/or the editor(s) disclaim responsibility for any injury to people or property resulting from any ideas, methods, instructions or products referred to in the content. |
© 2024 by the authors. Licensee MDPI, Basel, Switzerland. This article is an open access article distributed under the terms and conditions of the Creative Commons Attribution (CC BY) license (https://creativecommons.org/licenses/by/4.0/).
Share and Cite
Huang, G.; Xu, W. A Review of Lidar Technology in China’s Lunar Exploration Program. Remote Sens. 2024, 16, 4354. https://doi.org/10.3390/rs16234354
Huang G, Xu W. A Review of Lidar Technology in China’s Lunar Exploration Program. Remote Sensing. 2024; 16(23):4354. https://doi.org/10.3390/rs16234354
Chicago/Turabian StyleHuang, Genghua, and Weiming Xu. 2024. "A Review of Lidar Technology in China’s Lunar Exploration Program" Remote Sensing 16, no. 23: 4354. https://doi.org/10.3390/rs16234354
APA StyleHuang, G., & Xu, W. (2024). A Review of Lidar Technology in China’s Lunar Exploration Program. Remote Sensing, 16(23), 4354. https://doi.org/10.3390/rs16234354