Article

Using Nighttime Light Data to Explore the Extent of Power Outages in the Florida Panhandle after 2018 Hurricane Michael

1
Department of Urban and Regional Planning, Florida Atlantic University, Boca Raton, FL 33431, USA
2
Consultant, Planning & Design, Riverview, FL 33568, USA
3
Department of Geosciences, Florida Atlantic University, Boca Raton, FL 33431, USA
4
School of Public Administration, Florida Atlantic University, Boca Raton, FL 33431, USA
5
Andrew Young School of Policy Studies, Georgia State University, Atlanta, GA 30302, USA
*
Author to whom correspondence should be addressed.
Remote Sens. 2024, 16(14), 2588; https://doi.org/10.3390/rs16142588
Submission received: 1 May 2024 / Revised: 9 July 2024 / Accepted: 9 July 2024 / Published: 15 July 2024
(This article belongs to the Special Issue Land Degradation Assessment with Earth Observation (Second Edition))

Abstract

:
The destructive forces of tropical cyclones can have significant impacts on the land, contributing to degradation through various mechanisms such as erosion, debris, loss of vegetation, and widespread damage to infrastructure. Storm surge and flooding can wash away buildings and other structures, deposit debris and sediments, and contaminate freshwater resources, making them unsuitable for both human use and agriculture. High winds and flooding often damage electrical disubstations and transformers, leading to disruptions in electricity supply. Restoration can take days or even weeks, depending on the extent of the damage and the resources available. In the meantime, communities affected by power outages may experience difficulties accessing essential services and maintaining communication. In this study, we used a weighted maximum likelihood classification algorithm to reclassify NOAA’s National Geodetic Survey Emergency Response Imagery scenes into debris, sand, water, trees, and roofs to assess the extent of the damage around Mexico Beach, Florida, following the 2018 Hurricane Michael. NASA’s Visible Infrared Imaging Radiometer Suite (VIIRS) Day/Night Band (DNB) was processed to estimate power outage duration and rate of restoration in the Florida Panhandle based on the 7-day moving averages. Percent loss of electrical service at a neighborhood level was estimated using the 2013–2017 American Community Survey block group data. Spatial lag models were employed to examine the association between restoration rates and socioeconomic factors. The analysis revealed notable differences in power-restoration rates between urbanized and rural areas and between disadvantaged and more affluent communities. The findings indicated that block groups with higher proportions of minorities, multi-family housing units, rural locations, and households receiving public assistance experienced slower restoration of power compared to urban and more affluent neighborhoods. These results underscore the importance of integrating socioeconomic factors into disaster preparedness and recovery-planning efforts, emphasizing the need for targeted interventions to mitigate disparities in recovery times following natural disasters.

1. Introduction

The devastating impact of tropical cyclones on land can be profound, manifesting through erosion, debris accumulation, downed coarse woody vegetation, and extensive infrastructure damage [1,2,3]. Storm surges and floods sweep away buildings, leaving behind construction debris and sedimentation [1,3] while also polluting freshwater sources, rendering them unfit for human consumption and agriculture [4]. Hurricane-force winds and inundation can wreak havoc on electrical and cell tower infrastructure, causing widespread power outages and loss of communication [2]. Restoring normalcy in such scenarios can be a protracted process, stretching over days or even weeks, contingent upon the severity of the destruction, access to the hardest hit areas, and availability of resources [2]. Meanwhile, communities grappling with the loss of electricity may encounter obstacles in accessing vital services, including food, fuel, and healthcare [2,5].
Hurricane Michael (6–18 October 2018), a Category 5 storm, was one of the strongest hurricanes to make landfall in the conterminous United States and the strongest in recorded history to hit the Florida Panhandle [6,7,8,9]. The hurricane intensified shortly before landfall, producing sustained winds of nearly 260 km per hour (161 miles per hour) and storm surge inundation heights between 2.7 and 4.5 m (9 and 14 feet) with localized maximum wave crest elevation of up to 6 m (20 feet) [6,7]. The extreme winds and the massive storm surge caused by Hurricane Michael resulted in the destruction of hundreds of commercial and residential buildings. The cumulative damages caused by Hurricane Michael totaled USD 25 billion [6,8], while agriculture and forestry losses, mainly in Florida and Georgia, exceeded USD 3.87 billion [6]. According to the Florida Office of Insurance Regulation, there were nearly 150,000 claims filed in Florida after Hurricane Michael, with a total value of over USD 7 billion in estimated losses [9]. The areas in and around Mexico Beach, Panama City Beach, and Cape San Blas experienced the highest level of devastation. Damages to the amount of nearly USD 3 billion were also inflicted on the Tyndall Air Force Base [6].
In addition to structural damages, Hurricane Michael caused massive power outages throughout the entire Southeastern United States. According to the situation reports of the U.S. Energy Information Administration, between 10 October and 20 October 2018 more than 1.7 million customers across six states (Florida, Georgia, Alabama, South Carolina, North Carolina, and Virginia) experienced widespread power outages [10]. Peak outages in North Carolina and Virginia reached over a million customers [10]. Several counties in the hardest hit areas in the Florida Panhandle reported that 100% of their customer accounts were out of electricity for several days [11]. On 19 October, nearly 80% of the customers remaining without power because of the infrastructure damage caused by Hurricane Michael were in northern Florida [10].
Large electrical disruptions attributed to weather-related events in the United States have been on the rise [12,13]. Over 80 percent of the extensive power outages reported by utility companies over the past two decades have resulted from severe weather [13]. Between 2011 and 2021, the number of incidents resulting in large disruptions of the electrical supply increased by over 60% compared to the 2000–2011 period [13]. Hurricane Maria in 2017 caused one of the largest and longest blackouts in the history of the United States. The hurricane made landfall in Puerto Rico on 20 September 2017 as a Category 5 storm claiming the lives of over three thousand and causing at least USD 90 billion in infrastructure damage [14]. The hurricane-force winds of two hurricanes striking the island in rapid succession (Hurricane Irma, which made landfall on 6 September 2017, and Hurricane Maria two weeks later) damaged nearly 80 percent of Puerto Rico’s electrical grid [15]. Six months after the initial impact, nearly 30 percent of the customers in the rural areas in the central and eastern parts of the island were still without power [15]. Damages to the transportation network, including crumbling and inoperable bridges, and roadblocks caused by debris and floodwaters as well as limited resource availability delayed the power-restoration process [14,15].
In 2017, another catastrophic storm, Hurricane Harvey (25–30 August), stalled over Texas producing a record-breaking precipitation with an estimated return period of over 1000 years (750 mm3day−1) [12]. An analysis of the extreme precipitation patterns in the Houston area using observational data and the output of atmospheric EC-Earth 2.3 model [16] found that the increase in global temperatures contributed to 15% increase in rainfall and made such an event three times more likely [16]. Hurricane Harvey claimed the lives of nearly 100 people and inundated a vast area in southeastern Texas and parts of Louisiana [17]. The record-breaking rainfall and strong winds affected some of the most densely populated areas on the Gulf Coast, damaging nearly 300,000 structures. FEMA conducted almost 40,000 water rescue operations for residents stranded by floodwaters [17]. Hurricane Harvey caused massive damage to infrastructure leading to power blackouts for nearly 340,000 customers. Weeks after the storm, thousands of homes were still experiencing disruptions of power supply [17]. The total cost of damages was estimated at USD 125 billion [17]. Another weather extreme in Texas, Winter Storm Uri (13–17 February 2021), produced freezing temperatures that forced many power plants to shut down operations, resulting in electrical service disruptions for over 15 million customers (half of the state’s population) and causing USD 20 billion in damages [18]. The winter storm froze water pumps and mains, inflicted damages to the oil-producing sector, damaged the water-cooling systems at the nuclear power plant and some of the thermal power plants, and resulting in icing of wind turbine blades, affecting renewable energy generation [18].
The level of vulnerability in a community depends on several factors, including its physical exposure, demographic makeup, and socioeconomic conditions [19,20,21,22] as well as the capacity for post-disaster response and recovery by households, institutions, and communities [22,23,24]. Social vulnerability, a multifaceted concept, is often intertwined with factors such as socioeconomic status, gender, age, ethnicity, access to resources, housing, and employment [22]. Ethnic and racial minorities frequently face heightened levels of social vulnerability [25,26,27]. Rowan and Kwiatkowski [27] investigated the correlation between housing recovery and social vulnerability in the aftermath of hurricanes Irma and Maria in Florida and Puerto Rico, respectively. Their study identified income inequality, as indicated by median income at the census tract level, along with socioeconomic status, household composition, minority status, and language, as significant predictors of housing damage [27].
Following a disaster, a rapid assessment of the damage extent becomes imperative as the first step to begin search and rescue operations and address restoration and recovery priorities of electric power and other essential utilities [1,3]. However, the lack of consistency in public access to data on power outages poses significant challenges for emergency managers and local authorities [2]. Although data sporadically becomes available from various public or private sources, the absence of standardized formats and regular updates complicates these tasks. The lack of spatial granularity hampers the effectiveness in assessing disaster impacts and disparities at the neighborhood level, especially in racially diverse and economically disadvantaged and smaller rural communities. Remote sensing data has emerged as a valuable resource aiding emergency managers and local officials during the response phase. Daytime remote sensing mainly provides information on land features, while nighttime light data captures artificial light emissions, revealing human activities [28].
Cole et al. [29] developed a power outage assessment tool leveraging Suomi-Visible Infrared Imaging Suite (VIIRS) Day/Night Band (DNB) observations to estimate power disruptions following Hurricane Sandy in 2012. This tool, augmented with established power outage records and estimates of local population density, was then integrated into a feedforward neural network model to forecast power outages [29]. This integration represents a pioneering effort in synergistically harnessing multiple data sources to quantitatively predict power disruptions, successfully detecting initial light losses in the aftermath of Hurricane Sandy, as well as the gradual restoration of electrical service [29].
Roman et al. [14] utilized the NASA Black Marble products to monitor the restoration of the severely damaged electrical grid in Puerto Rico following Hurricane Maria in 2017. The study aggregated NTL data at the level of 900 administrative units (barrios) to link the estimated recovery rates to the demographic and socioeconomic characteristics of the affected neighborhoods [14]. The study estimated the potential number of people without electric service four months after Hurricane Maria made landfall. The findings indicated that rural municipalities experienced significantly longer power outages of more than 120 days compared to urban areas [14]. Disparities in power restoration were also observed among urban communities, with the poorest residents residing away from dense urban centers experiencing the lengthiest blackouts in the aftermath of Hurricane Maria [14]. Shermeyer [30] developed a data-fusion mapping approach that integrates data from the Visible Infrared Imaging Radiometer Suite (VIIRS) and Landsat images to track the recovery of affected power infrastructure and identify locations of severe damage where power-restoration crews could concentrate their efforts.
In this study, we combined datasets from several publicly available data sources to explore the multidimensional impacts of Hurricane Michael on the Florida Panhandle. The study focused on two key objectives: (1) evaluate the extent and duration of the electrical service disruptions in the most affected counties in the Florida Panhandle; and (2) contextualize the rates of loss and restoration using Mexico Beach as a case study to show how catastrophic damage and land degradation can affect recovery efforts. We estimated the extent and duration of disrupted electrical service and the rates of restoration in the Florida Panhandle using outage data from the Florida Public Service Commission at the county level as well as NASA’s Visible Infrared Imaging Radiometer Suite (VIIRS) Day/Night Band (DNB) data. We tested two hypotheses: (1) power-restoration rates in rural areas lag behind those in the urbanized regions; and (2) social vulnerability factors affect the extent and duration of the power outages as well as the electric service-restoration rates. We also presumed that areas with high levels of property damage would experience much slower restoration rates. To address our first hypothesis, we used the urban-rural classification scheme for counties provided by the Centers for Disease Control (CDC)- National Center for Health Statistics (NCHS) (CDC 2024). We differentiated between urban and rural counties in estimating power-restoration rates and developing restoration curves for the 14 counties in our study area. To investigate our second hypothesis, the percent loss of electrical service and restoration rates were aggregated at the block group level using the 2013–2017 American Community Survey (ACS) data. Two spatial autoregressive lag models were estimated to examine the association between socioeconomic characteristics and the extent and duration of the power outages as well as recovery rates. Finally, to link power restoration to the level of damage, we overlaid the results of a power-restoration hotspot analysis with a maximum likelihood reclassification of NOAA’s National Geodetic Survey Emergency Response Imagery scenes. The scenes were reclassified into debris, sand, water, trees, barren land, and roofs to assess the extent of the devastation around Mexico Beach, Florida. The combination of various types of remote sensing data, official power outage records, and census data provided a detailed account of the initial damage, the restoration process, and the impact on the most vulnerable social groups.

2. Materials and Methods

2.1. Study Area

The Florida Panhandle is characterized by a humid subtropical climate or Group C -category Cfa on the Köppen–Geiger climate classification scheme (https://en.climate-data.org/; accessed 12 June 2024). The average annual temperature is around 20.2 °C Total annual precipitation averages 1466 mm (https://en.climate-data.org/; accessed 26 May 2024). Rainfall occurs year-round even throughout the dry season. For the purposes of this analysis, our study area includes the 15 counties in the Florida Panhandle most affected by Hurricane Michael. As Figure 1 shows, disaster declarations were issued for each of the counties included in the study area allowing FEMA and other federal agencies to implement various assistance programs to support the impacted individuals, businesses, and communities. Previous studies have identified a number of demographic (e.g., age, race, ethnicity, educational attainment) and socioeconomic factors (e.g., median income, poverty rate, median property values, rurality) as precursors of higher levels of vulnerability to natural disasters [2,5,14,19,20,21,22,23,24,25,26,27]. We have used data from the 2013–2017 American Community Survey at the block group level [31] to gain further insight into the demographic and socioeconomic profile of the study area. The area is predominantly rural with a few major urban areas, including Tallahassee, the capital of the State of Florida, and Panama City, located near the Tyndall Air Force Base. The region has a diverse population of college students and young professionals, contributing to a demographic mix where the average age is around 40 years old and the percentage of individuals holding bachelor’s degrees (19%) exceeds the national average [31]. Around 30% identify themselves as belonging to one or more racial/ethnic minority groups. Leon, Bay and Gadsden County have the highest percentage of African American population [31]. The median household income across the study area is around USD 50,000 [31]. Five counties in the study area have poverty rates above 20 percent. According to the 2016 ACS data, Franklin County had the highest poverty rate of 43%, followed by Madison (28%), Jackson (24%), Holmes (22%), and Washington (21%) [31]. The majority of counties in the Panhandle have low population densities. The highest population densities are observed in Leon County, with 437 people per square mile, and Bay County, with 230 people per square mile [31]. Prior to Hurricane Michael, the counties in the study area were exempt from the strictest provisions of the Florida Building Code due to the absence of major hurricane strikes in recorded history. The waivers compromised the structural integrity of hundreds of residential and commercial buildings in the Mexico Beach area, where Michael made landfall (Figure 2).
While densely populated coastal areas of Florida are served by investor-owned companies such as Florida Power and Light Company, Duke Energy, or Tampa Electric Company, the counties of the Florida Panhandle are served by municipal providers and rural cooperatives [32] (Figure 3). In Florida, municipal electric utilities are overseen by municipal agencies, while smaller rural electric cooperatives are collectively owned by the residents they serve. Owing to the ownership structure, restoration timelines of utility services in areas served by municipal agencies or rural cooperatives are usually longer [2]. Hence, it is essential for first responders, utility managers, and local officials responsible for disaster recovery in these areas to be able to conduct rapid damage assessments with the amount of limited resources they have available.

2.2. Data

NASA’s operational Black Marble product suite (VNP46) was downloaded from NASA’s LAADP archive. VNP46A1 provides daily at-sensor nighttime light radiances at TOA (top-of-atmosphere) derived from the Visible Infrared Imaging Radiometer Suite (VIIRS) Day-Night Band (DNB) sensor on board of the Suomi National Polar-orbiting Partnership (SNPP). The spatial resolution of the data is 15 arc-seconds or approximately 500 m [33,34,35]. VNP46A1 assimilates diverse input datasets to generate accurate pixel-level estimates of observed radiance of artificial light emissions or NTL (nighttime lights). The nighttime light radiance, LNTL, is observed in the spectrum of 505–890 nm [33,34,35] and measured in μWatts·cm−2·sr−1 [33,34,35]. NASA’s Black Marble product suite is corrected for cloud cover and various terrain, atmospheric, and stray light distortions [33,34,35]. The data-processing algorithm integrates daytime VIIRS DNB surface reflectance, surface albedo, and corrections for illumination direction and lunar irradiance, aiming to reduce biases stemming from incidental artifacts in the VIIRS NTL time series data [33,34,35].
High temporal resolution (3 to 6 h) power outage data from 10 October through 6 November 2018 at the county level were obtained from Florida Public Service Commission [11]. The data included the total number of accounts, percent accounts served by investor-owned electric utilities, percent accounts served by rural electric cooperatives, percent accounts served by municipal electric utilities, percent total customers without power; percent investor-owned utilities accounts without power, percent rural electric cooperatives accounts without power, and percent municipal electric utilities accounts without power [11].
Demographic and socioeconomic data at the block group data were obtained from the 2013–2017 American Community Survey [31]. The variables used in the analysis included the number of households on public assistance, percent minority population, percent multi-family housing units, population density, and median property value.
Post-storm imagery from 11 October through 14 October for the Mexico Beach area, where Hurricane Michael made landfall was downloaded from the National Geodetic Survey Emergency Response Imagery database managed by the National Oceanographic and Atmospheric Administration (NOAA). High-resolution aerial photogrammetry is acquired via Trimble Digital Sensor Systems (DSS) Version 6 on board crewed aircraft missions flown by NOAA’s Remote Sensing Division [36]. The imagery has a pixel ground sample distance (GSD) of ~0.25 m at zoom level 19 [36]. The data are collected at both nadir and oblique viewing geometries to help with post-event damage assessments and recovery efforts [36].
In order to estimate the extent of the damages, pre-disaster 2017 aerial imagery was obtained from the Earth Explorer website operated by the United States Geographic Survey (USGS) (https://earthexplorer.usgs.gov/; accessed 16 November 2023). We downloaded 2017 USDA’s National Agriculture Imagery Program (NAIP) dataset because of its high spatial resolution (0.6 m) and full coverage of the study area (https://earthexplorer.usgs.gov/; accessed 25 May 2023).

2.3. Data Processing

A total of 74 nighttime light scenes from NASA’s operational Black Marble product suite (VNP46) were downloaded from NASA’s LAADP archive covering the period from 10 October 2018 to 23 December 2018. Additional NTL scenes were acquired between March 2018 and September 2018 to create a composite image and compare pre- and post-event NTL radiances. To assess power infrastructure loss and restoration rates, the difference between the baseline image and post-storm NTL radiance was computed, followed by estimating the percent NTL radiance recovery for each day between 11 October 2018 and 23 December 2018. Based on the estimates, a seven-day moving average at the block group level was calculated to quantify the loss and restoration of electric service. Two measures were derived: (a) percent of NTL radiance recovery as a proxy of estimated proportion of the electric service restored (i.e., observed NTL radiance divided by the baseline value); and (b) the average rate of change in NTL radiance recovery (ROC) calculated as (LDayX − LDay0)/LDay0 × 100, where LDayX is the percent NTL radiance at Day X, and LDay0 is the percent NTL radiance at the start date.
The power outage at the county level was available from the Florida Public Service Commission in a PDF format [11]. The data covered the period from 10 October through 6 November 2018 in 6 h increments. We used the number of accounts without electricity at 6 am of each day as a baseline to estimate the severity and duration of the power outages in the 14 counties most affected by Hurricane Michael.
The pre-disaster and post-disaster aerial imagery were assembled into two mosaic datasets. The two sets of aerial imagery were reclassified using the maximum-likelihood algorithm using the ESRI’s ArcMap 10.8.1 software. Spectral signatures for six classes including construction and demolition debris, sand deposition, barren land, roofs, grass, trees, and water were obtained following the methodology described in Davis et al. [1]. Between 25 and 100 training samples were collected for each classification category. Overall, 475 training samples were collected with 100 training samples for each of roofs, sand, debris, and barren land classes, 50 for vegetation, and 25 for water. Accuracy assessment was performed using 560 reference (ground truth) points. Extract values to points tool in ArcGIS ProTM (ESRI 2024) was employed to obtain the classification value for each reference point. The frequency values of the reference and classified points were crosstabulated in STATA (StataCorp LP v.15, 2017) to create a confusion matrix (known also as the error matrix) [37,38]. The matrix allows comparisons of correctly classified and misclassified pixels on a class-by-class basis using three metrics: (i) overall accuracy; (ii) producer’s accuracy, which provides the percentage of the correctly classified points (leading diagonal divided by the column totals; and (iii) user’s accuracy, which is found by dividing the diagonal totals by the row totals [37,38].
To evaluate the extent of storm surge inundation in the coastal areas most affected by Hurricane Michael, surge elevations and velocities hindcast output generated by the ADvanced CIRCulation Coastal Circulation and Storm Surge Model (ADCIRC) [39] were obtained from the Coastal Emergency Risks Assessment (CERA) interactive website (https://cera.coastalrisk.live/). ADCIRC outputs include maximum water height above ground, significant wave height, significant wave period, and maximum water levels over the hindcast period [39]. To validate the ADCIRC output, we collected high water mark data for Hurricane Michael from 15 USGS Short-term Network (STN) Flood Event stations, available through the USGS Flood Event Viewer (https://stn.wim.usgs.gov/FEV/, accessed 15 June 2020).

2.4. Statistical Analysis

Patterns of spatial clustering of infrastructure service loss and recovery rates were examined using the Getis-Ord Gi* test statistic [35]. The Getis-Ord Gi* is a local measure of spatial association calculated as the sum of the differences between the observed and estimated attribute values multiplied by a spatial weight matrix [40].
We conducted diagnostic tests for spatial dependence to determine if a spatial autoregressive model would be a good fit for the data. Spatial dependence was estimated using the simple Lagrange Multiplier (LM) or the Robust Lagrange Multiplier (Robust LM). Highly significant values confirmed strong spatial dependence in the data. Spatial Lagrange multiplier tests compare a model without a spatial term (e.g., OLS) with a model incorporating a spatial term estimated on the basis of a spatial weights’ matrix [41,42,43]. The test statistic for the Spatial Lagrange multiplier test is twice the difference between the log-likelihoods of these models. The test statistics follows a chi-square distribution with one degree of freedom. The null hypothesis states that there is no spatial dependence. Thus, rejecting the null hypothesis suggests evidence of spatial dependence [41,42,43]. Spatial weights matrices (SWMs) include binary contiguity matrices (assigning 1 to neighboring areas and 0 to others using the rook or queen options in the GeoDa software) and inverse distance-based matrices (e.g., K-nearest neighbors or adaptive kernel) [41,42,43].
Since the LM tests confirmed spatial dependence, two spatial autoregressive statistical models were estimated using GeoDASpace v1.2 [43]. The dependent variable in Model 1 was the percent of NTL radiance recovery as a proxy of estimated fraction of power restored, while in Model 2, the average rate of change in NTL radiance recovery (ROC) (11 October 2018 to 23 December 2018) was used as the dependent variable. Several census variables at the block groups level were used as covariates including the number of households on public assistance, percent minority population, percent multi-family housing units, population density, median property value, and urban vs. rural setting. Multicollinearity was assessed using the multicollinearity condition number.

3. Results

3.1. Hurricane Michael Impact on Mexico Beach and Surrounding Areas

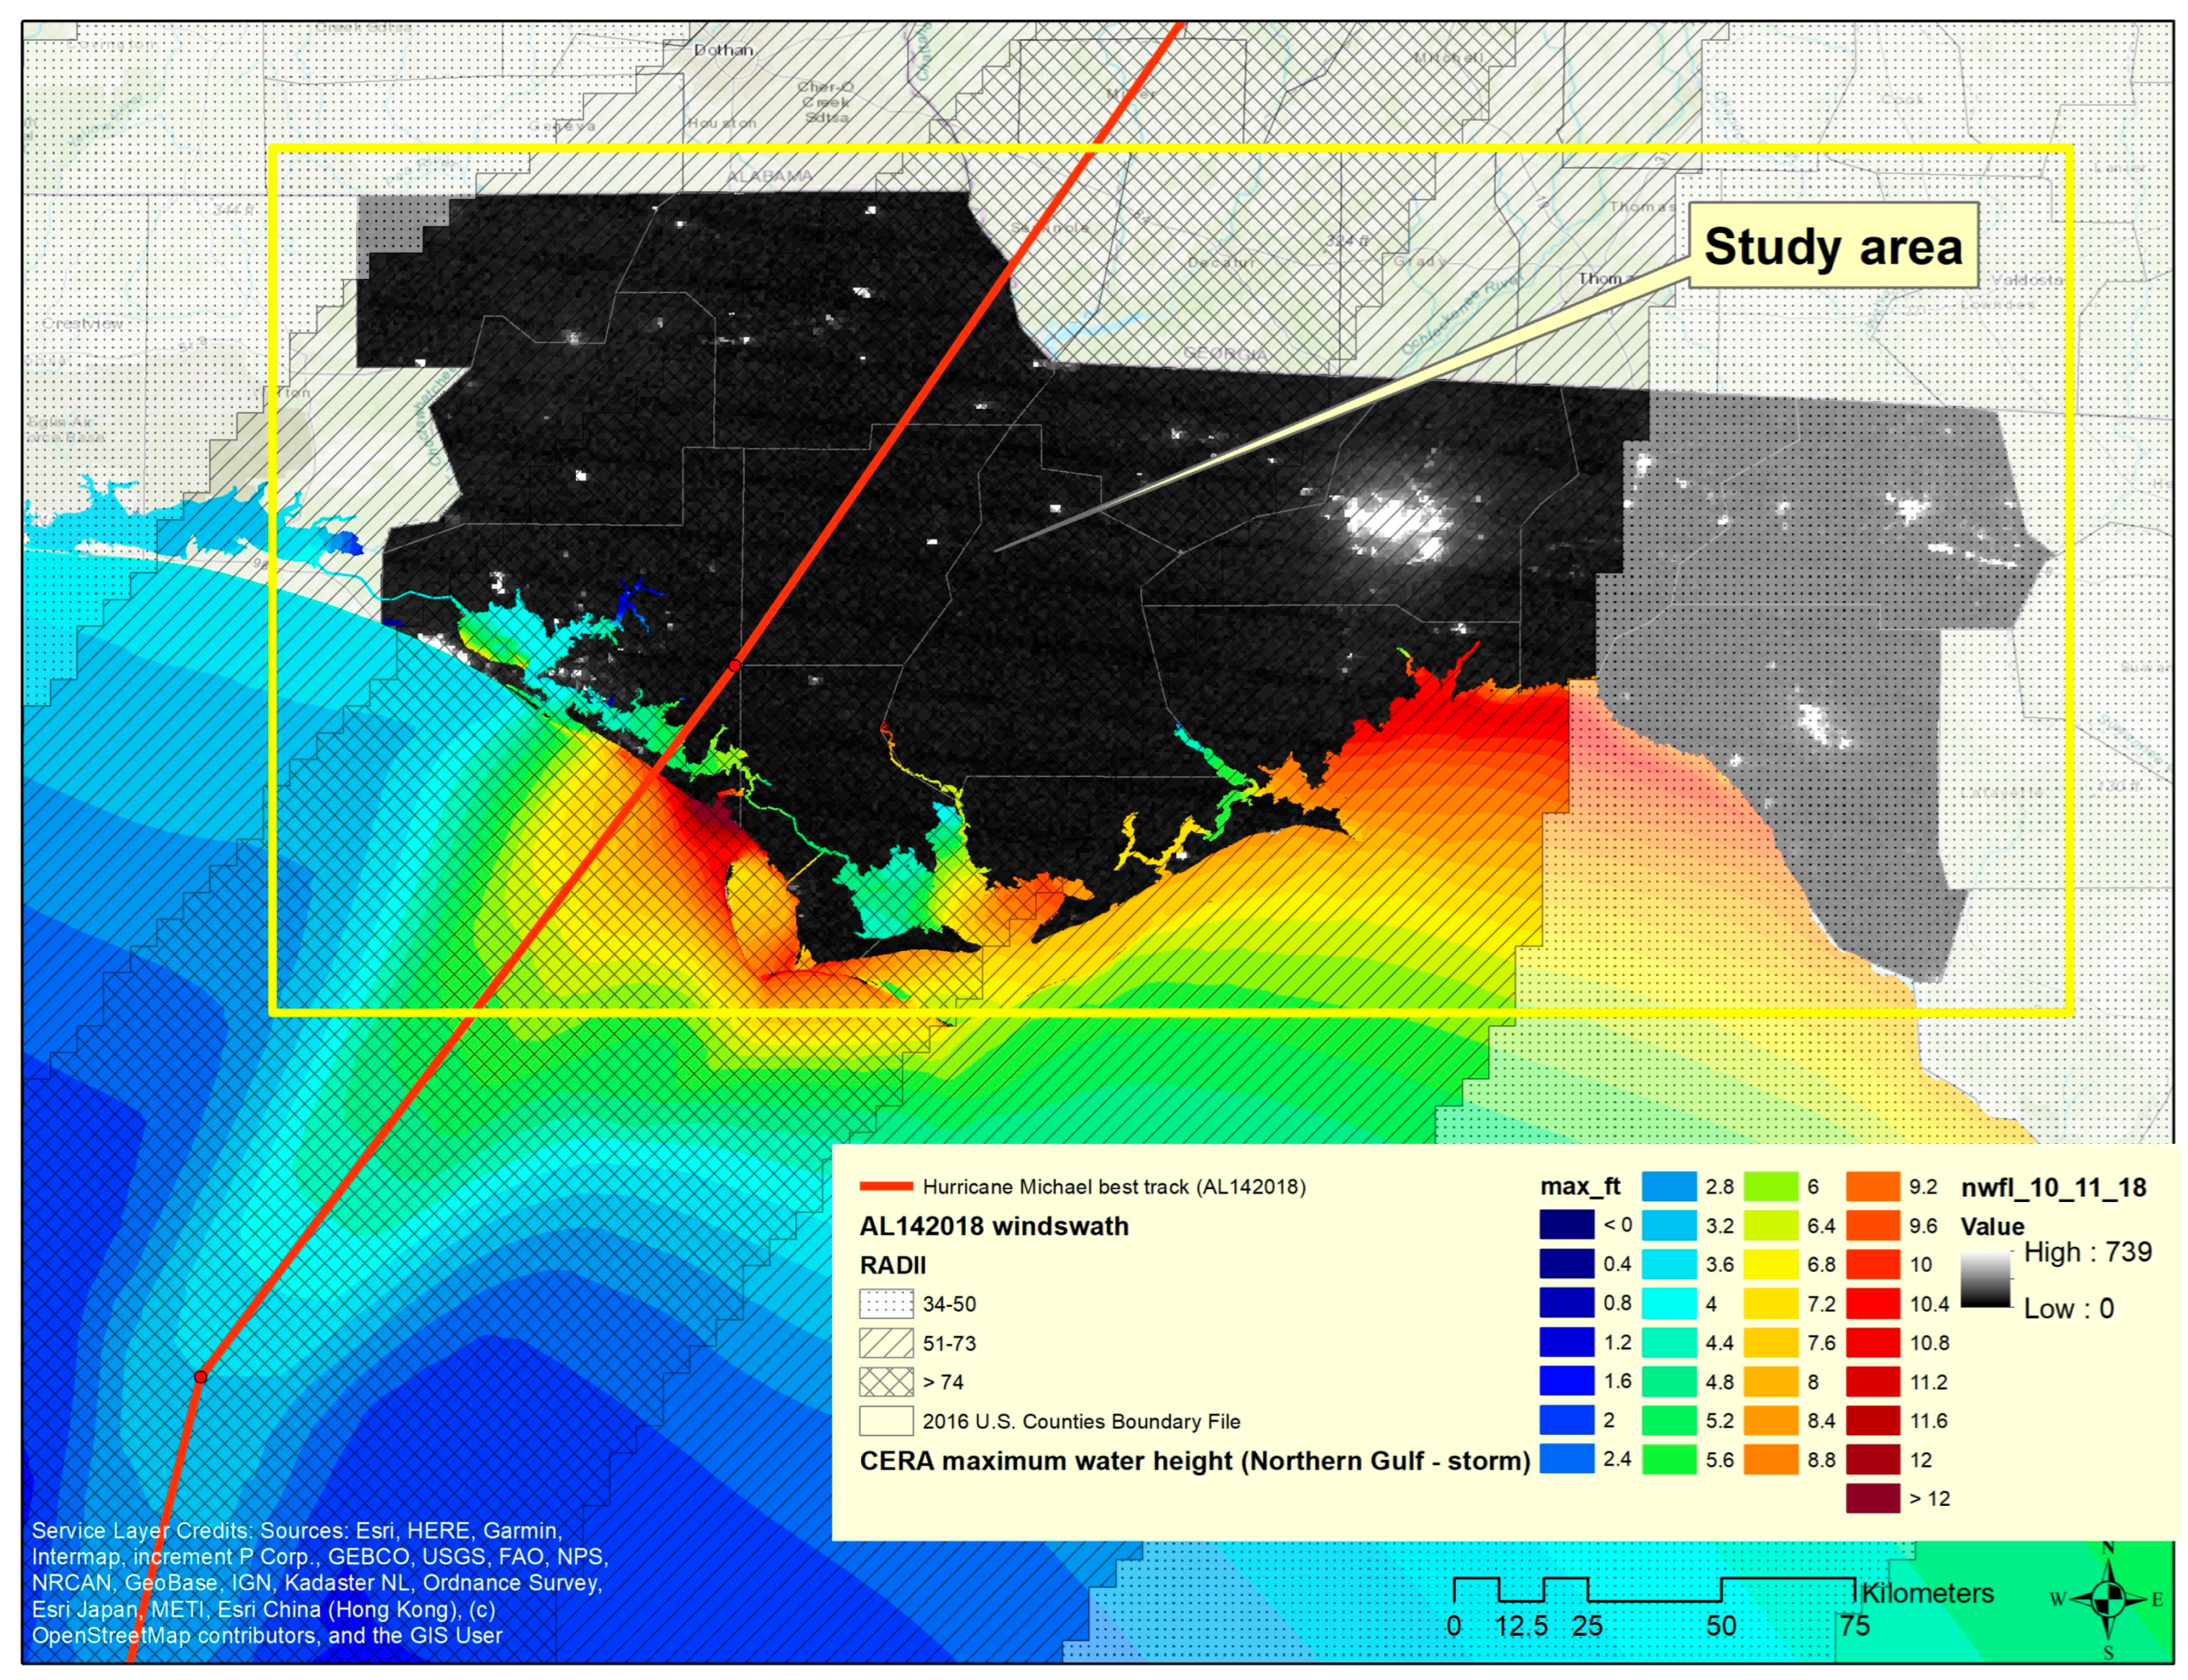
Hurricane Michael caused massive devastation in the Panama City Metropolitan area, where nearly 45,000 structures were damaged [36]. The area was impacted by hurricane-force winds with observed wind gusts of 185 km/h (115 mph) and severe storm surge inundation of 2.7–4.2 m (9–14 ft), with the highest water marks measured between Crystal River and Aucilla River. Mexico Beach experienced the highest level of destruction, with more than 90% of the structures severely damaged, including two hospitals [36]. A total of 809 buildings were destroyed, which is nearly 50% of the existing housing stock in Mexico Beach [36]. Figure 4 illustrates Hurricane Michael’s wind swaths, and the maximum ADCIRC-computed storm surge water levels. The ADCIRC output data was obtained from the Coastal Emergency Risks Assessment (CERA) website (https://cera.coastalrisk.live/) and validated with high water mark data from 15 USGS STN Flood Event stations (RMSE = 0.5 m).
To further identify debris fields and areas of extensive sand deposition, we performed maximum likelihood classification analysis on the 2018 post-Hurricane Michael imagery. Several samples were taken from each of the six classes included in the analysis, namely debris, sand, barren land, roofs, greenspace, trees, and water. For four categories (i.e., roofs, barren land, debris, and sand) we obtained 100 samples for each class to increase the accuracy of the classification. A total of 50 training samples were gathered for the vegetation category, while 25 training samples were allocated to the water category. The samples were merged to create a composite signature file, which was used as an input to the maximum likelihood classification tool in ArcMap 10.8.1. Figure 5 displays the results from the reclassification.
Figure 5 illustrates the stark transformation of the Mexico Beach area in the aftermath of Hurricane Michael. Strong winds and powerful waves led to heavy erosion along the beach. The storm demolished numerous structures, scattering debris, blocking roads, and hindering emergency response efforts. The storm surge also brought a large amount of sand deposits to the area. Following Hurricane Michael, ponded water and sand overwash from the storm surge flooding extending hundreds of meters inland from the shoreline (Figure 5). Overwash affected nearly the entire beach-dune system at Mexico Beach, causing burial or uprooting of approximately four kilometers (~2.5 miles) of beach-dune vegetation. The erosion and damage to coastal vegetation likely contributed to the obstruction of roadways and damage to nearby infrastructure assets.
Effective maximum likelihood classification is dependent upon the number of training samples (where larger number of samples would reduce misspecification error) and well-defined boundaries between the various classes [1, 3]. In a highly disturbed and degraded environment where almost 90% of the existing housing stock is reduced to rubble while at the same time there is a substantial amount of overwash and sand deposition from the storm surge, it is challenging to establish well-defined boundaries between the different classes. Well-defined objects (e.g., remaining roofs) were accurately classified (in black). Water, vegetation, and debris are interspersed. To address this issue, we developed an extensive training sample dataset. Although the algorithm performed well in characterizing the key classes of interest such as remaining roofs, sand deposition and debris, slight over-classification of water was observed, which was acknowledged as one of the limitations of the proposed approach. Table 1 displays the confusion matrix for the ML classification.
The overall accuracy of the ML classification was found to be 76.25% (Table 1). This result is consistent with the findings of Khatami and Mountrakis [37]. The accuracy assessment of the classified post-Katrina imagery resulted in an overall accuracy index of 74.7% [37]. Sand and barren land had the highest user’s accuracy results (90% and 88%, respectively), followed by roofs (82%). The classification result for roofs can be explained by the fact that many of the roofs on the post-hurricane imagery had various levels of collapse and damage, which made the categorization more challenging. The error matrix (Table 1) indicated that the roof class included classified pixels from the debris category, while water had the highest number of misclassified pixels from the vegetation class, and vegetation included misclassified pixels from the water category. Debris, water, and vegetation were found to have lower user’s accuracy. These results can be explained by the fact that debris (user’s accuracy of 62.5%), vegetation (67.4%), and water (70.7%) were mixed up and interspersed. For comparison, Khatami and Mountrakis [37] achieved post-Katrina user’s accuracy of 50.9% for vegetation, 65% for soil, and 92.5% for water. Sand had a producer’s accuracy of 86.5%, followed by roofs (79.6%), debris (76.9%), water (76.3%), vegetation (72.1%), and barren (63.5%).

3.2. Electric Service-Restoration Curves across Urban/Rural Counties

Based on the definitions provided by the CDC’s National Center for Health Statistics [35], six of the counties included in the analysis were classified as urban (u = 1) while eight were classified as rural (r = 0). Table 2 indicates what percent of the accounts in each county are associated with investor-owned electric utilities, rural electric cooperatives, and/or municipal providers. Except for Bay and Franklin counties, in which 90% to 100% of all accounts are associated with investor-owned companies, most counties in the Panhandle are served by rural electric cooperatives and municipal agencies. Municipal electric providers serve 33.4% of the accounts in Calhoon County, 32.8% of the accounts in Gadsden County, and 82.7% of the accounts in Leon County, where the capital Tallahassee is located. Rural electric cooperatives serve 13 out of the 14 counties in the study area with Liberty County having the highest number (81%) of the accounts associated with this type of electric service provider, followed by Holmes (75.2%) and Gadsden (67.2%). Investor-owned companies possess greater resources and a broader array of mutual aid agreements compared to municipal electric providers or rural cooperatives. Rural cooperatives tend to rely more on mutual aid agreements with neighboring utilities. However, when all these providers are simultaneously affected, as was the case after Hurricane Michael, the likelihood of swift recovery for the entire area diminishes considerably. Extensive damage to infrastructure and limited resources can significantly impede the recovery timelines of smaller communities.
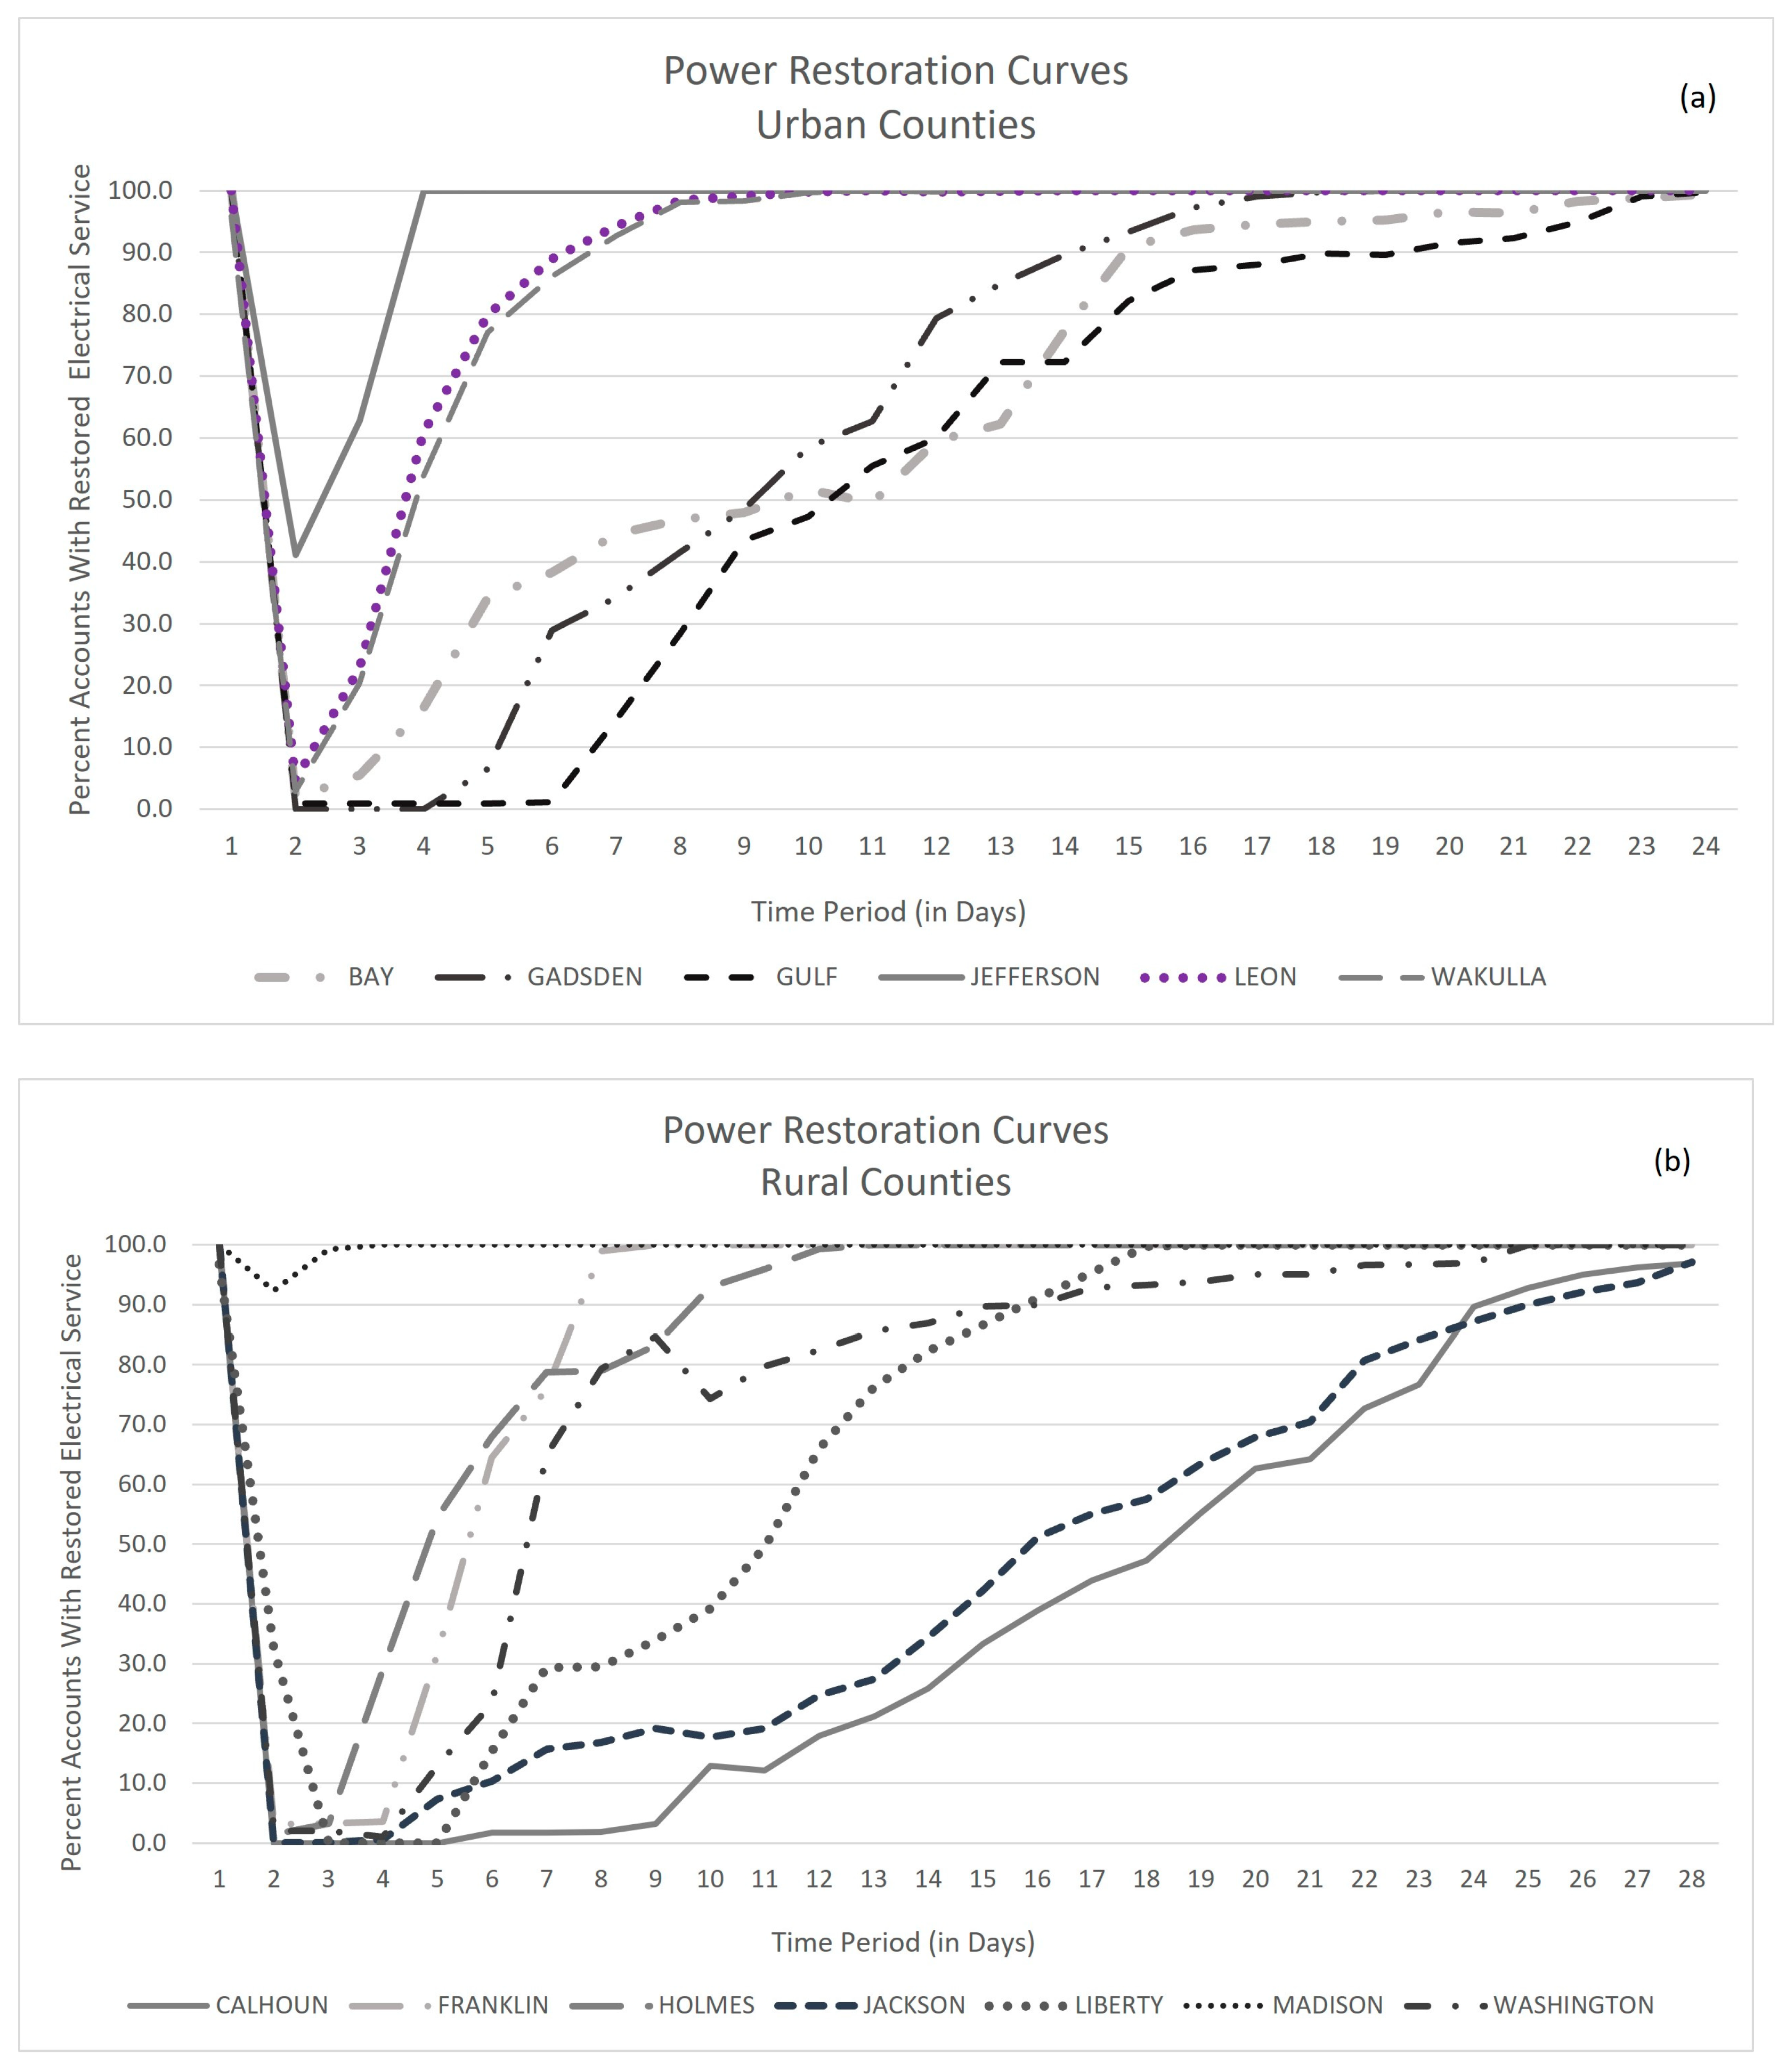
Figure 6 shows power-restoration curves for the urban (a) and rural (b) counties as described in Table 1. For three of the six urban counties (Jefferson, Leon, Wakulla), power returned to normal within seven days following the disaster. As shown on Figure 6a, Gadsden County regained 100 percent of its electric service within seventeen days while for Bay and Gulf, the counties most affected by Hurricane Michael, the timeline was much longer. Figure 6b indicates that rural counties had a much longer and uneven recovery. Franklin County, which is entirely served by an investor-owned company, restored electric power within 9 days after the storm, while rural counties such as Liberty, Washington, Calhoun, and Jackson, which are mostly served by rural cooperatives took the longest to recover, with a restoration period exceeding in some cases 28 days. Examining both graphs reveals that, overall, urban areas experienced faster recovery compared to rural areas. Greater access to necessary resources in urban areas, predominantly served by investor-owned or municipal electric utilities, contributed to the shorter recovery time. These findings align with our first hypothesis, affirming that urban areas tend to recover at a quicker pace than rural areas.

3.3. Estimating Power Outages from Nighttime Light Data

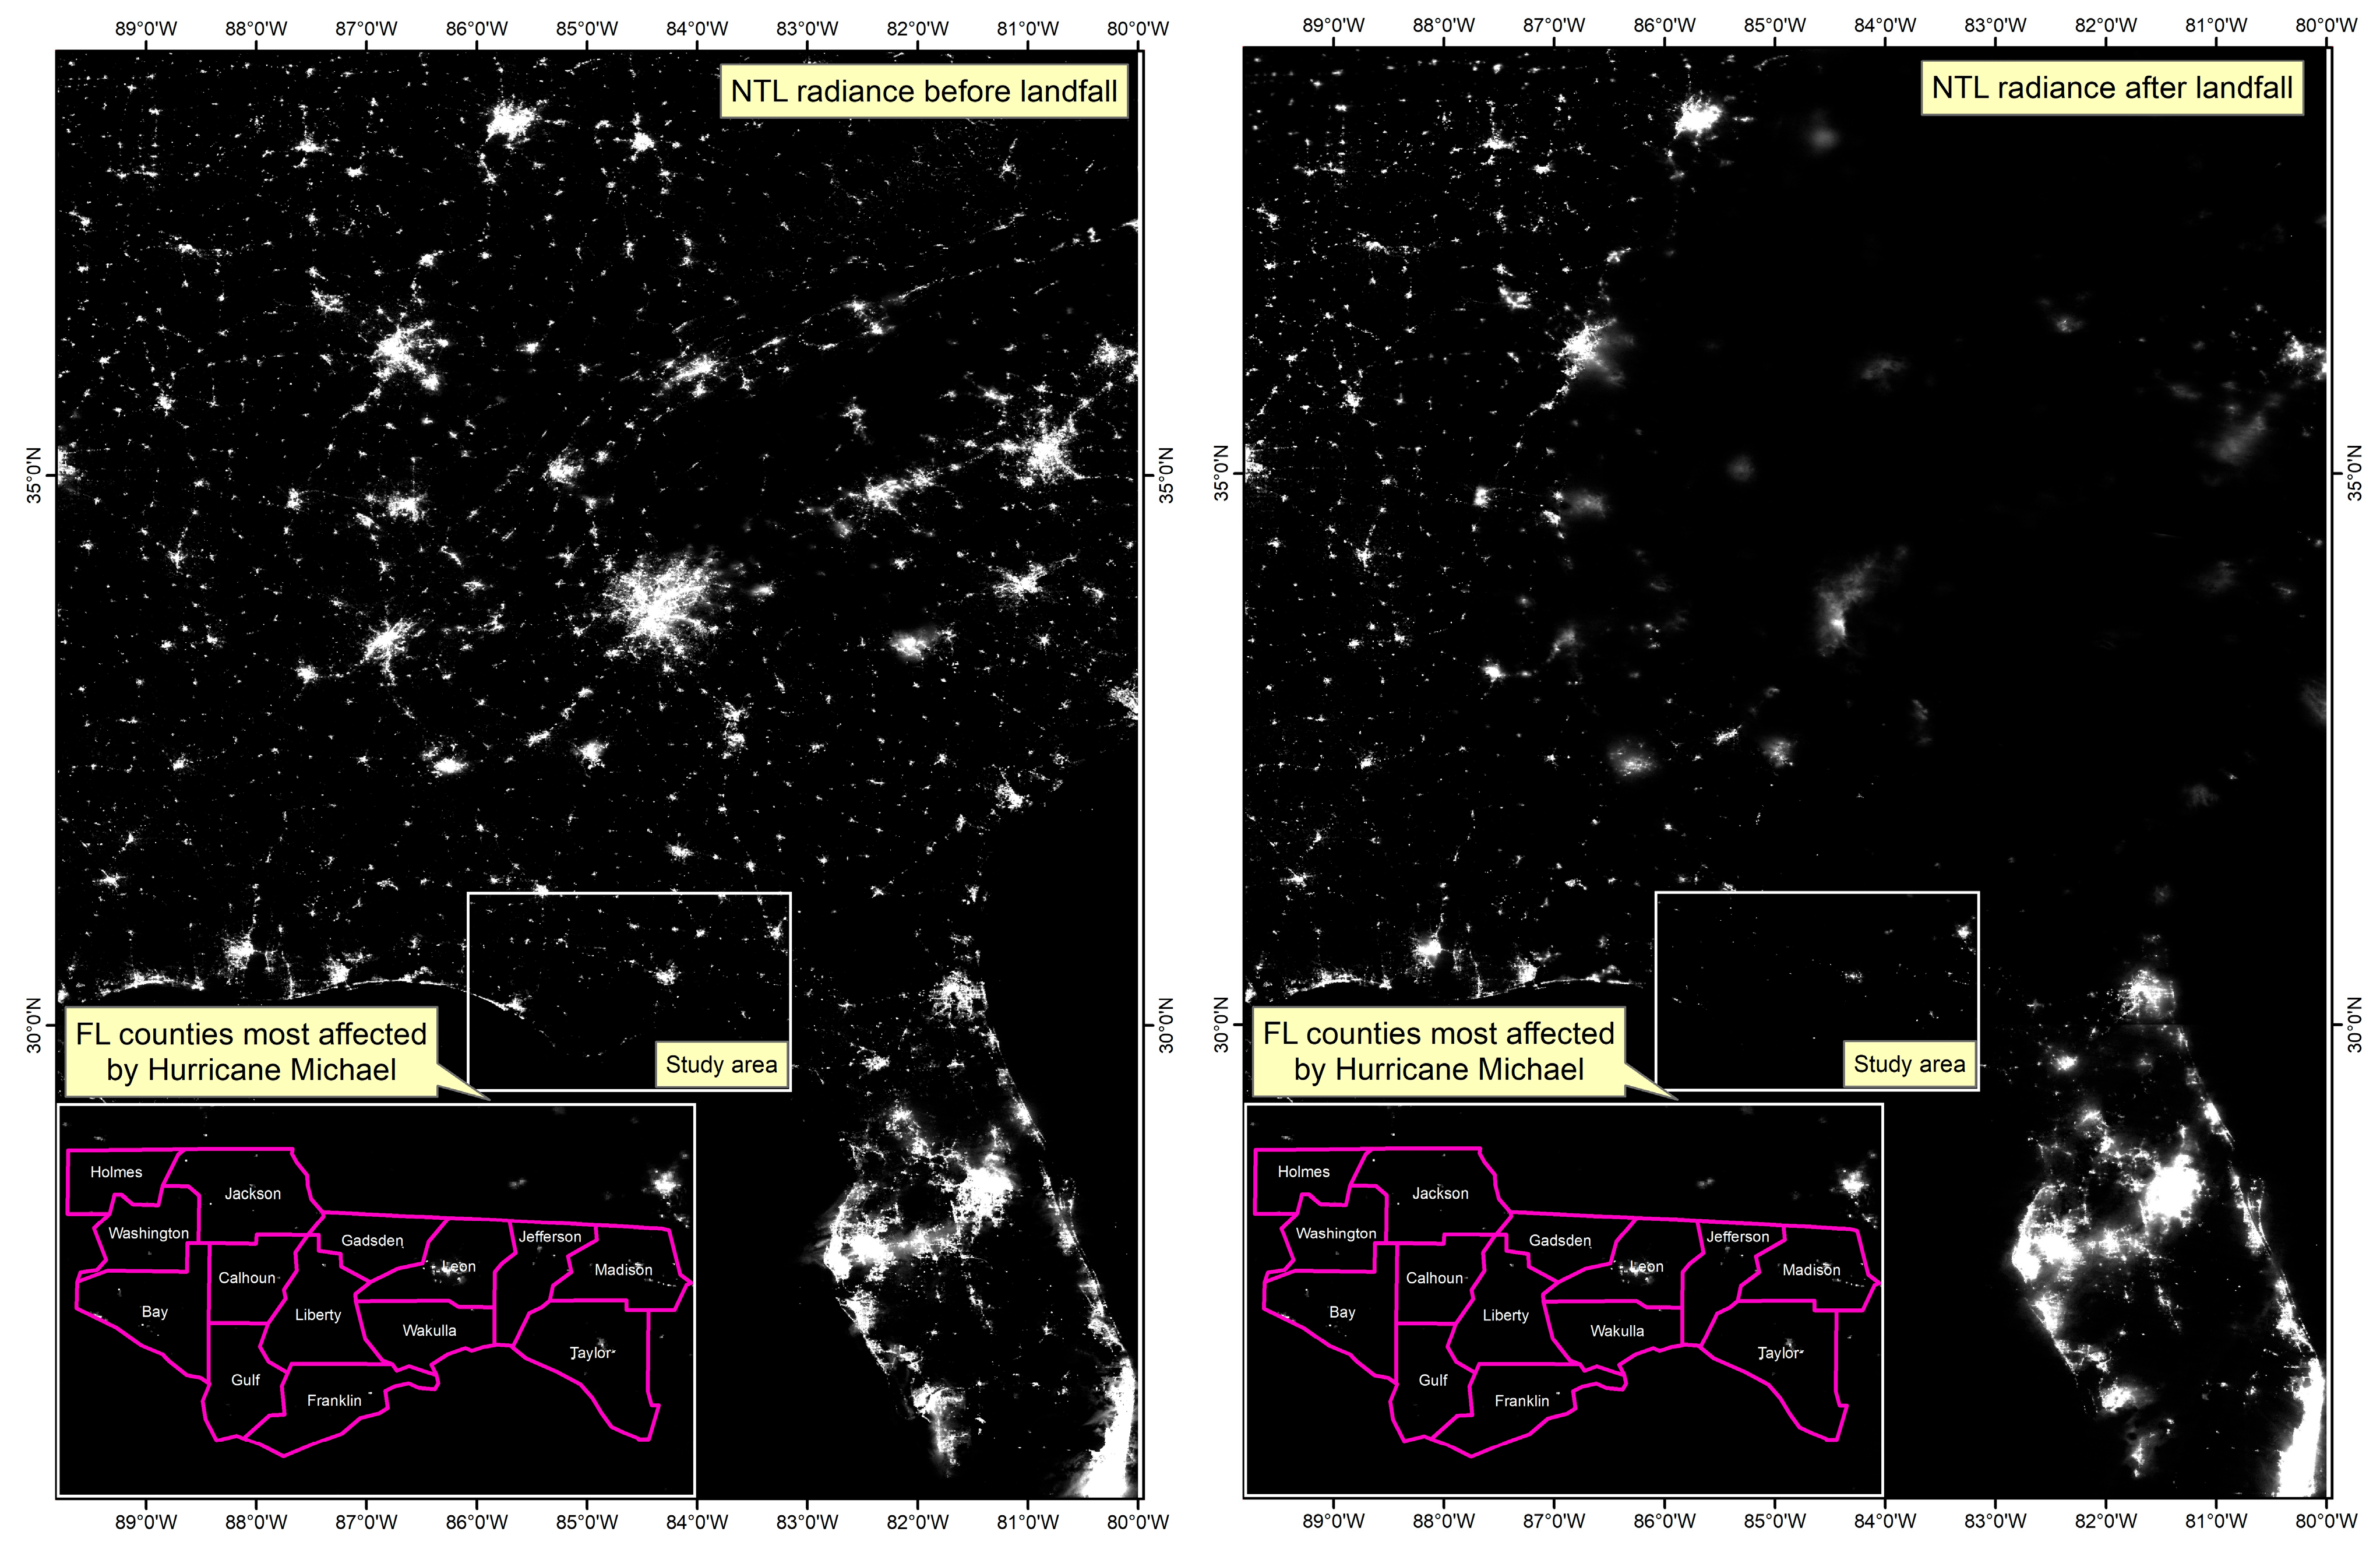
The VNP46 Day/Night Band was extracted from each scene for the period from 10 October through 23 December 2018. Ten additional NTL scenes acquired between March 2018 and September 2018 were compiled to create a composite image. The image was used as a baseline to evaluate changes in the pre- and post-storm nighttime light radiance. Figure 7 shows pre- and post-storm nighttime light imagery.
The percentage loss of electrical service was estimated as the difference between the baseline image and each of the NTL scenes for the period between 10 October and 23 December 2018. Using integrated moving average time series trend analysis, we calculated ROC for 7, 21, and 73 days after Hurricane Michael made landfall. Figure 8 shows the difference between the baseline and post-storm nighttime NTL radiance between 11 and 31 October 2018, following Hurricane Michael. The top image indicates that there was a notable reduction in light emission, particularly evident in two primary areas: Mexico Beach and Tallahassee. Additionally, a discernible difference was observed in the northwestern quadrant. Three weeks later, the differences between pre-storm and post-storm NTL radiance were considerably reduced in many areas except for Mexico Beach. Visible changes have occurred in the Tallahassee area, where the difference between the baseline and post-storm NTL radiance has dramatically decreased.
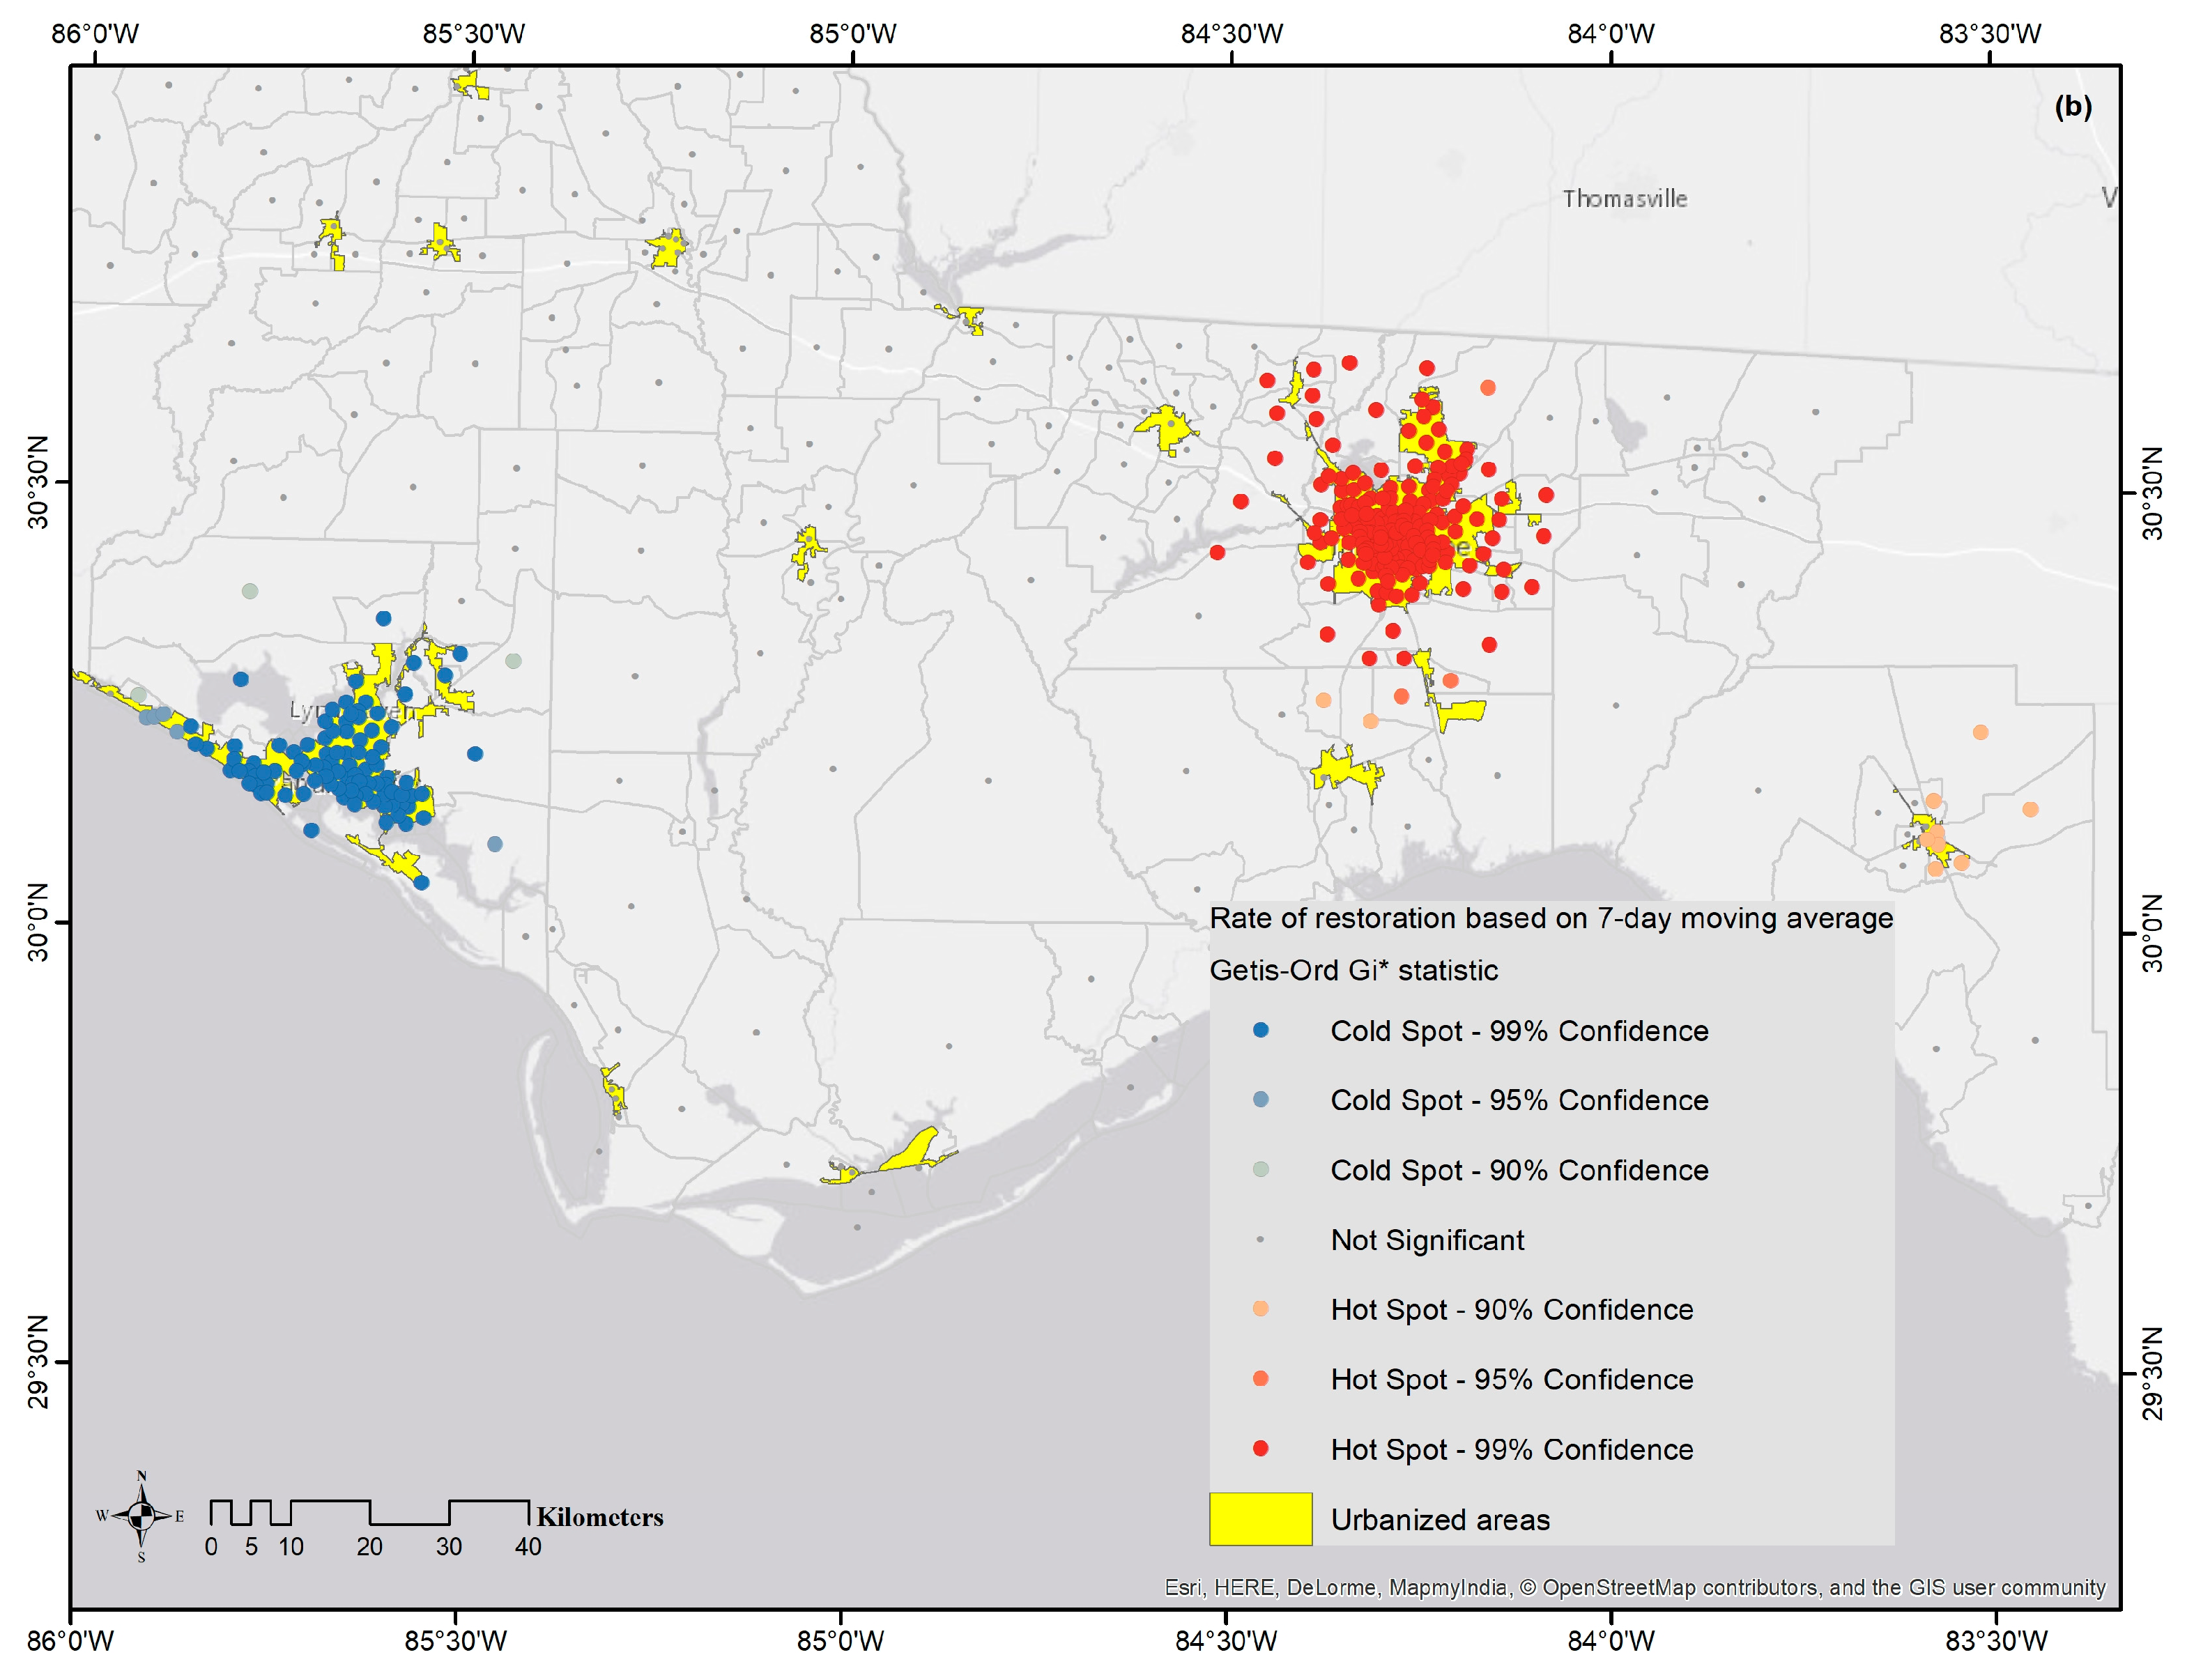
These findings were then utilized to conduct hotspot analysis of infrastructure service disruptions and recovery rates employing the Getis-Ord Gi* statistic. The Getis-Ord Gi* statistic is calculated as the sum of the differences between the observed and average attribute values multiplied by a spatial weight matrix. The hotspot tool in ArcGIS 10.8.1 generates z-scores (and the associated p-values), which indicates whether the observed spatial clustering of high or low values is statistically significantly different from a random distribution. A statistically significant positive Gi* value (at α = 0.1; α = 0.05; or α = 0.01) represents a ‘hot spot’, indicating that there is clustering of high values around an observed value of the feature of interest [33]. Figure 9 displays the results from the hotspot analysis with respect to (a) percent NTL radiance recovered, and (b) rate of restoration based on the 7-day moving average. Both sets of results indicated that there was a statistically significant clustering of high positive values in the Tallahassee area, an indication of a ‘hotspot’ of restoration activities. In terms of percent recovered NTL radiance, the Mexico Beach area was not statistically significant. However, in terms of rate of restoration, this area was clearly a ‘cold spot’, which is consistent with a delay in restoration due to the level of destruction, and vast amounts of debris and sand deposition. The surrounding rural areas were also found to be statistically significant cold spots in both analyses. This affirms our hypothesis that restoration rates in rural areas lag behind those in the densely populated urban regions.

3.4. Statistical Analysis

The diagnostic tests for spatial lag dependence were statistically significant. For Model 1, the Lagrange Multiplier (LM) test for spatial lag equaled 10.230 (p-value < 0.001) while for Model 2, LM was 4.916 (p-value 0.0266). The diagnostic tests for spatial error dependence were also statistically significant but a spatial error model was not considered in this analysis. In a spatial lag model, the spatial autocorrelation of the dependent variable is taken into account, whereas in a spatial error model, the interdependence of error values in the associated independent variables is considered. A spatial lag model highlights the significance of spatial clustering. The multicollinearity condition number for Model 1 was 4.404, while for Model 2, it was 7.36. A value below 20 indicates that there were no multicollinearity issues in the models. The dependent variable in Model 1 was the percent of NTL radiance recovery as a proxy of estimated proportion of power restored. The independent variables included the maximum NTL radiance lost for the block group of interest as an indicator of damage levels, rate of change in NTL radiance recovery over the first three weeks, and urban vs. rural setting. Several census variables at the block groups level were used as covariates including the number of households on public assistance, percent multi-family housing units, percent minority population, and urban vs. rural setting. In Model 2, the average rate of change in NTL radiance recovery (ROC) (11 October 2018 to 23 December 2018) was used as the dependent variable. The covariates included population density, median property value, maximum NTL radiance lost, percent NTL radiance recovery over the first 7 days post-landfall, and urban vs. rural setting. Table 3 summarizes the descriptive statistics for the independent variables included in the analysis.
Table 4 provides an overview of the covariate estimates for Model 1 (a maximum likelihood spatial lag model). The results suggest a negative statistically significant association (at α = 0.10) between the percent of electric service recovery at a census block group level and the percentage of households on public assistance. The negative sign suggests an inverse relationship between a higher percentage of households on public assistance and the pace of electrical service restoration. The study also found a highly significant inverse association between the recovery and the percentage minority population at a block group level. The percentage of multi-family housing units in a census block group was also found to be inversely associated with the percent NTL radiance recovered. The results also show that urban areas are positively associated with a greater proportion of NTL radiance recovered.
Table 5 summarizes the model coefficients for Model 2. The maximum NTL radiance loss, which was used as a proxy of the level of electrical service disruptions, was found to be highly statistically significant (p-value < 0.000). The negative sign is in the expected direction, indicating that there is an inverse association between the extent of the power outages and the rate of recovery. The rate of change as a proxy of the rate or restoration over the first three weeks was found to be statistically significant at α = 0.05 confidence level. The positive sign is also in the expected direction, suggesting that the speed of power restoration in the immediate aftermath of the hurricane strike has a favorable effect on the process of overall rate of recovery. Median property values and urban settings are also statistically significant (at α = 0.10 and α = 0.01, respectively) and positively associated with the rate of power restoration. Population density was not found to be statistically significant. These findings affirm our first hypothesis that there are differences in both the rates of recovery and overall percent recovery between urban and rural areas. They also suggest that social vulnerability factors are statistically significantly associated with both dependent variables as formulated in our second hypothesis.

4. Discussion

Hurricane Michael wreaked havoc on Mexico Beach and the surrounding areas, prompting FEMA to declare most counties in the Florida Panhandle as disaster zones requiring both individual and public assistance. However, the magnitude of Michael’s impact cannot be solely attributed to the storm’s intensity. Notably, Florida boasts one of the nation’s strictest building codes. One significant factor contributing to the extensive destruction of structures in Mexico Beach was waiving some of the most stringent requirements of the Florida Building Code. The region’s exemption from building code standards stems in part from its relatively limited history of hurricane activity. Unfortunately, this leniency resulted in heightened infrastructure and property damage, business closures, and challenges to household recovery efforts. The destruction caused by Hurricane Michael prompted widespread consensus on the need to reassess and revise the building code to prevent similar devastation in the future. South Florida adopted stricter building standards following the devastation of Hurricane Andrew in 1992. Palm Beach, Broward, and Miami-Dade counties implemented markedly stricter building codes, requiring structures to withstand wind speeds of up to 175 mph. Regrettably, this higher standard was not universally adopted across Florida. The devastation caused by Hurricane Michel in the Florida Panhandle resulted in notable changes in building codes and floodplain ordinances [45]. The most important policy changes include the following: (1) increasing the building wind load resistance requirement to 140 m/h; (2) implementing new stricter requirements for urban development in the floodplains; and (3) introducing new regulations that would require any accessory structure be permitted regardless of size [45,46].
Lacking the power and resources of larger investor-owned companies, numerous rural electrical cooperatives face heightened risk during natural disasters. Further investigation is essential to understand the root causes of risk among smaller electrical service providers and to propose policy measures that strengthen their resilience. Expanding the reach of mutual aid agreements beyond state borders presents a viable strategy to address the needs of these cooperatives and enhance their capacity to respond effectively to crises.
As previously noted, eight of the counties in the study area are classified as rural. That region of Florida suffered major agriculture and forestry financial losses [6].
At the household level, loss of electric power can have ripple effects for households without a means to salvage, and replace, refrigerated items. This can be particularly catastrophic in our study areas where five counties have poverty rates above 20 percent. The uprooting of beach dune vegetation and beach erosion were also notable and have implications for the tourism sector. Such land degradation has additional adverse implications beyond the affected communities given the domino effect that the loss of land and soil has on food production, food insecurity and higher food prices.
Coastal land degradation can further exacerbate subsequent storm damages. When erosion leads to land elevation loss, inundation and flooding can occur with lower elevated water levels (i.e., total water level exceeds the highest elevation of a coastal barrier system). For example, in a recent study on the impact of Hurricane Ian on a southwest barrier island, shoreline advance was measured but the beaches lost sediment volume and elevation, creating a scenario of increased vulnerability. Damage can also be influenced by contemporary geomorphology or structural distribution (e.g., of buildings). In the same evaluation of the Estero Island impacts, overwash deposits and washout channels were observed in relation to low morphologic elevations, whereas scouring occurred adjacent to a seawall [3]. Understanding the role of land degradation from storms is necessary to prepare for short- to long-term resiliency to future events. We conducted image classification analysis to gain further understanding of the degree of destruction, debris and sand deposition. Due to the highly disturbed nature of the built environment, there was a higher potential of misspecification error, which is one of the limitations of our approach. To address these issues, we developed a large training sample dataset, which increased the processing time, see also [1,3].
Consistent with prior studies, the findings from this study further confirm that insufficient post-disaster recovery disproportionally affects households and families in disadvantaged neighborhoods and rural communities [15,27]. These communities tend to be vulnerable to natural disasters and often suffer more severe damage compared to other areas [25,26]. Delayed recovery in key infrastructure, such as the power grid, will further devastate these communities. Operation of air conditioning units, food storage, entertainment, working, schooling, and even drinking water for households with wells, all rely on electricity. Therefore, power loss and delayed restoration have a profound negative impact on households and families, ranging from health to economic productivity. In addition to stricter building codes and mutual aid agreements, it is critical to promptly provide social and supportive services to vulnerable households and families in the affected areas. Temporary housing and emergency shelters, food and water distribution, and other aid services should continue to serve the residents in these areas as well.
There are several limitations to our approach. Nighttime light data originates from the (VIIRS) sensor aboard the Suomi National Polar-orbiting Partnership satellite, which is highly sensitive to visible and infrared wavelengths [47,48]. However, this sensitivity can lead to interference from stray light [48]. NASA has developed several algorithms to correct the effect of stray light and provide radiance-calibrated data to the end users [49]. In addition, despite using high spatial resolution of the NOAA disaster response imagery, we encountered some challenges related to misclassification in certain supervised classification classes. Post-storm changes in watercolor and turbulence, particularly in breaking waves, small canals, waterways, creeks, and forested areas, led to spectral properties resembling those of grass or tree classes. This discrepancy stems from vegetation’s spectral signatures, which exhibit higher reflectance in the green and near-infrared bands, unlike water, which reflects minimally across all bands [50]. Furthermore, the presence of shadows in the imagery exacerbated land cover classification accuracy issues. These issues were addressed by manual reclassification of the areas where such issues were detected.

5. Conclusions

NASA’s Visible Infrared Imaging Radiometer Suite (VIIRS) Day/Night Band (DNB) was employed to gauge the scale and duration of electric utility infrastructure disruption in the aftermath of Hurricane Michael in the Florida Panhandle. Utilizing data from the 2013–2017 American Community Survey (ACS), the percentage loss of electrical service was then scaled down to the census block group level. Spatial autoregressive lag models based on maximum likelihood estimation were fitted to explore the relationship between socioeconomic characteristics and the scope and duration of the power outages and the power-restoration rates. Through hotspot analysis, significant variations in power-restoration rates were highlighted, with urban areas, particularly those surrounding Tallahassee, demonstrating notably higher rates compared to rural regions and areas heavily affected by structural damage, like Mexico Beach.
These findings were substantiated by analyses utilizing data from the Florida Public Service Commission. Recovery curves deduced from this data showcased prolonged recovery times in rural areas compared to their urban counterparts. Additionally, the study pinpointed block groups with elevated percentages of minorities, multi-family housing units, and households receiving public assistance as facing slower power-restoration rates compared to urban and more affluent neighborhoods. The area is generally characterized by a low population density, and therefore, this factor did not seem to have a significant association with the rate of restoration.
Our analysis confirms the findings of previous studies [1,3] that using remote sensing data to estimate the extent and severity of damage after a natural disaster provides rapid and cost-effective methods to conduct independent assessments. In addition to underscoring the importance of revisiting building codes and fostering new mutual aid agreements between rural electrical cooperatives and larger entities within and outside Florida, these findings also highlight need for more focused scholarship on disparate disaster impacts on smaller rural communities, coastal and agricultural ecosystems and policy solutions to address these disparities. Such initiatives and scholarship hold promise for addressing future challenges and enhancing the resilience of predominantly rural and underserved communities.

Author Contributions

Conceptualization, D.M., R.E., A.-M.E., A.S., Y.L. and T.R.B.; methodology, D.M., R.E., Y.L. and T.R.B.; software: D.M. and R.E.; validation: D.M.; writing—original draft preparation: D.M., R.E., Y.L., A.-M.E., A.S. and T.R.B.; writing—review and editing: Y.L., A.-M.E., A.S. and T.R.B.; visualization, D.M. and R.E.; funding acquisition, D.M., A.-M.E. and A.S. All authors have read and agreed to the published version of the manuscript.

Funding

This article is based on research supported by the U.S. National Science Foundation Grant CMMI#1541089. Any opinions, findings, conclusions or recommendations expressed here are those of the authors and do not necessarily reflect the views of the National Science Foundation.

Data Availability Statement

The data supporting the conclusions of this article will be made available by the authors on request.

Conflicts of Interest

The authors declare no conflicts of interest.

References

  1. Davis, J.; Mitsova, D.; Briggs, T.C.; Roberts-Briggs, T. Post-Hurricane Michael damage assessment using ADCIRC Storm Surge Hindcast, Image Classification, and LiDAR. Shore Beach 2019, 87, 3–14. [Google Scholar] [CrossRef] [PubMed]
  2. Mitsova, D.; Esnard, A.-M.; Sapat, A.; Lai, B.S. Socioeconomic vulnerability and electric power restoration timelines in Florida: The case of Hurricane Irma. Nat. Hazards 2018, 94, 689–709. [Google Scholar] [CrossRef]
  3. Hauptman, L.; Mitsova, D.; Briggs, T.R. Hurricane Ian Damage Assessment Using Aerial Imagery and LiDAR: A Case Study of Estero Island, Florida. J. Mar. Sci. Eng. 2024, 12, 668. [Google Scholar] [CrossRef]
  4. Byrne, M.J., Sr. Monitoring Storm Tide from Hurricane Michael along the Northwest Coast of Florida, October 2018; U.S. Geological Survey Open-File Report; US Geological Survey: Reston, VA, USA, 2019; Volume 1059, p. 10. [Google Scholar] [CrossRef]
  5. Mitsova, D.; Sapat, A.; Esnard, A.-M.; Lamadrid, A. Evaluating the Impact of Infrastructure Interdependencies on the Emergency Services Sector and Critical Support Functions Using an Expert Opinion Survey. J. Infrastruct. Syst. 2020, 26, 04020015. [Google Scholar] [CrossRef]
  6. NHC (National Hurricane Center). National Hurricane Center Tropical Cyclone Report Hurricane Michael (AL142018). 7–11 October 2018; Beven, J.L., II, Berg, R., Hagen, A., Eds.; National Hurricane Center: Miami, FL, USA, 2019; Updated 17 May 2019. [Google Scholar]
  7. FEMA (Federal Emergency Management Agency). Hurricane Michael in Florida: Building Performance Observations, Recommendations, and Technical Guidance. FEMA P-2077; Mitigation Assessment Team Report; FEMA (Federal Emergency Management Agency): Washington, DC, USA, 2020. Available online: https://www.fema.gov/sites/default/files/2020-07/mat-report_hurricane-michael_florida.pdf (accessed on 5 March 2023).
  8. Bilskie, M.V.; Asher, T.G.; Miller, P.W.; Fleming, J.G.; Hagen, S.C.; Luettich, R.A., Jr. Real-time simulated storm surge predictions during Hurricane Michael (2018). Weather. Forecast. 2022, 37, 1085–1102. [Google Scholar] [CrossRef]
  9. Altmaier, D. One year later: Hurricane Michael′s impact on Florida. Florida Office of Insurance Regulation. Insur. J. 2019, 10, 1–17. Available online: https://www.floir.com/siteDocuments/HurricaneMichaelAnalysis.pdf (accessed on 9 November 2023).
  10. USEIA (U.S. Energy Information Administration). Hurricane Michael Caused 1.7 Million Electricity Outages in the Southeast United States. 2018. Available online: https://www.eia.gov/todayinenergy/detail.php?id=37332 (accessed on 15 April 2024).
  11. FPSC (Florida Public Service Commission). Hurricane Season Power Outage Reports. 2018. Available online: https://www.psc.state.fl.us/hurricane-report (accessed on 10 November 2018).
  12. van Oldenborgh, G.J.; van der Wiel, K.; Sebastian, A.; Singh, R.; Arrighi, J.; Otto, F.; Haustein, K.; Li, S.; Vecchi, G.; Cullen, H. Attribution of extreme rainfall from Hurricane Harvey, August 2017. Environ. Res. Lett. 2017, 12, 124009. [Google Scholar] [CrossRef]
  13. Climate Central. Surging Power Outages and Climate Change. 2022. Available online: https://www.climatecentral.org/report/surging-power-outages-and-climate-change (accessed on 16 April 2024).
  14. Román, M.O.; Stokes, E.C.; Shrestha, R.; Wang, Z.; Schultz, L.; Carlo, E.A.S.; Sun, Q.; Bell, J.; Molthan, A.; Kalb, V.; et al. Satellite-based assessment of electricity restoration efforts in Puerto Rico after Hurricane Maria. PLoS ONE. 2019, 14, e0218883. [Google Scholar] [CrossRef]
  15. Kwasinski, A.; Andrade, F.; Castro-Sitiriche, M.J.; O’Neill-Carrillo, E. Hurricane Maria Effects on Puerto Rico Electric Power Infrastructure. IEEE Power Energy Technol. Syst. J. 2019, 6, 85–94. [Google Scholar] [CrossRef]
  16. Hazeleger, W.; Severijns, C.; Semmler, T.; Sţefanescu, S.; Yang, S.; Wang, X.; Wyser, K.; Dutra, E.; Baldasano, J.M.; Bintanja, R.; et al. EC-Earth: A seamless earth-system prediction approach in action. Bull. Am. Meteorol. Soc. 2010, 91, 1357–1363. [Google Scholar] [CrossRef]
  17. Blake, E.; Zelinsky, D. National Hurricane Center Tropical Cyclone Report: Hurricane Harvey; National Hurricane Center: Miami, FL, USA; National Oceanographic and Atmospheric Association: Washington, DC, USA, 2018. [Google Scholar]
  18. Melaku, N.D.; Fares, A.; Awal, R. Exploring the impact of winter storm Uri on power outage, air quality, and water systems in Texas, USA. Sustainability 2023, 15, 4173. [Google Scholar] [CrossRef]
  19. Burton, I.; Kates, R.W.; White, G.F. The Environment as Hazard, 2nd ed.; Guildford: New York, NY, USA, 1993. [Google Scholar]
  20. Blaikie, P.; Cannon, T.; Davis, I.; Wisner, B. At Risk: Natural Hazards, People′s Vulnerability, and Disasters; Routledge: London, UK, 1994. [Google Scholar]
  21. Anderson, M.B. Vulnerability to disaster and sustainable development: A general framework for assessing vulnerability. In Storms; Pielke, R., Jr., Pielke, R., Sr., Eds.; Routledge: London, UK, 2000; Volume 1, pp. 11–25. [Google Scholar]
  22. Burton, C. Social vulnerability and hurricane impact modeling. Nat. Hazards Rev. 2010, 11, 58–68. [Google Scholar] [CrossRef]
  23. Berke, P.; Campanella, T. Planning for post-disaster resiliency. Ann. Am. Acad. Political Soc. Sci. 2006, 604, 192–207. Available online: http://www.jstor.org/stable/25097788 (accessed on 2 November 2020). [CrossRef]
  24. Schwab, J. Planning for Post-Disaster Recovery: Next Generation; American Planning Association: Chicago, IL, USA, 2014. [Google Scholar]
  25. Downton, M.W.; Pielke, R.A. Discretion without accountability: Politics, flood damage, and climate. Nat. Hazards Rev. 2001, 2, 157–166. [Google Scholar] [CrossRef]
  26. Cutter, S.L.; Finch, C. Temporal and spatial changes in social vulnerability to natural hazards. Proc. Natl. Acad. Sci. USA 2008, 105, 2301–2306. [Google Scholar] [CrossRef]
  27. Rowan, S.; Kwiatkowski, K. Assessing the relationship between social vulnerability, social capital, and housing resilience. Sustainability 2020, 12, 7718. [Google Scholar] [CrossRef]
  28. Li, X.; Elvidge, C.; Zhou, Y.; Cao, C.; Warner, T. Remote sensing of night-time light. Int. J. Remote Sens. 2017, 38, 5855–5859. [Google Scholar] [CrossRef]
  29. Cole, T.A.; Wanik, D.W.; Molthan, A.L.; Román, M.O.; Griffin, R.E. Synergistic use of nighttime satellite data, electric utility infrastructure, and ambient population to improve power outage detections in urban areas. Remote Sens. 2017, 9, 286. [Google Scholar] [CrossRef]
  30. Shermeyer, J. Assessment of electrical and infrastructure recovery in Puerto Rico following hurricane Maria using a multisource time series of satellite imagery. In Proceedings of the SPIE 10790, Earth Resources and Environmental Remote Sensing/GIS Applications IX, Bellingham, WA, USA, 9 October 2018; p. 1079010. [Google Scholar] [CrossRef]
  31. U.S. Census Bureau. Profile of General Population and Housing Characteristics; U.S. Census Bureau: Suitland, MD, USA, 2016. [Google Scholar]
  32. Florida Department of Agriculture and Consumer Services (FDACS). Electric Utilities. 2024. Available online: https://www.fdacs.gov/Business-Services/Energy/Florida-Energy-Clearinghouse/Electric-Utilities (accessed on 16 April 2024).
  33. Roman, M.; Wang, Z.; Shrestha, R.; Yao, T.; Kalb, V. Black Marble User Guide 1.2; NASA: Washington, DC, USA, 2021. Available online: https://viirsland.gsfc.nasa.gov/PDF/VIIRS_BlackMarble_UserGuide.pdf (accessed on 16 April 2024).
  34. Román, M.O.; Wang, Z.; Sun, Q.; Kalb, V.; Miller, S.D.; Molthan, A.; Schultz, L.; Bell, J.; Stokes, E.C.; Pandey, B.; et al. NASA′s Black Marble Nighttime Lights Product Suite. Remote Sens. Environ. 2018, 210, 113–143. [Google Scholar] [CrossRef]
  35. Li, X.; Zhou, Y.; Zhao, M.; Zhao, X. A harmonized global nighttime light dataset 1992–2018. Sci. Data 2020, 7, 168. [Google Scholar] [CrossRef]
  36. NOAA National Geodetic Survey (NGS). 2018 NOAA NGS Emergency Response Imagery: Hurricane Michael. 2024. Available online: https://www.fisheries.noaa.gov/inport/item/57759 (accessed on 23 March 2024).
  37. Khatami, R.; Mountrakis, G. Implications of Classification of Methodological Decisions in Flooding Analysis from Hurricane Katrina. Remote Sens. 2012, 4, 3877–3891. [Google Scholar] [CrossRef]
  38. NASA. Accuracy Assessment of a Land Cover Classification. Applied Remote Sensing Training Program (ARSET). 2018. Available online: https://appliedsciences.nasa.gov/sites/default/files/e1-final.pdf (accessed on 7 July 2024).
  39. Blanton, B.; Mc Gee, J.; Fleming, J.; Kaiser, C.; Kaiser, H.; Lander, H.; Luettich, R.; Dresback, K.; Kolar, R. Urgent computing of storm surge for North Carolina′s coast. Procedia Comput. Sci. 2012, 9, 1677–1686. [Google Scholar] [CrossRef]
  40. Getis, A.; Ord, J.K. The analysis of spatial association by use of distance statistics. Geogr. Anal. 1992, 24, 189–206. [Google Scholar] [CrossRef]
  41. Anselin, L. An Introduction to Spatial Data Science with GeoDa. Volume 1: Exploring Spatial Data; CRC/Chapman & Hall: Boca Raton, FL, USA, 2024; Online version. [Google Scholar]
  42. Anselin, L. An Introduction to Spatial Data Science with GeoDa. Volume 2: Clustering Spatial Data; CRC/Chapman & Hall: Boca Raton, FL, USA, 2024; Online version. [Google Scholar]
  43. Anselin, L.; Rey, S.J. Modern Spatial Econometrics in Practice, a Guide to Geoda, Geodaspace and Pysal; GeoDa Press: Chicago, IL, USA, 2014. [Google Scholar]
  44. NCHS (National Center for Health Statistics). 2013 Urban-Rural Classification for Counties. Centers for Disease Control and Prevention. 2013. Available online: https://cdc.gov/nchs/data_access/urban_rural.htm (accessed on 22 March 2020).
  45. Thorson, A. Mexico Beach City Council Votes on New Building Requirements. 6 February 2019. Available online: https://www.mypanhandle.com/news/mexico-beach-city-council-votes-on-new-building-requirements/ (accessed on 22 March 2020).
  46. Byrne, S. Mexico Beach Building Moratorium Lifted, Code Changes in Place. 18 February 2019. Available online: https://www.wjhg.com/content/news/Mexico-Beach-building-moratorium-lifted-code-changes-in-place-506012851.html (accessed on 22 March 2020).
  47. NASA (National Aeronautics and Space Administration). Night Lights Show Slow Recovery from Maria. 13 December 2018. Available online: https://earthobservatory.nasa.gov/images/144371/night-lights-show-slow-recovery-from-maria (accessed on 22 March 2020).
  48. NASA Earth Observatory. Lights Out in Michael′s Wake. 3 August 2018. Available online: https://earthobservatory.nasa.gov/images/92887/lights-out-in-michaels-wake (accessed on 2 November 2020).
  49. Sun, C.; Thomas, T.; Geng, X.; Chiang, K.; Chen, H.; Xiong, X. VIIRS DNB time-dependent stray light correction. In Earth Observing Systems XXIV; SPIE: San Diego, CA, USA, 2019; Volume 111271W. [Google Scholar]
  50. Parece, T.E.; Campbell, J.B. Land use/land cover monitoring and geospatial technologies: An overview. In Advances in Watershed Science and Assessment: The Handbook of Environmental Chemistry; Younos, T., Parece, T.E., Eds.; Springer: New York, NY, USA, 2015; Volume 33, pp. 1–32. [Google Scholar]
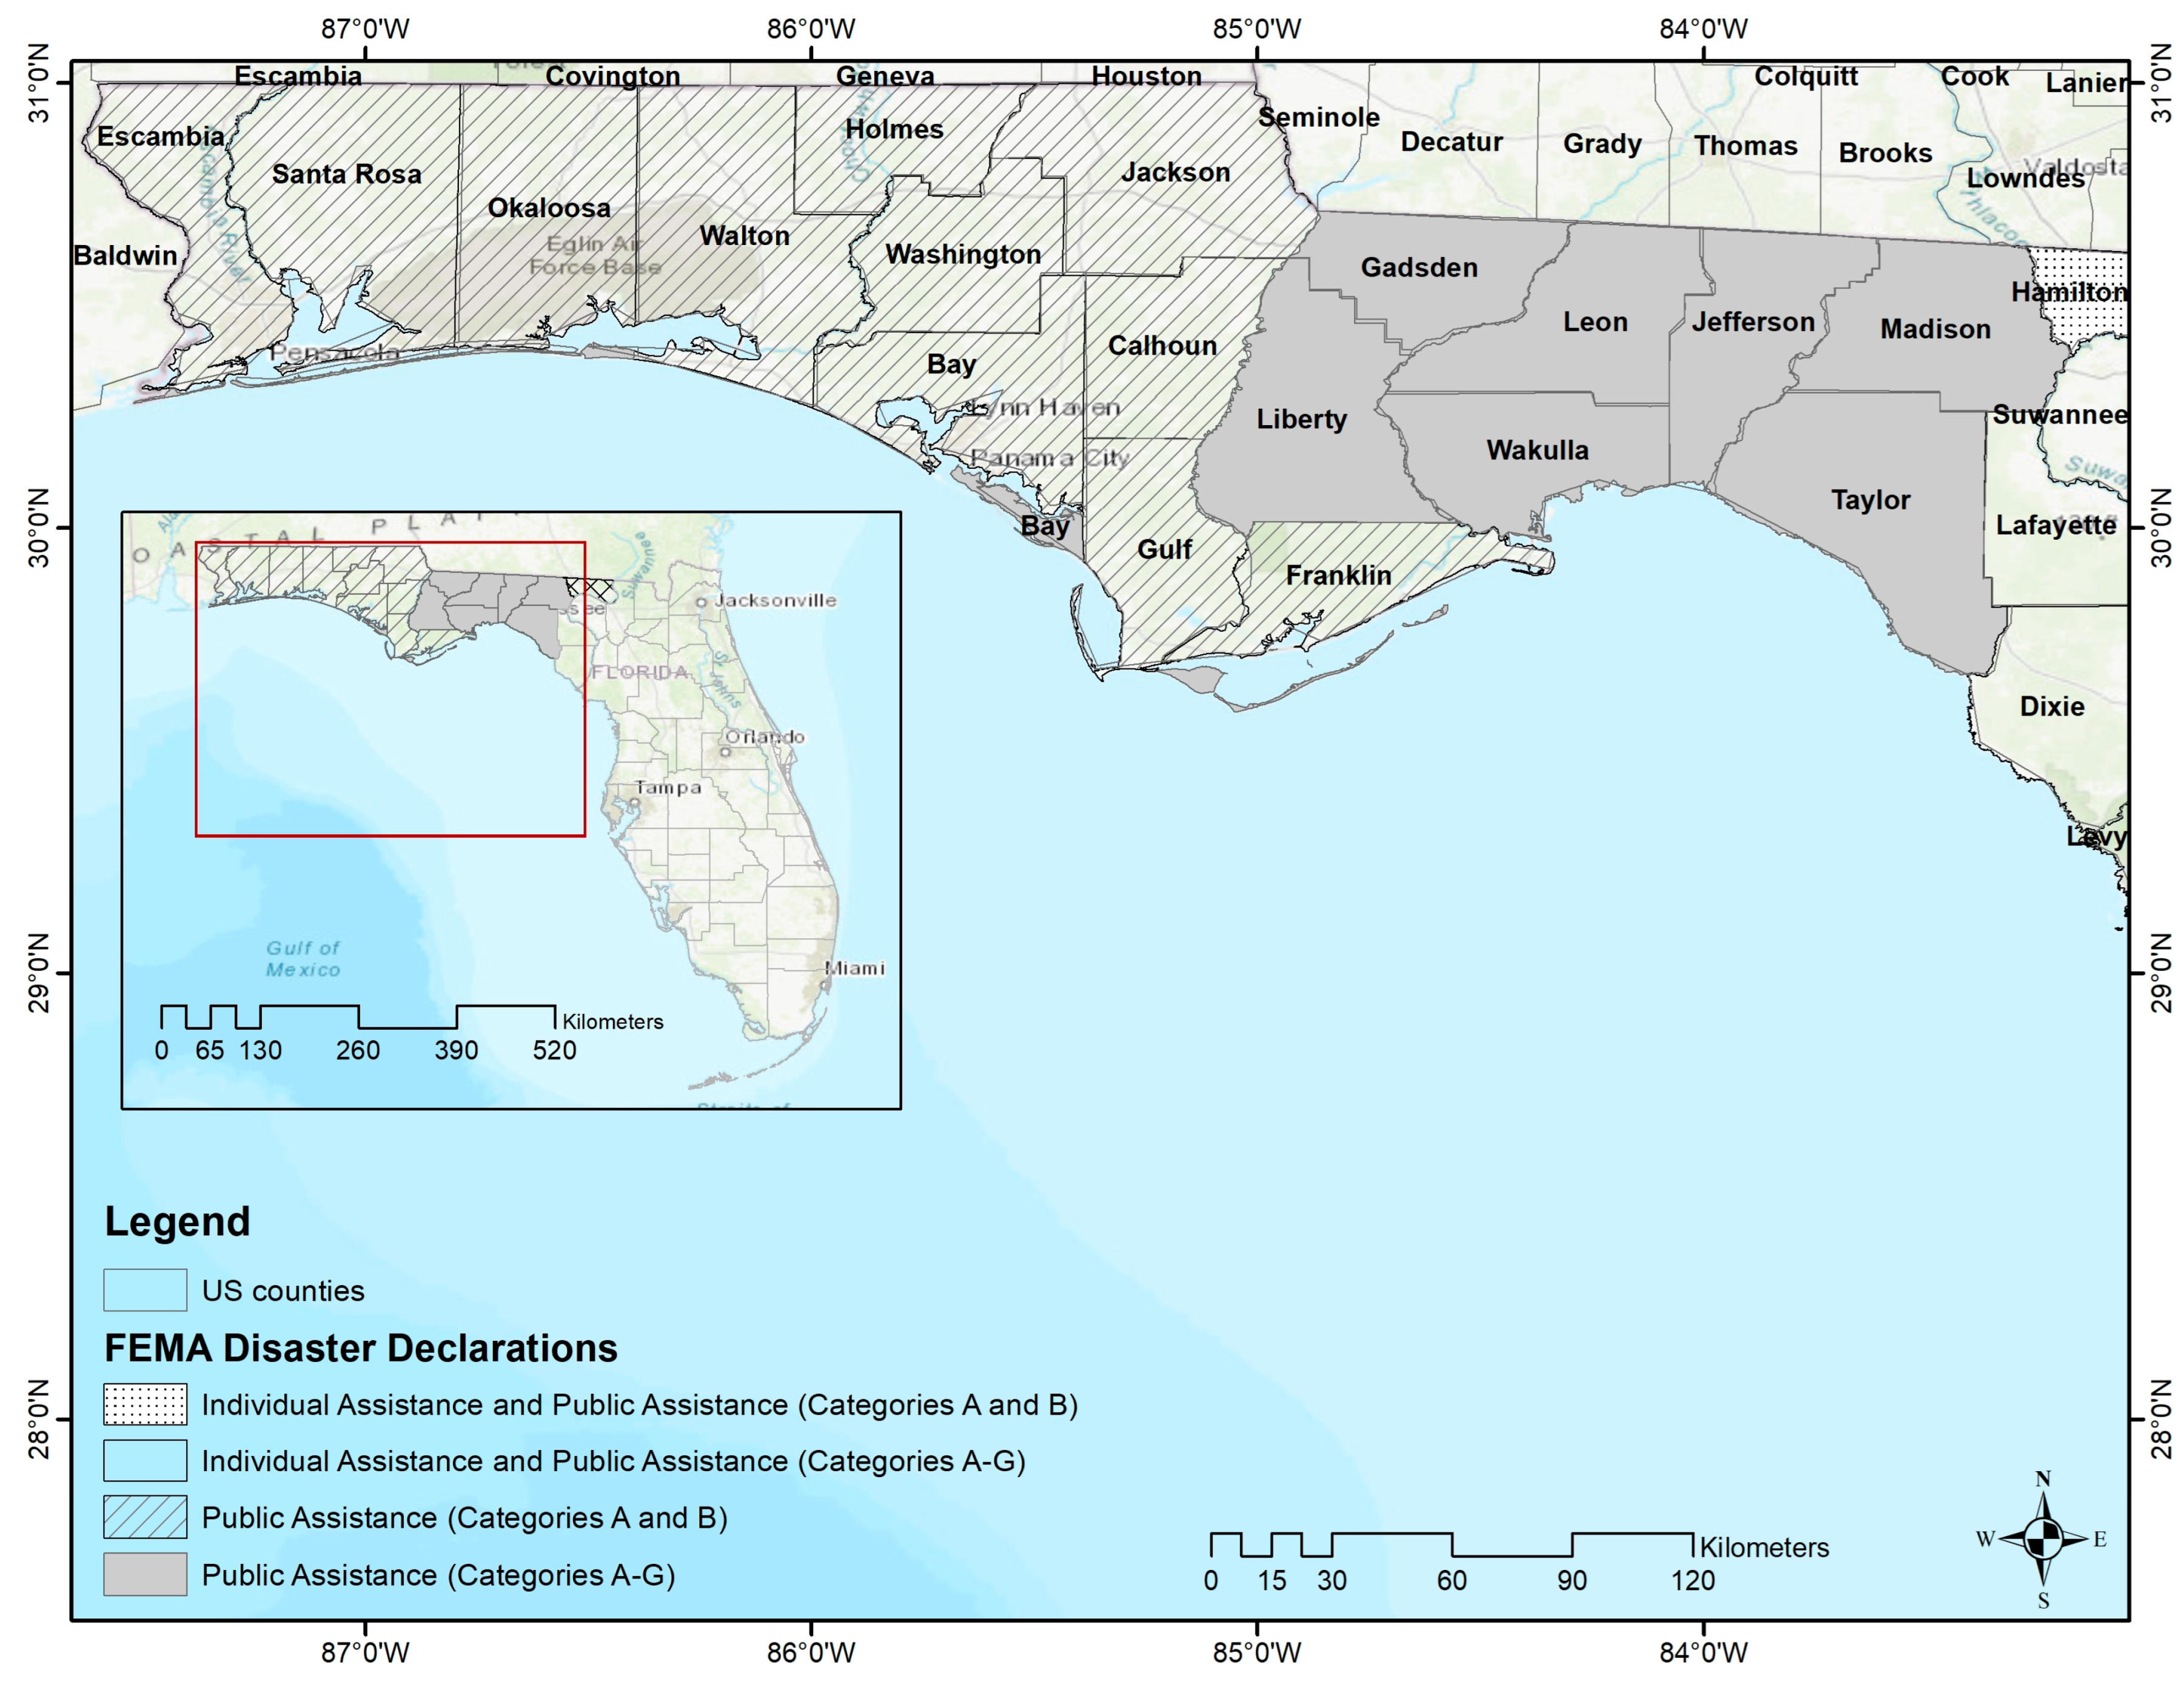
Figure 1. Counties in the Florida Panhandle with FEMA-issued disaster declarations following Hurricane Michael.
Remotesensing 16 02588 g001
Figure 2. Images from NOAA’s Emergency Response Database: (a,b) pre- and post-storm imagery for the northwestern part of Mexico Beach; (c,d) before and after images of the area southeast of Mexico Beach.
Remotesensing 16 02588 g002
Figure 3. Electric utilities in the Florida Panhandle (Data Source: FDACS 2024).
Remotesensing 16 02588 g003
Figure 4. Hurricane Michael best track, wind swaths, storm surge heights, and NTL data showing widespread power outages post-landfall (11 October 2018).
Remotesensing 16 02588 g004
Figure 5. The aftermath of Hurricane Michael in Mexico Beach: (a) results from the maximum likelihood classification showing the extent of destruction, including water, debris and sand deposition; (b) post-storm image of the same area.
Remotesensing 16 02588 g005
Figure 6. Power-restoration curves for (a) urban and (b) rural counties in the study area.
Remotesensing 16 02588 g006
Figure 7. Before and after images from the nighttime light data from the NASA’s operational Black Marble product suite (VNP46).
Remotesensing 16 02588 g007
Figure 8. Difference between the baseline and post-storm NTL radiance (11–31 October 2018).
Remotesensing 16 02588 g008
Figure 9. Results from the hotspot analysis: (a) estimated percent recovery based on NTL NTL radiance; (b) estimated rate of restoration based on the 7-day moving average change in NTL radiance.
Remotesensing 16 02588 g009aRemotesensing 16 02588 g009b
Table 1. Confusion (error) matrix for the supervised ML classification.
ReferenceClassifiedTotal Reference PointsUser’s Accuracy
RoofVegetationWaterBarren DebrisSand
Roof8223203011082.0
Vegetation1262144009267.4
Water121581108270.7
Barren01166347588.0
Debris7001050138062.5
Sand1003810912190.1
Total classified points103867610465126560
Producer’s accuracy79.672.176.363.576.986.5
Total correct reference points 427
Percent accuracy 76.25
Table 2. Total number of accounts by county, including percentage served by investor-owned utilities, rural electric cooperatives, and municipal providers.
CountyUrban/Rural 1Total Number of AccountsPercent Accounts Investor-Owned Electric Utilities 2Percent Accounts Rural CooperativePercent Accounts Municipal Providers
BAY1115,62489.9%10.1%0.0%
CALHOUN0393623.5%43.1%33.4%
FRANKLIN010,199100.0%0.0%0.0%
GADSDEN122,2940.0%67.2%32.8%
GULF110,91659.3%40.7%0.0%
HOLMES010,42324.8%75.2%0.0%
JACKSON026,16146.9%53.1%0.0%
JEFFERSON1815257.4%42.6%0.0%
LEON1143,7990.0%18.4%82.7%
LIBERTY0405819.0%81.0%0.0%
MADISON010,71835.7%64.3%0.0%
TAYLOR012,93646.7%53.3%0.0%
WAKULLA115,47744.1%55.9%0.0%
WALTON059,47638.9%61.1%0.0%
1 Based on CDC National Center for Health Statistics classification [44]. 2 FPL, Duke, Gulf Power, Tampa Electric, FPU).
Table 3. Descriptive statistics of the census and NTL variables at the block group level.
VariableMeanStd. Dev.MinMax
Population density (inhabitants/square mile)1463581465947
Number of households on public assistance15411711231
Percent minority population24.20%15.10%044.50%
Percent multi-family housing units8.80%13.40%034.30%
Maximum NTL radiance lost82.4318.863.18100.00
Percent of the NTL radiance recovered relative to the baseline33.4220.650.0097.23
Urban vs. rural setting 232 BGs as urban, 237 BGs as rural
Table 4. Maximum likelihood spatial lag model using as the dependent variable the percent NTL radiance restored by 23 December 2018 (Model 1).
VariableCoefficientStd. Errort-Statisticp-Value
CONSTANT57.4302110.006545.739260.000
HH on Public Assistance−0.072530.04079−1.778230.075
PCT Multifamily housing units−0.952750.13166−7.236320.000
Maximum NTL radiance lost−0.009620.00205−4.668630.000
ROC (21 days)0.067340.030182.230960.025
Urban/Rural5.973451.439034.151000.000
Spatial autoregressive coefficient0.367190.115663.174840.001
Model parameters
S.D. of dependent variable14.814 Log likelihood−1884.692
Sigma-square ML180.071 Akaike info criterion3785.384
S.E of regression ML13.419 Schwarz criterion3818.588
Multicollinearity condition number4.404
Table 5. Maximum likelihood spatial lag model using as the dependent variable the rate of change in NTL radiance recovered as a proxy for a rate of power restoration (Model 2).
VariableCoefficientStd. Errort-Statisticp-Value
CONSTANT5.503931.169134.707710.000
Population density0.220960.157931.399110.062
Pre-storm NTL radiance−0.003500.00121−2.890990.004
Median property values0.000080.000041.843750.065
NTL radiance recovered in the first 7 days post-landfall−0.073400.02049−3.583160.000
Urban/Rural2.445640.939732.602470.009
Spatial autoregressive coefficient0.274470.119542.296120.021
Model parameters
S.D. of dependent variable8.207 Log likelihood−1619.744
Sigma-square ML58.337 Akaike info criterion3253.487
S.E of regression ML7.638 Schwarz criterion3282.542
Multicollinearity condition number7.359
Disclaimer/Publisher’s Note: The statements, opinions and data contained in all publications are solely those of the individual author(s) and contributor(s) and not of MDPI and/or the editor(s). MDPI and/or the editor(s) disclaim responsibility for any injury to people or property resulting from any ideas, methods, instructions or products referred to in the content.