Abstract
Landslide identification in alpine and canyon areas is difficult due to the terrain limitations. The main objective of this research was to explore the method of combining small baseline subset interferometric synthetic aperture radar (SBAS-InSAR), multi-temporal optical images and field surveys to identify potential landslides in the human-modified alpine and canyon area of the Niulan River in southwestern China based on terrain visibility analysis. The visibility of the terrain is analyzed using the different incident and heading angles of the Sentinel satellite’s ascending and descending orbits. Based on the SAR image data of Sentinel-1A satellites from 2016 to 2019, the SBAS-InSAR method was used to identify landslides, and then multi-temporal optical images were used to facilitate landslide identification. Field surveys were carried out to verify the identification accuracy. A total of 28 landslides were identified, including 13 indicated by SBAS-InSAR, 8 by optical imaging and 7 by field investigation. Many landslides were induced by the impoundment and fluctuation of reservoir water. The comparison and verification of typical landslide monitoring data and reservoir water fluctuations revealed that a sudden drop of reservoir water had a great influence on landslide stability. These research results can facilitate a comprehensive understanding of landslide distribution in the reservoir area and guide the follow-up landslide risk management.
1. Introduction
Landslide is a common geological disaster that is widely distributed in southwest China, frequently causing loss of life and property [1,2]. Especially in the alpine and canyon areas with great disparity in terrain elevation and complex geological structures, the density and frequency of landslides have increased significantly [3]. Under the strong tectonic uplift and river incision, large and giant landslides often occur in the alpine and canyon areas, leading to river blockage and threatening people’s property and water conservancy facilities [4,5].
Due to the limitation of terrain conditions and investigative means, it is not practical to carry out detailed and high-frequency landslide field surveys in alpine and valley areas [6,7,8]. However, alpine and valley areas are often located in high landslide susceptibility zones, and accurate landslide inventories are required for disaster risk management and land use planning in these areas [9,10,11]. An effective way to solve this problem is to carry out landslide identification based on remote sensing (RS) technology. After years of RS technology development, many methods have been applied to landslide identification, such as optical image interpretation [12,13], unmanned aerial vehicle (UAV) measurement [14], LiDAR measurement [15,16,17] and interferometric synthetic aperture radar (InSAR) identification [18,19,20]. Optical image interpretation has a better identification effect on landslides that have already occurred, but poorer identification effect on initially deformed landslides with few deformation signs. Although UAV and LiDAR photogrammetry have high accuracy, they require on-site manual operation, and the high cost makes it difficult to perform high-frequency photogrammetry. InSAR technology has the characteristics of wide coverage, high precision and resolution, and regular itinerary. Therefore, it can effectively identify landslide deformation, and has gradually become one of the main methods for identifying landslide hazards [21]. Many researchers have also carried out research on landslide identification in alpine and valley areas based on InSAR technology. The landslide hazards upstream and downstream of the Baige landslide were identified using InSAR technology and optical images [22]. Three methods, InSAR, optical images and field surveys, were adopted to identify landslides in the alpine valley area of the Jinsha River [23].
However, the characteristics of the imaging method of the SAR system mean that it will produce geometric distortion in areas with large terrain fluctuations, especially in alpine and canyon areas [24]. Geometric distortion will seriously affect the accuracy of deformation captured by Sentinel satellite, which may lead to misjudgment of landslide identification. Colesanti and Wasowski analyzed the visibility of slopes in different directions and defined aspect and slope ranges for foreshortening, layover and shadow [25]. Notti et al. proposed the R index, which represents the ratio of slope distance to ground distance and quantifies the influence of terrain on radar imaging [26]. Cigna et al. systematically summarized the existing research on SAR terrain visibility by simulating the geometric distortion of SAR images [27]. Dai et al. analyzed the geometric distortion effect of Sentinel-1A images along the Sichuan–Tibet Railway [28]. Limited research has been performed regarding visibility of InSAR recognition applied in alpine and valley areas. Landslide identification cannot be completed using InSAR technology alone, so researchers often prefer to use a variety of methods to identify such areas to improve the accuracy of landslide identification. The objective of this research is to identify landslides in the alpine and valley areas based on comprehensive methods.
In this study, Xiangbining Reservoir was selected as the research area, and based on the analysis of terrain visibility, a combination of SBAS-InSAR, optical imaging and field survey were used to identify potential landslides in alpine and canyon areas. A typical landslide was selected to analyze the cumulative deformation by SBAS-InSAR and total station. The influence of reservoir water on landslide development in the study area was researched through the analysis of RS data before the impoundment. The research result was provided for the identification of landslides in human-modified alpine and canyon areas and the scheduling of reservoir water levels.
2. Study Area and Data
2.1. Study Area
The study area, Xiangbiling hydropower station reservoir, is located at the junction of Huize County in Yunnan Province and Weining County in Guizhou Province between 103°38′8.45″–103°48′17.57″E and 26°51′30.84″–27°4′47.62″N and covers an area of about 195.31 km2 (Figure 1). The hydropower station began to store water in April 2017, with a maximum water level of 1405 m and a minimum water level of 1370 m. The Niulan River flows through the entire region from southeast to northwest, forming a landscape of alpine and canyon. The terrain in the area is high in the west and low in the east, and the mountains are belt-shaped with an altitude of generally 1275–2660 m. In the central part of this area, the alpine and canyon landform was formed by erosion of the Niulan River and its tributaries, and the maximum relative height is more than 1000 m. The climate of the study area is categorized as subtropical humid monsoon, with annual rainfall between 1000 mm and 1400 mm, concentrated from May to September [29,30].
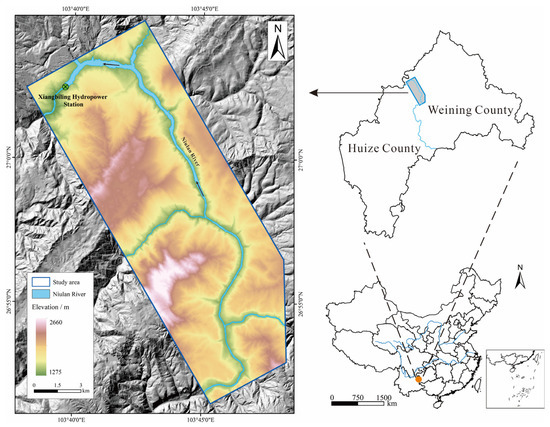
Figure 1.
Location and elevation distribution of the study area.
The topographic data of the study area was derived from 1:2000 topographic mapping, and the slope and aspect are derivatives of it. Most of the area along the Niulan River is a V-shaped canyon with a bank slope of 30–60°. Only some areas in the study area have relatively gentle bank slope angles, mainly concentrated at the intersection of the main stream and tributaries of the Niulan River (Figure 2a). The aspect can indicate the strong and weak relationship of the degree of insolation, which affects the moisture and vegetation coverage on the inclination [31,32]. Affected by river erosion and geological structure, the aspects of the study area are mainly concentrated in the northeast and southwest (Figure 2b). Investigators have confirmed that terrain has a particularly effective influence on landslide formation, thus, slope and aspect are representative of the terrain [33,34,35]. At the same time, in the alpine and canyon area, the slope and aspect of the terrain will produce geometric distortion on the Sentinel image, which will have a certain impact on the visibility of the terrain and affect the accuracy of landslide identification.
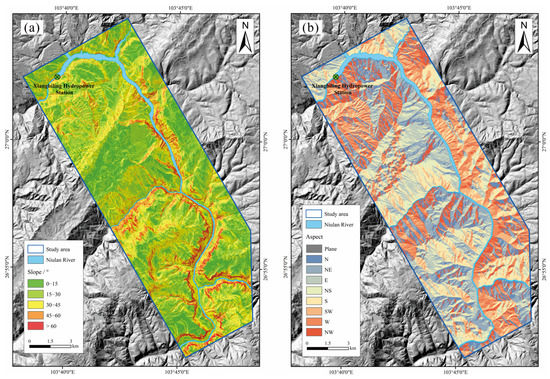
Figure 2.
Slope and aspect map of the study area: (a) slope, (b) aspect.
Figure 3 shows the geological structure and lithology in the study area, which also have an important influence on the formation of landslides. The geological structure in the study area is complex, and the faults are mainly southwest to northeast and northwest to southeast, forming an X-shaped interlacing in the region. The strata in the study area are relatively complete, mainly the Permian Emeishan Basalt formation and the Carboniferous Yanguan formation, and the bedrock is mainly basalt, limestone and dolomite, with an inclination angle of 8–16°. According to the geological characteristics of geotechnical engineering, the study area can be divided into the following zones: (1) crushed stone, gravel and clayey soil engineering geological zone (I); (2) shale mixed with siltstone, dolomite formation engineering geological zone (II1); (3) argillaceous siltstone, shale, quartz sandstone formation engineering geological zone (II2); (4) quartz sandstone mixed with limestone formation engineering geological zone (II3); (5) dolomite mixed with marl, shale and siltstone formation engineering geological zone (III1); (6) marl and limestone formation engineering geological zone (III2); (7) volcanic ejection rock formation engineering geological zone (IV).
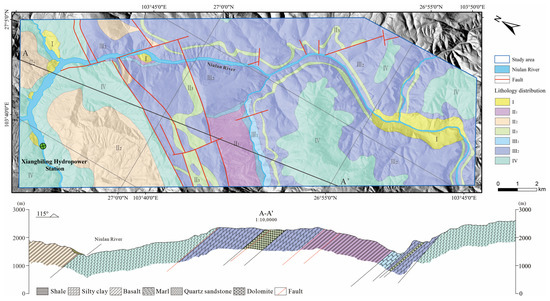
Figure 3.
Lithology and geological structure distribution in study area.
2.2. Data
This study used SAR image data from Sentinel-1A, which is provided on the European Space Agency (ESA) website (https://scihub.copernicus.eu/dhus/#/home, accessed on 9 December 2022). The satellite revisit period is 12 days, the azimuth resolution is 20 m, the distance resolution is 5 m, and the basic parameters of SAR image data are shown in Table 1. In addition, the digital elevation model (DEM) obtained by Shuttle Radar Topography Mission (SRTM) was used to simulate the inverted SBAS-InSAR terrain phase to remove the interference phase caused by the change of surface elevation.

Table 1.
Basic parameters of SAR image data in the study area.
For the alpine and canyon landforms in the study area, the ascending and descending images were selected to jointly identify potential landslides. In this study, 61 ascending images were collected from January 2016 to December 2019, with an interval of 24 days. Due to the partial lack of descending image data in the geographical location of the study area in 2016, data from only 46 descending images were collected, covering the period from February 2017 to December 2019, with an image interval of 24 days.
The optical image data come from Google Earth Pro, and the resolution is 0.3 m. Because the Google Earth image is a multi-time fusion image, the image time in the study area is not consistent. Optical image interpretation is visual interpretation, and human engineering activities, such as the construction of reservoirs and roads, will transform the surface landscape, which may affect the accuracy of interpretation. In order to accurately identify landslides in the area through optical images, optical images before and after the impounded reservoir were collected. The pre-impoundment image spans from September 2014 to January 2016. The other is from September 2014 to January 2020. It is worth mentioning that only a small part of the images after the reservoir impoundmentwere stored in September 2014, which does not affect the overall optical image landslide identification (Figure 4).
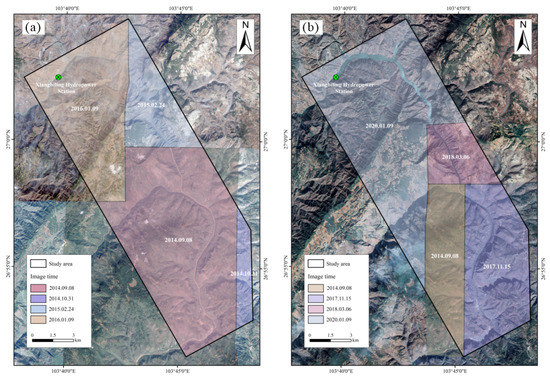
Figure 4.
Optical image in study area: (a) time period before reservoir impoundment, (b) time period after reservoir impoundment.
3. Methods
A flow chart of the study is delineated in Figure 5. It mainly includes: (1) the terrain visibility analysis of the study area and the extraction of the deformation zone by SBAS-InSAR, (2) the determination of landslide interpretation feature and visual interpretation by optical images, (3) field investigation and verification, (4) the analysis of the temporal and spatial deformation characteristics of a typical landslide, and (5) the discussion on landslide identification method in alpine canyon area.
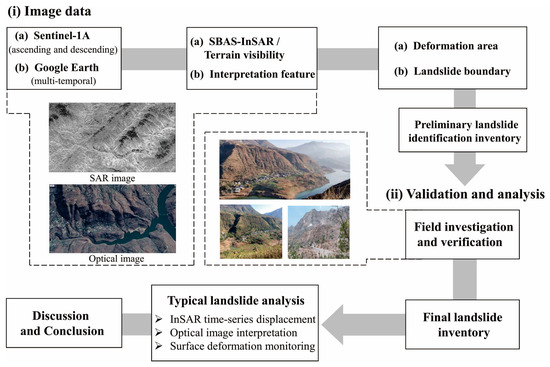
Figure 5.
Technical flowchart of study design.
3.1. Terrain Visibility Analysis
The study area belongs to the alpine and canyon region and the topography along both sides of the Niulan River has large undulations. The satellite sensor is affected by the terrain effect when collecting data, resulting in a different order of ground reflection radar signal reception, which will cause geometric distortion of SAR images in some areas. These distortions will affect the interference processing of the SAR image, and the researchers divided the geometric distortion caused by the terrain into foreshortening, layover and shadow. Therefore, the visibility of terrain determines the accuracy and quality of landslide identification in alpine and canyon regions. The visibility of terrain depends on the line of sight (LOS) direction of the satellite and the slope (β) and aspect (α) of the terrain in the study area. The LOS direction of the satellite can be expressed by the incidence angle (θ) and heading angle (γ). The incidence angle and heading angle of different satellite orbits will cause the same research area to have different visibility partitions.
In this study, the R-index method proposed by Notti et al. was used to conduct visibility analysis [26]. The parameters of the ascending and descending orbit satellites in the study area are shown in Table 1, and the slope and aspect data of the study area are shown in Figure 2. More details on partitioning foreshortening, layover and shadow can be found in Cigna et al. [27]. The formula for the R-index is as follows:
where A is the aspect correction factor, and when the SAR image data belongs to ascending orbit data, A = α + γ + 180. On the contrary, when it belongs to descending orbit data, A = α − γ.
3.2. SBAS-InSAR Method
Time series InSAR technology is to analyze the stability of the phase in the time series of multiple SAR images, determine the pixels that are less affected by the incoherence of time and space, and use these pixels to obtain high-precision surface deformation data. PS-InSAR and SBAS-InSAR are the mainstream time series InSAR technologies that are widely used at present [36,37]. However, it is difficult for PS-InSAR to obtain high-density and accurate target points in non-urban areas, and this method is more suitable for urban areas [38]. Therefore, in order to adapt to the topography of alpine canyon in the study area, the SBAS-InSAR for deformation time series analysis was selected for this study.
The basic principle of the SBAS-InSAR method is to freely combine SAR image pairs with smaller baselines by setting a spatiotemporal baseline threshold, and then generate different interferograms on this basis. According to the situation of baseline, these interferograms can be classified into several small sets, and the least square (LS) method is used to solve the time series of surface deformation in this set. Then multiple small baseline sets are combined and solved by the singular value decomposition (SVD) method of the matrix to obtain the deformation time series of the entire monitoring period [39]. The formula for calculating the surface deformation of the time series using the SBAS method is mainly as follows [40]:
where A is the time interval matrix. is the observed interference value vector. is the velocity (vector value) in the line of sight direction. is the inverse matrix of A. is the displacement in the line of sight direction.
The method can be carried out under the SARscape module of ENVI 5.6 software, and the main steps are as follows:
- (1)
- Connection Graph: The purpose is to pair multi-temporal SAR data and analyze the relationship between interference image pairs in time and space.
- (2)
- Interferometric Process: The Goldstein filter is used to filter the differential interferogram after deflating, and the phase unwrapping is performed using Delaunay MCF unwrapping method [41,42].
- (3)
- Refinement and Re-Flattening: Estimate and remove the residual constant phase and phase ramp that still exists after unwrapping. The purpose of this process is to use DEM, ground control points (GCPs), etc. to remove the residual terrain phase, reduce unwrapping errors, and ensure the accuracy of surface deformation inversion.
- (4)
- Inversion: There are two inversions in this process, and the deformation rate and residual topography of the study area are obtained from the results of the first inversion. Based on the deformation rate obtained from the first inversion, a customized atmospheric filter is performed to estimate and remove the atmospheric phase and obtain a more accurate final displacement result on the time series.
- (5)
- Geocoding: The phase result obtained by inversion is converted into elevation, the image is geocoded to convert the SAR coordinate system into a geographic coordinate system, and the surface deformation information of the radar line of sight in the study area is obtained.
The terrain effect in the alpine and canyon area leads to a limited recognition range of a single-orbit SAR image data. The image geometric distortion may cause errors in landslide identification. If only the area with good visibility is used for deformation analysis, the identification range of the study area will be smaller. Therefore, this study adopts the method of combining the image of the ascending and descending to capture more comprehensive and accurate deformation data in the study area.
3.3. Optical Image Interpretation
Although InSAR technology can efficiently identify landslides in most areas, the limitation of topographic effects leads to identification errors or omissions in some areas. In the study, the optical image visual interpretation was used to identify landslides in the entire study area and the InSAR identification results were complemented. Landslide boundaries were delineated mainly based on the features of landslides on optical images. Landslides often change the surrounding geomorphology on slopes, forming chair-shaped micro-landforms. According to the geomorphological characteristics, landslide deformation and geological condition, the identification signs of landslides can be established. One is the direct identification signs of landslides, which refer to image features such as shape, size, image tint, shadow, and texture that can be directly interpreted on optical images. The other is indirect identification signs, such as the topography, lithology, geological structure, groundwater outcrop, and vegetation of the slope where the landslide is located.
4. Results
4.1. Terrain Visibility Analysis Result
The analysis results of terrain visibility for satellite ascending and descending orbits in the area are depicted in Figure 6. Different terrain visibility effects were produced by the different incidence angles of the Sentinel-1A satellite’s ascending and descending orbit. Through the superposition of the visibility results, most areas on the east and west sides of the Niulan River in the area have good visibility, avoiding the influence of most geometric distortions on the recognition results.
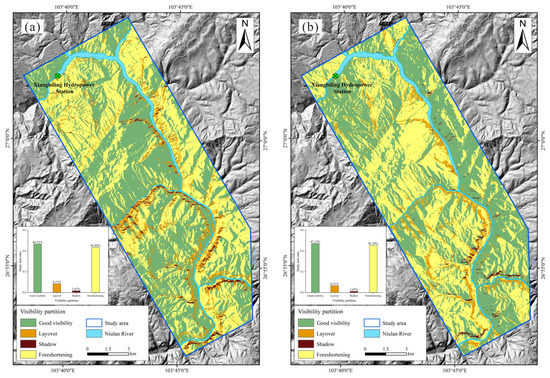
Figure 6.
The visibility partition of study area: (a) ascending orbit, (b) descending orbit.
The visibility partition of the ascending is revealed in Figure 6a. There are mainly areas with good visibility (46.52%) and foreshortening (43.44%), while shadow (1.67%) and layover (8.37%) areas account for a small proportion. Good visibility is mainly concentrated along the west bank of the Niulan River, and the west bank and the north of the study area are mainly for foreshortening. The shadow and layover are mainly distributed in the central and southern part of the study area. The visibility partition of the descending is revealed in Figure 6b. There are mainly areas with good visibility (47.13%) and foreshortening (45.29%), while shadow (1.07%) and layover (6.51%) areas account for a small proportion. Good visibility is mainly concentrated along the east bank of the Niulan River, and the west bank is mainly for foreshortening. The shadow and layover are mainly distributed in the central and southern part of the study area along the west bank of Niulan River. The visibility partition of the ascending and descending occupies approximately the same partition. It is worth noting that, corresponding to the slope map of the study area, the shadow and layover are mainly distributed in areas with steep slopes, regardless of ascending or descending orbit.
4.2. SBAS-InSAR Deformation Results Analysis
Usually, positive deformation values indicate that the object is moving in the direction of the satellite, and negative deformation values indicate that it is moving in the opposite direction. The researchers used positive deformation values to represent the uplift of the surface, and negative deformation values represented ground subsidence. However, the undulating topography of the alpine and canyon in the study area means serious geometric distortion, and the uplift and subsidence represented by positive and negative deformation values are not applicable. Therefore, this study only uses the concept of deformation and does not distinguish between positive and negative deformation values.
For the above reasons, it is obviously not appropriate to determine the deformation of the ascending and descending results with a uniform deformation threshold. Expert experience has contributed to a certain extent to the identification of deformation zones in the study area. We acknowledge that it leads to the introduction of uncertainty caused by subjective factors into the final result. Therefore, the method of multi-source data identification is used to eliminate the influence caused by subjective factors as much as possible.
The deformation rate of the LOS direction of the Sentinel-1A satellite ascending image in the study area from 2016 to 2019 is depicted in Figure 7. It is obvious that the SBAS-InSAR feature points are mainly concentrated on the west bank of the Niulan River, corresponding to the visibility in Figure 6a. A total of 10 deformation areas were identified in the ascending data, but these areas are not guaranteed to be landslides and require further optical imaging or field verification. Part of these deformation zones identified as landslides are also delineated in Figure 7. The H3 landslide is located at the confluence of the Niulan River and its tributaries. The impact of the water flow is strong, which can easily induce landslides. Significant changes in the deformation of H3 landslide can be observed in different reservoir water level. The same phenomenon occurred in the H2 landslide. H4 is a typical reservoir accumulation landslide, and the optical image has obvious ancient landslide characteristics. The H6, H7 and H9 landslides are located in a high and steep slope area, which is prone to landslides.
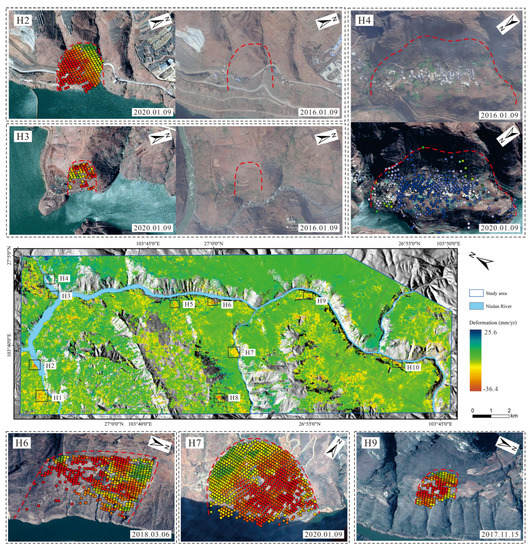
Figure 7.
Landslide identification result of ascending Sentinel-1A. The SBAS-InSAR monitoring period is from 2016 to 2019. H2, H3, and H4 landslides depict the image comparison before and after water impoundment and the distribution of SBAS-InSAR feature points. H6, H7, and H9 landslides delineate the image after water impoundment and the distribution of SBAS-InSAR feature points.
The deformation rate of the LOS direction of the Sentinel-1A satellite descending image in the study area from 2017 to 2019 is portrayed in Figure 8. Compared with the ascending, landslide identification using the descending data is not very good. The SBAS-InSAR feature points are mainly concentrated on the east bank of the Niulan River, but there is a large area on the west bank without feature points. It means that the descending data has poor applicability in the study area. A total of six deformation areas were identified in the ascending data. However, there are two deformation areas that are consistent with the identification of ascending. D1 and H4 are the same landslide, but the feature point of D1 is subsidence, and the feature point of H4 is uplift. D5 and H7 are the same landslide too, and the feature point of D5 is uplift, and the feature point of H7 is subsidence. A total of 14 deformation areas were identified from the ascending and descending data.
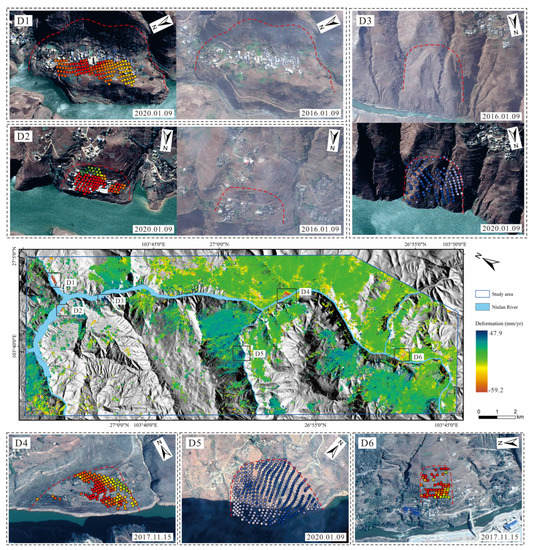
Figure 8.
Landslide identification result of descending Sentinel-1A. The SBAS-InSAR monitoring period is from 2017 to 2019. D1, D2, and D3 landslides depict the image comparison before and after water impoundment and the distribution of SBAS-InSAR feature points. D4, D5, and D6 landslides delineate the image after water impoundment and the distribution of SBAS-InSAR feature points.
4.3. Optical Image Identification Result
The study spanned from 2016 to 2019, and Xiangbiling hydropower station was built and started operation in this period. Human engineering activities have a great impact on the surface transformation of the study area, which affects the visual interpretation of landslides. It is necessary to supplement landslide identification through the interpretation of optical images with different periods.
Figure 9 depicts the results of optical image-assisted recognition in the area, with a total of nine landslides identified. There was one wrong result of SBAS-InSAR verified using optical images. Typical landslides are as follows: the SBAS-InSAR ascending and descending at the S1 landslide are identified non-deformation region, but the landslide features can be clearly identified through the optical image. The S7 was incorrectly identified as landslide by SBAS-InSAR, but a comparative analysis of images on 18 September 2014 and 15 November 2017 show that the site was a deformation of the ground surface caused by human engineering activities. The S8 and S9 landslides have no feature point distribution under the identification of ascending and descending data, SBAS-InSAR cannot identify this area, but the sliding trace is clearly depicted on the optical image. The image comparison of the S3 landslide shows that if the landslide is identified by only one optical image, the landslide traces may be covered by vegetation.
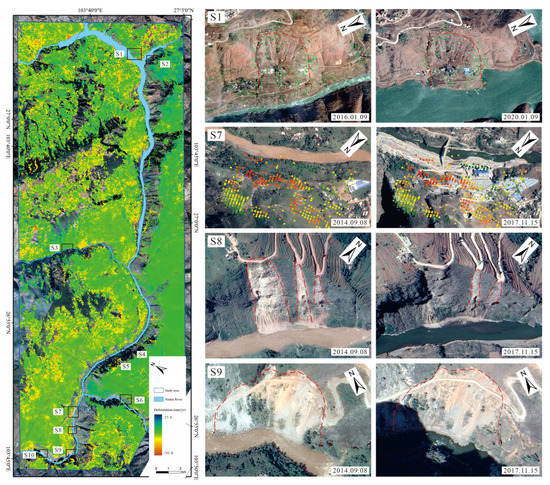
Figure 9.
Landslide identification result of optical image. The base map is Google image and SBAS-InSAR deformation data of ascending Sentinel-1A.
4.4. Final Landslide Identification
The accuracy of SBAS-InSAR and optical image landslide identification technology needs to be verified by field surveys, and field surveys can also identify some landslides that SBAS-InSAR and optical image cannot. A total of 10 landslides and one error were identified in the Sentinel-1A satellite ascending data, and the descending data identified six landslides, two of which coincided with the ascending data. Multi-temporal optical image supplemented the identification of nine landslides, and one landslide identification error. Field surveys identified seven landslides. A total of 28 landslides were identified in the study area, as shown in Figure 10. The identification results reveal that in alpine and valley areas, the combination of SBAS-InSAR, optical image and field investigation can more comprehensively identify landslides in the study area and reduce the probability of identification errors.
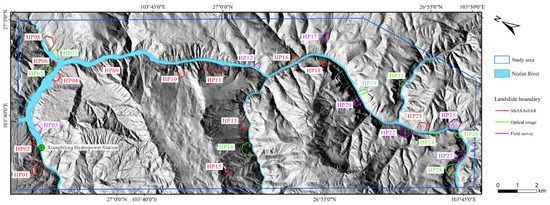
Figure 10.
Landslide identification result.
5. Analysis of Typical Landslide
5.1. Landslide Characteristics
The Hejiapingzi landslide (HP08) was selected for analysis as a typical landslide. It is located on the east bank of the Yulong River, a tributary of the Niulan River, as shown in Figure 11. The landslide is tongue-shaped, bounded on both sides by two gullies, with the toe of the landslide bordering the Yulong River. The middle is a wide, gentle platform and the rear is a steep slope of 40–60°. This is a gently inclined accumulation landslide with a length of 445 m, a maximum width of 650 m, a maximum thickness of 80 m and a volume of 13 × 106 m3. The landslide material is gravel, soil and clay. The slip zone is purple-red mudstone with a thickness of about 0.5–2 m. The slide bed is basalt, and the inclination angle of the rock formation is relatively flat. The main threat of the landslide is 552 people in 131 households in the middle platform.
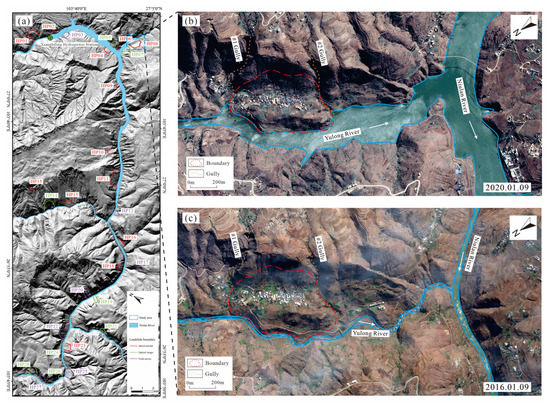
Figure 11.
Location and optical image of the Hejiapingzi landslide (deformed in August 2017): (a) landslide identification result, (b) landslide optical image after reservoir impoundment, (c) landslide optical image before reservoir impoundment.
Figure 11b,c are optical image interpretation diagrams of Hejiapingzi landslide. The left and right boundaries of the landslide are controlled by tow gullies (#1 gully and #2 gully). The slope of the rear edge is steep, and the slope of the toe and middle is slow. The landslide moving towards the river is an obvious ancient accumulation landslide. Figure 11b is the optical image of Hejiapingzi landslide before the reservoir impoundment, taken on 9 January 2016, with obvious scarps along the road on the toe. Figure 11c is an image of the landslide after the reservoir impoundment, taken on 9 January 2020. The road of landslide front was flooded. The rise and fall of the reservoir water caused deterioration of the rock and soil, which can very easily induce instability of the landslide toe.
The Xiangbiling hydropower station began to store water in April 2017. The Hejiapingzi landslide deformed in August 2017 and a large number of landslide surface cracks occurred. Due to the fluctuation and immersion of the reservoir water, there is a bank collapse along the landslide toe. Many houses in the middle of the landslide cracked; the cracks were 1–4 cm wide. Fractures develop through the rear of the landslide, with a common descent of 20–50 cm along the steep bedrock scarp, with a maximum of 60 cm (Figure 12).
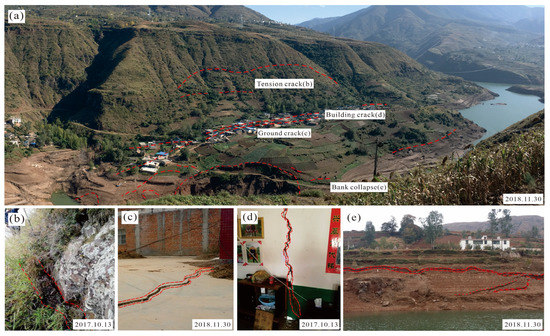
Figure 12.
Deformation and crack distribution of Hejiapingzi landslide: (a) overview of landslide cracks, (b) tension crack, (c) ground crack, (d) house crack, (e) bank collapse.
5.2. Validation of SBAS-InSAR Result
The result of the SBAS-InSAR identification of the Hejiapingzi landslide from 2016 to 2019 is depicted in Figure 13. The recognition effect of Sentinel-1A satellite ascending data is better than that of descending data. The ascending identification result is shown in Figure 13a. The deformation is mainly distributed in the right boundary of the landslide, the middle platform of the landslide and the collapse area of the landslide toe. The maximum displacement rate reaches 22.4 mm/year The descending identification result is shown in Figure 13b. The deformation is distributed in the middle platform of the landslide, and the maximum displacement rate reaches −59.2 mm/year. The difference in the incidence angle of the ascending and descending of the Sentinel-1A satellite leads to different visibility effects and recognition results. The results of Figure 13 illustrate the necessity of combined analysis of ascending and descending data in alpine and valley areas.
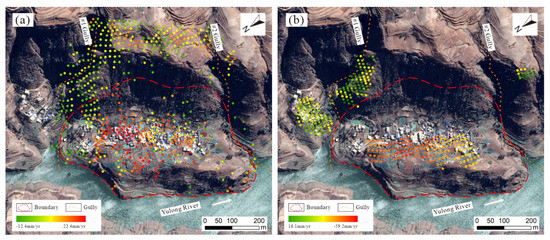
Figure 13.
SBAS-InSAR identification result of Hejiapingzi landslide: (a) ascending orbit, (b) descending orbit.
In October 2017, Hejiapingzi landslide monitoring was implemented. In June 2018, the total station was used to monitor the landslide deformation. A total of 12 measuring points were installed (Figure 14). According to the results of SBAS-InSAR identification, the monitoring data of T01, T04, T05, T07, T10 and T11 points were selected for verification. Figure 15 reveals the comparison results of cumulative displacement by total station and cumulative displacement by the ascending of SBAS-InSAR. Although the total station and SBAS-InSAR results are quite different in the value of the deformation, the landslide deformation trend is consistent. The difference in deformation value may be caused by the poor visibility of the Sentinel-1A satellite at the landslide. However, the consistency of the trend of landslide deformation reveals that InSAR technology is reliable as a basis for landslide identification. The cumulative deformations for total station monitoring for T01 and T04 were 335.7 mm and 332.3 mm, respectively, and the cumulative deformations identified by SBAS-InSAR were 40.6 mm and 39.5 mm, respectively, representing the maximum displacement area of the landslide during this time period (Figure 15a,b). This information reveals that the deformation on the right side of the landslide is more severe than that on the left side, which is also consistent with the interpretation results of SBAS-InSAR.
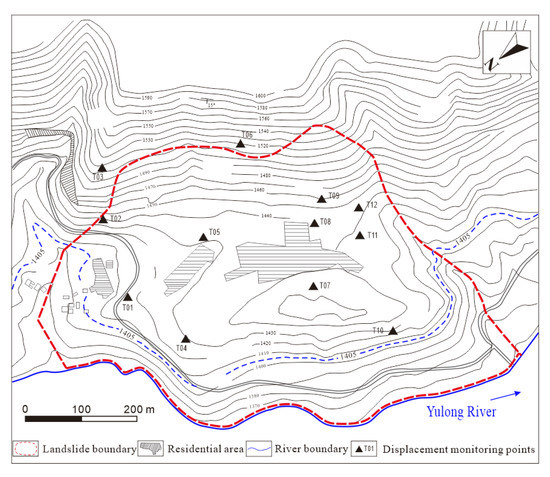
Figure 14.
Monitoring points installed in Hejiapingzi landslide.
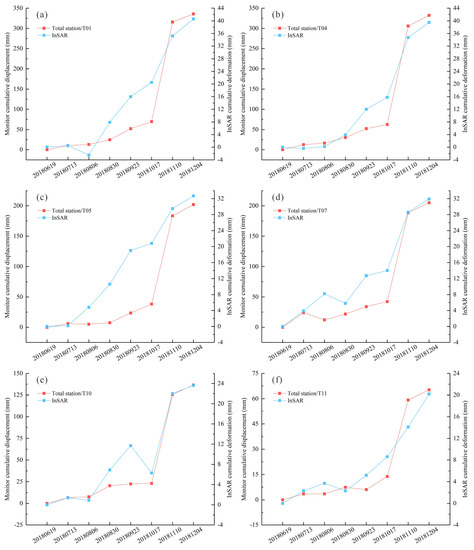
Figure 15.
Comparison of SBAS-InSAR and total station results of Hejiapingzi landslide: (a) T1, (b) T4, (c) T5, (d) T7, (e) T10, (f) T11.
5.3. Influencing Factors of Landslide Deformation
The relationship between the cumulative displacement of SBAS-InSAR from 2016 to 2019 and partial water level records of the Hejiapingzi landslide is shown in Figure 16. According to the analysis of reservoir impoundment and landslide occurrence time, the landslide deformation intensifies when the reservoir water level drops rapidly. This indicated that the landslide is mainly caused by the rise and fall of the reservoir water level [43,44]. The landslide seepage field was changed and the rock and soil were softened by the fluctuation of the reservoir water level. Li et al. analyzed the monitoring data and concluded that the sudden drop of reservoir water was the main reason for the deformation and instability of Hejiapingzi landslide [30,45].
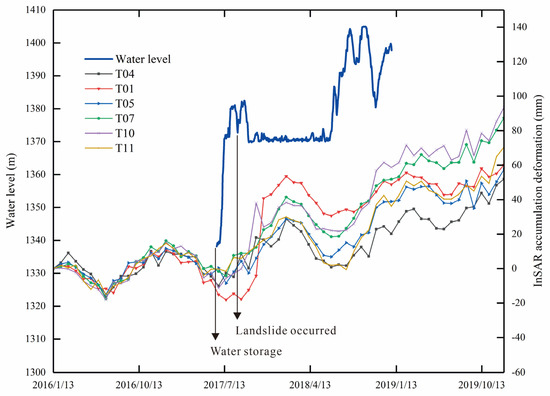
Figure 16.
The relationship between water level and cumulative deformation of SBAS-InSAR.
6. Discussion
6.1. Limitations of SBAS-InSAR Identification in Alpine and Canyon Areas
Both the quality of SBAS-InSAR deformation monitoring and the number of SBAS-InSAR identified feature points have terrain correlation. The feature points generated by SBAS-InSAR are limited due to terrain visibility, and the deformation accuracy of some areas does not match the actual monitoring. Figure 15 reveals that there is a large difference in deformation values between the total station monitoring and SBAS-InSAR results of the Hejiapingzi landslide. However, the InSAR technology can identify the trend of landslide deformation in the area. Therefore, considering the time and cost, this technology is suitable for alpine and canyon areas. In order to improve the identification accuracy, researchers mainly use the area with good visibility as the recognition area. Integrated use of Sentinel satellite ascending and descending data is indispensable in alpine and canyon regions to facilitate enhanced interpretation of the good visibility area. Despite this, there are still some areas that cannot be identified, and these areas are mainly steep, manifested as shadows and layovers.
SBAS-InSAR time series analysis is very suitable for slow-moving landslides, as delineate in Figure 16. It can be used to better describe the relationship between landslide deformation and reservoir water level. However, the timeliness may also affect the identification of landslides. If the landslide occurs at the end of the time period identified by SBAS-InSAR and shows a creeping characteristic, the InSAR technology may fail to identify it. In addition, it is difficult to identify sudden landslides in alpine and canyon areas using InSAR technology. This type of landslide may not produce large deformation or damage before sliding.
Investigators also need to consider that human engineering activities will lead to misjudgment of SBAS-InSAR identification results. If the identification time period is long, the surface transformation caused by engineering activities will inevitably be captured by Sentinel satellites. As depicted in Figure 9, the S9 indicates that surface disturbance caused by the construction of roads and bridges in the reservoir area leads to misjudgment of landslide identification.
6.2. Comprehensive Landslide Identification with Multi-Source Data in Alpine and Canyon Areas
Traditional landslide field survey is difficult to carry out in alpine and valley areas [7,23]. SBAS-InSAR and optical imaging have good landslide application scenarios in such areas, which can ensure high efficiency and low cost for landslide identification. However, a single identification method has limitations, such as the limitations of InSAR technology described in the previous section. Use of optical images for auxiliary identification is especially suitable for sudden landslides according to obvious sliding characteristics, which can overcome certain limitations of SBAS-InSAR. However, it is more difficult to identify creeping landslides due to little landslide deformation. Moreover, it is difficult to collect a complete time series of optical images. The deformation signs after landslides are easily covered by vegetation or changed by engineering activities, resulting in the omission of landslide identification. For small-scale landslides, SBAS-InSAR and optical image identification are difficult, and the accuracy cannot be guaranteed. This type of landslide requires field surveys to be accurately identified, and field surveys can also verify the results of SBAS-InSAR and optical image landslide identification results.
7. Conclusions
- (1)
- The study highlights that visibility analysis is necessary for landslide identification by the SBAS-InSAR technology in alpine and canyon regions. The proposed comprehensive landslide identification method combining SBAS-InSAR technology, optical images and field surveys proved valuable to the application of landslide identification in the alpine and canyon areas. Together, 13 landslides were identified by SBAS-InSAR, 8 by optical image and 7 by field survey. Multi-source data and multi-method joint identification can alleviate the defects of a single identification method to efficiently and quickly identify landslides with acceptable accuracy in the study area.
- (2)
- The comparison and verification of typical landslide monitoring data and SBAS-InSAR deformation manifested the high accuracy of SBAS-InSAR technology. Both monitoring methods showed a large deformation of the landslide from October 2018 to November 2018.
- (3)
- The research results indicate that construction and operation of reservoirs have a great impact on the development of landslides in the alpine and canyon area. In order to balance the development of landslides and the economic and environmental benefits of the reservoirs, it is necessary to pay attention to adjustments in the reservoir water level, especially the decline rate of reservoir water, which has a strong correlation with landslide stability.
Author Contributions
Conceptualization, S.Y. and D.L.; software, S.Y.; validation, Y.L.; investigation, Z.X.; resources, D.L.; writing—original draft preparation, S.Y.; writing—review and editing, D.L.; supervision, Y.S. and X.S.; funding acquisition, D.L. All authors have read and agreed to the published version of the manuscript.
Funding
This research was funded by the National Natural Science Foundation of China, grant number 41772310.
Institutional Review Board Statement
Not applicable.
Informed Consent Statement
Not applicable.
Data Availability Statement
Not applicable.
Conflicts of Interest
The authors declare no conflict of interest.
References
- Chen, X.; Zhou, Q.; Ran, H.; Dong, R. Earthquake-triggered landslides in southwest China. Nat. Hazards Earth Syst. Sci. 2012, 12, 351–363. [Google Scholar] [CrossRef]
- Zhang, L.; Dai, K.; Deng, J.; Ge, D.; Liang, R.; Li, W.; Xu, Q. Identifying Potential Landslides by Stacking-InSAR in Southwestern China and Its Performance Comparison with SBAS-InSAR. Remote Sens. 2021, 13, 3662. [Google Scholar] [CrossRef]
- Montgomery, D.R.; Brandon, M.T. Topographic Controls on Erosion Rates in Tectonically Active Mountain Ranges. Earth Planet. Sci. Lett. 2002, 201, 481–489. [Google Scholar] [CrossRef]
- Korup, O.; Densmore, A.L.; Schlunegger, F. The Role of Landslides in Mountain Range Evolution. Geomorphology 2010, 120, 77–90. [Google Scholar] [CrossRef]
- Ouimet, W.B.; Whipple, K.X.; Royden, L.H.; Sun, Z.; Chen, Z. The Influence of Large Landslides on River Incision in a Transient Landscape: Eastern Margin of the Tibetan Plateau (Sichuan, China). Geol. Soc. Am. Bull. 2007, 119, 1462–1476. [Google Scholar] [CrossRef]
- Cao, C.; Zhu, K.; Song, T.; Bai, J.; Zhang, W.; Chen, J.; Song, S. Comparative Study on Potential Landslide Identification with ALOS-2 and Sentinel-1A Data in Heavy Forest Reach, Upstream of the Jinsha River. Remote Sens. 2022, 14, 1962. [Google Scholar] [CrossRef]
- Manoutsoglou, E.; Lazos, I.; Steiakakis, E.; Vafeidis, A. The Geomorphological and Geological Structure of the Samaria Gorge, Crete, Greece—Geological Models Comprehensive Review and the Link with the Geomorphological Evolution. Appl. Sci. 2022, 12, 10670. [Google Scholar] [CrossRef]
- Morelli, D.; Locatelli, M.; Corradi, N.; Cianfarra, P.; Crispini, L.; Federico, L.; Migeon, S. Morpho-Structural Setting of the Ligurian Sea: The Role of Structural Heritage and Neotectonic Inversion. J. Mar. Sci. Eng. 2022, 10, 1176. [Google Scholar] [CrossRef]
- Guzzetti, F.; Mondini, A.C.; Cardinali, M.; Fiorucci, F.; Santangelo, M.; Chang, K.-T. Landslide Inventory Maps: New Tools for an Old Problem. Earth-Sci. Rev. 2012, 112, 42–66. [Google Scholar] [CrossRef]
- Lima, P.; Steger, S.; Glade, T. Counteracting flawed landslide data in statistically based landslide susceptibility modelling for very large areas: A national-scale assessment for Austria. Landslides 2021, 18, 3531–3546. [Google Scholar] [CrossRef]
- Miao, F.; Zhao, F.; Wu, Y.; Li, L.; Török, Á. Landslide Susceptibility Mapping in Three Gorges Reservoir Area Based on GIS and Boosting Decision Tree Model. Stoch. Environ. Res. Risk Assess. 2023, 1, 21. [Google Scholar] [CrossRef]
- Domakinis, C.; Oikonomidis, D.; Astaras, T. Landslide Mapping in the Coastal Area between the Strymonic Gulf and Kavala (Macedonia, Greece) with the Aid of Remote Sensing and Geographical Information Systems. Int. J. Remote Sens. 2008, 29, 6893–6915. [Google Scholar] [CrossRef]
- Cheng, G.; Guo, L.; Zhao, T.; Han, J.; Li, H.; Fang, J. Automatic Landslide Detection from Remote-Sensing Imagery Using a Scene Classification Method Based on BoVW and PLSA. Int. J. Remote Sens. 2013, 34, 45–59. [Google Scholar] [CrossRef]
- Fu, R.; He, J.; Liu, G.; Li, W.; Mao, J.; He, M.; Lin, Y. Fast Seismic Landslide Detection Based on Improved Mask R-CNN. Remote Sens. 2022, 14, 3928. [Google Scholar] [CrossRef]
- Deligiannakis, G.; Pallikarakis, A.; Papanikolaou, I.; Alexiou, S.; Reicherter, K. Detecting and Monitoring Early Post-Fire Sliding Phenomena Using UAV–SfM Photogrammetry and t-LiDAR-Derived Point Clouds. Fire 2021, 4, 87. [Google Scholar] [CrossRef]
- Dong, X.; Yin, T.; Dai, K.; Pirasteh, S.; Zhuo, G.; Li, Z.; Yu, B.; Xu, Q. Identifying Potential Landslides on Giant Niexia Slope (China) Based on Integrated Multi-Remote Sensing Technologies. Remote Sens. 2022, 14, 6328. [Google Scholar] [CrossRef]
- Pellicani, R.; Argentiero, I.; Manzari, P.; Spilotro, G.; Marzo, C.; Ermini, R.; Apollonio, C. UAV and Airborne LiDAR Data for Interpreting Kinematic Evolution of Landslide Movements: The Case Study of the Montescaglioso Landslide (Southern Italy). Geosciences 2019, 9, 248. [Google Scholar] [CrossRef]
- Su, X.; Zhang, Y.; Meng, X.; Rehman, M.U.; Khalid, Z.; Yue, D. Updating Inventory, Deformation, and Development Characteristics of Landslides in Hunza Valley, NW Karakoram, Pakistan by SBAS-InSAR. Remote Sens. 2022, 14, 4907. [Google Scholar] [CrossRef]
- Li, M.; Zhang, L.; Dong, J.; Tang, M.; Shi, X.; Liao, M.; Xu, Q. Characterization of Pre- and Post-Failure Displacements of the Huangnibazi Landslide in Li County with Multi-Source Satellite Observations. Eng. Geol. 2019, 257, 105140. [Google Scholar] [CrossRef]
- Rosi, A.; Tofani, V.; Tanteri, L.; Tacconi Stefanelli, C.; Agostini, A.; Catani, F.; Casagli, N. The new landslide inventory of Tuscany (Italy) updated with PS-InSAR: Geomorphological features and landslide distribution. Landslides 2018, 15, 5–19. [Google Scholar] [CrossRef]
- Hu, X.; Lu, Z.; Pierson, T.C.; Kramer, R.; George, D.L. Combining InSAR and GPS to Determine Transient Movement and Thickness of a Seasonally Active Low-Gradient Translational Landslide. Geophys. Res. Lett. 2018, 45, 1453–1462. [Google Scholar] [CrossRef]
- Lu, H.; Li, W.; Xu, Q.; Dong, X.; Dai, C.; Wang, D. Early Identification of Hidden Hazards in the Upstream and Downstream of the Baige Landslide on the Jinsha River Based on the Combination of Optical Remote Sensing and InSAR. Geomat. Inf. Sci. Wuhan Univ. 2019, 44, 1342–1354. [Google Scholar] [CrossRef]
- Li, Y.; Zuo, X.; Zhu, D.; Wu, W.; Yang, X.; Guo, S.; Shi, C.; Huang, C.; Li, F.; Liu, X. Identification and Analysis of Landslides in the Ahai Reservoir Area of the Jinsha River Basin Using a Combination of DS-InSAR, Optical Images, and Field Surveys. Remote Sens. 2022, 14, 6274. [Google Scholar] [CrossRef]
- Li, M.; Zhang, L.; Shi, X.; Liao, M.; Yang, M. Monitoring Active Motion of the Guobu Landslide near the Laxiwa Hydropower Station in China by Time-Series Point-like Targets Offset Tracking. Remote Sens. Environ. 2019, 221, 80–93. [Google Scholar] [CrossRef]
- Colesanti, C.; Wasowski, J. Investigating Landslides with Space-Borne Synthetic Aperture Radar (SAR) Interferometry. Eng. Geol. 2006, 88, 173–199. [Google Scholar] [CrossRef]
- Notti, D.; Herrera, G.; Bianchini, S.; Meisina, C.; García-Davalillo, J.C.; Zucca, F. A methodology for improving landslide PSI data analysis. Int. J. Remote Sens. 2014, 35, 2186–2214. [Google Scholar] [CrossRef]
- Cigna, F.; Bateson, L.B.; Jordan, C.J.; Dashwood, C. Simulating SAR Geometric Distortions and Predicting Persistent Scatterer Densities for ERS-1/2 and ENVISAT C-Band SAR and InSAR Applications: Nationwide Feasibility Assessment to Monitor the Landmass of Great Britain with SAR Imagery. Remote Sens. Environ. 2014, 152, 441–466. [Google Scholar] [CrossRef]
- Dai, K.; Zhang, L.; Song, C.; Li, Z.; Zhuo, G.; Xu, Q. Quantitative Analysis of Sentinel-1 Imagery Geometric Distortion and Their Suitability Along Sichuan-Tibet Railway. Geomat. Inf. Sci. Wuhan Univ. 2021, 46, 1450–1460. [Google Scholar] [CrossRef]
- Zhang, R.; Wu, B. Environmental Impacts of High Water Turbidity of the Niulan River to Dianchi Lake Water Diversion Project. J. Environ. Eng. 2020, 146, 05019006. [Google Scholar] [CrossRef]
- Li, D.; Yan, L.; Wu, L.; Yin, K.; Leo, C. The Hejiapingzi landslide in Weining County, Guizhou Province, Southwest China: A recent slow-moving landslide triggered by reservoir drawdown. Landslides 2019, 16, 1353–1365. [Google Scholar] [CrossRef]
- Corominas, J.; van Westen, C.; Frattini, P.; Cascini, L.; Malet, J.P.; Fotopoulou, S.; Catani, F.; Van Den Eeckhaut, M.; Mavrouli, O.; Agliardi, F.; et al. Recommendations for the quantitative analysis of landslide risk. Bull. Eng. Geol. Environ. 2013, 73, 209–263. [Google Scholar] [CrossRef]
- Steger, S.; Brenning, A.; Bell, R.; Glade, T. The Propagation of Inventory-Based Positional Errors into Statistical Landslide Susceptibility Models. Nat. Hazards Earth Syst. Sci. 2016, 16, 2729–2745. [Google Scholar] [CrossRef]
- Fabbri, A.G.; Chung, C.J.F.; Cendrero, A.; Remondo, J. Is Prediction of Future Landslides Possible with a GIS? Nat. Hazards 2003, 30, 487–503. [Google Scholar] [CrossRef]
- Van Westen, C.J.; Castellanos, E.; Kuriakose, S.L. Spatial Data for Landslide Susceptibility, Hazard, and Vulnerability Assessment: An Overview. Eng. Geol. 2008, 102, 112–131. [Google Scholar] [CrossRef]
- Budimir, M.E.A.; Atkinson, P.M.; Lewis, H.G. A systematic review of landslide probability mapping using logistic regression. Landslides 2015, 12, 419–436. [Google Scholar] [CrossRef]
- Hooper, A.; Bekaert, D.; Spaans, K.; Arıkan, M. Recent Advances in SAR Interferometry Time Series Analysis for Measuring Crustal Deformation. Tectonophysics 2012, 514–517, 1–13. [Google Scholar] [CrossRef]
- Yao, J.; Yao, X.; Liu, X. Landslide Detection and Mapping Based on SBAS-InSAR and PS-InSAR: A Case Study in Gongjue County, Tibet, China. Remote Sens. 2022, 14, 4728. [Google Scholar] [CrossRef]
- Dun, J.; Feng, W.; Yi, X.; Zhang, G.; Wu, M. Detection and Mapping of Active landslides before Impoundment in the Baihetan Reservoir Area (China) based on the Time-Series InSAR method. Remote Sens. 2021, 13, 3213. [Google Scholar] [CrossRef]
- Tizzani, P.; Berardino, P.; Casu, F.; Euillades, P.; Manzo, M.; Ricciardi, G.; Zeni, G.; Lanari, R. Surface deformation of Long Valley caldera and Mono Basin, California, investigated with the SBAS-InSAR approach. Remote Sens. Environ. 2007, 108, 277–289. [Google Scholar] [CrossRef]
- Dong, S.; Samsonov, S.; Yin, H.; Ye, S.; Cao, Y. Time-series analysis of subsidence associated with rapid urbanization in Shanghai, China measured with SBAS InSAR method. Environ. Earth Sci. 2013, 72, 677–691. [Google Scholar] [CrossRef]
- Li, Z.; Ding, X.; Huang, C.; Zhu, J.; Chen, Y. Improved filtering parameter determination for the Goldstein radar interferogram filter. ISPRS J. Photogramm. Remote Sens. 2008, 63, 621–634. [Google Scholar] [CrossRef]
- Davis, J.; Herring, T.; Shapiro, I.; Rogers, A.E.; Elgered, G. Geodesy by radio interferometry: Effects of atmospheric modeling errors on estimates of baseline length. Radio Sci. 1985, 20, 1593–1607. [Google Scholar] [CrossRef]
- Miao, F.; Wu, Y.; Xie, Y.; Li, Y. Prediction of Landslide Displacement with Step-like Behavior Based on Multialgorithm Optimization and a Support Vector Regression Model. Landslides 2018, 15, 475–488. [Google Scholar] [CrossRef]
- Miao, F.; Zhao, F.; Wu, Y.; Li, L.; Xue, Y.; Meng, J. A Novel Seepage Device and Ring-Shear Test on Slip Zone Soils of Landslide in the Three Gorges Reservoir Area. Eng. Geol. 2022, 307, 106779. [Google Scholar] [CrossRef]
- Miao, F.; Wu, Y.; Török, Á.; Li, L.; Xue, Y. Centrifugal model test on a riverine landslide in the Three Gorges Reservoir induced by rainfall and water level fluctuation. Geosci. Front. 2022, 13, 101378. [Google Scholar] [CrossRef]
Disclaimer/Publisher’s Note: The statements, opinions and data contained in all publications are solely those of the individual author(s) and contributor(s) and not of MDPI and/or the editor(s). MDPI and/or the editor(s) disclaim responsibility for any injury to people or property resulting from any ideas, methods, instructions or products referred to in the content. |
© 2023 by the authors. Licensee MDPI, Basel, Switzerland. This article is an open access article distributed under the terms and conditions of the Creative Commons Attribution (CC BY) license (https://creativecommons.org/licenses/by/4.0/).