Abstract
Marine controlled-source electromagnetics (MCSEM) is an effective method to map the spatial distribution of gas hydrate and calculate gas hydrate saturation. An MCSEM survey is conducted in the Lingnan low uplift (LNLU), Qiongdongnan Basin (QDNB), South China Sea (SCS), and then the measured data are processed to obtain the geoelectric structure. The estimated gas hydrate stability zone (GHSZ) ranges from 0 to 320 mbsf, and shallow high-conductive sediments serving as gas hydrate caps are at depths ranging from 0 to 100 mbsf (meters below the seafloor). The 2D resistivity model reveals multiple high-resistivity bodies at depths ranging from 100 to 320 mbsf, and BSRs are at depths of 240 mbsf to 280 mbsf, indicating a transversely uneven gas hydrate reservoir in the study area. Moreover, two high-resistivity bodies are detected beneath the GHSZ, implying the presence of potential gas transport pathways. The gas hydrate saturation with a variation of 0–68.4% is calculated using the MCSEM resistivity and Archie’s law. According to the resistivity model and geological data, the transversely uneven gas hydrate reservoir may be associated with multiple gas sources, including shallow biogenic gas and deep pyrolytic gas. The shallow biogenic gas is transported to the GHSZ via short-distance migration and free diffusion, and the deep pyrolytic gas is transported to the GHSZ via two microcracks. In addition, this case emphasizes that the dynamic accumulation of gas hydrate is an important factor causing reservoir heterogeneity.
1. Introduction
Gas hydrate is a crystalline material with a cage structure that is generated by gas and water molecules under low-temperature and high-pressure conditions, and it is extensively distributed in marine sediments and permafrost areas [1]. The current research on subsea gas hydrate focuses on its energy resource potential due to the fossil energy shortage and environmental protection, and its characteristics of high energy density, large reserves, and burning heat make it a research topic of great interest for renewable energy. Previous geological and geophysical surveys have revealed that the Qiongdongnan Basin (QDNB) is rich in conventional gas and gas hydrate [2,3]. For example, several geological and geophysical characteristics related to gas hydrate have been reported, such as gas composition [3,4], gas hydrate stable zone (GHSZ) [5], bottom simulating reflector (BSR) and double BSRs [6,7], mud diapirs and gas chimneys [8,9], active cold springs [10,11], Quaternary deep water sedimentary facies [12], and gas hydrate migration and the gas hydrate accumulation system [9,13,14,15,16]. Most of the drilling data from the QDNB show strong methane gas anomalies in the strata above 2300 m, and an analysis confirmed that the majority of the gas samples were bio-methane. Meanwhile, heavy hydrocarbon gas was identified primarily beneath 2300 m [2]. Previous seismic reflection data and drilling data suggest that the southern uplift belt of the QDNB has developed polygonal faults, mud diapirs, and gas chimneys [7,9,11,16]. These factors provide significant pathways for the upward migration of deep gas, and deep overpressure was the key driving force for the gas’s vertical and lateral migration [17]. Although the geological and geophysical elements mentioned above show that the QDNB has great potential for gas hydrate resources, gas hydrate exploration is still in its early stages. Previous studies on gas migration pathways were restricted to the description of reflection characteristics [6,7,9,11,16], but seismic BSR is commonly parallel to the strata and has no discernible angle due to the flat topography of the study region, making it challenging to identify a gas hydrate reservoir with BSR [18]. Moreover, seismic BSR provides information on the bottom boundary of the gas hydrate but with no information on the upper extent [19].
Geophysical methods are commonly utilized to identify and evaluate potential resource of subsea gas hydrate, and its resistive property is mostly exploited in logging measurements [20]. Marine electromagnetic data offer a means to quantify the bulk resistivity of marine sediments, and they are sensitive to the presence and quantity of gas hydrate and gas [21]. Therefore, electromagnetic surveys are complementary to seismic methods at various levels, and the combination of seismic and MCSEM data better quantifies the spatial distribution of gas hydrate and free gas and improves the understanding of the mechanism of accumulation [22,23]. MCSEM surveys have been widely used to map the spatial distribution of gas hydrate and to estimate gas hydrate saturation in areas such as offshore Oregon [24], Hydrate Ridge, Oregon [25]; San Diego Trough [26]; Japan Sea [27]; South China Sea (Shenhu Sea, SW Taiwan, and QDNB) [28,29,30]; Vestnesa Ridge and west Svalbard continental slope [31,32,33]; offshore Norway [34,35]; Walker Ridge 313, Gulf of Mexico [19]; New Zealand [23]; Black Sea [36]; Pelotas Basin, offshore Brazil [37]; California Borderlands [38]; Scanner Pockmark, North Sea [39]. For example, the towed CSEM system has been used to reveal the lateral resistivity change and gas hydrate concentration in Hydrate Ridge, Oregon [25], providing guidance for gas hydrate development. Primary research has proved that MCSEM techniques provide practical and independent measures for identifying and quantifying gas hydrate.
The gas hydrate saturation of the Lingnan Low Uplift (LNLU) is unknown, and the impact of different migration pathways on the dynamic processes of gas migration and hydrate enrichment has not been considered. Therefore, an MCSEM survey was conducted to better understand the potential gas hydrate in the LNLU. We refined the MCSEM data, mapped a 2D resistivity section, and then estimated the gas hydrate saturation with resistivity and Archie’s law. Finally, integrating the geophysical data, geological information, and GHSZ, we analyzed the gas hydrate distribution, uneven gas hydrate reservoir, gas migration, and mechanisms of accumulation.
2. Geological and Geophysical Background
The QDNB, with a total area of approximately 8.3 × 10⁴ km2 and water depths ranging from 300 to 3300 m, is surrounded by the Yinggehai Basin (YGHB) in the west, the Hainan Uplift in the north, the Pearl River Mouth Basin (PRMB) in the east, and the Xisha Uplift in the south (Figure 1a) [2,9]. It originated on the Caledonian and Yanshanian folded basement and belongs to the Cenozoic petroliferous basin. The QDNB underwent three tectonic evolutionary stages in the Cenozoic, including an Eocene rifting stage, an early–middle Miocene thermal subsidence stage, and an early–late Miocene rapid subsidence stage, and it mainly deposited the Paleogene, Neogene, and Quaternary strata [40,41]. It was further divided into the northern depression belt, the northern uplift belt, the central depression belt, the southern uplift belt, and the southern depression belt in the rifting stage (Figure 1b), and concave and convex interlaced structures were formed [41]. The Eocene and Oligocene strata are predominated by the Yacheng and Lingshui formations, which are also important hydrocarbon source rocks and reservoir-cap assemblages [17,40].
The Sanya, Meishan, Huangliu, Yinggehai, and Ledong formations were rapidly deposited in the QDNB during the thermal subsidence stage and rapid subsidence stage, and the rapid deposition resulted in widespread, thick, overpressured, and sedimentary sequences [40,42]. Moreover, the Pliocene and Quaternary strata are rich in organic matter and instrumental in forming biogas, and the Oligocene source rocks are rich in organic matter and conducive to the formation of thermogenic gas [2,17]. In addition, previous seismic studies have revealed polygonal faults, mud diapirs, and gas chimneys associated with gas migration pathways in Pliocene and younger strata [7,9], and mud diapir structures and fault systems mainly controlled fluid migration. The QDNB’s characteristics of high terrestrial heat flow, high deposition ratio, and high geothermal gradient make it a fine location for gas hydrate exploration [43,44].

Figure 1.
The location and strata of the QDNB: (a) Geographical location of the QDNB; (b) Tectonic units of the QDNB (modified from Reference [9]); (c) Location of MCSEM receivers; (d) Stratigraphic column of the QDNB (modified from References [42,45]). The solid, blue lines (SP1 and SP2) are seismic lines (modified from Reference [46]). YGHB: Yinggehai Basin; QDNB: Qiongdongnan Basin; PRMB: Pearl River Mouth Basin; RRF: Red River Fault.

The LNLU is situated in the deep water of the northwestern QDNB, close to the Ledong sag and the Central Valley (Figure 1b), and its basement is composed of early Cenozoic igneous rocks [47]. The Yacheng and Lingshui formations are composed of mudstone and sandstone interbeds with little pyroclastic rock, while the Miocene Sanya, Meishan, Huangliu, and Pliocene Yinggehai formations are thick mudstone and small pelitic siltstone based on the LS33A (Figure 1d) and GMGS6 (the sixth gas hydrate drilling expedition) drilling data near the MCSEM study area [12,45]. The Quaternary Ledong Formation is primarily composed of clay, mixed with thin layers of silty sand and fine sand, rich in bioclastics, and not diagenetic. Moreover, the Quaternary strata are also where the majority of the hydrate reservoir is found. According to the GMGS6 drilling, gas hydrate with diverse shapes were obtained in the GMGS6 sampling (fracture-filling gas hydrate in veins, massive and nodular occurrences, and pore-filling gas hydrate in disseminated occurrences) (Figure 2A–D) [12]. Moreover, the Quaternary strata are mainly composed of muds, mudstone, silts, fine sands, and tiny autogenous carbonates (Figure 2A1–F1) [12].
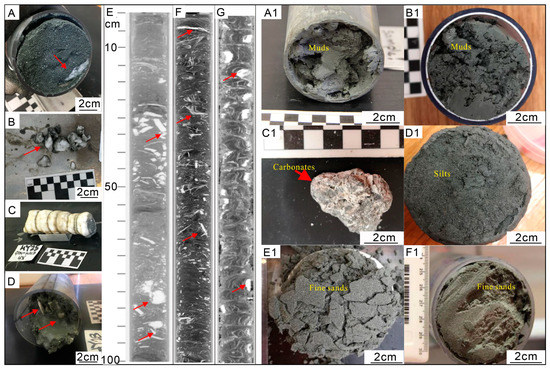
Figure 2.
Shapes of the visible gas hydrate and the lithology of the Quaternary strata: (A–D) Gas hydrate with diverse shapes; (E–G) X-ray images of gas hydrate; (A1–F1) Lithology of the Quaternary strata (modified from Reference [12]). The red arrows in the subfigures (A–G) indicate the presence of gas hydrate with diverse shapes.
The seismic profiles (Figure 3) passing through the interior of the Lingnan low uplift are used to define the pathway models of gas migration representing the fault structure and the faults and structure system [46]. The BSR above the fault shows high reflection amplitude and continuity, indicating the presence of hydrate (Figure 3). Due to the massive accumulation of free gas and the deposition of MTDs (mass transported deposits), many bright spots with strong reflections were discovered at the tops of the faults. The gas migration path corresponds to the bright spots in the SP1 seismic profile (Figure 3a), indicating that fault structures are also important gas migration pathways, and deep faults control the distribution of shallow bright spots. The deep faults cutting into mature source rocks are conducive to the transport of oil and gas towards shallow reservoirs during geological events. The drilling results for Well B indicate that no hydrate has been encountered, presumably due to the fact of less developed faults at the drilling location, making it more difficult for gas to migrate to the GHSZ. Figure 3b shows another gas migration pathway–fractures. Many basement faults terminate below the T60 and migrate gas and oil to intermediate and shallow layers. The fracture system above the T40 is generally considered a relay path for the continued upward migration to the GHSZ and the formation of gas hydrates [46].
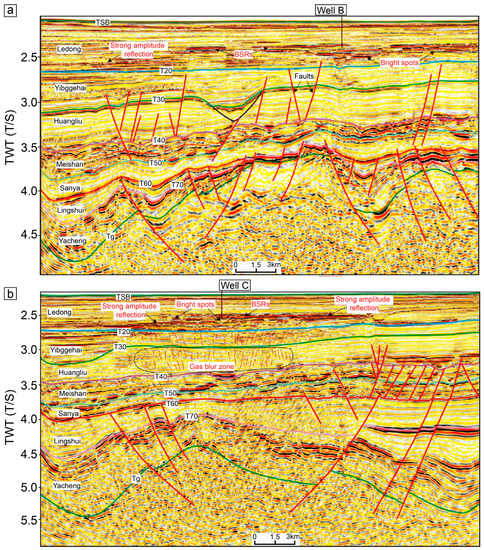
Figure 3.
Seismic profiles of (a) SP1 and (b) SP2 in the QDNB (modified from Reference [46]).
3. Data collection, Processing, and Inversion
3.1. Data Collection and Processing
The resistivity of water-saturated sediments is approximately 1 Ω·m, but filling with oil or gas can significantly increase the resistivity up to 100 Ω·m or more [48]. An MCSEM survey detects seabed targets, such as offshore oil–gas resources and gas hydrate, based on the resistivity difference between the target reservoir and the surrounding rock. MCSEM exploration is very similar to that on land, except that electric and magnetic field recordings must be performed independently using data logger/sensor systems deployed on the seabed [49]. The frequency domain MCSEM method uses a horizontal electric dip-source excited electromagnetic field towed near the sea floor, and the artificial source electromagnetic field is measured by a receiver placed on the sea floor (Figure 4a) [21]. The amplitude and phase of electromagnetic fields are measured as a function of the source–receiver offset, usually only horizontal electric fields but perhaps also the vertical electric field and various magnetic fields [48]. Here is where an MCSEM survey looks very different from a land CSEM sounding.
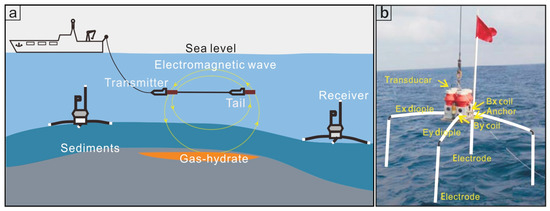
Figure 4.
(a) Schematic diagram of the electromagnetic technological principles and detection devices for the MCSEM method; (b) Electromagnetic receiver (modified from Reference [50]).
The frequency-domain MCSEM system is used to collect electric field and current data. These exploration instruments used in this survey, including a transmitter and ten marine electromagnetic receivers, were designed and manufactured by the Key Laboratory of Geo-Detection of the Ministry of Education at the China University of Geosciences (Beijing) [50,51]. The towed MCSEM transmitter consisted of a deep-tow cable, an underwater launching unit, and a horizontal electric dipole (Figure 4a). A towed cable, which had a total length of 10,000 m, was used to transport electric energy to electric dipoles and transmit data information, such as the supply voltage, transmitting current, and transmitting frequency, to the deck unit. The deck unit was used to pressurize the voltage from 380 to 2800 VAC and control the frequency and time of the signal [51]. The horizontal electric dipole of the emission source was designed with an electrical dipole distance of 130 m and can excite bipolar square wave signals up to 250 A with selectable frequencies [51].
The receiver system was similar to that of the American Scripps Institute of Oceanography [49], and two types of MCSEM receiver instruments [50] were used to collect data. Ag-AgCl electrodes with a 12 m electrode distance were used to collect the electric field data at sites R1, R3-R4, and R10 [50]. The data at sites R2 and R5–R9 were collected by an alternative instrument, which had two additional horizontal and orthogonal induction coils, a vertical 2 m dipole, and Ag-AgCl electrodes (Figure 4b) [50]. The electromagnetic receivers were spaced 0.5 km apart, and the MCSEM profile was stretched over a span of 4.5 km (Figure 1c). Meanwhile, the MCSEM receivers’ relative positions were determined using multipoint acoustic pitch technology, and their geographic coordinates were derived by referencing the GPS coordinates of the survey ship.
In MCSEM investigations, the Earth’s reaction to the induced currents caused by an electromagnetic source can be represented by a transfer function, and it changes due to the fact of changes in the electromagnetic source–receiver offset, conductivity, and other geometric factors [52]. Weitemeyer et al. [53] introduced a data processing method based on the fast Fourier transform (FFT), and the amplitude and phase of the electric field data were produced after processing using this method. The Fourier coefficients were computed by applying the FFT to the electromagnetic field time series to obtain the amplitude and phase. To remove the impact of the transmitter’s electric couple moment change, the current data were processed in the same manner. Then, the amplitude and phase of the electric field were further normalized. That is, the electromagnetic data complex spectrum was divided by the current spectral and transmitting antenna to obtain the electromagnetic response transfer functions (TFs) [29].
The Pmax parameters, which represent the major axis magnitudes of the polarization ellipse, were also analyzed. Compared to the in-line electric field amplitude, the Pmax components are of higher quality and impacted less by random noise, launch orientation, and uncertainty of the geometric position [24,29]. The R3 receiver contained much noise, which reduced the quality of the electric field data and, therefore, data from site R3 were excluded.
3.2. Two-Dimensional Inversion
To obtain the geoelectrical structure, we conducted 2D Occam’s inversion [54] using the MARE2DEM code [55]. MARE2DEM is a parallel adaptive finite element algorithm for 2D forward and inversion of electromagnetic data, such as MCSEM data, AMT data, and MT data [55]. Two-dimensional inversion of the 8 Hz Pmax electric field data was conducted using the MARE2DEM program. The air layer was assigned a thickness of 100 km and an invariant resistivity of 1012 Ω·m. The seawater depths were evaluated from the center altitude and the depth of the transmitter antenna. To achieve the best resolution of the seabed resistivity, the seawater resistivity profile with a resistivity of 0.3 Ω·m was included as a fixed structure in the inversion. The core region (horizontal direction: −1000–5500 m; vertical direction: 0–1000 mbsf, as shown in Figure 5) of the seabed was assigned an initial resistivity of 1 Ω·m, and the outer region with a constant water depth was extended out approximately 10 km on either end of the profile. Due to the small topographic relief in the study area, the triangular meshes could well adapt to the terrain changes. The other regions filled with triangles increasingly grew to reflect the decrease in the resolution with the distance from the transmitters and receivers. In total, the model consisted of 11,447 free parameters.
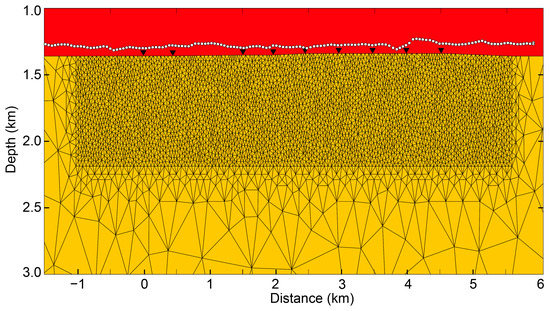
Figure 5.
Closeup view of the core region below the receivers (black triangles). The seawater layers with a constant resistivity of 0.3 Ω·m were fixed in the model, and the seabed was assigned an initial resistivity of 1 Ω·m. The white circles are the towed transmitters profile.
The observed 8 Hz electric field Pmax data were subject to 2D isotropic inversion by assigning an error floor of 5% of the maximum datum amplitude. The RMS fitting difference and model roughness were stable after the 22nd iteration, indicating that the inversion process was convergent, and the final rms was 1.78. Although R3 site failed to capture electromagnetic field data, data redundancy (following the principle of reciprocity) suggested that the R3 recovery failure had no impact on the last inversion result [29]. Figure 6a shows the amplitude data of the 8 Hz Pmax electric field data (dots) and fitted curves of the 22nd iteration, and the normalized residuals are shown in Figure 6b. As observed, the model response was well fitted to the measured data after the 22nd iteration. Therefore, the resistivity model (Figure 7a) of the final iteration was trustworthy and selected as the actual geoelectric structure.
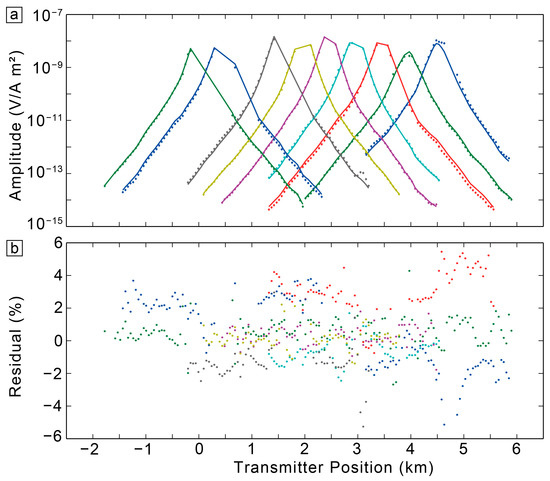
Figure 6.
Fitting results and corresponding normalized residuals: (a) Fitting results of the 8 Hz Pmax electric field amplitude data (dots) and the model response curves (solid line); (b) Normalized residual distribution.
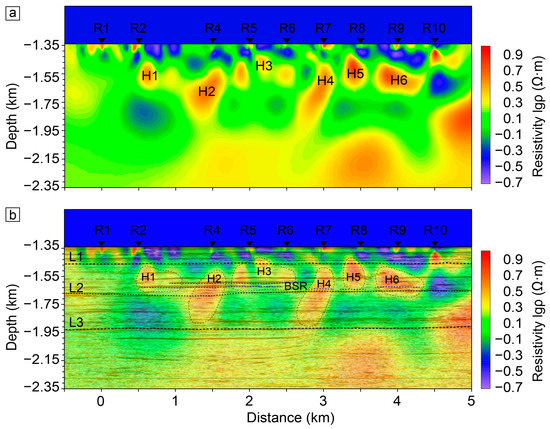
Figure 7.
(a) The resistivity model was obtained from the 2D inversion of 8 Hz Pmax data; (b) The MCSEM result in (a) is overlapped by the seismic profile. The black, dashed lines are the resistivity interfaces, and the blue, dashed lines are the deduced BSR of the seismic data.
4. Electrical Structure and Interpretation
Resistivity is an essential indicator for determining gas hydrate. Previous studies have demonstrated that gas hydrate and free gas have a much higher resistivity than marine sediments [20]. Therefore, these detected high resistivity anomalies (Figure 7a) are mostly electrical reflections of gas hydrate or gas. The combination of seismic data and resistivity has proven useful in identifying and evaluating subsea gas hydrate reservoirs [23,32]. Consequently, the published 2D seismic data [12,29,46,56] were collected to enhance the electrical interpretation. In Figure 7b, the MCSEM resistivity profile with the corresponding seismic profile are overlapped. As illustrated in Figure 7b, the resistivity exhibits a conductive basin under sites 1–10 that increases in resistivity with the depth, most likely due to the compaction-induced decrease in porosity. In shallow areas, high-porosity sediments with a resistivity varying from 0.3 to 2 Ω·m were discovered at depths ranging from 0 to 100 mbsf (meters below the seafloor), which are the caps of the gas hydrate reservoir. According to adjacent drilling data [12,46], the strata are composed of multiple materials, such as mud, sand, and salt-bearing fluids. Furthermore, the presence of tiny shallow high-resistivity bodies indicates that they may be associated with small amounts of gas hydrate or leakage gas.
This resistivity model also shows transverse resistivity anomalies at depths ranging from 100 to 320 mbsf, as well as several irregular high-resistivity bodies (H1, H2, H3, H4, H5, and H6) with a resistivity ranging from 2 to 10 Ω·m, which are associated with gas hydrate and leakage gas. According to the drilling results, gas-hydrate-bearing layers with a maximum value of 5.9 Ω·m were recognized in adjacent well A [46]. However, no hydrate layers were drilled in well B and well C, and the change in the resistivity curve was not significant, with a mean value of 1.5 Ω·m and 1.2 Ω·m, respectively [46]. The corresponding resistivity characteristics are consistent with the resistivity of the target body detected this time. Moreover, clear seismic reflection events, with a polarity reversal compared to the seabed, mostly exhibited medium–strong amplitude and good continuity (Figure 7b), which occurred in the study area at a depth of 240 and 280 mbsf, respectively, were deemed BSRs [12,29]. The bottom of the GHSZ is 320 mbsf for biogenic gas and 272 mbsf for thermogenic gas, with an average geothermal gradient of 40 °C/km [29]. Consequently, these high-resistivity bodies in the GHSZ are deemed hydrate-bearing zones, and the high-resolution electromagnetic imaging suggests that the distribution of the gas hydrate reservoir in the QDNB is transversely uneven. Moreover, a similar transversely uneven resistivity structure for gas hydrate reservoirs has also been reported in Hydrate Ridge of the Cascadia subduction zone [25].
The formation resistivity varies from 1 to 2 Ω·m at depths ranging from 320 to 600 mbsf, and the resistivity map also reveals two high-resistivity blocks (H2 and H4) with a resistivity varying from 2 to 5 Ω·m beneath the GHSZ. The seismic data also show two micro-vertical pipes and blank zones with reduced amplitude. These high-resistivity anomalies seem to be separate from each other, which was also identified in the seismic data from the same location. These two high-resistivity blocks connecting the upper high-resistivity gas hydrate to the lower high-resistivity strata may be associated with gas-bearing zones, such as gas channels, mud diapirs, or faults. Although, the seismic data do not show large gas chimneys and faults in the study area, many microcracks may develop in the upper strata due to the deep overpressure events (Figure 3b and Figure 7b). The microcracks showed high resistivity in the MCSEM investigation due to the gas accumulation and upwelling. Therefore, these two high-resistivity bodies are inferred to be faults or microcracks containing gas. Fractures and microcracks not only constitute the main channel for energy release in overpressure systems but also form vertical fluid migration pathways, which have been proposed as effective pathways for the migration of gas and petroleum fluids in the QDNB [43,55]. These two high-resistivity zones may be microcracks, indicating potential gas migration pathways in the study area. The formation–resistivity rises to 10 Ω·m in the lower strata, and seismic fuzzy reflection was detected [29], implying that free gas may exist in the lower strata. Therefore, the high-resistivity basement is suggested to be a free gas reservoir.
According to the resistivity, seismic data, and thermodynamic calculation of the GHSZ, the strata in the study area are classified as follows: The first high-conductive layer (L1; 0–100 mbsf) is the Quaternary sedimentary cap rock of the gas hydrate reservoir. The next stratum (L2; 100–320 mbsf) containing multiple high-resistivity blocks is served as the GHSZ, and multiple gas-hydrate-bearing blocks were discovered. Two high-resistivity bodies were detected in the third layer (L3; 320–600 mbsf) beneath the GHSZ, indicating potential gas migration pathways. Moreover, it is hypothesized that the bottom stratum with high resistivity and fuzzy reflection is a free gas reservoir.
5. Gas Hydrate Saturation
One objective of assessing gas hydrate resources is to estimate the free gas and gas hydrate saturation, and the chloride of the pore water, resistivity, and seismic data are primarily utilized [20,57,58]. The physical characteristics of gas-hydrate-containing sediments are a high P-wave velocity and impedance, high resistivity, and slight density anomalies [57]. However, increases in resistivity are most easily recognized in the physical properties of gas-hydrate-containing sediments [20,59]. Here, saturation estimates of large sediment volumes in the order of tens to hundreds of meters covered by the MCSEM data were calculated using Archie’s law.
Archie’s law implies reservoir resistivity as a function of the pore water resistivity and porosity [60], and it has been widely used to derive the gas hydrate/free gas saturation from borehole resistivity [20], as well as from the MCSEM resistivity [19,24,25,60]. Archie’s Law is defined as Equation (1).
where Rw is the pore-fluid resistivity; Rt is the formation resistivity of sediment containing free gas or gas hydrate (obtained from 2D inversion); φ is the sediment porosity; α is the Archie coefficient; m is the cementation factor; n is the saturation exponent; and Sw is the pore-fluid saturation.
Assuming that gas hydrate is nonconductive, the porosity (φ) for a two-phase porous system of sediment grains and pore fluids can be calculated by the transformed Archie’s empirical law (Equation (2)) [23].
where R0 is the formation resistivity of hydrate-free or gas-free sediments (background resistivity) [23]. φ primarily indicates the volume percentage of the conductive fluid in the formation, and it will decrease due to the fact of the formation containing gas hydrate or gas.
In this study, the lithology of the sediment was assumed not to change between gas hydrate and gas-free sediment parts, primarily due to the listed reasons: (1) since the late Mesozoic, the QDNB has experienced stable deep sea and semi-deep depositions, and the strata were uniformly deposited; (2) the terrain of the study area is flat; and (3) the LS33A drilling shows that Quaternary sediments are located at depths of 0–2200 m [45]; therefore, the strata at the target depth (0–1000 mbsf) are primarily composed of uniform Quaternary sediments. On this basis, the gas hydrate saturation (Sh) is simplified to Equation (3). In this case, the estimation of the saturation using Equation (3) does not require Archie’s empirical parameters of cementation factors and sediment porosity but only requires that these parameters do not change in the presence of free gas or hydrate.
Archie’s parameters are usually derived from logging and core data [20], but due to the lack of logging data, the parameter saturation index is not applicable in the MCSEM survey region. To obtain a suitable parameter of the saturation index in the LNLU of the QDNB, we looked for the range of the Archie’s parameters reported in other gas hydrate drilling sites of the SCS, such as Shenhu Sea (sites SH2, W11-17, SHSC-4J1, and GMGS2) [59,61,62], southwestern Taiwan [28], Pearl River Mouth Basin [30], and QDN-W09-2018 [63]. As Table 1 shows, the saturation index (n) is 2.00 in the QDNB and close to 2.00 in adjacent areas. Therefore, n = 2.00 was set to estimate the gas hydrate and gas saturation.

Table 1.
Archie’s empirical saturation index in the SCS.
To determine the resistivity (R0) of each layer, an enhanced C-means clustering technique (FCM) [64] was used. The basic principle is that the similarity among different classes is minimized by optimizing each sample point’s membership degree to various class centers, while the similarity among the same classes is maximized to determine the class of each sample point [64]. As Figure 8a shows, the FCM clustering algorithm was utilized to divide the MCSEM resistivity into two categories based on the similarity and difference among the data, including the formation resistivity of hydrate-free or gas-free sediments (R0) and the formation resistivity of sediment containing free gas or gas hydrate (Rt). The resistivity of R0 (Figure 8b) mostly depends on the porosity changes in pore water saturated sediments. The R0 estimated by the FCM clustering algorithm is low in the near seabed due to the shallow resistivity being easily affected by the seawater resistivity, and R0 in the GHSZ is high due to the impact of high-resistivity gas hydrate. Given that the strata in the QDNB are uniformly deposited, the R0 line, which represents the resistivity of pore water saturated sediments that increases linearly with an increase in depth, was fitted using the R0 data. As Figure 8b shows, far from gas-hydrate-bearing zones, the fitted resistivity of the R0 line shows a background resistivity of between 1 and 2 Ω·m. The formation resistivity of adjacent Well B and Well C (Figure 1b) does not vary significantly in pore water saturated sediments, with average values of 1.5 Ω· m and 1.2 Ω·m, respectively [46], which is consistent with the MSCEM resistivity values. Taking the MCSEM resistivity as Rt, the resistivity of the water-saturated sediments (R0) and the R0 line was used in Equation (3) to calculate the gas hydrate saturation.
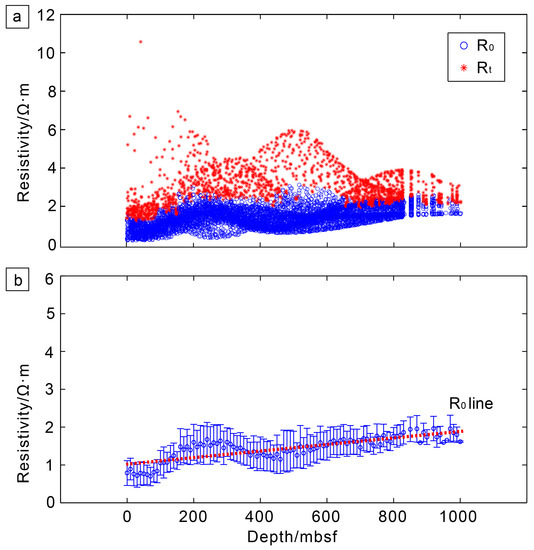
Figure 8.
The resistivity of water-saturated sediments (R0). (a) The resistivity was divided into two categories based on the similarities and differences among the data. (b) The linear formation resistivity of the pore water saturated sediments (R0 line).
Figure 9 depicts the gas hydrate and gas saturation estimated by the MCSEM resistivity and Archie’s law. The gas hydrate saturation of the GHSZ calculated using R0 varies from 0 to 72.8% (Figure 9a), and the gas hydrate saturation calculated using the R0 line varies from 0 to 68.4% (Figure 9b) in the GHSZ. Given the impact of the high-resistivity gas hydrate and low-resistivity seawater, the gas hydrate saturation calculated by the R0 line is more reasonable. Below the GHSZ, the calculated gas saturation ranges from 0 to 40%. Some simple petrophysical models indicate that a high saturation (>50%) of free gas or gas hydrate is required to increase the formation resistivity from 1 Ω·m to 3 Ω·m [23]. For the strong resistivity variation in the study area, highly saturated gas hydrate is likely present. Moreover, the difference in the gas hydrate saturation among the stations indicates that the gas hydrate reservoir in the QDNB is heterogeneous.
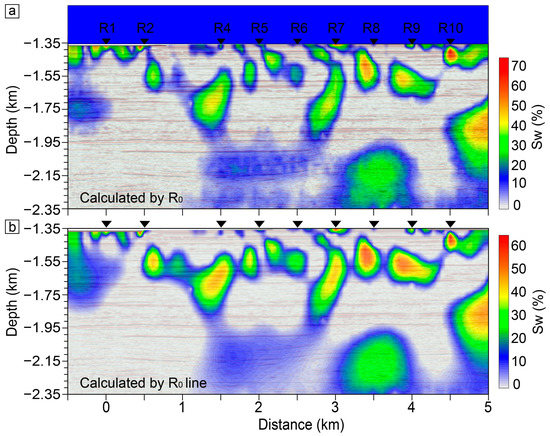
Figure 9.
Gas hydrate saturation of the study region calculated using Archie’s law: (a) Gas hydrate saturation calculated from R0; (b) Gas hydrate saturation calculated using the R0 line.
The fifth and sixth gas hydrate drillings (GMGS5 and GMGS6), samplings and, loggings were conducted in the QDNB’s deep water areas, and the gas hydrate saturation was calculated based on the pore water chlorinity, degassing quantification, and resistivity logging [3,8,12]. The gas hydrate saturation calculated by the chloride ion concentration in sites W07, W08, and W09 ranged from 0 to 44%, 0 to 92%, and 0 to 89%, respectively, and the saturation based on the degassing quantification varied from 0 to 6%, 0 to 53%, and 0 to 40%, respectively [3]. The gas hydrate saturation of the study area is slightly lower than for sites W07, W08, and W09 due to the lack of large gas chimneys. In summary, the above cases indicate that microfracture systems are also important gas transport pathways for the formation of medium to high saturated hydrate.
6. Discussion
6.1. Genesis of the Transversely Uneven Gas Hydrate Reservoir
Because of the variance in geological formations, gas hydrate reservoirs are complex and variable, resulting in changes in shape, saturation, and spatial distribution [12]. For instance, the Shenhu Sea in the South China Sea was conducive to the accumulation of gas hydrate during earlier structural evolution, but submarine canyons and sedimentary deformation destroyed the reservoir in a later stage, escalating the transversely unevenness and affecting the spatial distribution and saturation [65]. As shown in Figure 7b, multiple high-resistivity blocks (H1, H3, H5, and H6) and potential gas migration channels (H2 and H4) related to gas hydrate are detected. Furthermore, the variable distribution of gas hydrate and free gas at different drilling sites during the fifth hydrate drilling (GMGS5) indicates that the fluid flow varies greatly in space [66]. Therefore, a transversely uneven gas hydrate reservoir exists in the study area based on the discrete resistivity anomalies. Furthermore, similar transversely uneven gas hydrate reservoirs have also been reported in the QDNB by the seismic and drilling data [67]. Transversely uneven reservoirs are unfavorable for the exploration of highly saturated gas hydrate. Thus, the genesis of the transversely uneven gas hydrate reservoir was analyzed.
The deep water area of the QDNB experienced a thermal subsidence stage and rapid subsidence from the Miocene to Quaternary, without a strong tectonic event, implying that the sedimentary deformation may not be the main reason for the uneven gas hydrate reservoir. Plaza-Faverola et al. [68] pointed out that heterogeneous faults and fractures caused an uneven distribution of gas and fluids in the central Norwegian Sea. Previous seismic surveys have demonstrated a variety of gas-bearing fluid transport channels, such as faults, microcracks, gas chimneys, and mud diapirs, which are key factors restricting gas hydrate accumulation [9,11]. The cross-well seismic profiles (Figure 3a,b) show that fractures and microcracks are effective ways for the upward migration of gas-bearing fluids. High-throughput methane migrates to the shallow GHSZ along the fault fracture and microcracks system, forming a seepage path in the gas hydrate stable zone (GHSZ) and representing a focused vertical fluid flow zone [46,66].
The statistical results of the boreholes show that the biogenic gas in the QDNB mainly occurs at depths of 0–2300 m below the seabed [2]. However, it should be emphasized that the heavier hydrocarbon gas is shallow due to the presence of mud diapirs, cold seep, gas chimneys, and deep faults [9,11]. The gas decomposition of the gas hydrate samples from adjacent Well A, Well B, and Well C in the Qiongdongnan Basin was mainly within the range of pyrolytic gas and mixed gas, indicating that the gas hydrate in the QDNB is related to the hydrocarbon gas generated by deep hydrocarbon source rocks and shallow immature organic matter [56]. Therefore, gas hydrate in the study area is of a pyrolytic gas origin or a biogenic gas and pyrolytic gas mixed origin. Two high-resistivity gas migration channels (H2 and H4, which are microcracks) suggest that deep thermogenic gas is involved in gas hydrate formation. However, high-resistivity blocks (H1, H3, H5, and H6) are observed in the absence of deep resistivity connecting channels, implying that gas is generated from shallow strata. Previous research has demonstrated that potential formation mechanisms for double BSRs in the QDNB are precipitation of gas hydrates with different structures due to a supply of both thermogenic gas and biogenic gas [6]. The local coexistence of double BSRs in Figure 7b also indicates the coexistence of thermogenic gas and biogenic gas derived hydrate. Consequently, the transversely uneven gas hydrate reservoir is associated with the accumulation of both biogenic gas and thermogenic gas. The disparity in gas migration routes is the key factor in the transversely uneven electrical property of the gas hydrate reservoir in the study area. Whether this conclusion is universal needs further research in other regions of the world.
6.2. Gas Migration and Accumulation
The gas migration channels in the QDNB are primarily deep gas chimneys, fault systems, deep water sediment channels, pore fracture leakage systems, and shallow micro-gas chimneys, as determined by the 2D/3D seismic data and GMGS5/GMGS6 gas hydrate well data [9,11,12,13,16,63]. Both the accumulations of shallow and deep biogenic gas leads to an uneven gas hydrate reservoir and differences in the gas hydrate saturation in the study area. Considering the resistivity section, seismic data, and geological data reported on the LNLU, we mapped a conceptual gas and gas hydrate migration and accumulation system, as shown in Figure 10, highlighting the anomalous resistivity in the corresponding region.
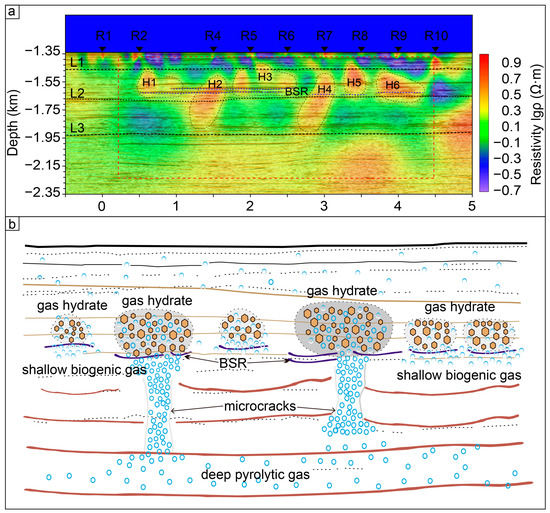
Figure 10.
Resistivity structure and schematic diagram of gas hydrate migration and accumulation: (a) Resistivity structure in the study area; (b) Schematic diagram of gas hydrate migration and accumulation, highlighting the anomalous resistivity in the corresponding region (red and dotted line areas).
Since 5.5 Ma, the QDNB has experienced rapid deposition, resulting in deep overpressure, high porosity, and seepage capacity in the shallow Cenozoic strata [69]. The LNLU is situated in the transition zone between the sedimentary concave and convex, and the thick and unconsolidated sediments are prone to plastic movement due to the deep overpressure, resulting in widespread ascending gas chimneys (or gas pipes), mud diapirs, and fluids in weak strata [47]. Previous research has shown that the biogenic gas of the QDNB is primarily stored in the Yinggehai Formation and Quaternary sediments, and gas was transported to the GHSZ via free diffusion and deep connecting channels [2]. The spatial distribution of the hydrate and the formation pressure caused by the lower free gas differ significantly at different drilling sites of the GMGS5, indicating significant spatial variations in fluids [66]. As Figure 10b shows, the shallow biogenic gas in the study area migrated into the shallow GHSZ via free diffusion, and then gas hydrate formed in the coarse sediments of the biochemically active unconsolidated zones. Moreover, the microcracks are the main pathways for deep pyrolytic gas to enter the GHSZ, where pyrolytic gas is transported to the GHSZ via two microcracks. In summary, the deep pyrolytic gas and shallow biogenic gas transport channels, together with their vertical orientation, provide favorable conditions for the migration and accumulation of gas-bearing fluids and the formation of gas hydrate.
7. Conclusions
An MCSEM survey was carried out in the LNLU, and this study reports the gas hydrate distribution, saturation, and gas migration–accumulation mechanism in the Quaternary strata. The MCSEM resistivity imaging revealed the distribution of the gas hydrate and the internal gas migration channels. The gas hydrate saturation varies from 0 to 68.4% in the GHSZ, and the high gas hydrate saturation zones beneath sites R4, R7, R8, and R9 were chosen as potential gas hydrate drilling targets. The accumulation of both shallow biogenic gas and deep pyrolytic gas led to a transversely uneven gas hydrate reservoir and different gas saturations in the LNLU. Moreover, the multilayer and multiple hydrocarbon generation events in the deep and shallow strata provide sufficient gas, allowing for the middle–high saturation of the gas hydrate accumulation in the deep water areas of the QDNB. Whether our model is more generally applicable needs to be confirmed by studies from other gas hydrate zones around the world.
Author Contributions
Conceptualization, C.L. and J.J.; methodology, C.L. and J.J.; software, C.L. and J.J.; validation, J.J.; formal analysis, C.L.; investigation, Q.Z., X.L., K.C. and M.W.; resources, J.J.; data curation, Q.Z., X.L., K.C. and M.W.; writing—original draft preparation, C.L.; writing—review and editing, C.L. and J.J.; visualization, C.L. and J.J.; supervision, M.D.; project administration, J.J.; funding acquisition, J.J., Q.Z., X.L. and K.C. All authors have read and agreed to the published version of the manuscript.
Funding
This work was funded by the National Natural Science Foundation of China (grant numbers: 42174081 and 42074110), the Dedicated Fund for Marine Economic Development in Guangdong Province (grant number: GDNRC[2023]40), and the China Geological Survey Project (grant numbers: DD20190217 and GZH201100307).
Data Availability Statement
The data are available from the corresponding author.
Acknowledgments
This work was supported by the Guangzhou Marine Geological Survey, and the authors thank the workers who participated in the data collection. The authors also thank Kerry Key for providing the MARE2DEM codes. In addition, the authors also thank the three anonymous reviewers for their constructive and valuable comments.
Conflicts of Interest
The authors declare no conflict of interest.
References
- Kvenvolden, K.A. Gas hydrates—Geological perspective and global change. Rev. Geophys. 1993, 21, 173–187. [Google Scholar] [CrossRef]
- He, J.; Su, P.; Lu, Z.; Zhang, W.; Liu, Z.; Li, X. Prediction of gas sources of natural gas hydrate in the Qiongdongnan Basin, northern South China Sea, and its migration, accumulation and reservoir formation pattern. Nat. Gas Ind. 2015, 35, 19–29. [Google Scholar] [CrossRef]
- Wei, J.; Liang, J.; Lu, J.; Zhang, W.; He, Y. Characteristics and dynamics of gas hydrate systems in the northwestern South China Sea—Results of the fifth gas hydrate drilling expedition. Mar. Pet. Geol. 2019, 110, 287–298. [Google Scholar] [CrossRef]
- Lai, H.; Fang, Y.; Kuang, Z.; Ren, J.; Liang, J.; Lu, J.; Wang, G.; Xing, C. Geochemistry, origin and accumulation of natural gas hydrates in the Qiongdongnan Basin, South China Sea: Implications from site GMGS5-W08. Mar. Pet. Geol. 2021, 123, 104774. [Google Scholar] [CrossRef]
- Chen, D.; Li, X.-X.; Xia, B. Distribution of gas hydrate stable zones and resource prediction in the Qiongdongnan Basin of the South China Sea. Chin. J. Geophys. 2004, 47, 548–555. [Google Scholar] [CrossRef]
- Zhang, W.; Liang, J.; Qiu, H.; Deng, W.; Meng, M.; He, Y.; Huang, W.; Liang, J.; Lin, L.; Wang, L.; et al. Double bottom simulating reflectors and tentative interpretation with implications for the dynamic accumulation of gas hydrates in the northern slope of the Qiongdongnan Basin, South China Sea. J. Asian Earth Sci. 2022, 229, 105151. [Google Scholar] [CrossRef]
- Wang, X.; Wu, S.; Yuan, S.; Wang, D.; Ma, Y.; Yao, G.; Gong, Y.; Zhang, G. Geophysical signatures associated with fluid flow and gas hydrate occurrence in a tectonically quiescent sequence, Qiongdongnan Basin, South China Sea. Geofluids 2010, 10, 351–368. [Google Scholar] [CrossRef]
- Ye, J.; Wei, J.; Liang, J.; Lu, J.; Lu, H.; Zhang, W. Complex gas hydrate system in a gas chimney, South China Sea. Mar. Pet. Geol. 2019, 104, 29–39. [Google Scholar] [CrossRef]
- Zhang, W.; Liang, J.; Yang, X.; Su, P.; Wan, Z. The formation mechanism of mud diapirs and gas chimneys and their relationship with natural gas hydrates: Insights from the deep-water area of Qiongdongnan Basin, northern South China Sea. Int. Geol. Rev. 2018, 62, 789–810. [Google Scholar] [CrossRef]
- Fang, Y.; Wei, J.; Lu, H.; Liang, J.; Lu, J.a.; Fu, J.; Cao, J. Chemical and structural characteristics of gas hydrates from the Haima cold seeps in the Qiongdongnan Basin of the South China Sea. J. Asian Earth Sci. 2019, 182, 103924. [Google Scholar] [CrossRef]
- Zhang, W.; Liang, J.; Liang, Q.; Wei, J.; Wan, Z.; Feng, J.; Huang, W.; Zhao, J.; Meng, M.; Deng, W.; et al. Gas Hydrate Accumulation and Occurrence Associated with Cold Seep Systems in the Northern South China Sea: An Overview. Geofluids 2021, 2021, 1–24. [Google Scholar] [CrossRef]
- Meng, M.; Liang, J.; Lu, J.a.; Zhang, W.; Kuang, Z.; Fang, Y.; He, Y.; Deng, W.; Huang, W. Quaternary deep-water sedimentary characteristics and their relationship with the gas hydrate accumulations in the Qiongdongnan Basin, Northwest South China Sea. Deep. Sea Res. Part I Oceanogr. Res. Pap. 2021, 177, 103628. [Google Scholar] [CrossRef]
- Liang, J.; Zhang, W.; Lu, J.; Wei, J.; Kuang, Z.; He, Y. Geological occurrence and accumulation mechanism of natural gas hydrates in the eastern Qiongdongnan Basin of the South China Sea: Insights from site GMGS5-W9-2018. Mar. Geol. 2019, 418, 106042. [Google Scholar] [CrossRef]
- Ren, J.; Cheng, C.; Xiong, P.; Kuang, Z.; Liang, J.; Lai, H.; Chen, Z.; Chen, Y.; Li, T.; Jiang, T. Sand-rich gas hydrate and shallow gas systems in the Qiongdongnan Basin, northern South China Sea. J. Pet. Sci. Eng. 2022, 215, 110630. [Google Scholar] [CrossRef]
- Yang, W.; Kuang, Z.; Ren, J.; Liang, J.; Lu, H.; Ning, Z.; Xu, C.; Lai, H.; Chen, R.; Zhao, B.; et al. The Controlling Factors of the Natural Gas Hydrate Accumulation in the Songnan Low Uplift, Qiongdongnan Basin, China. Front. Earth Sci. 2022, 10, 882080. [Google Scholar] [CrossRef]
- Zhang, W.; Liang, J.; Zhang, R.; Deng, W.; Gu, Y.; He, Y.; Gong, Y.; Meng, M.; Feng, J.; Liang, J. Gas hydrate accumulation in shelf break setting: Example from the Qiongdongnan Basin in the northern slope of the South China Sea. Geol. J. 2021, 57, 1153–1171. [Google Scholar] [CrossRef]
- Huang, B.; Tian, H.; Li, X.; Wang, Z.; Xiao, X. Geochemistry, origin and accumulation of natural gases in the deepwater area of the Qiongdongnan Basin, South China Sea. Mar. Pet. Geol. 2016, 72, 254–267. [Google Scholar] [CrossRef]
- Yang, R.; Wu, N.; Bai, J.; Su, Z.; Liang, J.; Sha, Z. Gas hydrate identification in non-BSR region, northern South China Sea. Prog. Geophys. 2013, 28, 1033–1040. [Google Scholar] [CrossRef]
- Weitemeyer, K.; Constable, S.; Shelander, D.; Haines, S. Mapping the resistivity structure of Walker Ridge 313 in the Gulf of Mexico using the marine CSEM method. Mar. Pet. Geol. 2017, 88, 1013–1031. [Google Scholar] [CrossRef]
- Collett, T.S.; Ladd, J. Detection of gas hydrate with downhole logs and assessment of gas hydrate concentrations (saturations) and gas volumes on the Blake Ridge with electrical resistivity log data. In Proceedings of the Ocean Drilling Program, Scientific Results, College Station, TX, USA, 19 May 2000. [Google Scholar]
- Edwards, N. Marine Controlled Source Electromagnetics: Principles, Methodologies, Future Commercial Applications. Surv. Geophys. 2005, 26, 675–700. [Google Scholar] [CrossRef]
- Schwalenberg, K.; Jegen, M. Electromagnetic Applications in Methane Hydrate Reservoirs. In World Atlas of Submarine Gas Hydrates in Continental Margins; Springer: Cham, Switzerland; Baar, Switzerland, 2022; pp. 73–85. [Google Scholar]
- Schwalenberg, K.; Rippe, D.; Koch, S.; Scholl, C. Marine-controlled source electromagnetic study of methane seeps and gas hydrates at Opouawe Bank, Hikurangi Margin, New Zealand. J. Geophys. Res. Solid Earth 2017, 122, 3334–3350. [Google Scholar] [CrossRef]
- Weitemeyer, K.A.; Constable, S.C.; Key, K.W.; Behrens, J.P. First results from a marine controlled-source electromagnetic survey to detect gas hydrates offshore Oregon. Geophys. Res. Lett. 2006, 33, L03304. [Google Scholar] [CrossRef]
- Weitemeyer, K.A.; Constable, S.; Tréhu, A.M. A marine electromagnetic survey to detect gas hydrate at Hydrate Ridge, Oregon. Geophys. J. Int. 2011, 187, 45–62. [Google Scholar] [CrossRef]
- Constable, S.; Kannberg, P.K.; Weitemeyer, K. Vulcan: A deep-towed CSEM receiver. Geochem. Geophys. Geosyst. 2016, 17, 1042–1064. [Google Scholar] [CrossRef]
- Goto, T.-n.; Kasaya, T.; Takagi, R.; Sakurai, N.; Harada, M.; Sayanagi, K.; Kinoshita, M. Methane Hydrate Detection with Marine Electromagnetic Surveys: Case Studies off Japan Coast. In Proceedings of the OCEANS 2009-EUROPE, Bremen, Germany, 11–14 May 2009. [Google Scholar]
- Hsu, S.-K.; Chiang, C.-W.; Evans, R.L.; Chen, C.-S.; Chiu, S.-D.; Ma, Y.-F.; Chen, S.-C.; Tsai, C.-H.; Lin, S.-S.; Wang, Y. Marine controlled source electromagnetic method used for the gas hydrate investigation in the offshore area of SW Taiwan. J. Asian Earth Sci. 2014, 92, 224–232. [Google Scholar] [CrossRef]
- Jing, J.; Chen, K.; Deng, M.; Zhao, Q.; Luo, X.; Tu, G.; Wang, M. A marine controlled-source electromagnetic survey to detect gas hydrates in the Qiongdongnan Basin, South China Sea. J. Asian Earth Sci. 2019, 171, 201–212. [Google Scholar] [CrossRef]
- Wang, L.; Xiong, S.; Li, Y.; Jing, J. Evaluation of gas hydrate structures: Results from an experiment in the South China Sea using the marine controlled-source electromagnetic method. Boll. Di Geofis. Teor. Ed. Appl. 2019, 60, 645–656. [Google Scholar] [CrossRef]
- Goswami, B.K.; Weitemeyer, K.A.; Bünz, S.; Minshull, T.A.; Westbrook, G.K.; Ker, S.; Sinha, M.C. Variations in pockmark composition at the Vestnesa Ridge: Insights from marine controlled source electromagnetic and seismic data. Geochem. Geophys. Geosyst. 2017, 18, 1111–1125. [Google Scholar] [CrossRef]
- Goswami, B.K.; Weitemeyer, K.A.; Minshull, T.A.; Sinha, M.C.; Westbrook, G.K.; Chabert, A.; Henstock, T.J.; Ker, S. A joint electromagnetic and seismic study of an active pockmark within the hydrate stability field at the Vestnesa Ridge, West Svalbard margin. J. Geophys. Res. Solid Earth 2015, 120, 6797–6822. [Google Scholar] [CrossRef]
- Goswami, B.K.; Weitemeyer, K.A.; Minshull, T.A.; Sinha, M.C.; Westbrook, G.K.; Marín-Moreno, H. Resistivity image beneath an area of active methane seeps in the west Svalbard continental slope. Geophys. J. Int. 2016, 207, 1286–1302. [Google Scholar] [CrossRef]
- Attias, E.; Weitemeyer, K.; Hölz, S.; Naif, S.; Minshull, T.A.; Best, A.I.; Haroon, A.; Jegen-Kulcsar, M.; Berndt, C. High-resolution resistivity imaging of marine gas hydrate structures by combined inversion of CSEM towed and ocean-bottom receiver data. Geophys. J. Int. 2018, 214, 1701–1714. [Google Scholar] [CrossRef]
- Attias, E.; Weitemeyer, K.; Minshull, T.A.; Best, A.I.; Sinha, M.; Jegen-Kulcsar, M.; Hölz, S.; Berndt, C. Controlled-source electromagnetic and seismic delineation of subseafloor fluid flow structures in a gas hydrate province, offshore Norway. Geophys. J. Int. 2016, 206, 1093–1110. [Google Scholar] [CrossRef]
- Schwalenberg, K.; Gehrmann, R.A.S.; Bialas, J.; Rippe, D. Analysis of marine controlled source electromagnetic data for the assessment of gas hydrates in the Danube deep-sea fan, Black Sea. Mar. Pet. Geol. 2020, 122, 104650. [Google Scholar] [CrossRef]
- Tharimela, R.; Augustin, A.; Ketzer, M.; Cupertino, J.; Miller, D.; Viana, A.; Senger, K. 3D controlled-source electromagnetic imaging of gas hydrates: Insights from the Pelotas Basin offshore Brazil. Interpretation 2019, 7, SH111–SH131. [Google Scholar] [CrossRef]
- Kannberg, P.K.; Constable, S. Characterization and Quantification of Gas Hydrates in the California Borderlands. Geophys. Res. Lett. 2020, 47, e2019GL084703. [Google Scholar] [CrossRef]
- Gehrmann, R.A.S.; Provenzano, G.; Böttner, C.; Marín-Moreno, H.; Bayrakci, G.; Tan, Y.Y.; Yilo, N.K.; Djanni, A.T.; Weitemeyer, K.A.; Minshull, T.A.; et al. Porosity and free gas estimates from controlled source electromagnetic data at the Scanner Pockmark in the North Sea. Int. J. Greenh. Gas Control 2021, 109, 103343. [Google Scholar] [CrossRef]
- Zhao, Z.; Sun, Z.; Wang, Z.; Sun, Z.; Liu, J.; Zhang, C. The high resolution sedimentary filling in Qiongdongnan Basin, Northern South China Sea. Mar. Geol. 2015, 361, 11–24. [Google Scholar] [CrossRef]
- Hu, B.; Wang, L.; Yan, W.; Liu, S.; Cai, D.; Zhang, G.; Zhong, K.; Pei, J.; Sun, B. The tectonic evolution of the Qiongdongnan Basin in the northern margin of the South China Sea. J. Asian Earth Sci. 2013, 77, 163–182. [Google Scholar] [CrossRef]
- Zhu, W.; Huang, B.; Mi, L.; Wilkins, R.W.T.; Fu, N.; Xiao, X. Geochemistry, origin, and deep-water exploration potential of natural gases in the Pearl River Mouth and Qiongdongnan basins, South China Sea. AAPG Bull. 2009, 93, 741–761. [Google Scholar] [CrossRef]
- Shi, X.; Jiang, H.; Yang, J.; Yang, X.; Xu, H. Models of the rapid post-rift subsidence in the eastern Qiongdongnan Basin, South China Sea: Implications for the development of the deep thermal anomaly. Basin Res. 2017, 29, 340–362. [Google Scholar] [CrossRef]
- Wang, X.; Qian, J.; Collett, T.S.; Shi, H.; Yang, S.; Yan, C.; Li, Y.; Wang, Z.; Chen, D. Characterization of gas hydrate distribution using conventional 3D seismic data in the Pearl River Mouth Basin, South China Sea. Interpretation 2016, 4, SA25–SA37. [Google Scholar] [CrossRef]
- Liu, X.; Jiang, L.; Sun, Z.; Bi, D. Chronostratigraphic framework based on micro-paleontological data from drilling LS33a in deep water area of northern South China Sea. Acta Sedimentol. Sin. 2018, 36, 890–902. [Google Scholar] [CrossRef]
- Zuo, T.; Wang, R.; He, Y.; Shi, W.; Liang, J.; Xu, L.; Du, H.; Deng, Y.; Xu, X. Natural Gas Migration Pathways and Their Influence on Gas Hydrate Enrichment in the Qiongdongnan Basin, South China Sea. Geofluids 2022, 2022, 1954931. [Google Scholar] [CrossRef]
- Li, S.; Hu, L.; Gan, J.; Wu, Q.; Li, X.; Li, M.; Chen, K.; Li, F.; Zheng, F. Accumulation conditions of buried-hill hydrocarbon reservoirs on the Lingnan Low Uplift in the deep water areas of Qiongdongnan Basin. Mar. Geol. Front. 2021, 37, 68–75. [Google Scholar] [CrossRef]
- Constable, S. Marine electromagnetic methods—A new tool for offshore exploration. Lead. Edge 2006, 25, 438–444. [Google Scholar] [CrossRef]
- Constable, S.; Srnka, L.J. An introduction to marine controlled-source electromagnetic methods for hydrocarbon exploration. Geophysics 2007, 72, WA3–WA12. [Google Scholar] [CrossRef]
- Chen, K.; Wei, W.; Deng, M.; Wu, Z.; Yu, G. A new marine controlled-source electromagnetic receiver with an acoustic telemetry modem and arm-folding mechanism. Geophys. Prospect. 2015, 63, 1420–1429. [Google Scholar] [CrossRef]
- Wang, M.; Deng, M.; Zhao, Q.; Luo, X.; Jing, J. Two types of marine controlled source electromagnetic transmitters. Geophys. Prospect. 2015, 63, 1403–1419. [Google Scholar] [CrossRef]
- Myer, D.; Constable, S.; Key, K.; Glinsky, M.E.; Liu, G. Marine CSEM of the Scarborough gas field, Part 1: Experimental design and data uncertainty. Geophysics 2012, 77, E281–E299. [Google Scholar] [CrossRef]
- Weitemeyer, K.; Gao, G.; Constable, S.; Alumbaugh, D. The practical application of 2D inversion to marine controlled-source electromagnetic data. Geophysics 2010, 75, 13. [Google Scholar] [CrossRef]
- Constable, S.C.; Parker, R.L.; Constable, C.G. Occam’s inversion; a practical algorithm for generating smooth models from electromagnetic sounding data. Geophysics 1987, 52, 289–300. [Google Scholar] [CrossRef]
- Key, K. MARE2DEM: A 2-D inversion code for controlled-source electromagnetic and magnetotelluric data. Geophys. J. Int. 2016, 207, 571–588. [Google Scholar] [CrossRef]
- Xu, L.; He, Y.; Shi, W.; Liang, J.; Wang, R.; Du, H.; Zhang, W.; Li, G. Main controlling factors and patterns of gas hydrate accumulation in the deep water area of Qiongdongnan Basin. Acta Pet. Sin. 2021, 42, 1619–1634. [Google Scholar] [CrossRef]
- Tinivella, U.; Carcione, J.M. Estimation of gas-hydrate concentration and free-gas saturation from log and seismic data. Lead. Edge 2001, 20, 200–203. [Google Scholar] [CrossRef]
- Lu, S.; McMechan, G.A. Estimation of gas hydrate and free gas saturation, concentration, and distribution from seismic data. Geophysics 2002, 67, 582–593. [Google Scholar] [CrossRef]
- Wang, X.; Wu, S.; Guo, Y.; Yang, S.; Gong, Y. Geophysical Indicators of Gas Hydrate in the Northern Continental Margin, South China Sea. J. Geol. Res. 2011, 2011, 1–8. [Google Scholar] [CrossRef]
- Archie, G.E. The electrical resistivity log as an aid in determining some reservoir characteristics. Trans. AIME 1942, 146, 54–62. [Google Scholar] [CrossRef]
- Kang, D.; Lu, J.a.; Zhang, Z.; Liang, J.; Kuang, Z.; Lu, C.; Kou, B.; Lu, Q.; Wang, J. Fine-grained gas hydrate reservoir properties estimated from well logs and lab measurements at the Shenhu gas hydrate production test site, the northern slope of the South China sea. Mar. Pet. Geol. 2020, 122, 104676. [Google Scholar] [CrossRef]
- Liu, T.; Liu, X.; Zhu, T. Joint analysis of P-wave velocity and resistivity for morphology identification and quantification of gas hydrate. Mar. Pet. Geol. 2020, 112, 104036. [Google Scholar] [CrossRef]
- Deng, W.; Liang, J.; Kuang, Z.; Zhong, T.; Zhang, Y.; He, Y. The variation of free gas distribution within the seeping seafloor hydrate stability zone and its link to hydrate formations in the Qiongdongnan Basin. Acta Geophys. 2022, 70, 1115–1136. [Google Scholar] [CrossRef]
- Dunn, J.C. A fuzzy relative of the ISODATA process and its use in detecting compact well-separated clusters. J. Cybern. 1973, 3, 32–57. [Google Scholar] [CrossRef]
- Su, M.; Sha, Z.; Qiao, S.; Yang, R.; Wu, N.; Cong, X.; Liu, J. Sedimentary evolution since Quaternary in the Shenhu hydrate drilling area, northern South China Sea. Chin. J. Geophys. 2015, 58, 2975–2985. [Google Scholar] [CrossRef]
- Deng, W.; Liang, J.; Zhang, W.; Kuang, Z.; Zhong, T.; He, Y. Typical characteristics of fracture-filling hydrate-charged reservoirs caused by heterogeneous fluid flow in the Qiongdongnan Basin, northern south China sea. Mar. Pet. Geol. 2021, 124, 104810. [Google Scholar] [CrossRef]
- Liu, P.; Li, X.; Tang, S.; Li, W.; Tong, C. The occurrence of the gas hydrates in the southern uplift zone of the Qiongdongnan Basin. Sediment. Geol. Tethyan Geol. 2017, 37, 73–78. [Google Scholar]
- Plaza-Faverola, A.; Bünz, S.; Mienert, J. The free gas zone beneath gas hydrate bearing sediments and its link to fluid flow: 3-D seismic imaging offshore mid-Norway. Mar. Geol. 2012, 291–294, 211–226. [Google Scholar] [CrossRef]
- Wang, Z.; Liu, Z.; Wang, Z.; Sun, Z.; Wang, B.; Liu, P.; Chen, Y.; Cao, S. Distribution characteristics of abnormal pressure in central depression belt, deepwater area, Qiongdongnan (Southeast Hainan) Basin. Acta Geosci. Sin. 2014, 35, 355–364. [Google Scholar] [CrossRef]


Disclaimer/Publisher’s Note: The statements, opinions and data contained in all publications are solely those of the individual author(s) and contributor(s) and not of MDPI and/or the editor(s). MDPI and/or the editor(s) disclaim responsibility for any injury to people or property resulting from any ideas, methods, instructions or products referred to in the content. |
© 2023 by the authors. Licensee MDPI, Basel, Switzerland. This article is an open access article distributed under the terms and conditions of the Creative Commons Attribution (CC BY) license (https://creativecommons.org/licenses/by/4.0/).