Article

Inferences on the 2021 Ongoing Volcanic Unrest at Vulcano Island (Italy) through a Comprehensive Multidisciplinary Surveillance Network

by
Cinzia Federico
1,*,
Ornella Cocina
2,
Salvatore Gambino
2,
Antonio Paonita
1,
Stefano Branca
2,
Mauro Coltelli
2,
Francesco Italiano
1,
Valentina Bruno
2,
Tommaso Caltabiano
2,
Marco Camarda
1,
Giorgio Capasso
1,
Sofia De Gregorio
1,
Iole Serena Diliberto
1,
Roberto Maria Rosario Di Martino
1,
Susanna Falsaperla
2,
Filippo Greco
2,
Giovannella Pecoraino
1,
Giuseppe Salerno
2,
Mariangela Sciotto
2,
Sergio Bellomo
1,
Giuseppe Di Grazia
2,
Ferruccio Ferrari
2,
Alessandro Gattuso
1,
Leonardo La Pica
1,
Mario Mattia
2,
Antonino Fabio Pisciotta
1,
Lucia Pruiti
2 and
Francesco Sortino
1
add Show full author list remove Hide full author list
1
Istituto Nazionale di Geofisica e Vulcanologia, Sezione di Palermo, via Ugo La Malfa 153, 90146 Palermo, Italy
2
Istituto Nazionale di Geofisica e Vulcanologia, Osservatorio Etneo, sezione di Catania, Piazza Roma 2, 95125 Catania, Italy
*
Author to whom correspondence should be addressed.
Remote Sens. 2023, 15(5), 1405; https://doi.org/10.3390/rs15051405
Submission received: 29 December 2022 / Revised: 27 February 2023 / Accepted: 28 February 2023 / Published: 2 March 2023

Abstract

:
In September 2021, the La Fossa crater at Vulcano, in Italy, entered a new phase of unrest. We discuss a set of monitoring parameters included in the INGV surveillance network, which closely tracked the sequence of effects related to the crisis. The low-frequency local seismicity sharply increased, while the GPS and tiltmeter networks recorded the inflation of the cone, as an effect of fluid expansion in the hydrothermal system. Gravity variations were probably the effects of fast processes within shallow sources. The anomalies in soil CO2 flux, fumarole temperature, and in plume SO2 flux marked the strong increase in the vapor output from crater fumaroles. The signs of the impending crisis had been evident in the chemical and isotopic composition of fumarole gases since July 2021. These geochemical anomalies were clearly indicative of the enhanced input of gases from a magmatic source. In October, the massive degassing also influenced the areas at the base of the cone. In some areas, soil CO2 degassing and the thermal aquifer recorded strong anomalies. By early November, the crisis reached its acme. Afterward, the monitored parameters started a slow and discontinuous decreasing trend although remaining, some of them, sensibly above the background for several months. The multidisciplinary approach proved decisive for the interpretation of the underlying processes acting in the different phases of the unrest, thus allowing a consistent evaluation of the multiple hazards.

1. Introduction

Closed-conduit active volcanoes normally show exhalative activity from fumarolic fields, whose extent of degassing changes over time as the most visible evidence of phases of increasing or decreasing volcanic activity [1,2,3]. Vulcano, the southernmost Island of the Aeolian Archipelago in the Southern Tyrrhenian Sea, has developed fumarolic activity since its last eruption in 1888-1890 [4,5,6].
Vulcano is mainly characterized by the presence of NW-SE to NNW-SSE structures (Figure 1a), interpreted as the northern end of the Aeolian Tindari–Letojanni Fault System (ATLFS), a major lateral strike-slip lithospheric structure crossing the Aeolian Islands until northern Sicily (Figure 1a). The NW-SE to NNW-SSE alignments are also accompanied by the presence of N-S and NE-SW-striking normal faults (e.g., [7,8,9]). The location of the volcanic centers seems to have been largely controlled by the NNW-SSE and N-S structures ([10,11]).
In 1978, an increase in the fumarolic activity was observed in the aftermath of the April 15 earthquake (M = 5.5), the epicenter of which was located on a NW-SE trending fault (crossing Vulcano Island) in the nearby Patti Gulf, about 20 km south of Vulcano Island. The summit fumarolic field deeply changed in terms of the location and extension of exhaling surface areas, as well as the temperature and composition of fumarolic gases. Since then, important episodes of volcanic unrest occurred in 1987–1990, 1996–1998, and 2004–2005, marked by quick and intense modifications of both the geochemical features and the output rate of fumarolic fluids [6,14,15,16,17,18,19,20,21,22,23,24,25]. All these episodes of unrest were tracked by a comprehensive geochemical and geophysical surveillance network, now run by the Italian Istituto Nazionale di Geofisica e Vulcanologia (hereafter INGV), implemented on the island since 1981. The network includes the monitoring of seismic activity, ground deformation, gravimetry, degassing, and hydrothermal activity. The surveillance network was further implemented after 2002 when a regional increase in geodynamic activity affected the South Mediterranean area (Etna eruption in October, submarine paroxysmal degassing near the offshore of Panarea Island in November, and Stromboli eruption in December).
All episodes of unrest were characterized by an increase in outlet temperatures, an enhanced concentration of acidic gas species, an increase in the exhaling surface area, and steam output from fumarolic vents [6,16,26,27]. Marked variations were also observed in water temperature, piezometric level, and the chemical and isotopic compositions of thermal groundwater [28]. These episodes were generally accompanied by an increase in seismo-volcanic events with negligible ground deformation (e.g. [18,29]), interpreted as due to an increasing degassing of a steady-state magma body [30].
After March 2016, the volcanic activity on Vulcano was limited to a wide fumarole field in the northern part of the La Fossa crater, with temperatures ranging from 100 °C to about 400 °C and decreasing over time [27], low temperature fumaroles (<100 °C) in the Baia di Levante area and widespread soil CO2 degassing anomalies in the Vulcano Porto area, around the cone of Faraglione, and in the area of Grotta dei Palizzi (Figure 1). The crater fumaroles generally emit a steam-dominated gas, with CO2 in the range of 4–20 vol%, associated with few ppmv of He of magmatic origin [31] and variable S, N2, and HCl contents up to 1 vol% [6]. A CO2-rich gas of prevailing volcano-hydrothermal origin (as deduced from the carbon isotope composition of CO2 [24]) is also emitted in the Baia di Levante and Grotta dei Palizzi, where the CO2 flux is higher than that emitted in the remaining part of Vulcano Porto by one to three orders of magnitude. The shallow thermal aquifer existing at the base of the La Fossa cone, fed by rainwater and variably contaminated by seawater, interacts with fluids of volcano-hydrothermal origin [28,32,33]. The closest interaction with fumarolic fluids occurs at the base of the La Fossa cone (e.g., the Camping Sicilia well), while the effect of condensing steam from the deeper hydrothermal aquifer is observed in the Baia di Levante area (e.g., the Bambara well) [33,34,35,36,37].
Geophysical studies performed on Vulcano have generally highlighted either processes related to regional tectonics (e.g. [13,38,39,40]) or changes in the shallow hydrothermal system that also favored slope failures (e.g., [40,41,42,43]).
Regarding the seismic activity, it is characterized by local events, with varying waveforms and spectral content (frequency peak ranging from 0.5 to 35 Hz) and low energy release (~5 × 10⁶ ergs); this seismicity is generally located within the first kilometer of depth below the La Fossa crater and is mainly associated with fluid dynamics within the hydrothermal system at shallow depth [29,44,45,46]. This micro-seismicity may be due to the fluid circulation within cracks and fracturing processes in altered rocks typical of hydrothermal environments. The seismic activity in the Vulcano area is also due to volcano-tectonic events (earthquakes) generally occurring in swarm-like sequences of low magnitude (M ≤ 3.0), in the first 15 km of depth. This seismicity is usually related to the dynamics of the regional fault systems [12,13,47]. Gambino et al. [13] identified a 3–8 km deep seismogenic structure below Vulcanello that they interpreted as a preferential pathway along which fluids may intrude and ascend toward the surface.
The Vulcano GNSS monitoring network allowed the monitoring of volcanic activity and contributed to the study of the tectonic features of the Lipari–Vulcano complex [40], providing evidence of the deformation responses to the regional geodynamic processes [9,48].
Tilt measurements play an important role in real-time monitoring since they can detect ground deformation with high precision. Long-term data (1999–2014) have shown a tilt lowering toward the center of the La Fossa crater confirming its subsidence [47]; instead, tiltmeters and GNSS never registered short to medium (over hours–days to weeks) variations during the anomalous degassing episodes at La Fossa Cone [46] or that could be correlated to magma migration.
Gravity measurements, performed since 1981 through periodic campaigns, have exhibited short-term (of the order of a few months) gravity changes, generally not larger than 20–40 μGal, which affected the central–southern part of the island, at the base of the presently active crater. The causative mechanisms to interpret these variations were the fluid migration through shallow levels of the crust (500–1000 m) and the cyclic water-to-vapor transformations [49,50,51].
In September 2021, an important period of increasing volcanic activity occurred and it is still running at the time of writing. The degassing activity from the crater started to increase and, at the end of the month, it was visibly impressive. Most of the parameters regularly monitored by the INGV surveillance network showed stunning variations, in some cases by orders of magnitude over the background [52,53]. In particular, the fumarole gas composition and temperature and plume emissions, soil CO2 degassing, local seismicity, and ground deformations were all coherent with the abrupt emission of magmatic and hydrothermal fluids from the crater’s fumarolic conduits. In October 2021, the massive degassing activity also influenced the areas far from the crater, and specifically the base of La Fossa, from northwest to south of the cone. Meanwhile, thermal aquifers started to show anomalies in the physico-chemical parameters of water in wells located in the same areas. Most of the above parameters increased until the end of October–early November, when the crisis reached its acme and, since then, they slowly decreased although remaining far from their background values for several months.
In this paper, we present a comprehensive description of geochemical and geophysical data acquired in the period between June 2020 and April 2022, showing the surface effects of the last volcanic crisis that affected Vulcano. We discuss the timing of the changes in the different parameters monitored and the inferences on the processes occurring inside the volcano and foster the integration of multidisciplinary observations to track the onset and evolution of unrest phases in other volcano-hydrothermal systems.

2. Materials and Methods

2.1. Current-State INGV Monitoring System at Vulcano

The volcanic surveillance at Vulcano is carried out by INGV as part of the joint INGV-Civil Defense program. The INGV monitoring system consists of several networks of stations developed to monitor continuously a variety of geophysical and geochemical parameters. Besides, recurring samplings are carried out to collect fumarolic gases and thermal waters to determine their chemical and isotopic compositions. In the following, we describe the monitoring routines in more detail. Since early October 2021, the geophysical and geochemical instrumental networks operating on the island have been improved, in terms of the number of stations and frequency of sampling, to optimize the monitoring of the ongoing activity. The data presented here are listed in the Supplementary Materials.

2.2. Composition and Temperature of Fumarolic Gases

Since 1988, some selected fumaroles, located in both the northern rim and the inner flank of the La Fossa cone, have been monitored and their gas collected with monthly or bimonthly frequency and analyzed for gas chemistry and isotopic composition. In this article, we discuss the data from two of them, namely F11 on the crater rim and FA, on the inner flank (Figure 1, Table S1). We refer to [6] for details on methods of collection and analysis. Chemical and isotopic analyses are performed in the INGV-PA laboratories. In brief, we sampled the gas emission by classical soda Giggenbach’s bottles. CO2 content was analyzed by potentiometric titration, Stot, HCl, and HF by ionic chromatography (Thermo Scientific Dionex ICS-5000+), gases in the bottle headspace (He, H2, O2, N2, CO, and CH4) by gas chromatography (Clarus 500, Perkin Elmer), with analytical errors lower than 3%. The H2O content was determined by the weight difference of bottles before and after sampling. Dry gas samples were collected in two-way Pyrex bottles for the determination of isotopic compositions of C and He. The carbon isotope composition of CO2 was measured by a Delta Plus XP isotope ratio mass spectrometer equipped with a Thermo TRACE GC interfaced with Thermo GC/C III, while 3He/4He ratios were determined by a split flight tube mass spectrometer (Helix SFT), after applying standard purification procedures to the gas samples. The isotopic compositions of CO2 are quoted as δ13C-CO2 versus VPDB, while helium isotope compositions are given as R/Ra (3He/4He of the sample versus the atmospheric 3He/4He), with analytical errors lower than 0.2‰ and 0.3%, respectively. R/Ra values were corrected for the atmospheric contamination based on 4He/20Ne ratios, and these corrections were usually trivial (<<0.1 Ra units).

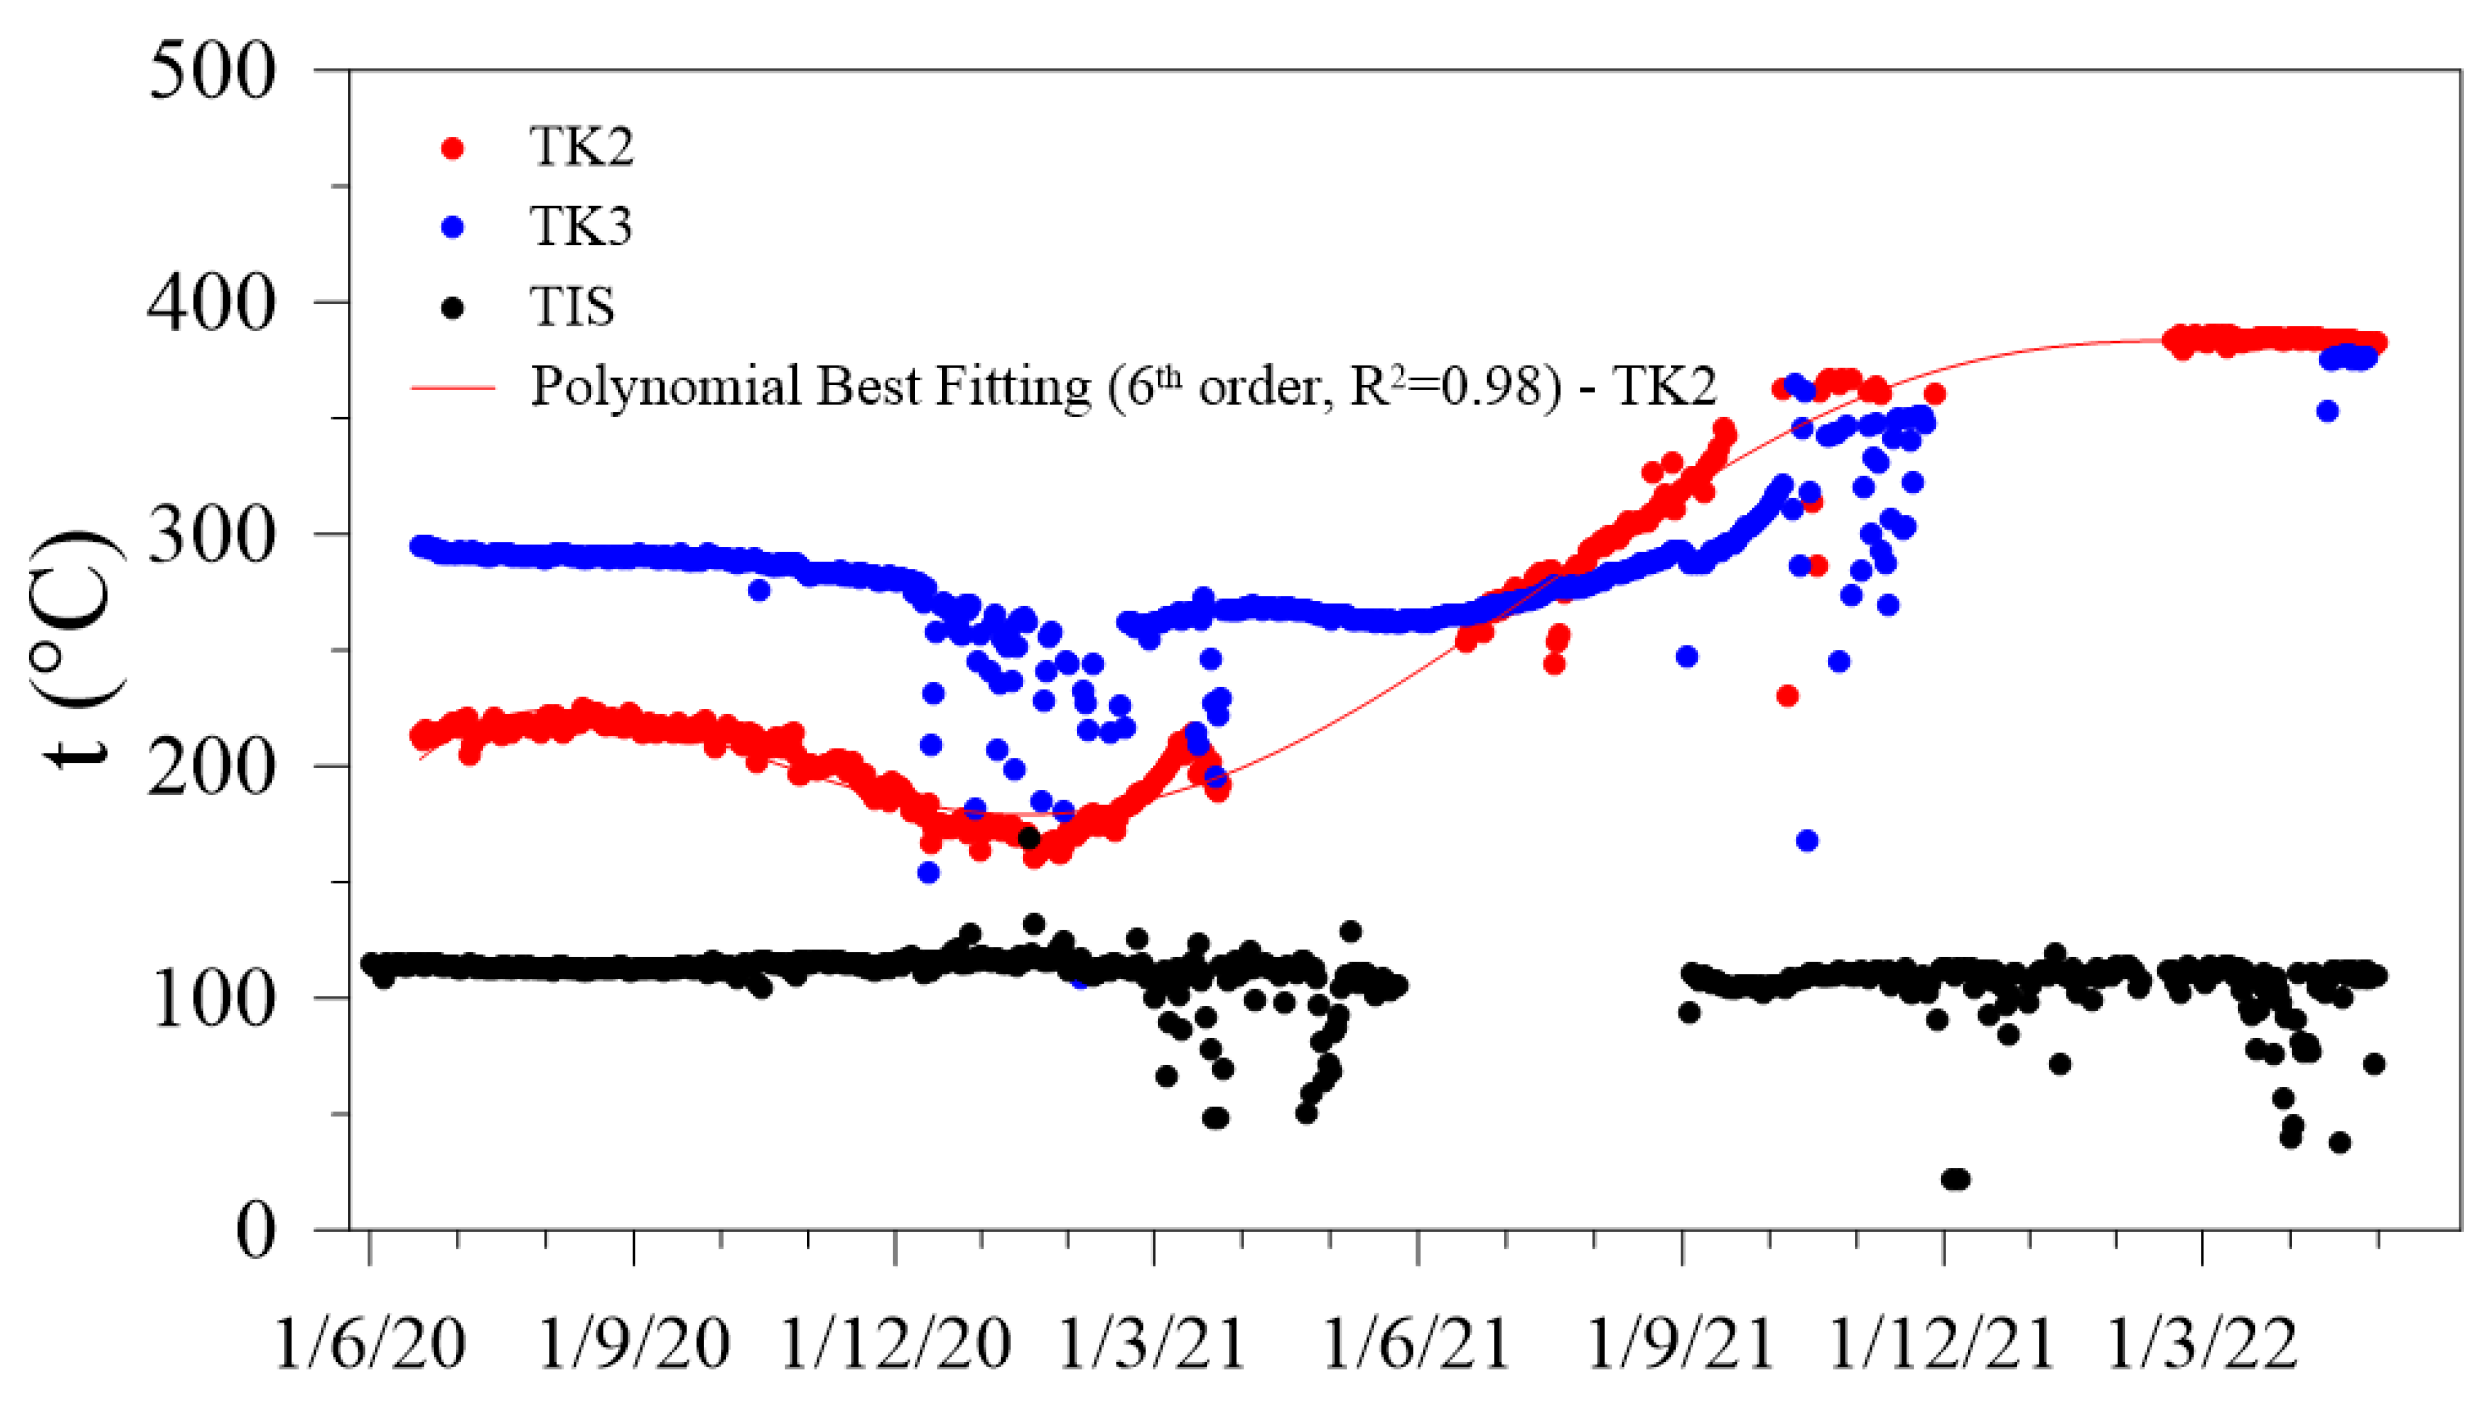
2.3. The High-Temperature Fumaroles (HTF) Monitoring Network

The outlet temperatures of a few HTF located in the summit area of the La Fossa cone have been monitored continuously by INGV-PA by a network of sensors (HTF network) since the year 1984. Due to the harsh environmental conditions, the present system of acquisition and data transmission has required a prolonged phase of tests. We recommend [27,54,55] and [56] for details about the present methods of data collection and some examples of long-term time series analysis. Since 1990, the HTF network has kept the present configuration and the same location of the thermal probes on the northern rim (TK2, TK3, Figure 1, Table S2). In 2004, one monitoring site was added, located in the inner flank, on the eastern edge of the FA fumaroles (Figure 1, Table S2). This fumarole reached the maximum temperature of 670 °C during the crisis of 1988–1992 [57]. The environmental conditions (corrosive acidic gases, high moisture, high temperatures) require constant maintenance (about twice a year) with frequent substitutions of spare parts, including thermocouple wires, probes (type K, measurement interval from −200 °C to +1200 °C, resolution ±0.3 °C in the interval −99–+250 °C), dataloggers, electronic components, solar panels, batteries, etc. Some quick surveys with direct measurements are repeated during the interventions of maintenance, and supplementary temperature measurements are performed periodically (from four to six times per year) during the sampling campaigns in the F5AT and FA fumaroles at a short distance from the monitoring probes.

2.4. The Steam-Heated Soil (SHS) Monitoring Station

The SHS monitoring runs in the eastern rim of La Fossa crater, in the VSCS station (Figure 1, Table S2), supervised by INGV-PA.
On the La Fossa cone, this thermal monitoring procedure has been tested, starting from 2004, to evaluate the time variations of heat release from the ground, in the diffuse degassing zone, outside the area of high-temperature fumaroles. Using a short profile of temperature registered hourly in the shallow ground, it is possible to extrapolate the depths reached by the advection front of steam, to evaluate the resulting upward heat release [24]. In the SHS, the temperatures registered within the conductive layer usually ranged from 10 to 93 °C. To compute the depths of the advection front of steam, all the linear temperature profiles presenting a regression value R2 > 0.99 were considered.
Figure 2 shows two temperature profiles recorded at noon during a background exhaling activity, respectively, on 1 January and 1 August 2019. The linear fitting equations, with their respective linear correlation factors, which are applied to extrapolate the depth of the boiling temperature, are reported in the figure as an example of calculations. For comparison, Figure 2 also shows the air temperature measured 0.3 m above the monitored ground. Due to the fit based on a few points (only four temperature values for each profile), we apply a t-test to check the statistical significance of the correlation coefficients (R). For the winter and summer profiles shown in Figure 2, we calculated a t-value of 25.8 and 99.9, respectively, which are higher than the critical t-values (t* = 4.3). This result confirms that experimental data are fitted by a linear relationship with coefficients reported in Figure 2. To provide uncertainties in the depth of boiling points, we apply the following expression, which was used in the literature for calculating the uncertainty in the dependent variable for the least squares regression [58]:
σ z = 1 N 2 i = 1 N ( z i n m x i ) 2
where N is the number of experimental data (in our case, N = 4), xi stands for the temperature at the i-th depth, and n and m are the intercept and angular coefficients of the linear regression, respectively. Using values reported in Figure 2, we obtain uncertainty in the depths of 0.013 and 0.003 m for the summer and winter profiles, respectively. Therefore, the depth of boiling points, in the examples shown in Figure 2, is Z(100 °C) = 1.230 ± 0.013 m for the summer profile and Z(100 °C) = 1.310 ± 0.003 m for the winter profile. We recommend [54,55] and [53,56] for details about the SHS method of data collection and elaboration.

2.5. SO2 Flux from Fumaroles

Bulk SO2 flux released by the fumarole field of the La Fossa Crater is measured during daylight hours by the FLAME (FLux Automatic MEasurement) DOAS network (e.g, [59]). The network consists of an ultraviolet scanning spectrometer station placed on the east-south-east side of the volcano and intercepting the plume at a distance of ~1500 m from the summit crater of the volcano (Figure 1). The station scans the sky horizon-to-horizon arc orthogonal to the line between the station and the volcano summit. A single scan lasts from 5 to 15 min depending on the integration time for each spectrum, which varies due to the intensity of scattered skylight. Open-path ultraviolet spectra are reduced on-site by the DOAS technique using a modeled off-plume spectrum [60]. The system automatically computes the SO2 mass emission rate in real time with an uncertainty range between 22 and 36%. Inverted data are transferred to the INGV-OE in Catania and made available for monitoring purposes. The dataset from 1 January 2020 to 30 April 2022 is listed in Table S3.

2.6. Continuous and Discrete Measurements of Soil CO2 Flux

The soil CO2 flux on the lower flanks of the La Fossa cone and in the inhabited area of Vulcano Porto was measured on a fixed sampling grid of 53 points with monthly frequency (Table S4). The employment of a fixed measurement grid is particularly useful to verify CO2 emissions over time [23].
More recently, gas monitoring has been improved with the installation of a permanent network of automatic stations to measure the soil CO2 flux [52], run by INGV-PA. The selection of the monitoring sites was based on the data acquired by periodic measurements of the soil CO2 flux performed on the island since 1998. We selected sites located in, or nearby, the persistently high degassing area and some sites that in the past (i.e., during the crises of 1990–1993 and 1996) displayed very high fluxes (up to 1300 gm−2d−1, [23]), although currently characterized by low CO2 fluxes.
The station of Faraglione is placed near the fumarolic field of Baia di Levante, very close to the Faraglione cone, while Bordosud is placed on the southern rim of the La Fossa crater (Figure 1). The Palizzi station is installed in the Grotta dei Palizzi area, at the base of the La Fossa cone. Rimessa and C. Sicilia stations are placed at the base of the La Fossa cone, on the north and the northwest flanks, respectively. The automatic stations can acquire on an hourly basis the CO2 flux emitted from the soil and some environmental parameters (i.e., air temperature, atmospheric pressure, and rainfall). Data are stored in a local data logger and are daily transmitted to the INGV-PA monitoring center. A solar panel and a battery supply the electricity in each station.
The soil CO2 flux is measured at each monitoring site by using the dynamic concentration method [61]. This method consists in measuring the CO2 concentration in a mixture of air and soil gas obtained in a specially designed probe, inserted into the soil at a depth of 50 cm. The gas mixture is obtained by producing a very small negative pressure in the probe using a pump at constant flux; the concentration of CO2 in the mixture is measured by an Infrared IR spectrophotometer (NG Gascard, manufactured by Edinburgh Gas Sensors, accuracy 2% full scale; range either 0–10% or 0–100%, depending on the site). After a fixed time from the pump activation (generally <1 min), the gas mixture reaches a constant CO2 concentration, known as the “dynamic concentration”, which is proportional to the soil CO2 flux. The relationship used to calculate CO2 flux from the dynamic concentration values was obtained in the laboratory by making several measurements of dynamic concentration in a soil layer entered by CO2 at a constant rate [61]. The dataset is listed in Table S4.

2.7. Continuous and Discrete Measurements on Thermal Waters

From 1987 on, some thermal wells were sampled regularly (monthly or bimonthly) in the framework of volcanic surveillance activities, and from 2009 four of these wells were also selected for the continuous monitoring of some chemical-physical parameters, i.e., water temperature, water table elevation (WTE), and electric conductivity (EC). All samples were collected from drilled wells in the Vulcano Porto area (Figure 1). Water temperature (±0.1 °C), pH (±0.05 units), EC, and HCO3 values were measured directly in the field. HCO3 contents were measured by volumetric titration with HCl 0.1 N. The TDIC (Total Dissolved Inorganic Carbon) was calculated from temperature, pH, and HCO3 contents, according to the equilibrium among carbon species (CO32−/HCO3/CO2(aq)). Samples were collected and stored in polyethylene bottles.
The continuous measurements of physical-chemical parameters in water were performed by a multiparametric probe, totally designed and worked out in the INGV-PA laboratories. The probe measures water temperature (NTC 10K; range = 0–100 °C, precision = ±0.1 °C), EC (AISI316 customized four-electrode sensor; range = 0–40,000 μS cm−1, precision = ±10 μS cm−1), and water level with compensation cable (STS sensor; range = 0–2.5 bar, precision = ±0.25% of full scale).
The water wells discussed in this paper were selected because of their different chemistry, which makes them representative of the main groundwater endmembers recognized in the Vulcano Porto aquifer (Tables S5 and S6). Bambara is a hand-carved well, located near the Faraglione and Baia di Levante area (Figure 1), where several vents emit 100 °C-vapor coming from an underlying hydrothermal aquifer. Camping Sicilia is a drilled well located at the lower SW flank of the La Fossa cone, in an area affected by the appearance, in periods of unrest, of mofete and low-temperature fumaroles, as reported by [62].

2.8. Seismic Data and Analyses

To monitor local seismicity, the signal recorded by the INGV permanent network as well as by mobile seismic stations was analyzed (Tables S7 and S8).
The INGV permanent seismic network in the Lipari–Vulcano area is composed of six stations (five are installed on Vulcano), equipped with broadband three-component Trillium (Nanometrics) velocimetric seismometers with a cut-off period of 40 s, and one accelerometric sensor. From September 2021 on, the seismic monitoring system was boosted with the installation of nine temporary stations, seven of which are located on Vulcano Island (Figure 1). In particular, three of them are equipped with broadband three-component Guralp 6T (cut-off period of 20 or 120 s) belonging to the stand-alone mobile network run by INGV-Osservatorio Etneo; two temporary stations are equipped with broadband velocimetric sensors (120 s) belonging to INGV-SISMIKO emergency group (http://sismiko.ingv.it/, (accessed on 29 December 2022)), and four were provided by eWAS project [63] and are equipped with velocimetric (5 s) and high sensitivity accelerometer sensors. The stations acquire in real-time at a sampling rate of 100 Hz, except those of the eWAS project, which have a sampling rate of 200 Hz.
Earthquake data are analyzed daily by an expert INGV scientific team. The data here reported as location parameters, magnitude, and source mechanisms are extracted from the Aeolian instrumental catalog [64] published by the Osservatorio Etneo. The hypocentral parameters are calculated by using the Hypoellipse 2.0 program [65]; the velocity model is obtained by combining the Jeffreys–Bullen [66] model (for depths greater than 4 km) with the model above 4 km from [12] (http://eqcatalog.ct.ingv.it/aeolianrsc, (accessed on 29 December 2022)). The focal mechanisms of the earthquakes are computed with the standard FPFIT algorithm [67].
Unlike earthquakes, seismic events related to fluid dynamics played an important role in terms of occurrence rate during the unrest of Vulcano starting from September 2021 (see Section 3.5.1). A dominant very long period (VLP) component marked the signature of the majority of them, featuring a peculiar character of this seismicity. An automatic processing system for the location of such VLP events became operational on October 13, when mobile stations installed on Vulcano Island strengthened the seismic permanent network and allowed us to better constrain the source location. In particular, we adapted and applied the real-time automatic system developed on Etna for low-frequency seismicity by [68]. Radial semblance was carried out after the event waveform extraction from the time series. To identify the source position, we performed the location on the VLP component of the signal, which was filtered in the frequency band 0.05–0.5 Hz. The VLP events were first identified from the continuous signal using STA/LTA trigger algorithm [69], and then a grid search method (6 × 6 × 3.5 with a step of 0.25 km), looking for the maximum value of the radial semblance function, was applied [68,70,71]. Only the location with a minimum station number equal to five, minimum amplitude value equal to 0.006 (mm/s), and minimum radial semblance equal to 0.6 was considered.

2.9. GNSS

The GNSS (Global Navigation Satellite System) monitoring network of Vulcano Island is currently made up of six permanent stations. Ground deformation data have been collected since 1995 by the INGV-OE.
The GNSS data were processed using the GAMIT/GLOBK software [72,73]. Data from 12 IGS (International GNSS Service) stations (BOR1, GLSV, GRAS, GRAZ, LROC, MATE, NOT1, POTS, VILL, WSRT, WTZR, ZIMM) and a GNSS station (EIIV) installed in Catania (eastern Sicily) by the INGV were also included in the processing. The loosely constrained daily solutions were then translated and rotated into a Eurasian reference frame [74]. In this work, we show the time series of the N-S, E-W, and vertical components of station IVLT (Lentia), located southwest of La Fossa Crater (Figure 1c, Table S9).

2.10. Tiltmeters

Vulcano permanent tilt network comprises five borehole stations equipped with AGI bi-axial instruments, installed at 3-10 m depth (Figure 1b). At present, four stations are active and data, sampled every 10 minutes, are transmitted, in real-time, to INGV-OE [75,76]. The instruments are biaxial AGI models, (precision 0.1 microradians) and the two axes are oriented towards La Fossa crater (radial component) and a direction of 90° counter-clockwise. The first stations were installed in the 1980s and then the network was expanded at the end of the 1990s with three borehole stations 10 meters deep. Recently, a 30-meter-deep hole has been realized at Vulcanello (Figure 1), and the tiltmeter installation is in progress. In this work, we present the data recorded by the station SLT (Figure 1c, Table S10).

2.11. Gravimetry

From 1981, gravity measurements were gathered on Vulcano Island through repeated campaigns on a network consisting of about 25 benchmarks [49]. However, the sampling applied (from about 6 months to 1 year) was not sufficient to study very fast phenomena associated with the dynamics of the hydrothermal systems.
In October 2021, three gravimetric stations in continuous acquisition (sampling rate of 1 Hz) were installed on the island of Vulcano (Figure 1). Two of them were equipped with LaCoste and Romberg (LCR) model G relative gravimeters with Aliod 100 electronic feedback system with range and resolution of 100 mGal and 0.01 mGal, respectively; in the third, instead, a Scintrex CG5 relative gravimeter was employed. At each station, besides gravity, ground tilt along two perpendicular directions (cross and long), temperature, atmospheric pressure, and humidity were also acquired to reduce their effects on the gravity signal. Data collected from the two LCRs are transmitted, upon request, to INGV-OE. The Scintrex CG5 is in local acquisition. In this work, we present the data recorded by the station VPORT (Figure 1c, Table S11).

3. Multidisciplinary Data Record from June 2020 to April 2022

3.1. Fumarole Gas Chemistry and SO2 Emissions

The chemical composition of crater fumaroles has experienced pulsating variations since early 2021. In January and March 2021, the concentration of CO2, one of the gas species mostly contributed by the magma, increased from values of about 8–10 mol% up to 20 mol% (Figure 3a). In the samples collected on 19 May 2021, this pulse was apparently exhausted, but a new, stronger increase was evident from the sampling campaign of July, peaking in September with the highest values ever measured in La Fossa fumaroles. The anomalies in CO2 contents were perfectly synchronous with those of He contents, with values peaking at 4·10−4 mol% in September 2021 (Figure 3b), and were homogeneous in the different fumaroles. In October, the trends reverted although, at the time of this report, the values are still higher than those measured in 2020.
Total sulfur contents, although not coherent in all the fumaroles, showed a global increase since the sampling campaign of 14 September 2021, peaking in October and then progressively decreasing (Figure 4).
In coincidence with CO2 anomalies, the carbon isotope composition of CO2 (i.e., δ13C-CO2) increased to values as high as δ13C-CO2 = 0 ‰ in March and September 2021. The carbon isotope composition remained at values close to 0 ‰ vs. VPDB from September onward, with CO2 contents still above 10 mol%, although decreasing over time (Figure 5a).
Unlike what was observed for the other geochemical parameters, helium isotopes showed a significant variation in all the sampled fumaroles, only in September 2021 changing from 5.4–5.6 Ra to 5.8 Ra. In December 2021, they decreased to 5.6 Ra (Figure 5b). Both carbon and helium isotopes showed similar variations in all the analyzed fumaroles.
Figure 6 shows the monthly and daily SO2 emission rates measured between June 2020 and July 2021 and September 2021 and April 2022, respectively, in the volcanic plume emitted from the fumarole field of the La Fossa crater. Over the considered period, the SO2 emission rates displayed two different behaviors with a mean monthly degassing rate of ~43 t·d−1 (~13 t·d−1 standard deviation, St.dev) from June 2020 to July 2021, and a mean daily degassing rate of ~100 t·d−1 (~ 40 t·d−1 St.dev) from September 2021 to April 2022.
Data for August and September 2021 are not available due to technical problems with data transmission. The degassing rate before September 2021 was quite close to the mean value of the background SO2 emissions of Vulcano (~12–30 t·d−1; [77,78,79,80]) and rapidly increased from September 2021 with a mean value of 105 t·d−1 (38 t·d−1 St.dev) enveloped between a minimum and maximum value of 14 and 211 t·d−1. Specifically, the emission rates displayed a waxing-waning phase that peaked between November 2021 and January 2022 with a value up to 220 t·d−1. From February, the signal steadily decreased to early March, when the flux stabilized to a mean value of ~80 t·d−1 (30 t·d−1 St.dev) with a minimum and maximum value of 30 and 170 t·d−1, respectively.

3.2. Heat Flux and Thermal Anomalies

Before the onset of the present unrest, the outlet temperatures of the HTF were dominated by a decreasing trend from 2014 to the beginning of 2021 (monitoring sites TK2 and TK3, Figure 1 and Figure 7). In February 2021, the outlet temperature spanned from 100° to 262 °C, over the whole fumarole field, and this represented the lowest range of values ever recorded. Afterward, the thermal anomaly associated with the HTF began increasing, both in intensity (Figure 7) and in extension. The growing rate of the HTF outlet temperature, recorded from February to September 2021, was 0.62 °C/day. Considering only the steepest ramp, a constant increase of 1.25 °C d−1 was recorded from 9 September to 5 October 2021. Both rates (0.62°C/day and 1.25 °C d−1 ) are the average values of the best performance measured in the sites TK2 and TK3. In October 2021, the outlet temperature reached the value of about 370 °C. After that, the temperatures increased at a lower rate until the average temperature of 384 °C, the maximum value over the period considered in this report, with a total increase of more than 130 °C compared to the temperature recorded in 2020. At the same time, in the inner slope, the fumarole TIS showed a constant temperature of about 110 °C (Figure 7).
Outside the HTF field, the VSCS monitoring station (Figure 1) recorded the ground temperature in a 0.6 m vertical profile. In Figure 8, the depth of steam condensation, retrieved from the temperature profile, is shown. The depth of steam condensation was generally located within the range of background vapor emission (1.2 m on average [53]) until June 2021. Starting on 16 September 2021, the steam-saturated front rose to 0.4 m below the ground surface, the shallowest depth ever measured since the installation of the sensors, and it has not returned to the previous depth by the time of this report.

3.3. Soil CO2 Degassing

Figure 9 shows the temporal variation of mean soil CO2 flux from June 2020 to April 2022.
From June 2020 to September 2021, the mean value of the soil CO2 flux emitted from the area of Vulcano Porto was below the background level. In particular, the mean value registered in February 2021 was the lowest in the last 10 years. After that, the flux increased slowly but, after 23 September 2021, a sudden acceleration in the rate of increase was observed: the CO2 flux changed by one order of magnitude from the background level up to 160 gm−2d−1 in only one month. The CO2 flux peaked in November, with the highest values ever measured at Vulcano Porto. After that, the soil CO2 flux showed a rapid decrease, but it remained above the background level.
The strong variation observed in the soil CO2 flux during 2021 is paralleled by an analogous variation in its spatial distribution (Figure 10). During background degassing, two areas with anomalous CO2 emission are always present in the monitored area: the area around the cone of Faraglione in the village of Vulcano Porto, and the area of Grotta dei Palizzi, north and south of the La Fossa cone, respectively. In the remaining part of the explored area, soil CO2 flux is lower than 50 gm−2d−1 and CO2 is mainly of biogenic origin [81]. In contrast, after September 2021, when the mean CO2 flux was above the background level, the anomalous area of Grotta dei Palizzi enlarged, and new areas with high CO2 emission appeared in the village of Vulcano Porto, greatly increasing the gas hazard in the island [82]. In particular, the most dangerous area was located on the western flank of the La Fossa cone, between Piano delle Baracche and Camping Sicilia; another anomalous area was located north of the La Fossa cone, at the base of the La Forgia crater, close to the Baia di Levante area.
According to the picture given by the periodic survey of soil CO2 flux, data from the continuous monitoring also showed some strong variations in October 2021. As an example of this, we have selected soil CO2 flux data recorded at the site Rimessa (Figure 11), located at the base of La Forgia crater, close to the Baia di Levante area (Figure 10). Starting from 23 September 2021, the soil CO2 flux showed a rapid increase from its background level (about 40 gm−2d−1) to values higher than 3000 gm−2d−1 (3500 gm−2d−1, 24 October 2021). After 24 October, soil CO2 flux showed a progressive moderate decrease, but the values recorded in April 2022 are still far higher than the typical background level.

3.4. Thermal Groundwaters

We report here on some selected data from two wells (namely Camping Sicilia and Bambara in Figure 1) that showed the most significant variations during the present crisis. The two water wells show different chemical-physical features, with temperatures in the ranges 22°–30° and 47°–55 °C, pH in the ranges 5.3–5.5 and 6.1–8.0, salinity in the ranges 800–1400 and 2300–15,500 mgL−1 and the TDIC in the ranges 44–80 and 5–43 meqL−1 for Bambara and Camping Sicilia, respectively.
Figure 12 shows the time trends of water temperatures, EC, TDIC, WTE, and Cl/SO4 ratios, from June 2020 to April 2022, obtained from both discrete and continuous measurements. The anomalies detected in the waters of the two wells were different in intensity and not simultaneous. In particular, the first anomalous values were recorded in the Camping Sicilia well on 17 September, while in the Bambara well for around half of October (Figure 12a–c). The most-significant variations in both water wells were recorded in salinity, WTE, TDIC, and Cl/SO4 ratios (Figure 12b–e). In particular, a drastic increase in TDIC was observed, by ten times in the Camping Sicilia well, and double in the Bambara well. Coeval variations, although of lower amplitude, were recorded in the values of EC and Cl/SO4 ratio (Figure 12b,c,e). Additionally, a significant increase in water temperature was measured in Camping Sicilia, which showed an increase from 51 °C in September 2021 to 55 °C in November (Figure 12a).
After November, some parameters decreased significantly, as the WTE in both sites (Figure 12c), while others showed a smoother decrease or remained nearly constant (e.g., water temperature and TDIC in the Camping Sicilia well, Figure 12a,d).

3.5. Seismic Activity

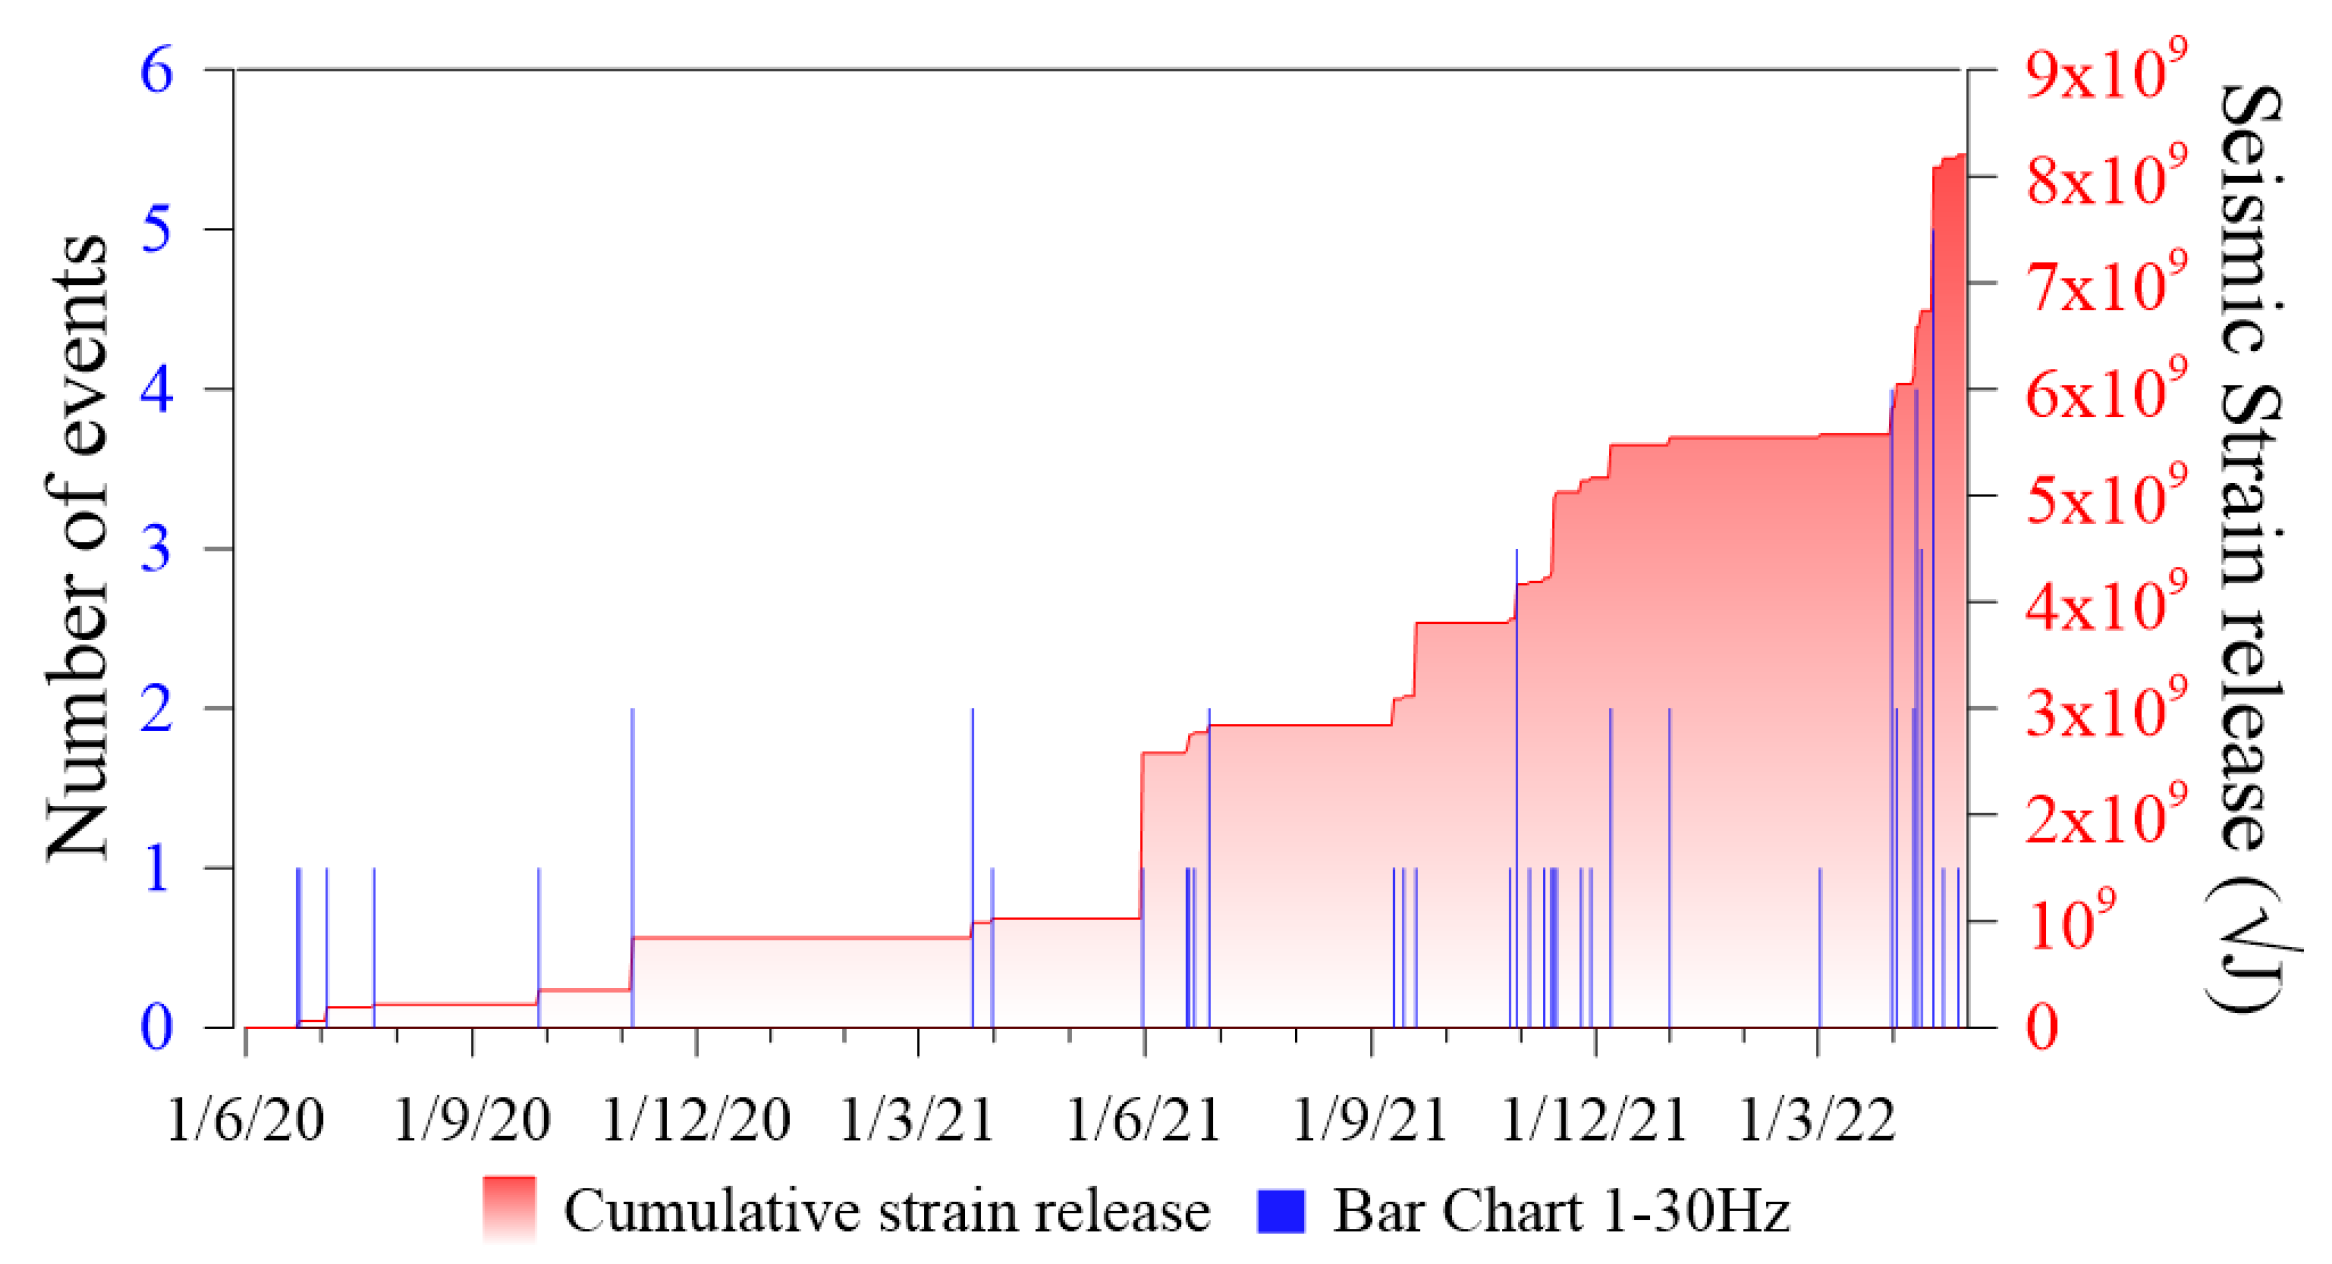
3.5.1. Seismo-Volcanic Activity

Starting from 6 September 2021, there was a significant increase in seismo-volcanic events. The rate of occurrence of seismic events in the frequency bands of 1–30 Hz and <1 Hz increased rapidly (Figure 13a,b). The peculiar and most evident feature of this seismicity was the very low-frequency content in the band of very long period events (frequency peak ~0.3 Hz). Nevertheless, waveforms often exhibited superimposed higher frequency peaks (3–5 Hz). Seismicity above and below 1 Hz remained at high values of occurrence rate during the first month, with maximum values of 33 (24 September) and 78 (29 September) events per day, respectively. From November 2021 on, there was a gradual decrease in the seismicity above 1 Hz; conversely, the rate of occurrence of seismic events below 1 Hz had a fluctuating trend, with high values until mid-December, followed by a moderate decrease until the end of April 2022.
To meet monitoring and surveillance needs, a real-time automatic system for the detection, characterization, and source location of the events with a VLP component was implemented (see Section 2.8). This analysis allowed us to detect their source north of the La Fossa cone, in the Forgia Vecchia, at an altitude between −1.5 and 0.5 km, with an average value of −0.950 + −0.27 km (Figure 14).
Moreover, the time series of longitude, latitude, and depth (Figure 15) demonstrate that the VLP source was very stable and did not undergo variations in position during the whole period analyzed.

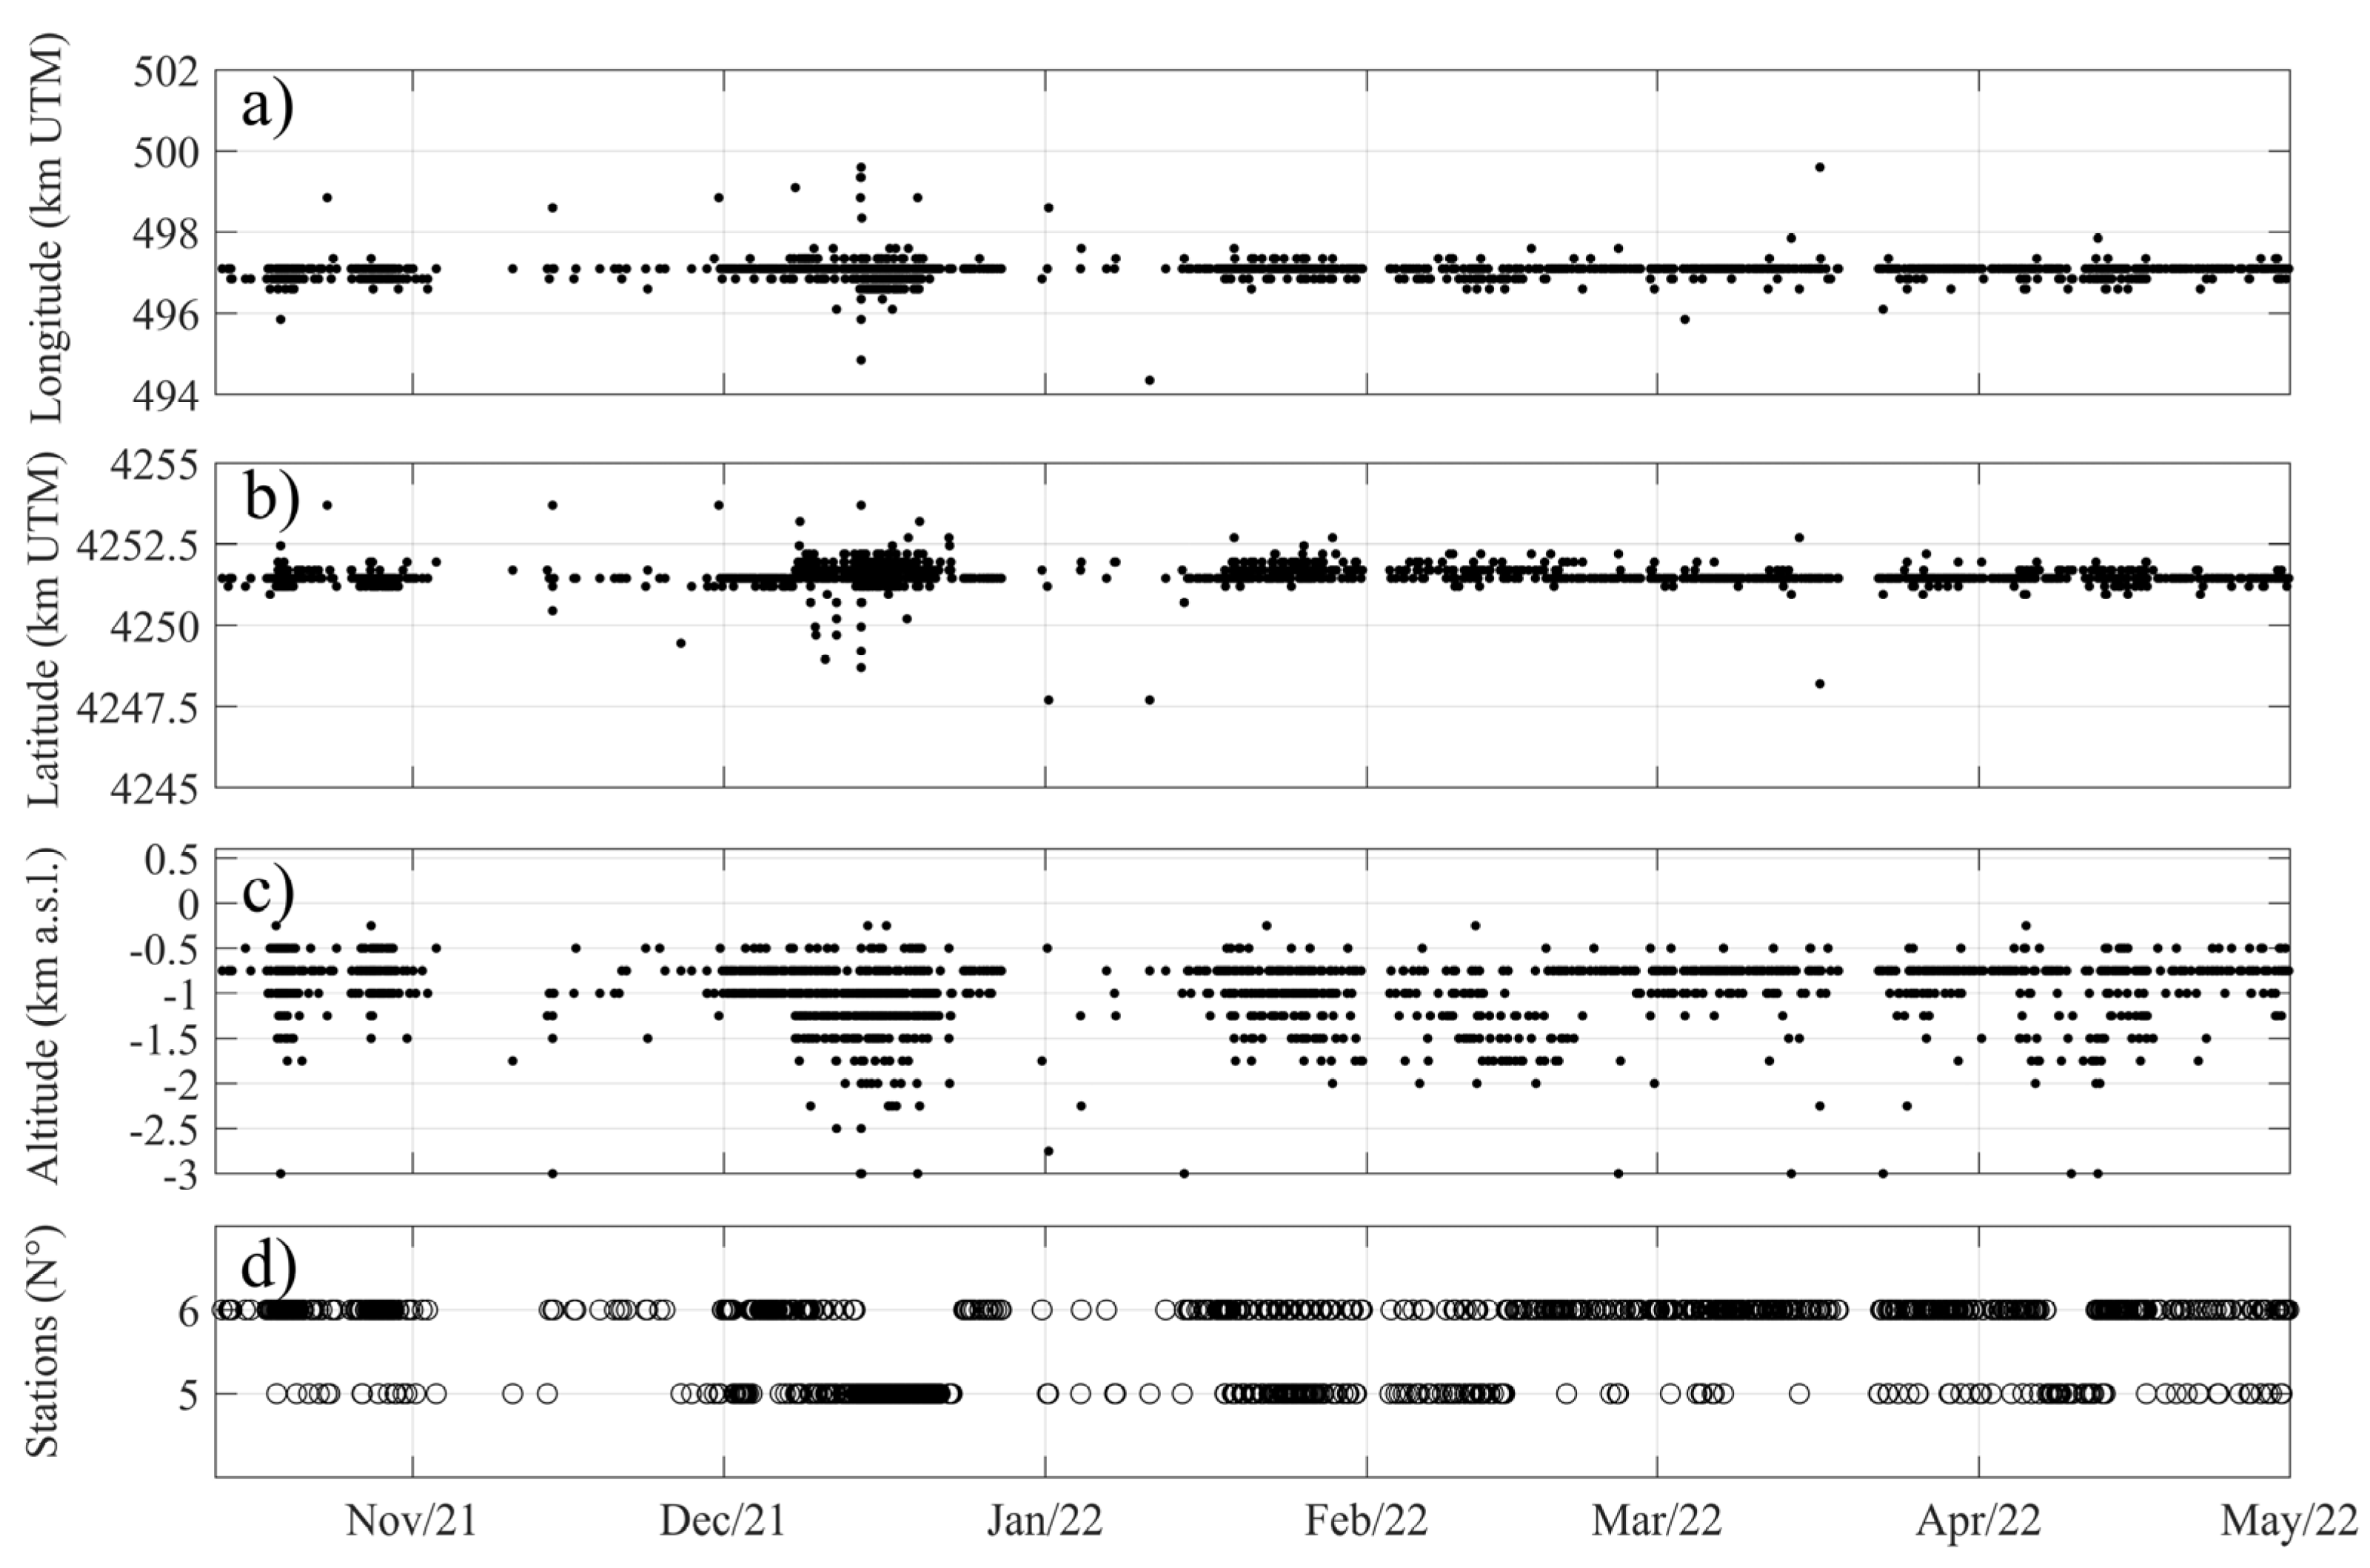
3.5.2. Volcano-Tectonic Activity

We analyzed the volcano-tectonic (VT) seismicity with a local magnitude (ML) ≥ 1 localized in the Vulcano area (coordinates 38.32N–14.84E and 38.48N–15.07E) from 1 June 2020 to 30 April 2022 (Figure 16).
A total of 57 earthquakes with ML between 1 and 3 were localized in the depth range of 2–15 km (Figure 17).
From 1 June 2020 to 27 October 2021, the seismicity was at a low level (only 20 earthquakes in a year and a half) and mainly affected a sector offshore to the W and SW of the island at depths between 5 and 12 km. The largest energy release was due to an earthquake that occurred at 1:16 pm on May 31 with ML3. The fault plane solution computed for this earthquake highlights a source mechanism presumably related to a left-lateral movement along a NW-SE-oriented fault, in agreement with the geodynamic framework of the region (Figure 17).
Subsequently, the occurrence rate and the strain release showed a moderate increase in all the sea sectors to the NW and N of the island, involving shallower levels within the first 5 km of depth (Figure 17). In particular, a low-energy cluster of earthquakes (Mmax 1.9) affected a focal volume located offshore of Vulcanello (Porto di Levante area) on 30 October, in a depth interval between 3 and 4 km b.s.l. (Figure 17). Only three earthquakes exceeded ML1. This shallow seismicity continued until December 2021, with low values of occurrence rate and strain release. After a period of calm, a renewal of seismicity occurred in March 2022 (Figure 16 and Figure 17). The hypocentral locations of these earthquakes were mainly in the central and southern parts of the island and offshore (towards the east) and involved deeper levels (5–11 km b.s.l.) than the previous ones.

3.6. Ground Deformation
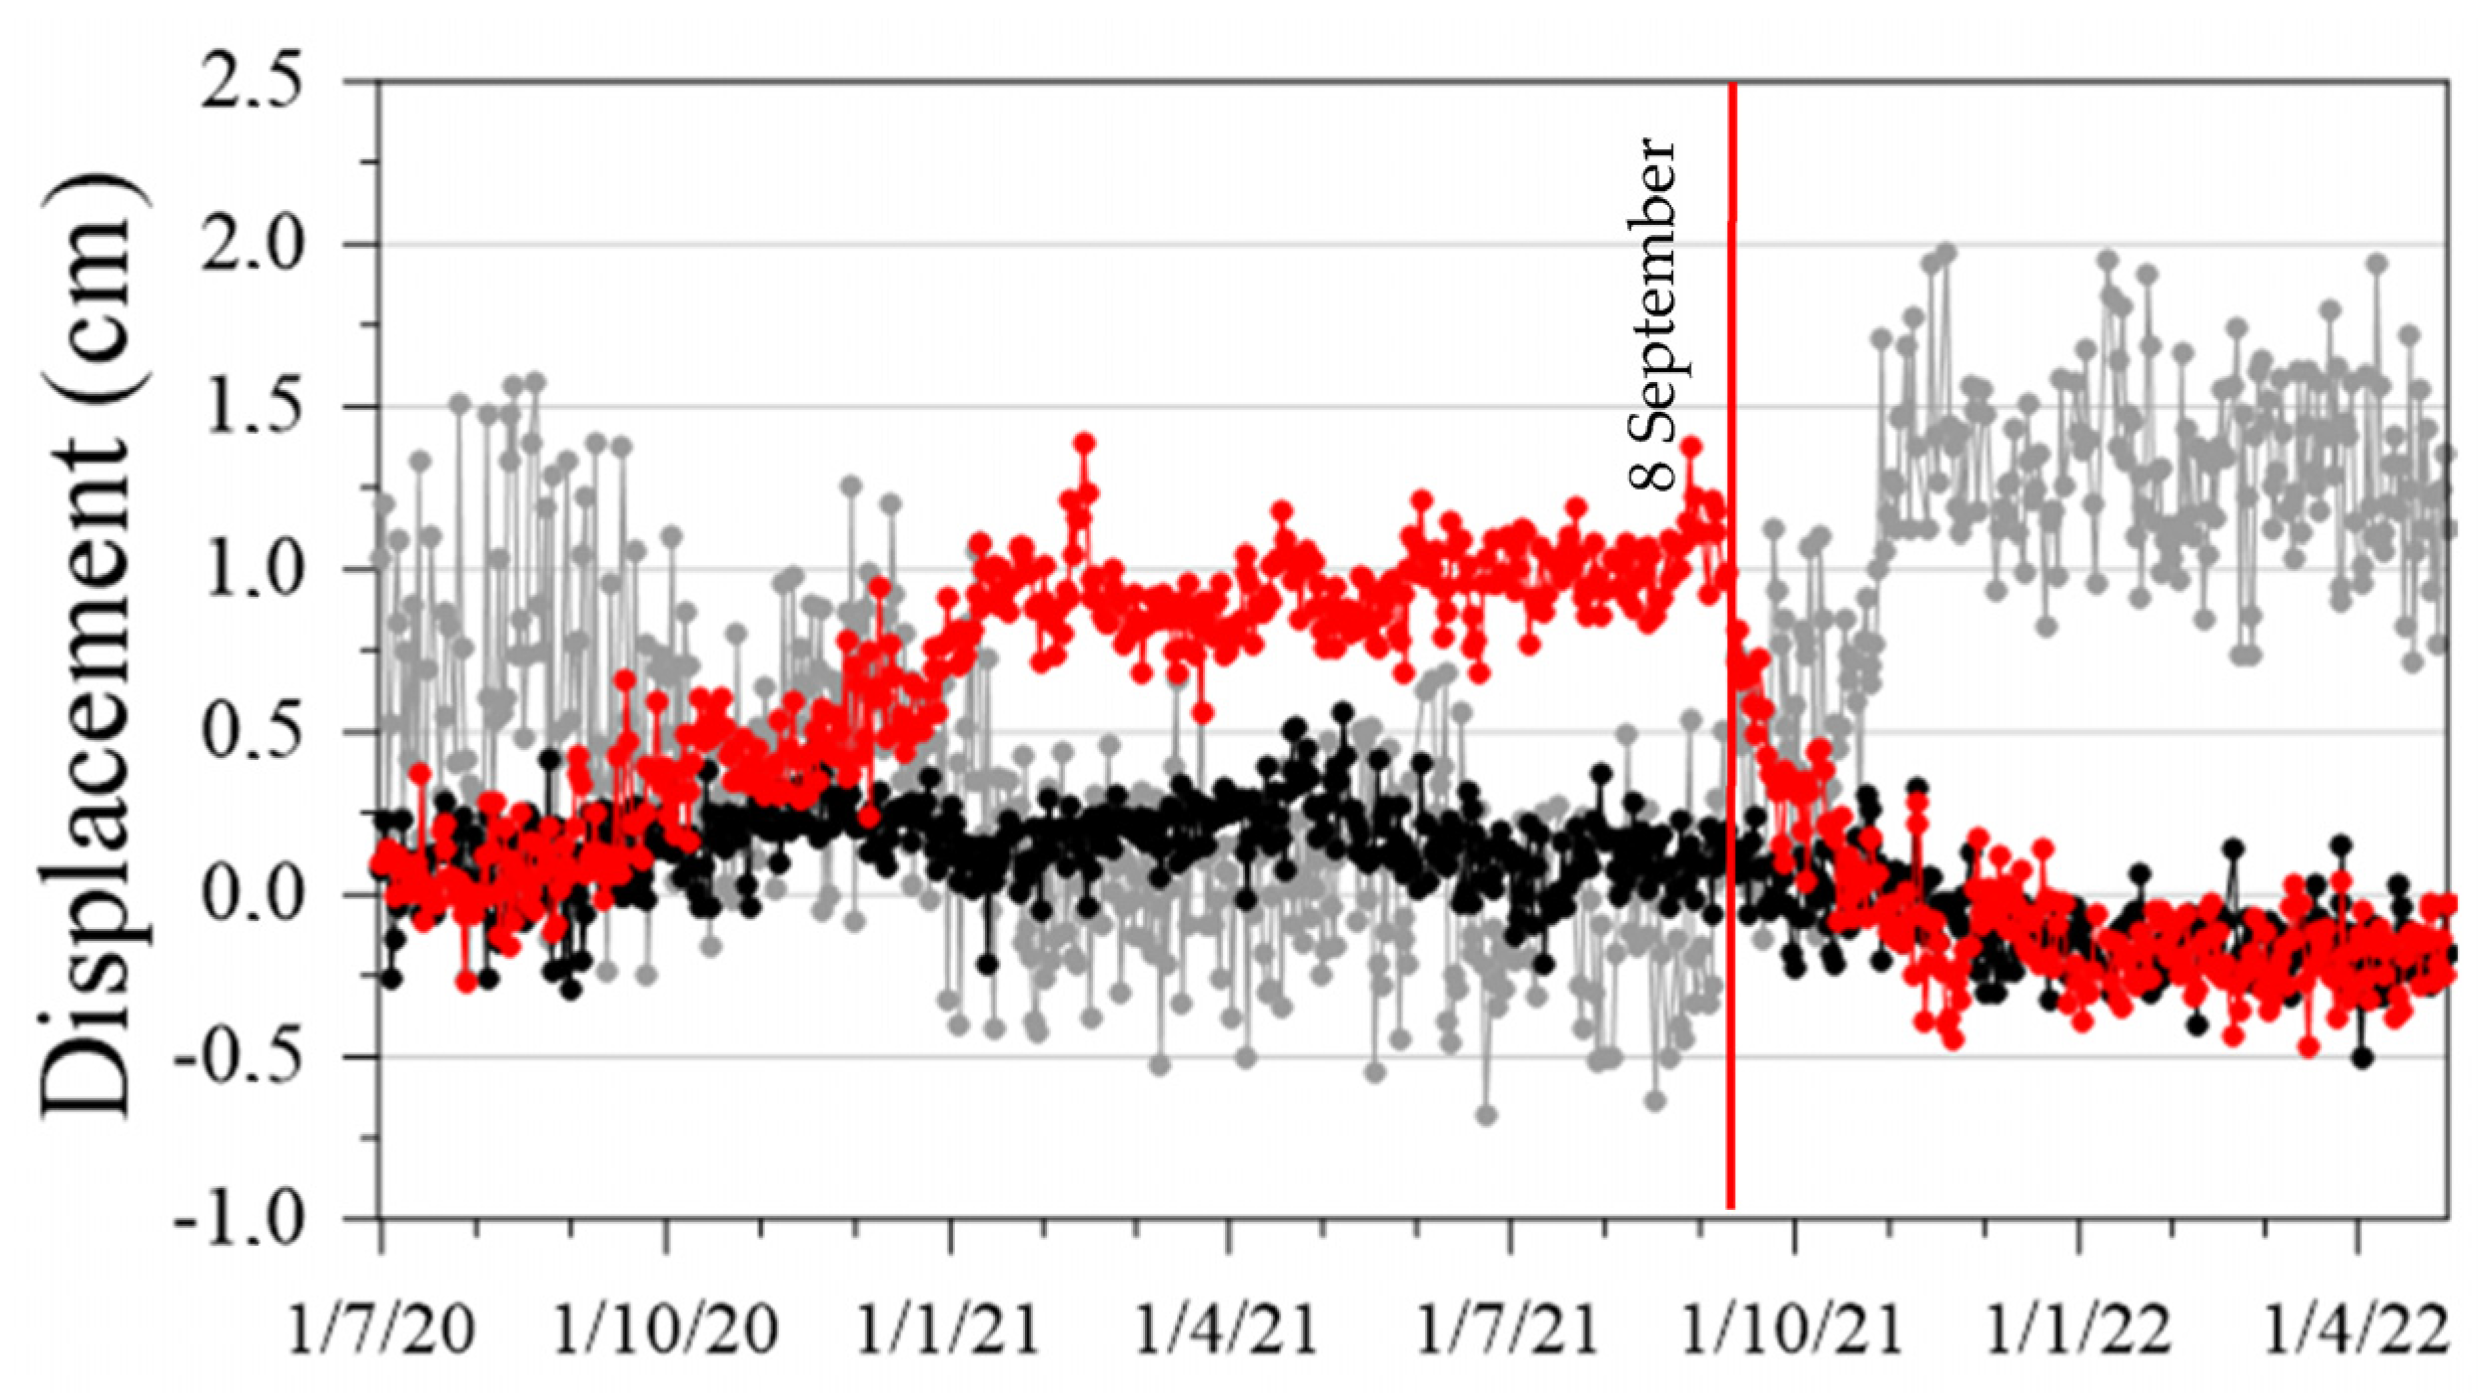
3.6.1. GNSS

Since the first half of September 2021, the GNSS permanent network has measured changes in the deformation pattern. A phase of uplift started, as shown by the vertical component of IVLT (Figure 18), accompanied by changes in the trend of the horizontal components. Indeed, the GNSS stations started to move in a radial direction away from the La Fossa crater area, as testified by the IVLT station that started moving southwest (Figure 18). The north component of IVLT displaced by about 1.5 cm until the first half of November 2021 and showed an uplift of about 2 cm.
Between September and the first half of November 2021, all GNSS data showed a dilatation trend and an uplift of some centimeters of the La Fossa cone area. Subsequently, the network did not measure any further significant movement.

3.6.2. Tiltmeters

Figure 19 reports the radial signal of SLT (10 m deep) that represents the station with the best signal-to-noise ratio. The SLT sensor is at an almost constant temperature; thus, the signals have low noise, with low seasonal effects related to temperature.
Starting from 13 September, we observed a trend of variation showing a tilt increase (ca. 5 microrads) that suggests an inflation of the La Fossa cone. This variation stopped on 11 October; successively, a new short inflating phase (ca. 1.5 microrads) was recorded between 20 November and 6 December. After this date, no other significant change was recorded.

3.6.3. Continuous Gravity Measurements

Continuous gravity observations, performed between October 2021 and April 2022 (Figure 20a), showed several episodes of strong and sudden variations, with amplitudes of about 15 µGal and a dominant period over tens of minutes. These variations occurred most frequently in mid-December 2021 and affected alternately only one or two of the three stations simultaneously, spaced a few hundred meters from each other; the greatest amplitudes are always observed at the VSOCR station. Figure 20b shows an example of this kind of variation that occurred on 29 November, affecting the VSOCR and VPORT stations.
Apart from those anomalies, the most striking feature in the gravity time series from Vulcano stations is the presence of fast transients, with a period of 3-4 minutes and a maximum amplitude of about 15 µGal (Figure 20c), occurring in temporal correspondence with the VLP seismicity. The occurrence rate of these transients shows a clear cyclicity throughout the period, even if for these events the rate of occurrence is maximum around mid-December 2021.

4. Discussion

Figure 21 shows the time variations of a selection of parameters measured in the La Fossa volcano-hydrothermal system and presented so far. According to the described variations, we propose a breakup of the monitored period in three phases, spanning from 1 February to 8 September 2021 (i.e., phase A), from 8 September to 31 October 2021 (i.e., phase B), and from 1 November onward (i.e., phase C), respectively. Phase A precedes the onset of the crisis, phase B represents the escalation of the crisis, and finally phase C is characterized by persistent anomalies or, in some cases, some trends toward background values. In the following, we provide some clues to the processes underlying the variations observed in the three phases.

4.1. Phase A: 1 February-8 September 2021

As observed, in the first phase (A), the few signals that heralded the onset of the crisis by several months were those related to the fumarole vapor composition and were homogeneous in all the sampled fumaroles, which suggests the efficient drainage of magmatic-hydrothermal fluids. Indeed, the gas species that are considered as chiefly emitted from the magmatic source, namely CO2 and He [6,31], showed a distinct increase already during the March, May, and July 2021 sampling campaigns, although the highest values ever measured refer to the 14 September 2021 samples (Figure 3 and Figure 21b). The magmatic origin of these gases is undoubtedly confirmed by δ13C-CO2, which attains the value of about −0.2‰ (Figure 5a), considered as the marker for the magmatic gas, in the same range as those measured during previous crises [21,84].
A fumarole of the crater rim (TK2) had been already showing an increasing trend since February 2021 (Figure 7 and Figure 21c). Close to TK2, the hottest monitored fumarole (TK3) was also starting a clear positive trend, but with a slower rate than TK2 (Figure 7). Since late June 2021, TK2 had already increased its outlet temperature by about 60°, and by November 2021 both fumaroles on the rim registered the same outlet temperature. Although the temperatures in these sites were significantly lower than the maximum recorded values (>500 °C in 1993–1995), both fumaroles on the rim interrupted a long-lasting decreasing trend, observed since 2014 [27]. These signals were clues of a progressively larger output of vapor associated with the increased contribution of magmatic volatiles (e.g., CO2 and He).

4.2. Phase B: From 8 September to 31 October 2021

During the second phase (B), which lasted a little over a month, most of the monitored parameters showed a steeper rate of increase.
The CO2 concentration in the fumarole vapor during the sampling campaign of 14 September was the highest ever measured, peaking at 28%vol (Figure 21b). At the same time, the R/Ra ratio in the fumaroles showed values as high as 5.87 (Figure 4a), which were compatible with a deep-rooted and poorly evolved magma [85], similar to the one feeding the 1988–93 crisis [6].
The average temperatures of the HTF showed an increased rate of +1.25 °C d−1 from September 9 to October 5, significantly higher than the previous period (phase A), when the rate was +0.62 °C d−1 (Figure 21c). The rate of increase was the strongest ever measured over more than 30 years. The maximum temperatures recorded during this phase were always below the water critical temperature (374 °C), thus confirming that the observed increase in temperature was related to the more extensive vaporization of the hydrothermal system and/or the expansion of higher-enthalpy fluids down to the biphase (vapor-liquid) conditions of the hydrothermal system. The ramp of temperature observed in the HTF testifies to the traveling of hot fluids from the hydrothermal system toward the surface and the progressive heat transfer from fluid-filled fractures to the surrounding rocks.
The number of seismic events with a dominant VLP component rapidly increased on 13 September (21 events) (Figure 21i), reaching the value of 78 events on 29 September. The VLP events were interpreted as the effect of the fluid pressurization within cracks and/or conduits (e.g., [86]). This kind of event has a frequency much lower than the spectral content of micro-shocks typically recorded at the La Fossa Crater (e.g., [46]). The analysis of VLP events allowed us to constrain their source in the northern part of the La Fossa cone, at an altitude between −1.5 and 0.5 km. This depth interval suggests that the VLP seismicity was generated by a sudden release of fluids from the hydrothermal system, hypothesized at a depth of 0.5/−1.5 km [18,29,31,87], which permeated the network of fractures in the northern portion of the cone. The rapid increase in fluid-related seismic events from 8 to 16 September 2021 suggests that they were the final phase of a period of pressure buildup, which probably lasted several months. Indeed, the increase in the concentration of the magmatic gas species and the progressive increase in fumarole temperatures since March 2021 (phase A) would suggest that the increased input of magmatic volatiles would have enhanced the fraction of steam and gas (henceforth vapor) in the hydrothermal system, its pressure buildup and the partial transfer of vapor and heat towards the shallowest portion of the cone.
The sudden release of vapor, which characterized phase B of the analyzed period, is compatible with the positive volume change, due to the vapor expansion, recorded as ground deformation by GNSS (Figure 21h) and tilt systems that highlight an inflation process of the La Fossa cone.
During September 2021, a widening of the system of active fractures and fumaroles was observed, which is closely confirmed by some measurements in the eastern and southern rim of the La Fossa cone, outside the main fumarolic field. As shown in Figure 21d, the soil CO2 flux recorded in the station Bordosud increased by one order of magnitude from early September to mid-October, confirming an increase in the output of volatiles in a wider area.
The larger output of vapor also affected the ground surface usually interested by diffuse degassing and this is confirmed by the variations in the temperatures recorded on a 0.6 m-deep ground profile (VSCS station on the eastern rim, Figure 1), at a distance of about 200 m from the HTF. Indeed, the steam-saturated front rose to the shallowest depth ever measured since 2014 and remained steadily high in the following months (see Figure 8). At this site, Inguaggiato et al. [53,88] also measured a steep increase in the soil CO2 flux.
The massive transfer of vapor toward the surface, along with the ground deformation and the opening of new fractures in a wider sector, may be considered sluggish processes (which climaxed in October 2021, although they began in early September) compared to the sudden release of vapor in the hydrothermal system. As a whole effect, an increase in the output rate of gas, as deduced from the plume measurements of SO2 flux, interested the La Fossa fumarolic field during the second phase, peaking in the first days of November (Figure 21a). Inguaggiato et al. [53] recorded SO2 fluxes as high as 248 td−1 in the period September–December 2021, exceeding by almost an order of magnitude the value of 25 td−1, averaged in the period 2008–2021.
The middle of the second phase and, as we will show in the following, the third phase were characterized by the drastic increase in CO2 degassing at the base of the cone, which varied by two orders of magnitude, in a site located at the northern lower slope of the cone (Rimessa, Figure 11). This sector, the downslope of the Forgia Vecchia crater, roughly corresponds to the estimated epicenters of VLP events. Similarly, the CO2 degassing from the soil, in an area located in the lower western flank of the cone (C. Sicilia, Figure 21g), increased by almost one order of magnitude [82]. This area was already known to be affected by anomalous degassing [23]. Additionally, even in the shallow thermal aquifer, which is essentially fed by rainwater with a variable presence of seawater, there is evidence of the input of deep hydrothermal fluids, especially in this area [28,36,89]. Here, during the 1988–1993 unrest period and, to a lesser extent, in 1996, 2001, and 2018, the chemical-physical features of the aquifer varied according to the variations observed in the crater fumaroles [36,37,90]. Even during the present unrest, water chemistry and chemical-physical parameters in the well Camping Sicilia revealed the increased supply of CO2-rich, Cl-rich hot fluids of volcanic-hydrothermal origin, which mixed with prevailing meteoric water, flowing in the shallow aquifer for half of September 2021 (see Figure 12a,e, and Figure 21f). As suggested by Federico et al. [36], during the period of increased volcano-hydrothermal activity, the biphase hydrothermal system, usually confined in the inner parts of the system of conduits and fractures feeding the fumarolic field, expands towards the peripheral zones and contaminates more extensively the shallow thermal aquifer. The uplift of the water table elevation (WTE), simultaneous to the increase in water temperature, salinity (represented by the electrical conductivity), and the Cl/SO4 ratio (Figure 12) are all coherent with the enhanced supply of deep fluids during the second phase. The Camping Sicilia well is one of the closest to the fumarole feeding system and, therefore, it recorded the earliest and most intense signals derived from deep fluids, compared to the peripheral parts of the shallow thermal aquifer, here represented by the Bambara well (see, for instance, the delay in the time trends of EC in Figure 12b).
The end of the second phase was also characterized by a moderate increase in VT seismicity; however, this remained at a very low level in terms of occurrence rate and energy release compared to the 1988 unrest, when a VT swarm with M ≥ 1.8 (Mmax 2.5) affected the southern part of the island [18,91]. The cluster of shallow earthquakes (H < 5 km) in the Vulcanello area and offshore to the NW of the island, together with the earthquakes located onshore during the third phase, could represent the fragile response to the unrest process that started in September 2021.

4.3. Phase C: From 1 November 2021 Onward

The third phase is marked by either the persistence of anomalies for some parameters or, on the contrary, the gradual or even drastic decrease for others.
The CO2 contents in the fumaroles decreased to values still above 14 mol%, while the carbon isotope composition remained in a range from −0.3 to −0.03 ‰ vs. VPDB, confirming that a significant contribution of magmatic gas was still feeding the fumaroles (Figure 4b and Figure 21b). Similarly, the fumarole temperature, despite drastic and temporary drops due to meteorological events, remained at high values, close to the water critical temperature (Figure 21c). The SO2 fluxes, measured in the plume, although fluctuating, continued to show values of 140−160 td−1 on average, three or four times higher than the values measured in the year preceding the crisis. Outside the main fumarolic field, the soil CO2 fluxes, measured at the site Bordosud, gradually recovered to values as low as 7500 gm2d−1 on a monthly average, remaining still higher by a factor of 2 than that pre-crisis. This evidence could be compatible with a decrease in the areal extent of the degassing area, which drastically widened over the HTF during the second phase.
The ground deformation did not recover pre-crisis values (Figure 21h). Unlike what was observed during previous crises, the ground deformation did not show any deflation, an effect ascribed, in the past, to the massive and unbalanced output of fluids from the hydrothermal aquifer [41]. This could be due to a huge supply of magmatic gas from depth, which sustained the positive ground deformation, or the refilling of the hydrothermal system by shallow marine/meteoric water. The persistent vaporization of the hydrothermal system is confirmed by the fumarole outlet temperatures that, after a positive ramp lasting about one year, show a steady value of 380 °C, close to the water critical temperature. This implies that the continuous energy supply would force the hydrothermal system to conditions where the vapor phase is increasingly important. At the same time, at the base of the cone, the soil CO2 flux was still high, although showing a smooth declining trend (Figure 21g), and the carbon content (TDIC) and the temperature of the shallow thermal aquifer remained high, particularly in the area most affected by the input of fumarolic fluids (Figure 11a and Figure 21). These inferences were indicative of a sustained output of gas and steam from both the fumarolic conduits and the peripheral system of fractures, as confirmed by the repeated phases of increased seismicity, which peaked in December 2021 and January 2022 (Figure 12). The gravity variations observed (Figure 20 and Figure 21j) could have been reasonably triggered by enhanced underground cyclic water-to-vapor transformations and the faster circulation of fluid pockets, which lead to rapid changes in the density profile. According to simulations on multi-phase and multi-component hydrothermal fluids in active volcanic areas, the changes in average fluid density can generate detectable gravity changes [92]. Field observations of gravity changes at Nisyros caldera (Greece) were interpreted as due to variations of the medium density induced by the circulation of high-temperature fluids [93].

4.4. The Processes behind the Unrest

The monitoring parameters discussed so far depict a coherent framework, based on many multidisciplinary observables, where both magmatic and hydrothermal systems are deeply involved. The appearance of magmatic markers, such as CO2 and He, some months before the onset of the “crisis”, is a clear clue that the engine of the crisis was probably an enhanced input of volatiles and possibly heat from the magma source. This enhanced input could have started in a period of relatively low vertical permeability, probably resulting from self-sealing phenomena, favored by the long-lasting cooling of the HTF.
This input of magmatic volatiles is supposed to have triggered the extensive vaporization and expansion of the hydrothermal aquifer, as the deformative pattern (GNSS and tilt) would suggest. In this phase, the possibility of the occurrence of a hydrothermal or phreatic explosion is supposed to have increased significantly (Selva et al., 2020). The fluid-induced rock fracturing could have opened new ways for fluid ascent or re-opened sealed fractures, thus enlarging the exhaling area on the rim and within the La Fossa crater. Actually, the IR imaging of the La Fossa cone, performed in November 2018, revealed a high-temperature area 10 times larger than the active fumarole region, thus evidencing the presence of a system of minor fractures, compared to the fumarolic channels, which may reactivate and enlarge during crises [94]. Indeed, the campaigns performed during the crisis highlighted the development of new vents, the enlarging of the existing ones, and the creation of a net-shaped thermal anomaly network [95]. These findings confirm the data on CO2 degassing on the southern rim of La Fossa (Figure 21g), and the enhanced vapor flux in the station VSCS, southeast of the main fumarolic field, testified by the shallower depth of the vapor condensation front in the sub-surface (Figure 8).
The rock fracturing probably induced a pressure drop that, coupled with the contemporary enhanced heat input, could have favored the boiling of the shallow hydrothermal system, including the condensed fluids circulating in the permeable levels of the cone [96], and a large amount of water vapor discharged mostly during the main phase (phase B) of the present crisis.
At the base of the cone, the CO2 emission, although starting to increase in the first decade of September 2021, showed a marked acceleration in the last days of September and peaked in late October, one month after the beginning of the unrest (Figure 21g). The huge emission of soil gas in the inhabited area of Vulcano Porto also increased the CO2 concentration in the air and, as a consequence, the gas hazard in those areas, which required the adoption of some restrictive measures of civil protection [82]. We suggest that the massive emission of gas at the base of the cone occurred after an initial period of huge discharge of vapor from both the fumarolic channels and the newly opened fractures, which could have dropped the shallow pore pressure while the deep one was still high, thus increasing the pressure gradient and then the gas flux. The decrease in pore pressure is also testified by the decrease in the water table head observed in the thermal wells, which also caused a drastic change in salinity (i.e., EC) in Camping Sicilia, due to the diversion of (still) hot but less saline fluids towards the Camping Sicilia well (Figure 21e).
Even though the CO2 output was slowly declining after October 2021, as suggested by the soil CO2 emission on the crater rim (Figure 21), outside the HTF field the CO2 emitted from the fumarole was still of magmatic origin, according to the C isotope composition (Figure 3). The reduced CO2 content in the fumarolic vapor could be compatible with a higher contribution of steam, which sustained the thermal anomaly in the crater rim and in the Camping Sicilia thermal well even during the third phase, and possibly deriving from the persistent vaporization and expansion of the hydrothermal aquifer, as the VLP seismicity and deformation data would indicate. Although minor compared to September-October 2021 (phase A), the mass output of CO2 and SO2 was still high and well above the background values during the third phase. We also observe that the SO2 mass output reached the highest values after November 2021. The origin of sulfur in the Vulcano fumaroles has been supposed to have derived from the mobilization of sulfur-bearing solid phases in the deep portions of the feeding system rather than from the magmatic degassing [97]. As this process is enhanced by the increasing temperature, similarly we expect the progressive release of sulfur following the increased steam output, as actually suggested by SO2 flux (Figure 21a).

5. Conclusions

The multidisciplinary monitoring of the La Fossa volcano, operative since the 1980s, allowed us to closely track the onset and evolution of the current unrest and ascertain the presence of some anticipatory signals some months before its outbreak in mid-September 2021. In particular, since March 2021, the appearance of some magmatic markers, namely CO2 and He contents and the C isotope composition of CO2, was detected in the fumarolic vapor, while they reached their maximum in September 2021. These variations were concurrent with a progressive increase in fumarole gas outlet temperatures; those signals were compatible with an enhanced input of gas and heat from the magmatic source in the hydrothermal system, which was later vaporized during the acme of the crisis. Indeed, the compelling variations in seismic signals and ground deformations, measured in a few days in mid-September 2021, were compatible with the sudden vaporization and expansion of the hydrothermal system, which had already received an oversupply of heat and vapor from the magmatic source during a period lasting some months, according to the record reported here. The massive release of gas and steam from both the magmatic and hydrothermal sources was detected as an increased output of gas from the crater fumaroles and from a wider area outside the HTF, probably as an effect of the re-opening of sealed fractures and the creation of new ones. Additionally, the huge amount of vapor released from the magmatic-hydrothermal sources also impacted the shallow thermal aquifer, where variations of temperature, salinity, and WTE were detected. Somewhat differently from the other parameters, the CO2 degassing at the base of the cone showed a drastic increase in early October and peaked in November, which also caused some health concerns for the inhabitants of Vulcano Porto village. From November 2021, some of the monitored parameters showed discontinuous trends toward background values, while others remained steady. The observed trends were coherent with a long-lasting phase of pressure buildup in the hydrothermal system, driven by the enhanced supply of magmatic gases, until the breakthrough of the crisis in mid-September 2021. The huge emission of fluids until late October 2021 probably caused a pressure drop and the smooth exhaustion of anomalies, although the presence of the magmatic supply is still evident at the time of this report, as evidenced by geochemical parameters. This work demonstrates the importance of a multidisciplinary approach aimed at ascertaining the processes behind the observed variations that occur during the evolution of an unrest. This becomes crucial in the evaluation of a multihazard scenario, where the eventual occurrence of a magmatic eruption is only one of the possible risks, in addition to the gas hazard and the possibility of phreatic explosions.

Supplementary Materials

The following supporting information can be downloaded at: https://www.mdpi.com/article/10.3390/rs15051405/s1: Table S1: Fumarole composition; Table S2: Fumarole temperature; Table S3: SO2 flux; Table S4: Soil CO2 fluxes; Table S5: Well chemistry; Table S6: Continuous data in wells; Table S7: Regional seismicity; Table S8: Local seismicity; Table S9: GNSS; Table S10: Tilt; Table S11: Gravimetric data.

Author Contributions

Conceptualization, C.F., A.P., S.G., O.C., S.B. (Stefano Branca), I.S.D. and G.C.; Investigation, M.C. (Marco Camarda), L.L.P., R.M.R.D.M., G.P., I.S.D., L.P., C.F., A.P., O.C, G.S., G.C., A.F.P., A.G., S.B. (Sergio Bellomo) and F.S.; Methodology, G.C., I.S.D. and F.F.; software, M.S., G.D.G., V.B., S.G. F.F. and G.S.; validation, M.C. (Marco Camarda), S.D.G., M.S., G.D.G., V.B., I.S.D., G.C., S.G. and F.F.; formal analysis, S.D.G., M.S., G.D.G., V.B., I.S.D., S.G., F.G. and C.F.; data curation, M.C. (Marco Camarda), S.D.G., M.S., G.D.G., V.B., M.M, T.C., I.S.D., S.G., F.G., G.S., G.C. and F.F.; visualization, C.F., M.C. (Marco Camarda), R.M.R.D.M., G.P., I.S.D., S.G. F.G. and O.C.; writing—original draft preparation, C.F., A.P., S.G., O.C. S.F, M.C. (Marco Camarda) and G.C.; writing—review and editing, C.F., M.S., G.D.G., G.P., R.M.R.D.M., V.B., M.M., L.L.P. G.P., I.S.D., S.G., F.G., S.F., G.S., O.C. and G.C.; supervision, A.P, S.G., O.C., F.I., S.B. (Stefano Branca) and M.C. (Mauro Coltelli). All authors have read and agreed to the published version of the manuscript.

Funding

This research was funded by the INGV-DPC (Istituto Nazionale di Geofisica e Vulcanologia—Italian Civil Protection Department) volcanic surveillance program of Vulcano Island. This study has benefited from funding provided by the Italian Presidenza del Consiglio dei Ministri—Dipartimento della Protezione Civile (OvFu 0304.010). This paper does not necessarily represent DPC official opinion and policies.

Data Availability Statement

Seismic waveform data can be retrieved on the EIDA seismic database, http://eida.ingv.it/it/getdata, accessed on 29 December 2022.

Acknowledgments

The authors wish to thank the technical team of the Istituto Nazionale di Geofisica e Vulcanologia for their help in acquiring and processing data and for their support in field logistics.

Conflicts of Interest

The authors declare no conflict of interest.

References

  1. Allard, P.; Aiuppa, A.; Beauducel, F.; Gaudin, D.; Di Napoli, R.; Calabrese, S.; Parello, F.; Crispi, O.; Hammouya, G.; Tamburello, G. Steam and Gas Emission Rate from La Soufriere Volcano, Guadeloupe (Lesser Antilles): Implications for the Magmatic Supply during Degassing Unrest. Chem. Geol. 2014, 384, 76–93. [Google Scholar] [CrossRef]
  2. Tamburello, G.; Moune, S.; Allard, P.; Venugopal, S.; Robert, V.; Rosas-Carbajal, M.; Deroussi, S.; Kitou, G.-T.; Didier, T.; Komorowski, J.; et al. Spatio-Temporal Relationships between Fumarolic Activity, Hydrothermal Fluid Circulation and Geophysical Signals at an Arc Volcano in Degassing Unrest: La Soufrière of Guadeloupe (French West Indies). Geosciences 2019, 9, 480. [Google Scholar] [CrossRef] [Green Version]
  3. Melián, G.V.; Hernández, P.A.; Pérez, N.M.; Asensio-Ramos, M.; Padrón, E.; Alonso, M.; Padilla, G.D.; Barrancos, J.; Sortino, F.; Sumino, H.; et al. Insights from Fumarole Gas Geochemistry on the Recent Volcanic Unrest of Pico Do Fogo, Cape Verde. Front. Earth Sci. 2021, 9, 631190. [Google Scholar] [CrossRef]
  4. Clocchiatti, R.; Del Moro, A.; Gioncada, A.; Joron, J.L.; Mosbah, M.; Pinarelli, L.; Sbrana, A. Assessment of a Shallow Magmatic System: The 1888–90 Eruption, Vulcano Island, Italy. Bull. Volcanol. 1994, 56, 466–486. [Google Scholar] [CrossRef]
  5. Mercalli, G. I Vulcani Attivi della Terra: Morfologia, Dinamismo, Prodotti, Distribuzione Geografica, Cause; Lampi di Stampa: Milano, Italy, 2011; ISBN 978-88-488-1135-4. [Google Scholar]
  6. Paonita, A.; Federico, C.; Bonfanti, P.; Capasso, G.; Inguaggiato, S.; Italiano, F.; Madonia, P.; Pecoraino, G.; Sortino, F. The Episodic and Abrupt Geochemical Changes at La Fossa Fumaroles (Vulcano Island, Italy) and Related Constraints on the Dynamics, Structure, and Compositions of the Magmatic System. Geochim. Cosmochim. Acta 2013, 120, 158–178. [Google Scholar] [CrossRef]
  7. Mazzuoli, R.; Tortorici, L.; Ventura, G. Oblique Rifting in Salina, Lipari and Vulcano Islands (Aeolian Islands, Southern Italy). Terra Nova 1995, 7, 444–452. [Google Scholar] [CrossRef]
  8. De Astis, G.; Lucchi, F.; Dellino, P.; La Volpe, L.; Tranne, C.; Frezzotti, M.; Peccerillo, A. Geology, Volcanic History and Petrology of Vulcano (Central Aeolian Archipelago). Geol. Soc. Lond. Mem. 2013, 37, 281–349. [Google Scholar] [CrossRef]
  9. Barreca, G.; Bruno, V.; Cultrera, F.; Mattia, M.; Monaco, C.; Scarfì, L. New Insights in the Geodynamics of the Lipari–Vulcano Area (Aeolian Archipelago, Southern Italy) from Geological, Geodetic and Seismological Data. J. Geodyn. 2014, 82, 150–167. [Google Scholar] [CrossRef]
  10. Ruch, J.; Vezzoli, L.; De Rosa, R.; Di Lorenzo, R.; Acocella, V. Magmatic Control along a Strike-Slip Volcanic Arc: The Central Aeolian Arc (Italy): MAGMATISM AND STRIKE-SLIP FAULTING. Tectonics 2016, 35, 407–424. [Google Scholar] [CrossRef] [Green Version]
  11. Selva, J.; Bonadonna, C.; Branca, S.; De Astis, G.; Gambino, S.; Paonita, A.; Pistolesi, M.; Ricci, T.; Sulpizio, R.; Tibaldi, A.; et al. Multiple Hazards and Paths to Eruptions: A Review of the Volcanic System of Vulcano (Aeolian Islands, Italy). Earth-Sci. Rev. 2020, 207, 103186. [Google Scholar] [CrossRef]
  12. Ventura, G.; Vilardo, G.; Milano, G.; Pino, N.A. Relationships among Crustal Structure, Volcanism and Strike–Slip Tectonics in the Lipari–Vulcano Volcanic Complex (Aeolian Islands, Southern Tyrrhenian Sea, Italy). Phys. Earth Planet. Inter. 1999, 116, 31–52. [Google Scholar] [CrossRef]
  13. Gambino, S.; Milluzzo, V.; Scaltrito, A.; Scarfì, L. Relocation and Focal Mechanisms of Earthquakes in the South-Central Sector of the Aeolian Archipelago: New Structural and Volcanological Insights. Tectonophysics 2012, 524–525, 108–115. [Google Scholar] [CrossRef]
  14. Badalamenti, B.; Gurrieri, S.; Hauser, S.; Valenza, M. Ground CO2 Output in the Island of Vulcano during the Period 1984–1988: Gas Hazard and Volcanic Activity Surveillance Implications. Bull. Miner. Rend. Soc. Ital. Miner. Pet. 1988, 43, 893–899. [Google Scholar]
  15. Baubron, J.; Allard, P.; Toutain, J. Diffuse Volcanic Emissions of Carbon Dioxide from Vulcano Island, Italy. Nature 1990, 344, 51–53. [Google Scholar] [CrossRef] [PubMed]
  16. Badalamenti, B.; Gurrieri, S.; Hauser, S.; Parello, F.; Valenza, M. Change in CO2 Output at Vulcano Island during Summer 1988. Acta Vulcanol. 1991, 1, 219–221. [Google Scholar]
  17. Barberi, F.; Neri, G.; Valenza, M.; Villari, L. 1987–1990 Unrest at Vulcano. Acta Vulcanol. 1991, 1, 95–106. [Google Scholar]
  18. Chiodini, G.; Cioni, R.; Falsaperla, S.; Montalto, A.; Guidi, M.; Marini, L. Geochemical and Seismological Investigations at Vulcano (Aeolian Islands) during 1978–1989. J. Geophys. Res. 1992, 97, 11025. [Google Scholar] [CrossRef]
  19. Chiodini, G.; Cioni, R.; Marini, L.; Panichi, C. Origin of the Fumarolic Fluids of Vulcano Island, Italy and Implications for Volcanic Surveillance. Bull. Volcanol. 1995, 57, 99–110. [Google Scholar] [CrossRef]
  20. Chiodini, G.; Frondini, F.; Raco, B. Diffuse Emission of CO2 from the Fossa Crater, Vulcano Island (Italy). Bull. Volcanol. 1996, 58, 41–50. [Google Scholar] [CrossRef]
  21. Capasso, G.; Favara, R.; Inguaggiato, S. Chemical Features and Isotopic Composition of Gaseous Manifestations on Vulcano Island, Aeolian Islands, Italy: An Interpretative Model of Fluid Circulation. Geochim. Cosmochim. Acta 1997, 61, 3425–3440. [Google Scholar] [CrossRef]
  22. Chiodini, G.; Cioni, R.; Guidi, M.; Raco, B.; Marini, L. Soil CO2 Flux Measurements in Volcanic and Geothermal Areas. Appl. Geochem. 1998, 13, 543–552. [Google Scholar] [CrossRef]
  23. Diliberto, I.; Gurrieri, S.; Valenza, M. Relationships between Diffuse CO2 Emissions and Volcanic Activity on the Island of Vulcano (Aeolian Islands, Italy) during the Period 1984–1994. Bull. Volcanol. 2002, 64, 219–228. [Google Scholar] [CrossRef]
  24. Aubert, M.; Diliberto, S.; Finizola, A.; Chébli, Y. Double Origin of Hydrothermal Convective Flux Variations in the Fossa of Vulcano (Italy). Bull. Volcanol. 2008, 70, 743–751. [Google Scholar] [CrossRef]
  25. Carapezza, M.L.; Barberi, F.; Ranaldi, M.; Ricci, T.; Tarchini, L.; Barrancos, J.; Fischer, C.; Perez, N.; Weber, K.; Di Piazza, A.; et al. Diffuse CO2 Soil Degassing and CO2 and H2S Concentrations in Air and Related Hazards at Vulcano Island (Aeolian Arc, Italy). J. Volcanol. Geotherm. Res. 2011, 207, 130–144. [Google Scholar] [CrossRef]
  26. Italiano, F.; Pecoraino, G.; Nuccio, P. Steam Output from Fumaroles of an Active Volcano: Tectonic and Magmatic-hydrothermal Controls on the Degassing System at Vulcano (Aeolian Arc). J. Geophys. Res. Solid Earth 1998, 103, 29829–29842. [Google Scholar] [CrossRef]
  27. Diliberto, I.S. Cyclic Behavior in the Fumaroles Output Detected by Direct Measurement of Temperature of the Ground. Eng. Proc. 2021, 5, 47. [Google Scholar]
  28. Capasso, G.; Favara, R.; Francofonte, S.; Inguaggiato, S. Chemical and Isotopic Variations in Fumarolic Discharge and Thermal Waters at Vulcano Island (Aeolian Islands, Italy) during 1996: Evidence of Resumed Volcanic Activity. J. Volcanol. Geotherm. Res. 1999, 88, 167–175. [Google Scholar] [CrossRef]
  29. Alparone, S.; Cannata, A.; Gambino, S.; Gresta, S.; Milluzzo, V.; Montalto, P. Time-Space Variation of Volcano-Seismic Events at La Fossa (Vulcano, Aeolian Islands, Italy): New Insights into Seismic Sources in a Hydrothermal System. Bull. Volcanol. 2010, 72, 803–816. [Google Scholar] [CrossRef]
  30. Granieri, D.; Carapezza, M.L.; Chiodini, G.; Avino, R.; Caliro, S.; Ranaldi, M.; Ricci, T.; Tarchini, L. Correlated Increase in CO2 Fumarolic Content and Diffuse Emission from La Fossa Crater (Vulcano, Italy): Evidence of Volcanic Unrest or Increasing Gas Release from a Stationary Deep Magma Body? Geophys. Res. Lett. 2006, 33, L13316. [Google Scholar] [CrossRef]
  31. Nuccio, P.; Paonita, A.; Sortino, F. Geochemical Modeling of Mixing between Magmatic and Hydrothermal Gases: The Case of Vulcano Island, Italy. Earth Planet. Sci. Lett. 1999, 167, 321–333. [Google Scholar] [CrossRef]
  32. Carapezza, M.; Dongarrà, G.; Hauser, S.; Longinelli, A. Preliminary Isotopic Investigation on Thermal Waters from Vulcano Island, Italy. Mineral. Petrogr. Acta 1983, 27, 221–232. [Google Scholar]
  33. Capasso, G.; Dongarrà, G.; Favara, R.; Hauser, S.; Valenza, M. Isotope Composition of Rain Water, Well Water and Fumarole Steam on the Island of Vulcano, and Their Implications for Volcanic Surveillance. J. Volcanol. Geotherm. Res. 1992, 49, 147–155. [Google Scholar] [CrossRef]
  34. Bolognesi, L.; D’Amore, F. Isotopic Variation of the Hydrothermal System on Vulcano Island, Italy. Geochim. Cosmochim. Acta 1993, 57, 2069–2082. [Google Scholar] [CrossRef]
  35. Aiuppa, A.; Dongarrà, G.; Capasso, G.; Allard, P. Trace Elements in the Thermal Groundwaters of Vulcano Island (Sicily). J. Volcanol. Geotherm. Res. 2000, 98, 189–207. [Google Scholar] [CrossRef]
  36. Federico, C.; Capasso, G.; Paonita, A.; Favara, R. Effects of Steam-Heating Processes on a Stratified Volcanic Aquifer: Stable Isotopes and Dissolved Gases in Thermal Waters of Vulcano Island (Aeolian Archipelago). J. Volcanol. Geotherm. Res. 2010, 192, 178–190. [Google Scholar] [CrossRef]
  37. Capasso, G.; Federico, C.; Madonia, P.; Paonita, A. Response of the Shallow Aquifer of the Volcano-Hydrothermal System during the Recent Crises at Vulcano Island (Aeolian Archipelago, Italy). J. Volcanol. Geotherm. Res. 2014, 273, 70–80. [Google Scholar] [CrossRef]
  38. Falsaperla, S.; Frazzetta, G.; Neri, G.; Nunnari, G.; Velardita, R.; Villari, L. Volcano Monitoring in the Aeolian Islands (Southern Tyrrhenian Sea): The Lipari-Vulcano Eruptive Complex. In Volcanic Hazards; Springer: Berlin/Heidelberg, Germany, 1989; pp. 339–356. [Google Scholar]
  39. Bonforte, A.; Guglielmino, F. Transpressive Strain on the Lipari–Vulcano Volcanic Complex and Dynamics of the “La Fossa” Cone (Aeolian Islands, Sicily) Revealed by GPS Surveys on a Dense Network. Tectonophysics 2008, 457, 64–70. [Google Scholar] [CrossRef]
  40. Mattia, M.; Palano, M.; Bruno, V.; Cannavò, F.; Bonaccorso, A.; Gresta, S. Tectonic Features of the Lipari-Vulcano Complex (Aeolian Archipelago, Italy) from 10 Years (1996–2006) of GPS Data. Terra Nova 2008, 20, 370–377. [Google Scholar] [CrossRef]
  41. Gambino, S.; Guglielmino, F. Ground Deformation Induced by Geothermal Processes: A Model for La Fossa Crater (Vulcano Island, Italy). J. Geophys. Res. 2008, 113, B07402. [Google Scholar] [CrossRef]
  42. Bonaccorso, A.; Bonforte, A.; Gambino, S. Thermal Expansion-Contraction and Slope Instability of a Fumarole Field Inferred from Geodetic Measurements at Vulcano. Bull. Volcanol. 2010, 72, 791–801. [Google Scholar] [CrossRef]
  43. Harris, A.; Alparone, S.; Bonforte, A.; Dehn, J.; Gambino, S.; Lodato, L.; Spampinato, L. Vent Temperature Trends at the Vulcano Fossa Fumarole Field: The Role of Permeability. Bull. Volcanol. 2012, 74, 1293–1311. [Google Scholar] [CrossRef]
  44. Latter, J.H. Near Surface Seismicity of Vulcano, Aeolian Islands, Sicily. Bull. Volcanol. 1971, 35, 117–126. [Google Scholar] [CrossRef]
  45. Milluzzo, V.; Cannata, A.; Alparone, S.; Gambino, S.; Hellweg, M.; Montalto, P.; Cammarata, L.; Diliberto, I.S.; Gresta, S.; Liotta, M.; et al. Tornillos at Vulcano: Clues to the Dynamics of the Hydrothermal System. J. Volcanol. Geotherm. Res. 2010, 198, 377–393. [Google Scholar] [CrossRef]
  46. Cannata, A.; Diliberto, I.S.; Alparone, S.; Gambino, S.; Gresta, S.; Liotta, M.; Madonia, P.; Milluzzo, V.; Aliotta, M.; Montalto, P. Multiparametric Approach in Investigating Volcano-Hydrothermal Systems: The Case Study of Vulcano (Aeolian Islands, Italy). Pure Appl. Geophys. 2012, 169, 167–182. [Google Scholar] [CrossRef]
  47. Alparone, S.; Bonforte, A.; Gambino, S.; Guglielmino, F.; Obrizzo, F.; Velardita, R. Dynamics of Vulcano Island (Tyrrhenian Sea, Italy) Investigated by Long-Term (40 Years) Geophysical Data. Earth-Sci. Rev. 2019, 190, 521–535. [Google Scholar] [CrossRef]
  48. Mattia, M.; Palano, M.; Bruno, V.; Cannavò, F. Crustal Motion along the Calabro-Peloritano Arc as Imaged by Twelve Years of Measurements on a Dense GPS Network. Tectonophysics 2009, 476, 528–537. [Google Scholar] [CrossRef]
  49. Berrino, G.; Corrado, G.; Luongo, G. Gravity Changes and Dynamics of the Aeolian Islands. Rendiconti Della Soc. Ital. Mineral. E Petrogr. 1988, 43, 935–946. [Google Scholar]
  50. Berrino, G. Combined Gravimetry in the Observation of Volcanic Processes in Southern Italy. J. Geodyn. 2000, 30, 371–388. [Google Scholar] [CrossRef]
  51. Di Maio, R.; Berrino, G. Joint Analysis of Electric and Gravimetric Data for Volcano Monitoring. Application to Data Acquired at Vulcano Island (Southern Italy) from 1993 to 1996. J. Volcanol. Geotherm. Res. 2016, 327, 459–468. [Google Scholar] [CrossRef]
  52. Camarda, M.; De Gregorio, S.; Capasso, G.; Di Martino, R.M.; Gurrieri, S.; Prano, V. The Monitoring of Natural Soil CO2 Emissions: Issues and Perspectives. Earth-Sci. Rev. 2019, 198, 102928. [Google Scholar] [CrossRef]
  53. Inguaggiato, S.; Vita, F.; Diliberto, I.S.; Mazot, A.; Calderone, L.; Mastrolia, A.; Corrao, M. The Extensive Parameters as a Tool to Monitoring the Volcanic Activity: The Case Study of Vulcano Island (Italy). Remote Sens. 2022, 14, 1283. [Google Scholar] [CrossRef]
  54. Diliberto, I.S. Long-Term Variations of Fumarole Temperatures on Vulcano Island (Italy). Ann. Geophys. 2011, 54, 175–185. [Google Scholar]
  55. Diliberto, I.S. Time Series Analysis of High Temperature Fumaroles Monitored on the Island of Vulcano (Aeolian Archipelago, Italy). J. Volcanol. Geotherm. Res. 2013, 264, 150–163. [Google Scholar] [CrossRef]
  56. Inguaggiato, S.; Diliberto, I.S.; Federico, C.; Paonita, A.; Vita, F. Review of the Evolution of Geochemical Monitoring, Networks and Methodologies Applied to the Volcanoes of the Aeolian Arc (Italy). Earth-Sci. Rev. 2018, 176, 241–276. [Google Scholar] [CrossRef]
  57. Capasso, G.; Inguaggiato, S.; Nuccio, P.; Pecoraino, G.; Sortino, F. Compositional Evolution of the Fumarolic Gases Emitted at the Crater of Vulcano during 1987–1993. In Proceedings of the Independent Publishers Group World Organization of Volcano Observatories Meeting, Guadalupe, CA, USA, 13–17 December 1993; pp. 13–17. [Google Scholar]
  58. Taylor, J. Introduction to Error Analysis, the Study of Uncertainties in Physical Measurements; University Science Books: New York NY, USA, 1997; ISBN 0-935702-42-3. [Google Scholar]
  59. Salerno, G.G.; Burton, M.R.; Oppenheimer, C.; Caltabiano, T.; Randazzo, D.; Bruno, N.; Longo, V. Three-Years of SO2 Flux Measurements of Mt. Etna Using an Automated UV Scanner Array: Comparison with Conventional Traverses and Uncertainties in Flux Retrieval. J. Volcanol. Geotherm. Res. 2009, 183, 76–83. [Google Scholar] [CrossRef] [Green Version]
  60. Salerno, G.; Burton, M.; Oppenheimer, C.; Caltabiano, T.; Tsanev, V.; Bruno, N. Novel Retrieval of Volcanic SO2 Abundance from Ultraviolet Spectra. J. Volcanol. Geotherm. Res. 2009, 181, 141–153. [Google Scholar] [CrossRef]
  61. Camarda, M.; Gurrieri, S.; Valenza, M. CO2 Flux Measurements in Volcanic Areas Using the Dynamic Concentration Method: Influence of Soil Permeability: CO2 Flux Measurements Using the Dynamic Method. J. Geophys. Res. Solid Earth 2006, 111, B05202. [Google Scholar] [CrossRef] [Green Version]
  62. Sicardi, L. Il recente ciclo dell’ attività fumarolica dell’ isola di Vulcano. Bull. Volcanol. 1940, 7, 85–139. [Google Scholar] [CrossRef]
  63. Patanè, D.; Tusa, G.; Yang, W.; Astuti, A.; Colino, A.; Costanza, A.; D’Anna, G.; Di Prima, S.; Fertitta, G.; Mangiagli, S.; et al. The Urban Seismic Observatory of Catania (Italy): A Real-Time Seismic Monitoring at Urban Scale. Remote Sens. 2022, 14, 2583. [Google Scholar] [CrossRef]
  64. Barberi, G.; Di Grazia, G.; Ferrari, F.; Giampiccolo, E.; Maiolino, V.; Mostaccio, A.; Musumeci, C.; Scaltrito, A.; Sciotto, M.; Tusa, G.; et al. Mt. Etna Revised Seismic Catalog from 2020 (EtnaRSC2020) 2020, 500 MB; Istituto Nazionale di Geofisica e Vulcanologia: Rome, Italy, 2020. [Google Scholar]
  65. Lahr, J.C. HYPOELLIPSE/Version 2.0; a Computer Program for Determining Local Earthquake Hydrocentral Parameters, Magnitude, and First Motion Pattern; US Geological Survey: Reston, VA, USA, 1989. [Google Scholar]
  66. Jeffreys, H.; Bullen, K.E. Seismological Tables: Office of the British Association; Burlington House: London, UK, 1958. [Google Scholar]
  67. Reasenberg, P.; Oppenheimer, D. FPFIT, FPPLOT and FPPAGE: FORTRAN Computer Programs for Calculating and Displaying Earthquake Fault-Plane Solutions. U.S. Geol. Surv. Open-File Rep. 1985, 85–739. [Google Scholar] [CrossRef]
  68. Cannata, A.; Di Grazia, G.; Aliotta, M.; Cassisi, C.; Montalto, P.; Patanè, D. Monitoring Seismo-Volcanic and Infrasonic Signals at Volcanoes: Mt. Etna Case Study. Pure Appl. Geophys. 2013, 170, 1751–1771. [Google Scholar] [CrossRef]
  69. Trnkoczy, A. Understanding and Parameter Setting of STA/LTA Trigger Algorithm. In New Manual of Seismological Observatory Practice (NMSOP); Deutsches GeoForschungsZentrum GFZ: Potsdam, Germany, 2012; 20p. [Google Scholar] [CrossRef]
  70. Kawakatsu, H.; Kaneshima, S.; Matsubayashi, H.; Ohminato, T.; Sudo, Y.; Tsutsui, T.; Uhira, K.; Yamasato, H.; Ito, H.; Legrand, D. Aso94: Aso Seismic Observation with Broadband Instruments. J. Volcanol. Geotherm. Res. 2000, 101, 129–154. [Google Scholar] [CrossRef]
  71. Almendros, J.; Chouet, B. Performance of the Radial Semblance Method for the Location of Very Long Period Volcanic Signals. Bull. Seismol. Soc. Am. 2003, 93, 1890–1903. [Google Scholar] [CrossRef]
  72. Hering, T.A.; King, R.W.; Floyd, M.A.; McClusky, S.C. GLOBK: Global Kalman Filter VLBI and GPS Analysis Program; Massachusetts Institute of Technology: Cambridge, MA, USA, 2015. [Google Scholar]
  73. Hering, T.A.; King, R.W.; Floyd, M.A.; McClusky, S.C. GAMIT Reference Manual. GPS Analysis at MIT; Massachusetts Institute of Technology: Cambridge, MA, USA, 2018. [Google Scholar]
  74. Altamimi, Z.; Rebischung, P.; Métivier, L.; Collilieux, X. ITRF2014: A New Release of the International Terrestrial Reference Frame Modeling Nonlinear Station Motions: ITRF2014. J. Geophys. Res. Solid Earth 2016, 121, 6109–6131. [Google Scholar] [CrossRef] [Green Version]
  75. Gambino, S.; Campisi, O.; Falzone, G.; Ferro, A.; Guglielmino, F.; Laudani, G.; Saraceno, B. Tilt Measurements at Vulcano Island. Ann. Geophys. 2007, 50, 233–247. [Google Scholar] [CrossRef]
  76. Gambino, S.; Falzone, G.; Ferro, A.; Laudani, G. Volcanic Processes Detected by Tiltmeters: A Review of Experience on Sicilian Volcanoes. J. Volcanol. Geotherm. Res. 2014, 271, 43–54. [Google Scholar] [CrossRef]
  77. Tamburello, G.; Kantzas, E.; McGonigle, A.; Aiuppa, A.; Giudice, G. UV Camera Measurements of Fumarole Field Degassing (La Fossa Crater, Vulcano Island). J. Volcanol. Geotherm. Res. 2011, 199, 47–52. [Google Scholar] [CrossRef]
  78. Vita, F.; Inguaggiato, S.; Bobrowski, N.; Calderone, L.; Galle, B.; Parello, F. Continuous SO2 Flux Measurements for Vulcano Island, Italy. Ann. Geophys. 2012, 55, 301–308. [Google Scholar]
  79. Granieri, D.; Vita, F.; Inguaggiato, S. Volcanogenic SO2, a Natural Pollutant: Measurements, Modeling and Hazard Assessment at Vulcano Island (Aeolian Archipelago, Italy). Environ. Pollut. 2017, 231, 219–228. [Google Scholar] [CrossRef]
  80. Arellano, S.; Galle, B.; Apaza, F.; Avard, G.; Barrington, C.; Bobrowski, N.; Bucarey, C.; Burbano, V.; Burton, M.; Chacón, Z. Synoptic Analysis of a Decade of Daily Measurements of SO 2 Emission in the Troposphere from Volcanoes of the Global Ground-Based Network for Observation of Volcanic and Atmospheric Change. Earth Syst. Sci. Data 2021, 13, 1167–1188. [Google Scholar] [CrossRef]
  81. Di Martino, R.M.R.; Capasso, G.; Camarda, M. Spatial Domain Analysis of Carbon Dioxide from Soils on Vulcano Island: Implications for CO2 Output Evaluation. Chem. Geol. 2016, 444, 59–70. [Google Scholar] [CrossRef]
  82. Di Martino, R.M.R.; Gurrieri, S.; Camarda, M.; Capasso, G.; Prano, V. Hazardous Changes in Soil CO2 Emissions at Vulcano, Italy, in 2021. J. Geophys. Res. Solid Earth 2022, 127, e2022JB024516. [Google Scholar] [CrossRef]
  83. German Aerospace Center. TanDEM-X—Digital Elevation Model (DEM)—Global, 90 m; German Aerospace Center: Cologne, Germany, 2018. [Google Scholar]
  84. Paonita, A.; Favara, R.; Nuccio, P.; Sortino, F. Genesis of Fumarolic Emissions as Inferred by Isotope Mass Balances: CO2 and Water at Vulcano Island, Italy. Geochim. Cosmochim. Acta 2002, 66, 759–772. [Google Scholar] [CrossRef]
  85. Mandarano, M.; Paonita, A.; Martelli, M.; Viccaro, M.; Nicotra, E.; Millar, I.L. Revealing Magma Degassing below Closed-Conduit Active Volcanoes: Geochemical Features of Volcanic Rocks versus Fumarolic Fluids at Vulcano (Aeolian Islands, Italy). Lithos 2016, 248, 272–287. [Google Scholar] [CrossRef]
  86. Chouet, B. Volcano Seismology. Pure Appl. Geophys. 2003, 160, 739–788. [Google Scholar] [CrossRef]
  87. Carapezza, M.; Nuccio, P.; Valenza, M. Genesis and Evolution of the Fumaroles of Vulcano (Aeolian Islands, Italy): A Geochemical Model. Bull. Volcanol. 1981, 44, 547–563. [Google Scholar] [CrossRef]
  88. Inguaggiato, S.; Vita, F.; Diliberto, I.S.; Inguaggiato, C.; Mazot, A.; Cangemi, M.; Corrao, M. The Volcanic Activity Changes Occurred in the 2021–2022 at Vulcano Island (Italy), Inferred by the Abrupt Variations of Soil CO2 Output. Sci. Rep. 2022, 12, 21166. [Google Scholar] [CrossRef]
  89. Capasso, G.; D’Alessandro, W.; Favara, R.; Inguaggiato, S.; Parello, F. Interaction between the Deep Fluids and the Shallow Groundwaters on Vulcano Island (Italy). J. Volcanol. Geotherm. Res. 2001, 108, 187–198. [Google Scholar] [CrossRef]
  90. Di Martino, R.M.R.; Capasso, G.; Camarda, M.; De Gregorio, S.; Prano, V. Deep CO2 Release Revealed by Stable Isotope and Diffuse Degassing Surveys at Vulcano (Aeolian Islands) in 2015–2018. J. Volcanol. Geotherm. Res. 2020, 401, 106972. [Google Scholar] [CrossRef]
  91. Falsaperla, S. Tectonic Seismicity with M >= 1.8 at the Island of Vulcano, Italy, from July to September 1988 (TSV_JS1988); Istituto Nazionale di Geofisica e Vulcanologia: Rome, Italy, 2021. [Google Scholar]
  92. Todesco, M.; Berrino, G. Modeling Hydrothermal Fluid Circulation and Gravity Signals at the Phlegraean Fields Caldera. Earth Planet. Sci. Lett. 2005, 240, 328–338. [Google Scholar] [CrossRef]
  93. Gottsmann, J.; Rymer, H.; Wooller, L. On the Interpretation of Gravity Variations in the Presence of Active Hydrothermal Systems: Insights from the Nisyros Caldera, Greece. Geophys. Res. Lett. 2005, 32, L23310. [Google Scholar] [CrossRef] [Green Version]
  94. Müller, D.; Bredemeyer, S.; Zorn, E.; De Paolo, E.; Walter, T.R. Surveying Fumarole Sites and Hydrothermal Alteration by Unoccupied Aircraft Systems (UAS) at the La Fossa Cone, Vulcano Island (Italy). J. Volcanol. Geotherm. Res. 2021, 413, 107208. [Google Scholar] [CrossRef]
  95. Müller, D.; Pisciotta, A.; Walter, T.R. Structural and Geothermal Changes Mapped by Drone-Based Photogrammetry and Thermal Infrared during the 2021 Volcanic Crisis of Vulcano Island, Sicily. In Proceedings of the 24th EGU General Assembly, Vienna, Austria, 23–27 May 2022. [Google Scholar]
  96. Barde-Cabusson, S.; Finizola, A.; Revil, A.; Ricci, T.; Piscitelli, S.; Rizzo, E.; Angeletti, B.; Balasco, M.; Bennati, L.; Byrdina, S. New Geological Insights and Structural Control on Fluid Circulation in La Fossa Cone (Vulcano, Aeolian Islands, Italy). J. Volcanol. Geotherm. Res. 2009, 185, 231–245. [Google Scholar] [CrossRef] [Green Version]
  97. Di Liberto, V.; Nuccio, P.; Paonita, A. Genesis of Chlorine and Sulphur in Fumarolic Emissions at Vulcano Island (Italy): Assessment of PH and Redox Conditions in the Hydrothermal System. J. Volcanol. Geotherm. Res. 2002, 116, 137–150. [Google Scholar] [CrossRef]
Figure 1. (a) Structural map of the Lipari–Vulcano area redrawn from [7,9,12,13]. The inset reports the ATLFS structure crossing the Aeolian Islands and Sicily. (b) Map of Vulcano Island showing the sites of the permanent and temporary networks operating during the study period. (c) Zoom of the northern part of the island showing the sites where geochemical investigations were performed through discrete campaigns and continuous monitoring.
Remotesensing 15 01405 g001
Figure 2. Two examples of simultaneous temperatures registered at the VSCS station in the air and in the ground profile.
Remotesensing 15 01405 g002
Figure 3. Time trends of (a) CO2 and (b) He in the vapor of fumaroles FA and F11.
Remotesensing 15 01405 g003
Figure 4. Time trends of total sulfur contents in the vapor of fumaroles FA and F11.
Remotesensing 15 01405 g004
Figure 5. Time trends of (a) carbon isotope composition of CO2 in the gas of fumaroles FA and F11 and (b) R/Ra values of He.
Remotesensing 15 01405 g005
Figure 6. Monthly and daily bulk SO2 flux measured in the crater plume between June 2020 and July 2021, and from September 2021 to April 2022, respectively. The red line is a 7-day moving average on the daily SO2 flux.
Remotesensing 15 01405 g006
Figure 7. Outlet temperatures of some selected HTF.
Remotesensing 15 01405 g007
Figure 8. Depth of the condensation level under the VSCS monitoring station, retrieved from the recorded ground temperature profile. The background level (gray area) was calculated from the hourly record during a period of background degassing (June 2018–June 2019, average value, and standard deviation [53]).
Remotesensing 15 01405 g008
Figure 9. Temporal variation of soil CO2 flux from June 2020 to April 2022. Each point is the average value of 53 flux measurements performed in the area of Vulcano Porto and at the base of the La Fossa cone.
Remotesensing 15 01405 g009
Figure 10. (A) Spatial distribution of the soil CO2 flux during a normal degassing state (September 2021); (B) spatial distribution of the soil CO2 flux during the crisis (November 2021). The base map is extracted from the Carta Tecnica Regionale (1:10,000, EPSG: 25833, www.sitr.regione.sicilia.it, (accessed on 29 December 2022)); the maps of CO2 flux were obtained by using the Kriging algorithm of the Surfer package v. 10 (Golden Software).
Remotesensing 15 01405 g010
Figure 11. Data of soil CO2 flux recorded with hourly frequency at Rimessa.
Remotesensing 15 01405 g011
Figure 12. Time trends of some parameters measured in Camping Sicilia and Bambara well waters: (a) water temperature; (b) EC referred at 20 °C; (c) WTE); (d) TDIC; (e) Cl/SO4 ratio.
Remotesensing 15 01405 g012
Figure 13. The daily occurrence rate of the local seismicity (a) with a frequency peak in the range of 1–30 Hz and (b) with a frequency peak < 1 Hz from 1 June 2020 to 30 April 2022.
Remotesensing 15 01405 g013
Figure 14. The average value of all VLP seismicity locations in the map and sections with error bar (standard deviation). Only the location with a minimum station number = 5, minimum amplitude value = 0.006 (mm s−1), and minimum radial semblance= 0.6 is considered. [83] © DLR2018.
Remotesensing 15 01405 g014
Figure 15. Time series of longitude (a), latitude (b), and depth (c) of VLP seismicity source and (d) of the number of stations used in the location.
Remotesensing 15 01405 g015
Figure 16. Daily occurrence rate (blue lines) and cumulative strain release (red area) of the ML ≥ 1 earthquakes that occurred in the Vulcano area (coordinates 38.32N–14.84E and 38.48N–15.07E) in the period 01/06/2020-30/04/2022.
Remotesensing 15 01405 g016
Figure 17. Epicentral map of the ML ≥ 1 earthquakes recorded in the Vulcano area (coordinates 38.32N–14.84E and 38.48N–15.07E) from 1 June 2020 to 30 April 2022. The color of the circles depends on the depth of the earthquakes (red circles H ≤ 5 km; orange 5 < h ≤ 10 km; yellow 10 < h ≤ 15; blue > 15 km). The fault plane solution of the earthquake that occurred on 31 May 2021 at 1:16 pm is also reported. The source of the background map is openstreetmap.org/copyright (QGIS software).
Remotesensing 15 01405 g017
Figure 18. N-S (red circles), E-W (black circles), and vertical components (grey circles) of the IVLT (Lentia) GNSS station located southwest of the La Fossa crater area.
Remotesensing 15 01405 g018
Figure 19. The radial component of the SLT station (Figure 1c) shows the two phases (with a duration of 30 (1) and 15 (2) days) of tilt increases, indicating an uplift towards La Fossa Crater. Changes occurred within an upward long-term trend, which began in 2016.
Remotesensing 15 01405 g019
Figure 20. (a) Gravity signals observed at VPORT, VSOCR, and VCARA stations, from 15 October 2021 to 28 April 2022. Data are corrected for the effects of Earth tides, local atmospheric pressure changes, and instrumental drifts. (b) Twelve-hour (time in UTC) gravity signals observed at VPORT, VSOCR, and VCARA stations from 29 to 30 November 2021. The yellow strip marks intervals where significant gravity variations with amplitudes of a maximum of about 15 µGal and a dominant period over tens of minutes occurred at VPORT and VSOCR stations (see text for details). (c) One hundred and ten minutes (time in UTC) gravity signals, observed at VPORT, VSOCR, and VCARA stations on 2 December 2021. Yellow strip marks intervals where variations with a duration of about 3–4 min and peak-to-peak amplitudes of about 15 μGal were recorded (see text for details).
Remotesensing 15 01405 g020
Figure 21. Time trends of (a) SO2 flux, (b) CO2 content in the fumarole F11, (c) outlet temperature in the fumarole TK2, (d) soil CO2 flux in the crater southern rim (site Bordosud), (e) EC referred at 20 °C in the Camping Sicilia well, (f) TDIC in the Camping Sicilia well, (g) soil CO2 flux in the site C. Sicilia, (h) GPS component north of the SLT station, (i) daily occurrence rate of seismic events with frequency peak < 1 Hz, (j) gravity signal observed at VPORT station.
Remotesensing 15 01405 g021
Disclaimer/Publisher’s Note: The statements, opinions and data contained in all publications are solely those of the individual author(s) and contributor(s) and not of MDPI and/or the editor(s). MDPI and/or the editor(s) disclaim responsibility for any injury to people or property resulting from any ideas, methods, instructions or products referred to in the content.

