Article

Contribution of Land Cover Classification Results Based on Sentinel-1 and 2 to the Accreditation of Wetland Cities

1
State Key Laboratory of Remote Sensing Science, Faculty of Geographical Science, Beijing Normal University, Beijing 100875, China
2
Beijing Key Laboratory for Remote Sensing of Environment and Digital Cities, Faculty of Geographical Science, Beijing Normal University, Beijing 100875, China
3
College of Geographic and Environmental Sciences, Tianjin Normal University, Tianjin 300387, China
4
State Key Laboratory of Hydroscience and Engineering, Department of Hydraulic Engineering, Tsinghua University, Beijing 100084, China
5
State Key Laboratory of Simulation and Regulation of Water Cycle in River Basin, China Institute of Water Resources and Hydropower Research, Beijing 100038, China
*
Author to whom correspondence should be addressed.
Remote Sens. 2023, 15(5), 1275; https://doi.org/10.3390/rs15051275
Submission received: 17 January 2023 / Revised: 23 February 2023 / Accepted: 23 February 2023 / Published: 25 February 2023
(This article belongs to the Special Issue Remote Sensing of Wetlands and Biodiversity)

Abstract

:
Wetland cities were proposed by the International Wetland Convention Organization for the protection of urban wetlands. Few studies have performed land cover classifications for internationally recognized wetland cities or explored what contribution the classification results can make to the establishment of additional wetland cities to date. Based on Sentinel-1 and 2 data, this study used a 10-fold random forest method to classify the land cover of the first six wetland cities recognized in China. A land cover dataset, which had a resolution of 10 m and included four wetland types, was obtained and the wetland area and protected wetland areas of the six cities were calculated. The results showed that (1) the classification accuracy of six cities was good, the overall accuracy was above 90%, and the Kappa coefficient was above 0.88. (2) Cropland or forested areas were the most common non-wetland land coverage type in wetland cities and accounted for more than 20% or 40% of the land coverages, while water was the most common wetland type and accounted for more than 2% of the land coverages. From 2015 to 2020, the built area in most cities increased, while cropland and forest decreased significantly. (3) The wetland rate was 6.68–37.56% and the wetland protection rate was 49.48–73.74% in the six wetland cities. From 2015 to 2020, the wetland rate of the six cities were relatively stable, and the wetland protection rate of inland cities (Yinchuan, Changde, Harbin and Changshu) increased significantly, while those of coastal cities (Haikou and Dongying) decreased, which might be related to the change in coastline. Therefore, we found that the wetlands in these cities were well protected. Land cover classification for wetland cities can provide a reference for using remote sensing techniques used to monitor internationally wetland cities while also supporting the creation of additional wetland cities.

1. Introduction

Wetlands have always been closely related to human activities. As an important part of the urban ecosystem, wetlands provide a variety of ecological and social service functions necessary for urban development [1,2]. Urban wetlands not only have the functions of traditional wetlands, such as improving water quality, performing carbon fixation and providing habitats for wild animals, but they also make important contributions to reducing the urban heat island effect, creating leisure places and improving urban liveability [3]. However, with increases in the population and continued economic development, the large-scale urbanization process poses a greater threat to urban wetlands. It is estimated that 50% of wetlands have disappeared globally, and many countries are facing the problem of wetland degradation [4]. Urbanization is one of the main causes of wetland disappearance or degradation [5,6]. Urban wetlands have been paid more and more attention due to the problem of urban wetlands and the unique social service function. Protecting urban wetlands and promoting urban wetland restoration is already one of the important tasks for future urban development.
Wetland cities were proposed by the “Convention on Wetlands of International Importance especially as Waterfowl Habitat” (hereinafter referred to as the “Convention on Wetlands”) based on the consideration that the relationship between cities and wetlands has become increasingly prominent and people have gradually recognized the importance of urban wetlands. At the 10th Meeting of the Conference of the Parties to the Convention on Wetlands (COP10) in 2008, the issue of “wetlands and urbanization” was highlighted, which was also the first time that urban wetlands were officially recognized as one of the elements discussed in the Ramsar Convention [7,8]. In 2012, the concept of “wetland city” was proposed for the first time in the resolution of the “Principle for Sustainable Planning and Management of Urban and Suburban Wetlands”, adopted at the 11th Meeting of the Conference of the Parties to the Convention on Wetlands (COP11) [8,9]. In 2015, at COP12, a resolution on the wetland city accreditation system clarified the relevant criteria and procedures for wetland city accreditation [8,10]. In 2017, at the 53rd meeting of the Standing Committee of the Convention on Wetlands, preparations were made for the certification of wetland cities, and the international certification of wetland cities was launched globally. The Secretariat of the Convention officially sent a diplomatic letter to the states’ parties seeking the application for “Wetland City Accreditation” [8,11]. With the application of governments and the approval of the Standing Committee of the Convention on Wetlands, the first batch of 18 wetland cities in the world was announced at COP13 in 2018. In 2022, the second batch of 25 wetland cities throughout in the world was announced at the 59th Meeting of the Standing Committee of the Convention on Wetlands. Wetland cities have become a good example of urban wetland protection. Therefore, it is very necessary to understand the detailed characteristics of these cities to better contribute to the protection of urban wetlands and the development of the city.
Over the past few decades, the degradation of urban wetlands in China has been quite serious. Mao et al. noted that 2883 km2 of wetlands in China were lost due to urban expansion from 1990 to 2010 [4]. Mahdianpari et al. [6] and Hettiarachchi et al. [12] noted that the degradation of urban wetlands is still serious. After wetland cities were established, the status of urban wetlands and their potential continued degradation are the key issues we need to monitor. The first batch of wetland cities in China includes six cities, Yinchuan, Changde, Haikou, Harbin, Dongying and Changshu, which are distributed throughout China and include inland and coastal cities. At present, we know little about the status of wetlands in these cities and their changes in recent years.
With the rapid development of remote sensing technology, land cover mapping methods have been widely developed and frequently. At present, there are many sets of global and national land cover data. More representative land cover products include GlobeLand30 [13], GLC_FCS30 [14], and CLCD [15], all of which have a resolution of 30 m, and there are only two land cover types related to wetlands: water and wetland. Unlike Landsat images, Sentinel images have higher spatial and temporal resolutions and contain both optical and SAR images. As the European Space Agency (ESA) gradually implemented the Copernicus project to provide free Sentinel satellite images to the scientific community, government agencies, etc., several sets of land cover products with a resolution of 10 m were produced. Google has produced a global near real-time 10 m land cover product based on Sentinel-2, of which the land cover types related to wetlands are mainly water and flood vegetation [16]. The ESA has produced a set of global land cover data for 2020 based on Sentinel-1 and 2 imagery, which includes three wetland—related data types: permanent water bodies, mangroves and herbaceous wetlands [17]. Since these datasets are all large-scale data, the actual situation of small-scale studies sites, such as cities, cannot be well reflected due to some potential errors. This especially true for wetland cities, meaning that we need to focus on more land cover types related to wetlands.
Landsat and Sentinel data are the most commonly used remote sensing data for land cover mapping. Especially in recent years, Sentinel data have been widely used in land cover mapping due to their high spatial and temporal resolutions and features both optical and radar imagery. Feng et al. used Sentinel-2 data to monitor the changes in ecosystem types on the plateau in the upper reaches of the Yellow River basin [18]. Forkuor et al. used Landsat-8 and Sentinel-2 to obtain higher resolution land cover data in West Africa [19]. With the development of classification methods, supervised classification based on machine learning is widely used in land cover classification studies, such as the popular random forest method [18,20]. Denize et al. found that random forest outperformed Support Vector Machines when extracting land use in an agricultural area of France [21]. Valdivieso-Ros et al. used random forest, Support Vector Machines and Multilayer Perceptron to classify in the Mediterranean area, with random forest being the model reaching the highest accuracy [22]. Random forest method has the advantages of good robustness and low computational cost [22]. It is a better machine learning method in land cover classification.
The purpose of this work was to understand the spatial distribution of the first wetland cities in China and monitor their changes in recent years and explore what contributions land cover products based on remote sensing data can make to the monitoring of internationally recognized wetland cities. This study used the 10-fold random forest method to produce land cover products with a spatial resolution of 10 metres and containing numerous wetland categories. Next, the statistics and analysis of the distribution characteristics of land cover types in the first batch of six international wetland cities in China (Yinchuan, Changde, Haikou, Changshu, Dongying and Harbin). Finally, the area occupied by wetlands and the proportion of wetland areas that were under protection within six wetland cities were calculated, and their changes from 2015 to 2020 were analysed. The results of this study can provide a reference for remote sensing monitoring of internationally recognized wetland cities and support the creation of additional wetland cities.

2. Materials and Methods
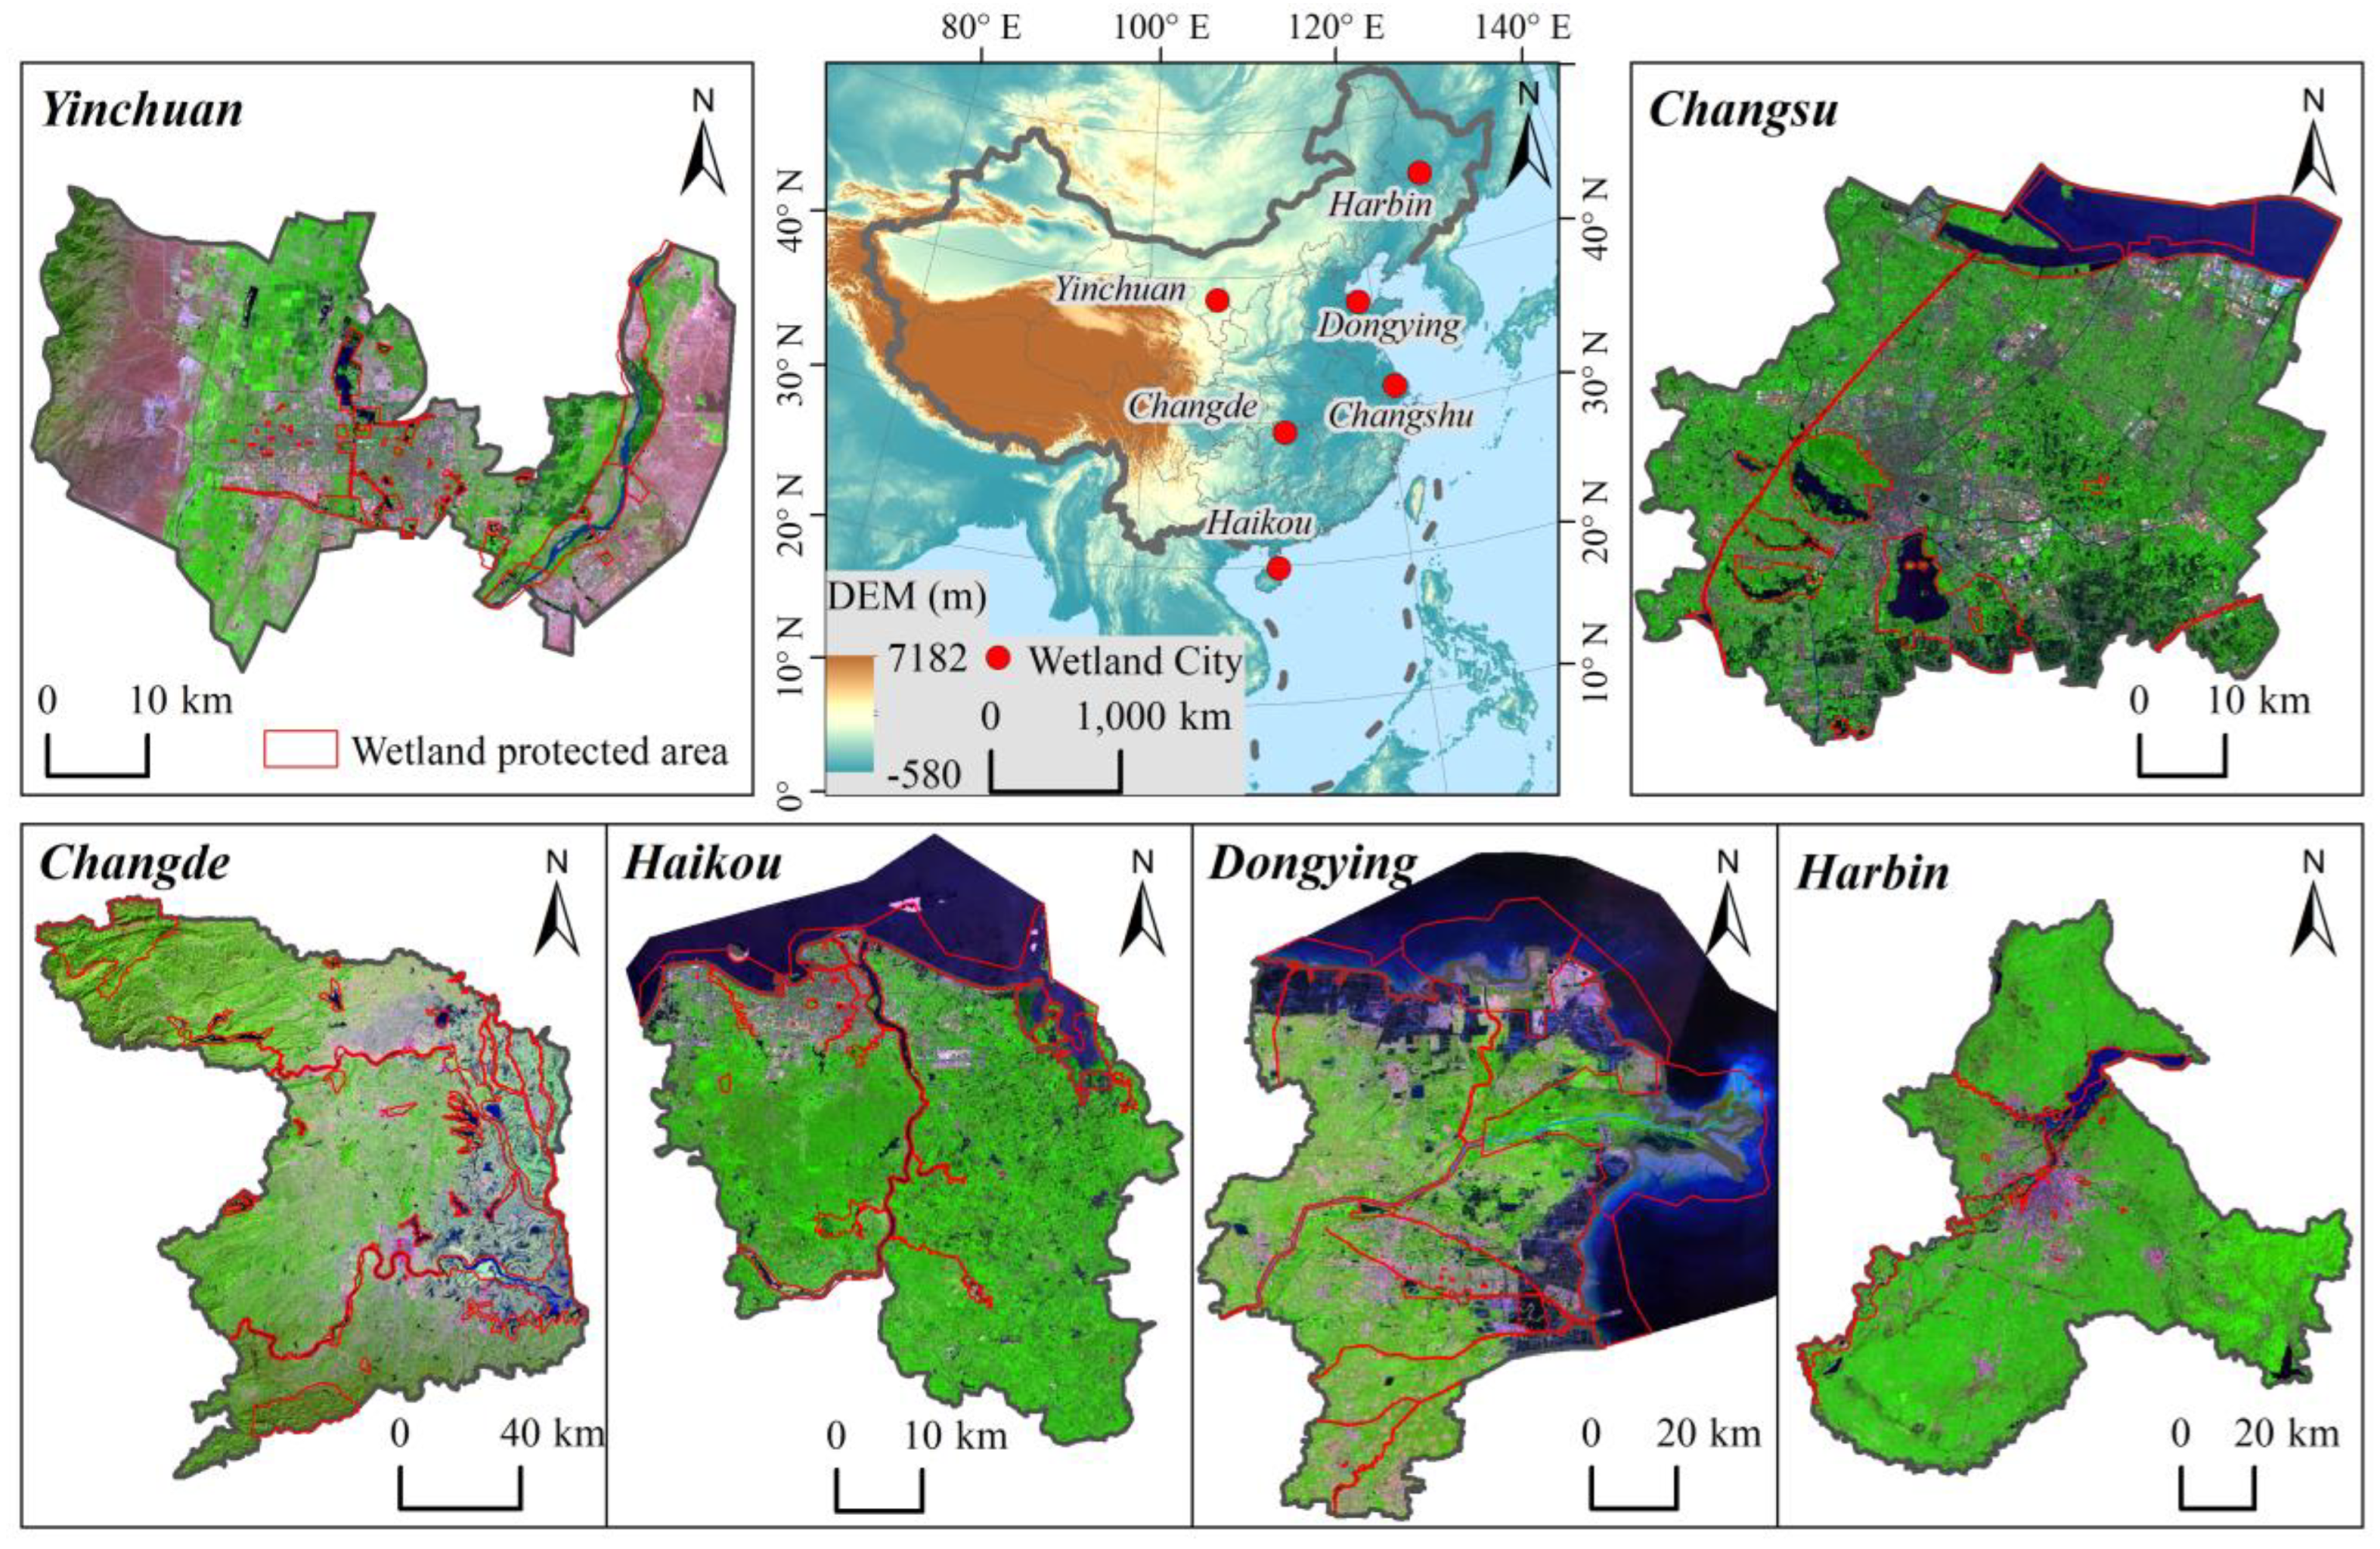
2.1. Study Area

The first six wetland cities in China are Yinchuan City (municipal district), Changde City, Haikou City, Changshu City, Dongying City and Harbin City (municipal district). The specific distribution is shown in Figure 1. Different cities have different wetland characteristics, as shown in Table 1. Haikou and Dongying are coastal cities. To fully extract the object features of coastal areas, areas with water depths less than 25 metres outside the coastline were included in the urban area as coastal extension areas.

2.2. Dataset

2.2.1. Satellite Images and Data Preprocessing

In this study, data from Sentinel-1 and 2 were primarily used for land cover classification. In 2015, Landsat-8 data were added to compensate for the lack of Sentinel-2 data. Sentinel-1 can provide all-weather synthetic aperture radar (SAR) images with a resolution of 10 m. Because SAR is more sensitive to wetlands, using SAR images offer great advantages when extracting the wetland land cover types from images [23]. Sentinel-2 can provide 13 bands of optical remote sensing images. Sentinel-2A, launched in 2015, and Sentinel-2B, launched in 2017, can provide remote sensing image data with a temporal resolution of 2–5 days and a spatial resolution of 10 m (https://sentinels.copernicus.eu/web/sentinel/missions/sentinel-2 (accessed on 22 February 2023)). To reduce the impact of clouds on the results, we chose images with cloud coverage of less than 20% for land cover classification. Additionally, for Sentinel-2 data, the QA60 mask band in Google Earth Engine (GEE) was used to shield cirrus and other types of clouds, while for Landsat-8, the BQA mask band was used to account for the effect of cloud—induced terrain occlusion [23]. The number of remote sensing images used in 6 cities in 2015 and 2020 is shown in Table 2.

2.2.2. Wetland and Auxiliary Data

A variety of wetland and land cover data were used to select sample points and verify the land cover results. Wetland type datasets include JRC Global Surface Water (JRC_GSW) [24], Global Intertidal Change [25], Global Saltmarsh [26], Mangrove map of China 2018 (MC2018) [27], Tidal Wetlands in East Asia (TWEA) [28] and Mangroves of coastal China in 2020 (MC2020). Land cover datasets include ESA WorldCover (ESA_WC10), Dynamic World (DW10) [16], GlobeLand 30 [13], Global Land Cover with Fine Classification System at 30 m (GLC_FCS30) [14] and Finer Resolution Observation and Monitoring—Global Land Cover (FROM_GLC30). Auxiliary datasets include Global Self-consistent, Hierarchical, High Geography Database-World Vector Shoreline (GSHHG-WVS) and Global Relief Model ETOPO1 (ETOPO1), to be used to identify coastal extension areas of coastal cities. The sources and detailed information of these datasets are introduced by Wang et al. [29].

2.2.3. Wetland Protected Area Data

In 2013, the “Regulations on Wetland Protection and Management” issued by the State Forestry Administration of China stressed that important wetlands and general wetlands should be designated to carry out different levels of protection. For example, in the “Regulations on Wetland Protection of Hunan Province” (http://www.hunan.gov.cn/ (accessed on 10 November 2022)) issued by Hunan Province, it is further noted that important wetlands include international, national, and provincial important wetlands, and wetland reserves or wetland parks should be established to facilitate protection. For general wetlands, local governments should carry out relevant protection according to the protection plan. Therefore, we regarded wetlands of international importance, national and provincial wetland parks or wetland nature reserves as important wetland reserves. Rivers, lakes, large reservoirs and common parks in unimportant wetland reserves in the city were taken as general wetland reserves. Wetland parks, wetland reserve planning maps, and lists of important rivers and lakes come from the official website of each city government. The corresponding boundaries were obtained through manual vectorization, and the general urban parks were obtained through Baidu Map Crawler. The scope of wetland reserves in six cities is shown in Figure 1.

2.3. Research Methods

2.3.1. Classification Scheme

The classification scheme refers to the global land cover classification schemes, such as Chen et al. [13] and Brown et al. [16], and determines the types of water, forest, and grassland, built land, cropland and bare land. It also follows Mao et al. [30] and the Chinese wetland classification national standard (GB/T 24708-2009) identified swamp, marsh, and beach types. According to the traditional land cover types, and taking into account the wetland characteristics of wetland cities and the ability of remote sensing satellite data, the land cover classification scheme of wetland cities is comprehensively determined as shown in Table 3.

2.3.2. Samples

Considering that wetland cities have unique wetland types of land cover and to balance the sampling accuracy and workload required for the study, this study adopted different ways to select wetland and non-wetland environments. The wetlands were selected according to Wang et al. [29]. For non-wetland environments, which were based on the existing land cover data, the stable area of each land cover type was determined through overlay analysis, and samples of the corresponding type were selected. If a certain type has a small distribution area in the city, relevant sample points would be further selected through visual interpretation. The sample in 2020 was obtained by using the above method, while the sample for 2015 was obtained by using the sample migration method. We overlaid multiple land cover products in 2015 to obtain clear and consistent areas for each land cover type and compared them with samples in 2020. The sample in the consistent area was retained as the sample for 2015. If some types of samples were missing after migration or were small in number, we used the above sample determination method to supplement the data with relevant samples. Finally, the verification samples of each city were further visually interpreted to ensure their accuracy. Additionally, to ensure the rationality of the accuracy verification method, we referred to the research of Wang et al. to determine the number of verification samples for different land cover types [29]. The sampling approach is stratified random sampling. The numbers of training and validation samples for six cities are shown in Table 4.

2.3.3. Feature Construction

To ensure that the wetland surface type can be extracted better, in addition to the traditional spectral, index and texture features, this study also added the polarization features and terrain features from Sentinel-1. Spectral features contain blue, green, red, red Edge1, red Edge2, red Edge3, NIR, red Edge4, SWIR1 and SWIR2 bands of Sentinel-2. Index Features contain the normalized difference vegetation index (NDVI), enhanced vegetation index (EVI), normalized difference water index (NDWI), modified normalized difference water index (mNDWI), and automated water extraction index (AWEInsh) [29]. Texture features were represented by a grey level co-occurrence matrix [29]. The greenest image and the wettest image were also calculated [31]. All these feature sets were introduced by Wang et al. [29]. All remote sensing image preprocessing tasks and feature set construction were carried out on the Google Earth Engine (GEE) platform.

2.3.4. GEE-Based 10-Random Forest Classification

The core idea of the 10-fold random forest algorithm is based on the cross-validation method [32]. First, we divide the training samples into ten folds. For each fold, we performed a land-cover classification using only 80% of the training data [32]. Then, the ten independent classification results were obtained. Finally, the ten results are taken pixel by pixel by mode to determine the final classification result. The ten times classification results of Yinchuan in 2020, as in Appendix A Figure A1, and it can be found that the robustness of the results is good. Considering that there are wetland types with complex characteristics within wetland cities, this study adopted a 10-fold random forest method to classify land cover. The random forest method is an enabled algorithm that can satisfactorily address multicollinearity and avoid accuracy decreases due to feature redundancy, and it does not assume independence and a normal distribution [33,34]. In this study, for the random forest classifier, we set the number of trees to 100 (nTree = 100) and split the number of features in each tree into the square root of the total number of features (mTry = 11) [29]. The GEE platform was used to build feature sets and complete land cover classification for 6 cities, respectively, and the land cover classification results of 6 cities were obtained.

2.3.5. Accuracy Assessment

We used overall accuracy (OA), user’s accuracy (UA), and producer’s accuracy (PA) to evaluate the accuracy of land cover classification in 6 cities by calculating the confusion matrix [35]. The UA reflects the misclassification error, while the PA reflects the missing error [35]. The Kappa coefficient is used to evaluate the reliability of land cover classification accuracy [30].

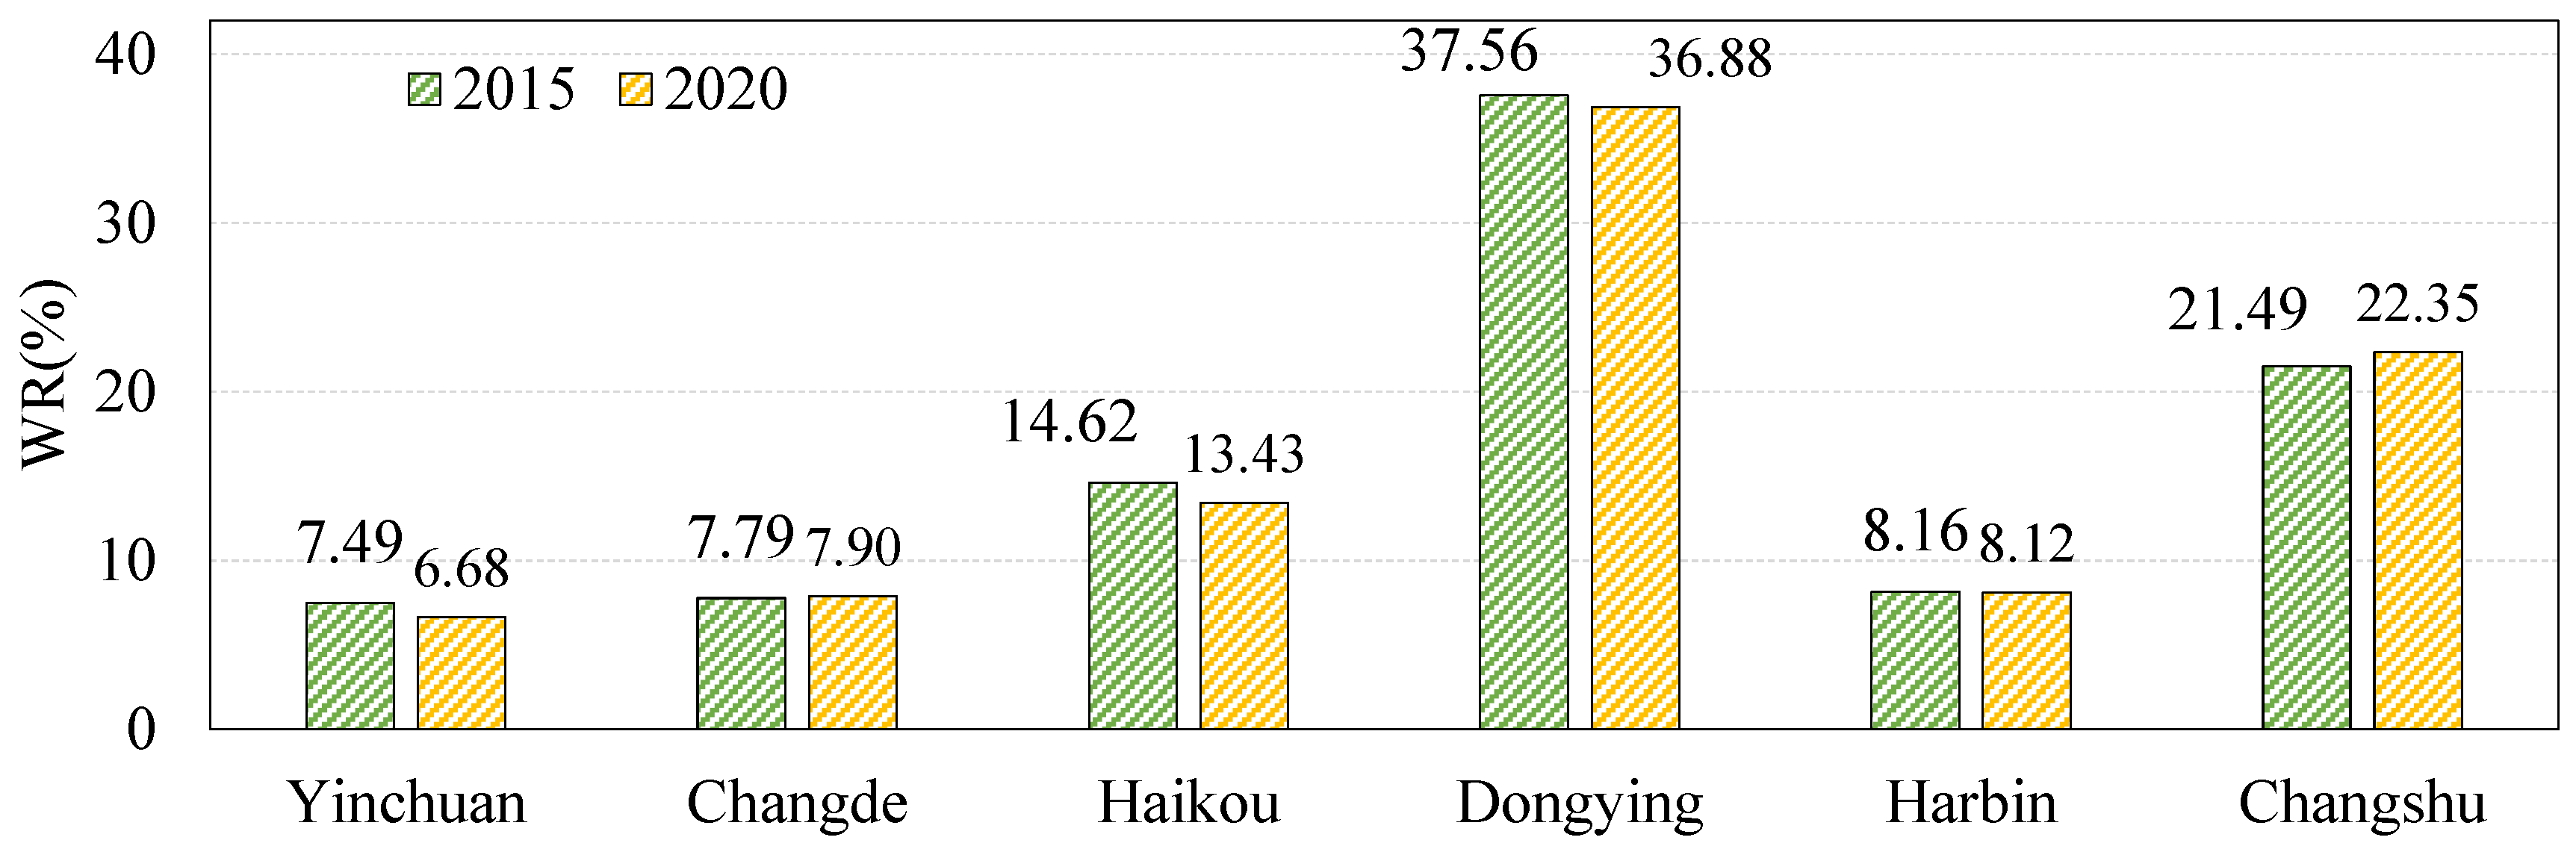
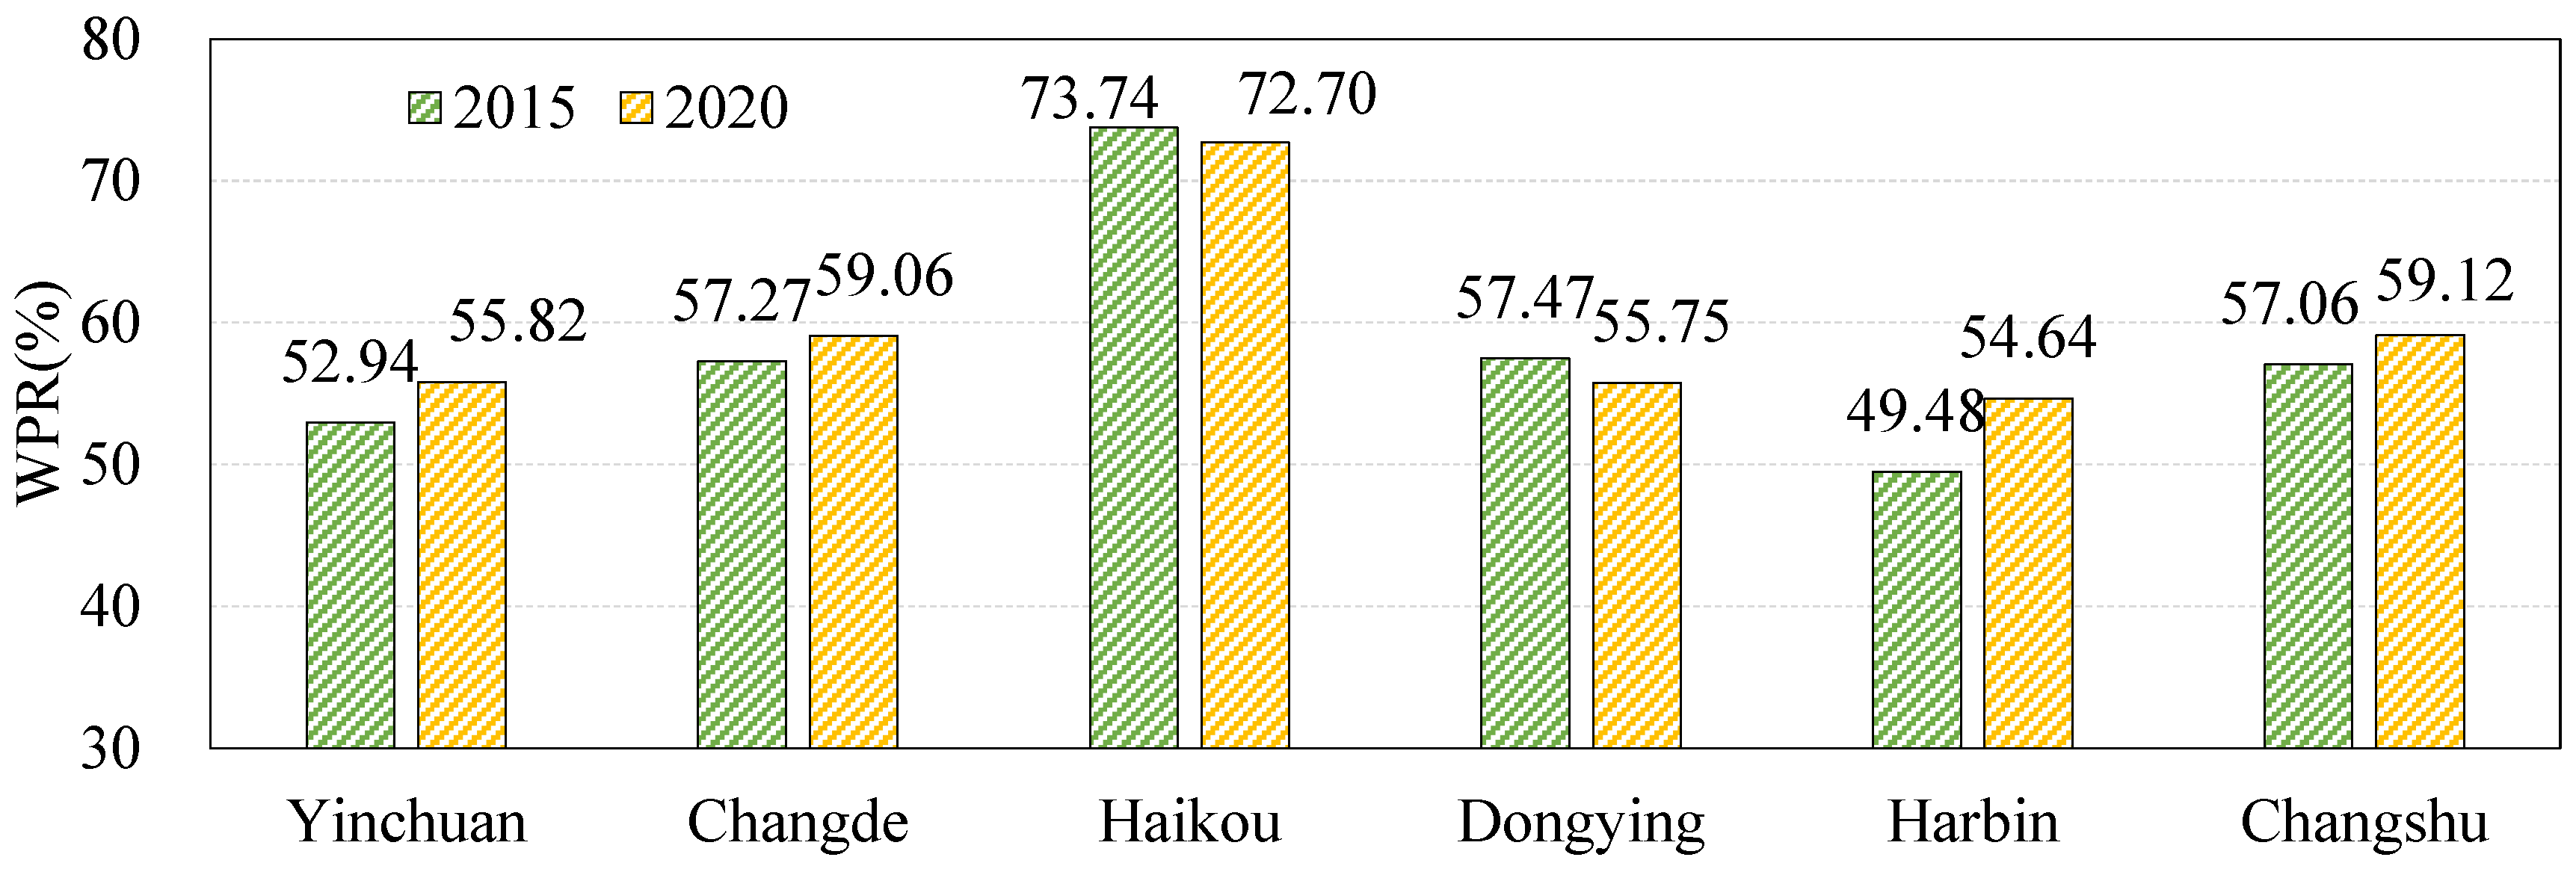
2.3.6. Calculate the Wetland Rate (WR) and Wetland Protection Rate (WPR) to Support Wetland City Accreditation

Within criteria for accrediting wetland cities, there is a key requirement that the city applying for accreditation must satisfy. The city should have a Ramsar wetland or other important wetlands. The Chinese government attaches great importance to the promotion of wetland city accreditation and has formulated a more detailed “Nomination Method for Wetland City Accreditation” (http://nrp.jining.gov.cn/art/2020/12/28/art_60956_2706414.html (accessed on 12 November 2022)). The area covered by wetlands within coastal cities should be above 10%, inland plain cities should exceed 7%, inland mountain cities should be above 4%, and the total area classified as protected wetlands should exceed 50%. Therefore, it is very easy to calculate the wetland coverage and fraction of wetlands under protection for different cities according to our land cover classification results to support the creation of international wetland cities. Here, the term wetland rate (WR) is used to refer to the proportion of the total wetland area within the total land area of the city (coastal city wetland rate refers to the proportion of the total wetland area in the sum of the city’s land area and within the shallow coastal regions). Shallow coastal regions refers to the area with less than 6 metres of water extending outwards from the coast. The wetland rate can be calculated as follows:
W R = W e t l a n d   a r e a C i t y   a r e a × 100 %
The wetland protection rate (WPR) refers to the proportion of protected wetland area in the city total wetland area. The protected wetland area refers to the wetland area within the wetland protection area. The calculation formula of the wetland protection rate is as follows:
W P R = W e t l a n d   a r e a   i n   p r o t e c t e d   a r e a s W e t l a n d   a r e a × 100 %

3. Results

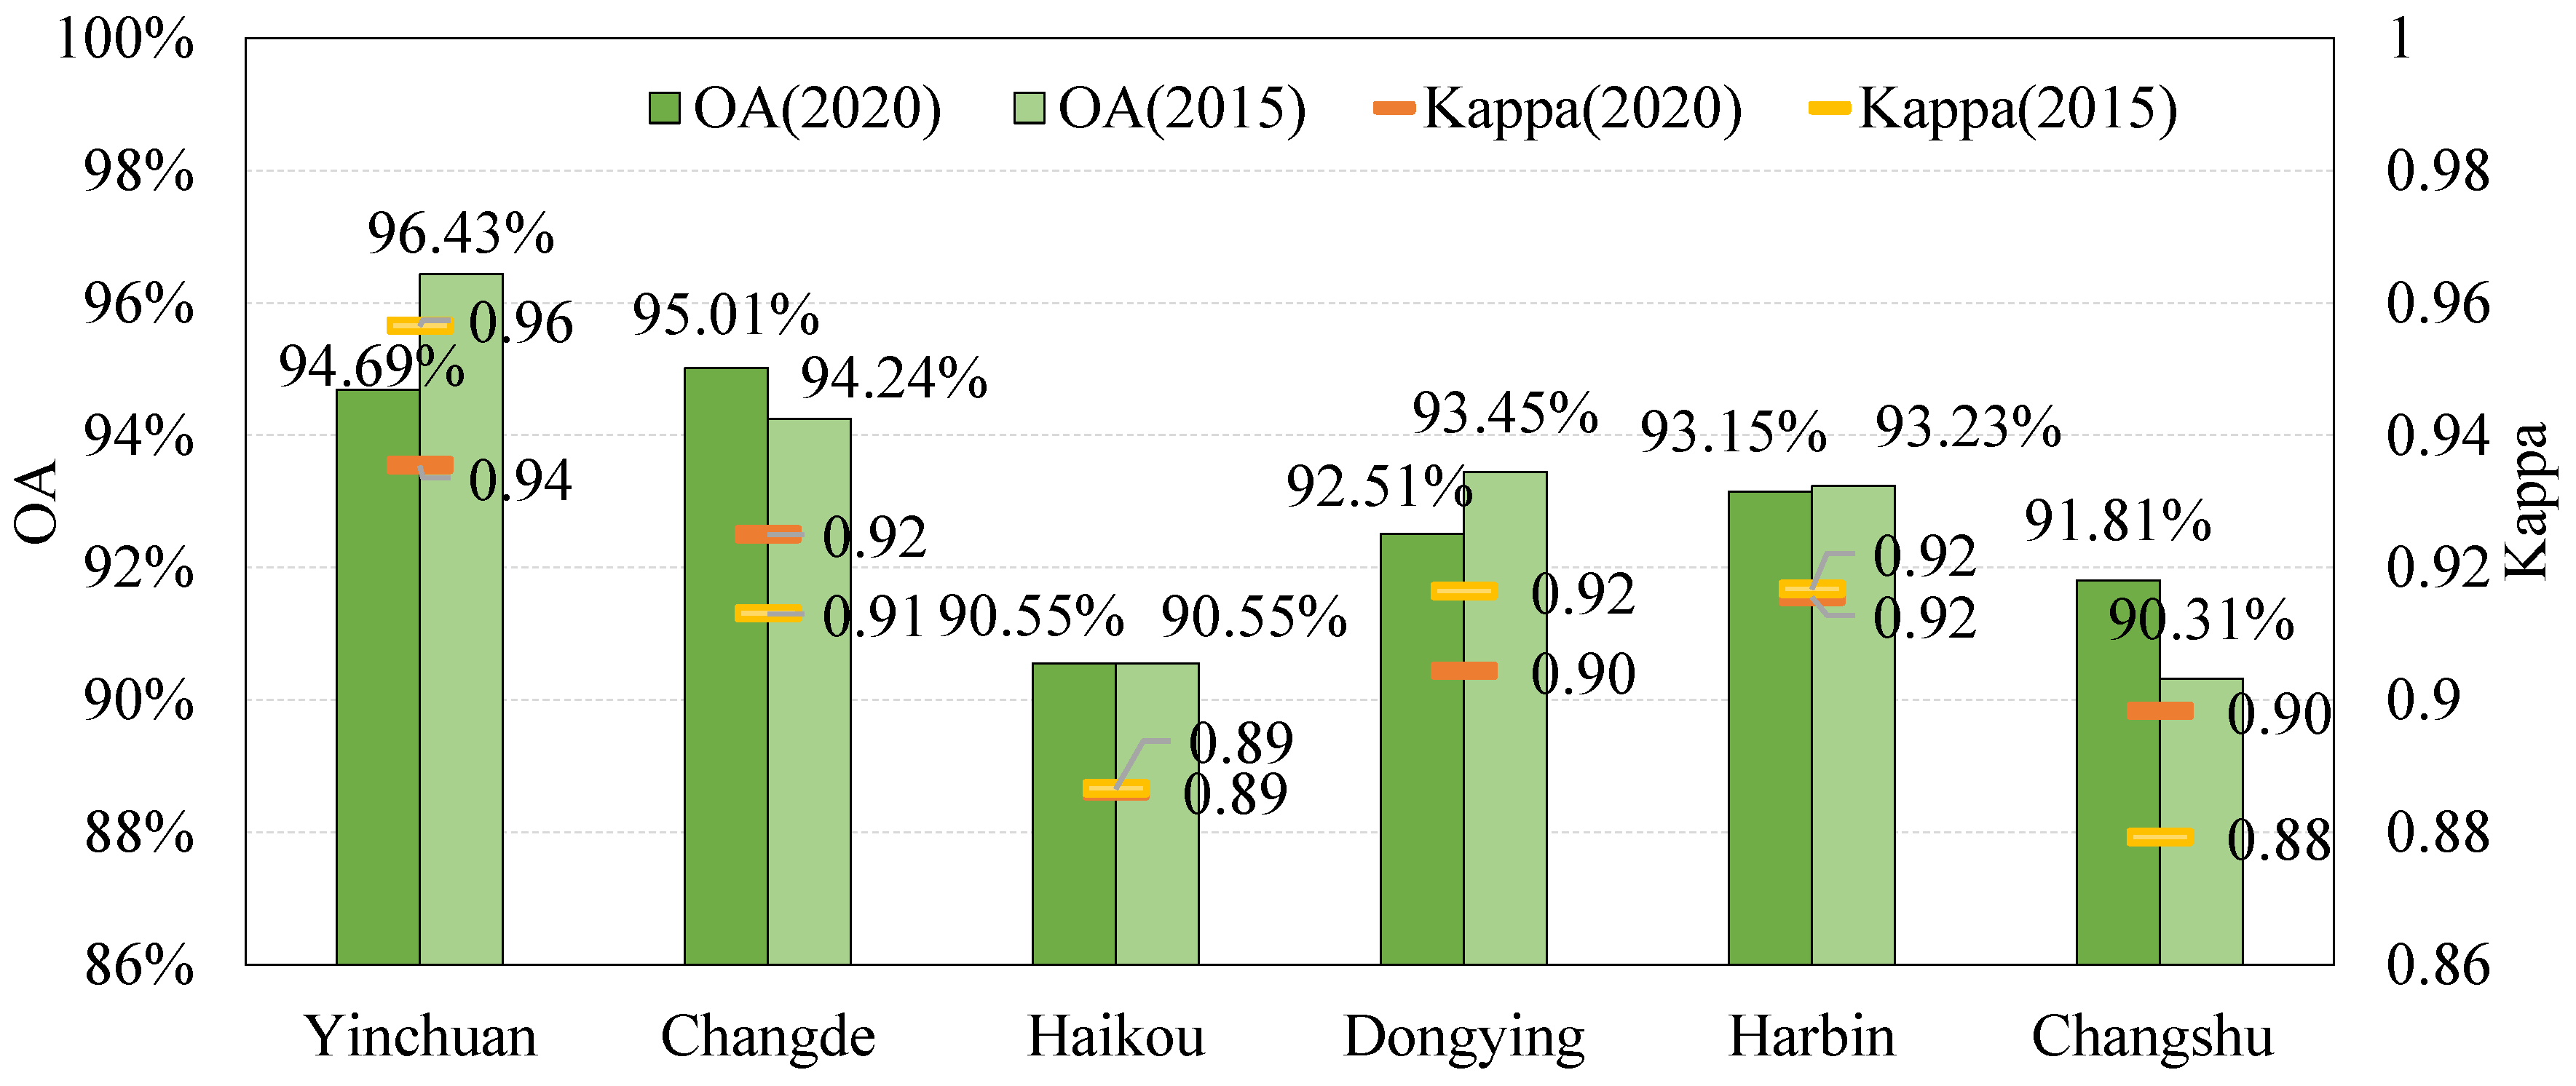
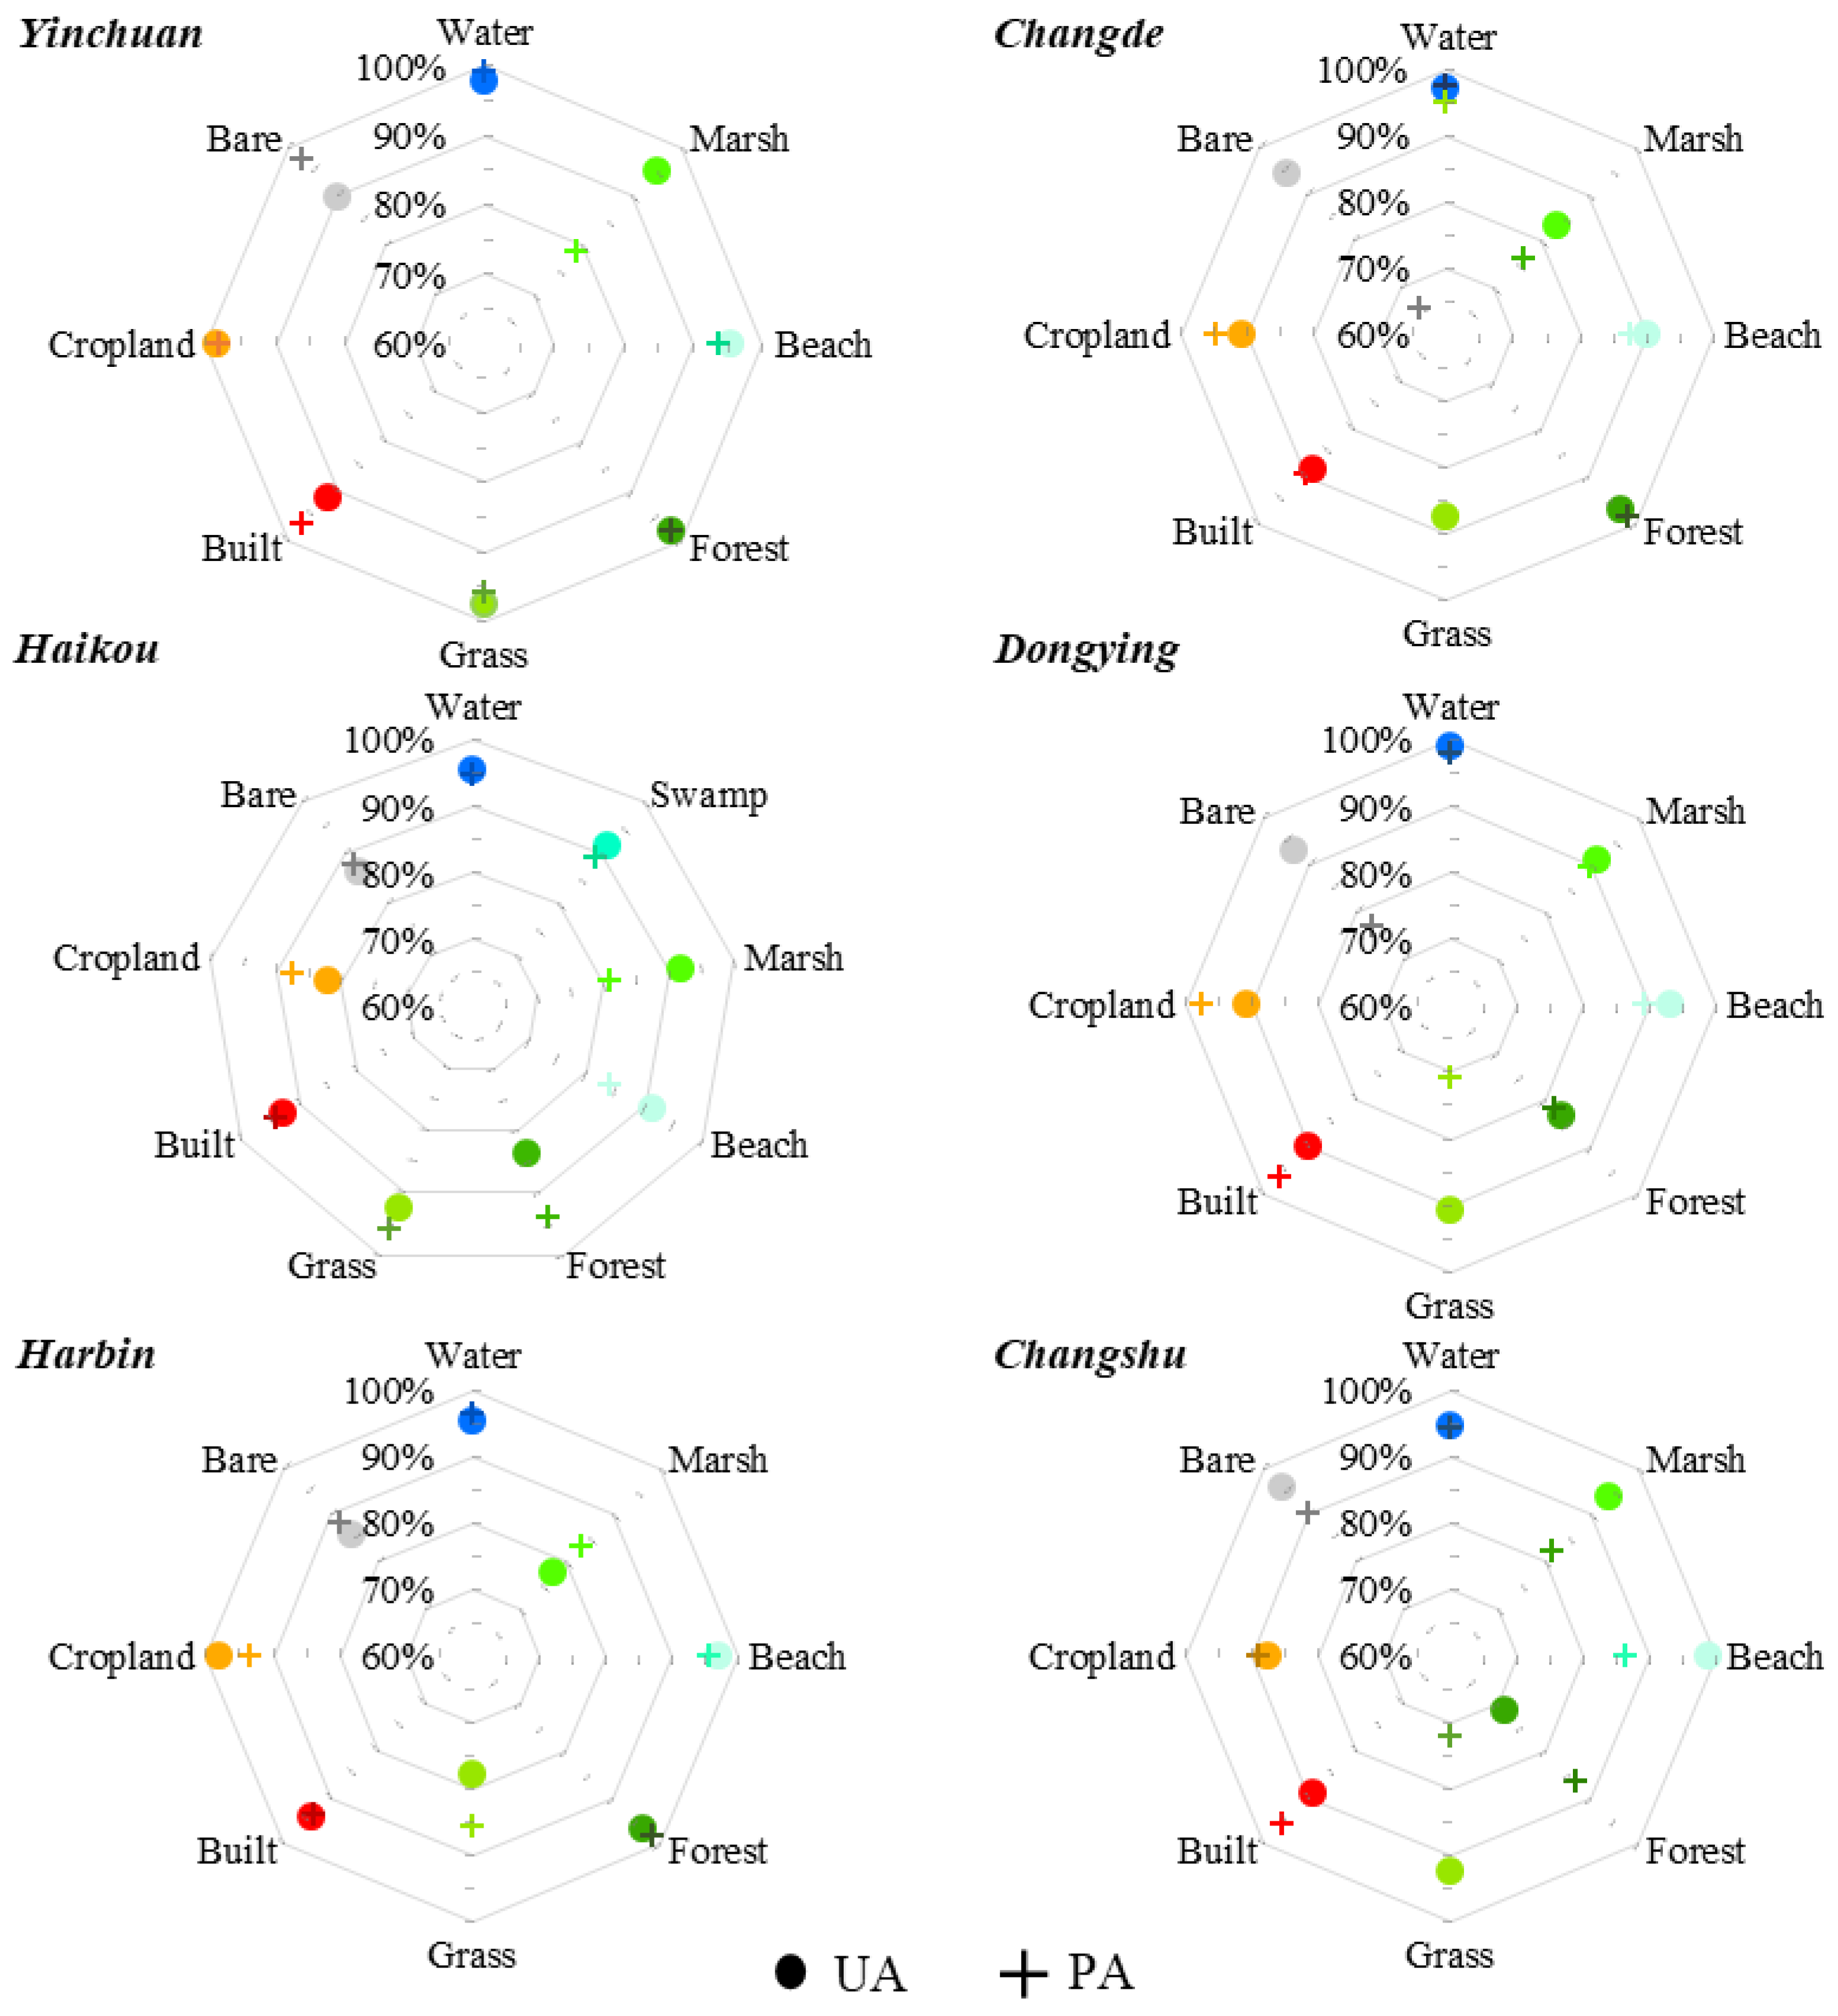
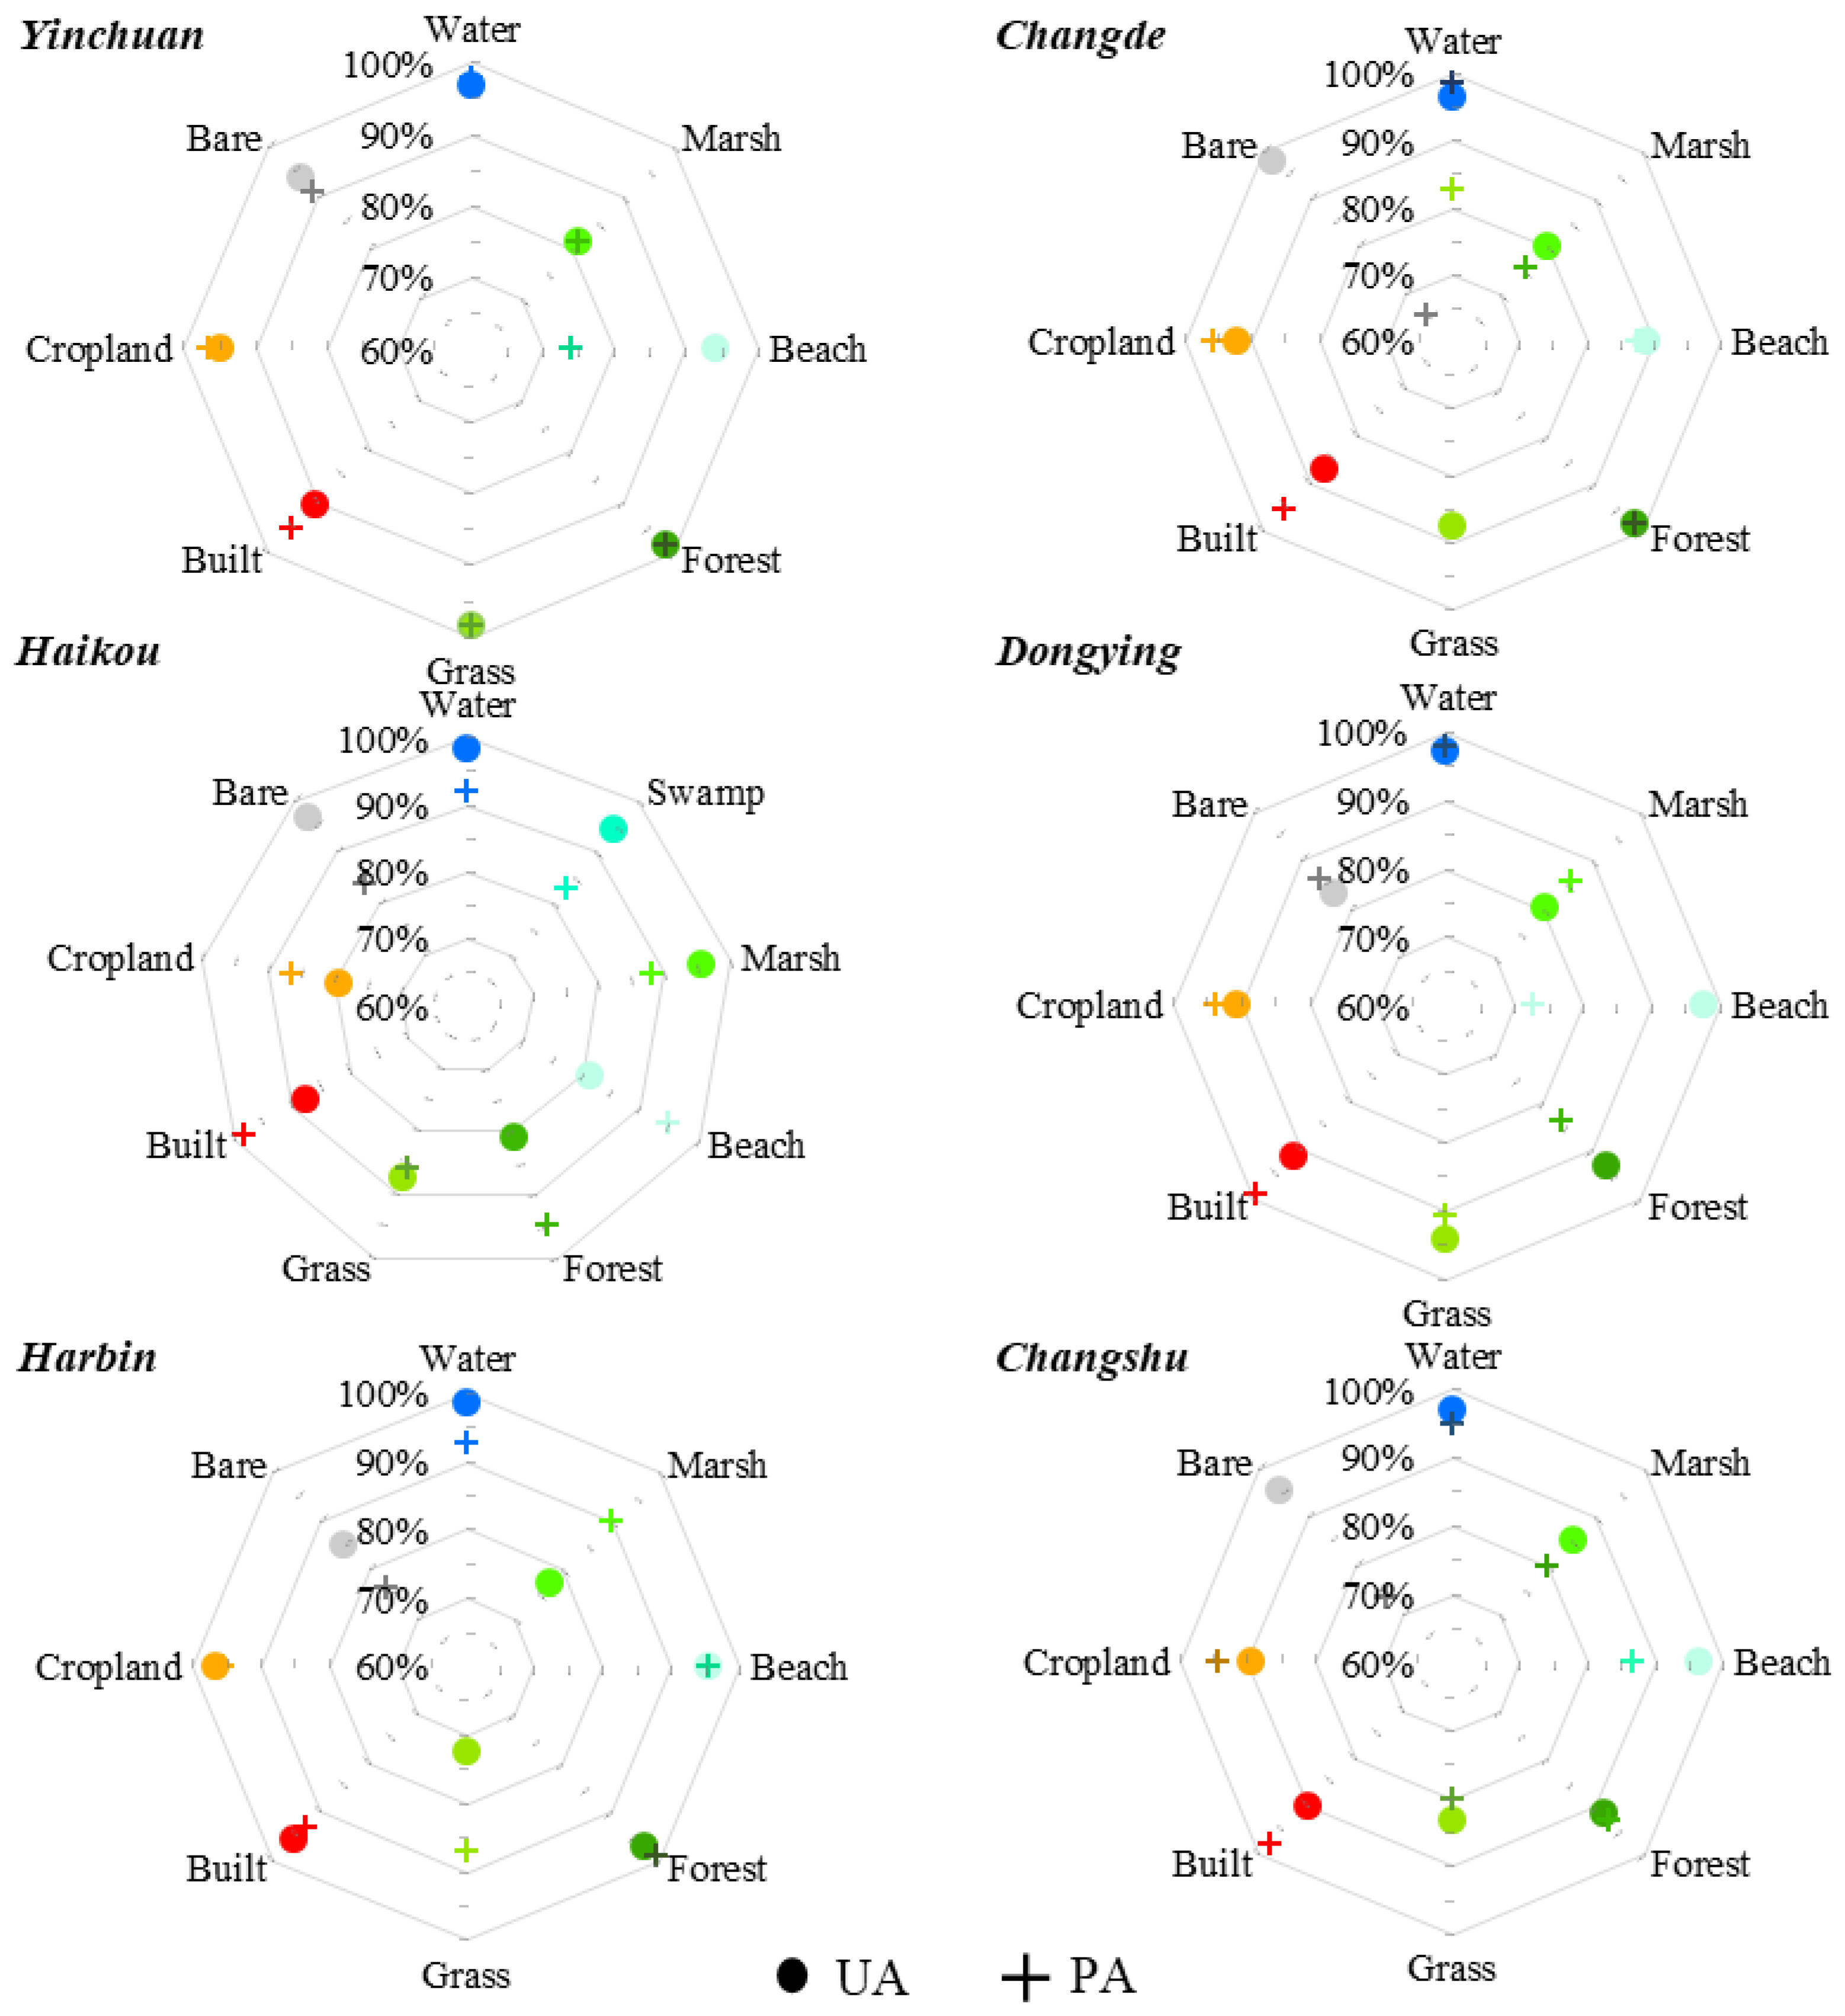
3.1. Accuracy Assessment

The OA, UA, and PA of six cities in 2015 and 2020 were obtained by calculating the confusion matrix. The land cover classification results obtained in this study were good (Figure 2, Figure 3 and Figure 4). The results in Figure 2 show that all the OAs of the six cities were above 90%, and all the Kappa coefficients were also above 0.88. Figure 3 and Figure 4 show that all the UAs and PAs of the six cities in 2015 and 2020 were basically above 70%. The UA and PA of water, built areas and cropland were all above 80%, and the majority of cities had relatively good classification accuracy. Marshes were misclassified as grassland and cropland, and beaches were misclassified as bare land. Some land cover categories were less distributed in the city, and the classification accuracy was relatively low. For example, the area covered by grassland in Changde was extremely small, and the PA accuracy was low. However, on the whole, from the overall accuracy to the accuracy of each category, the land cover classification accuracy of the six cities was relatively good.
A typical area was selected in each of the six cities to compare our land cover results (LC2020) with ESA_ WC10 and DW10 (Figure 5). By comparison with Sentinel-2 images, it was found that our land cover classification results could reflect the types of ground objects more accurately and were more accurate in terms of wetland types than the other two data products. For example, the beach in Dongying has no corresponding category in the other two products, and the swamp (mangrove) in Haikou also has no corresponding category in the DW10 data product. Overall, the land cover products obtained in this study were better than other products at categorizing wetlands. In addition, we also found that some land cover types are easy to be misclassified. From the typical areas of Yinchuan and Changde, it can be found that the misclassification between marsh, grassland and cropland is easy to occur. In Dongying, it can be found that the beach land is easily classified as bare land, especially when the classification system does not take this type into account. Therefore, it is very necessary to consider wetland types in the land cover classification system for wetland cities.

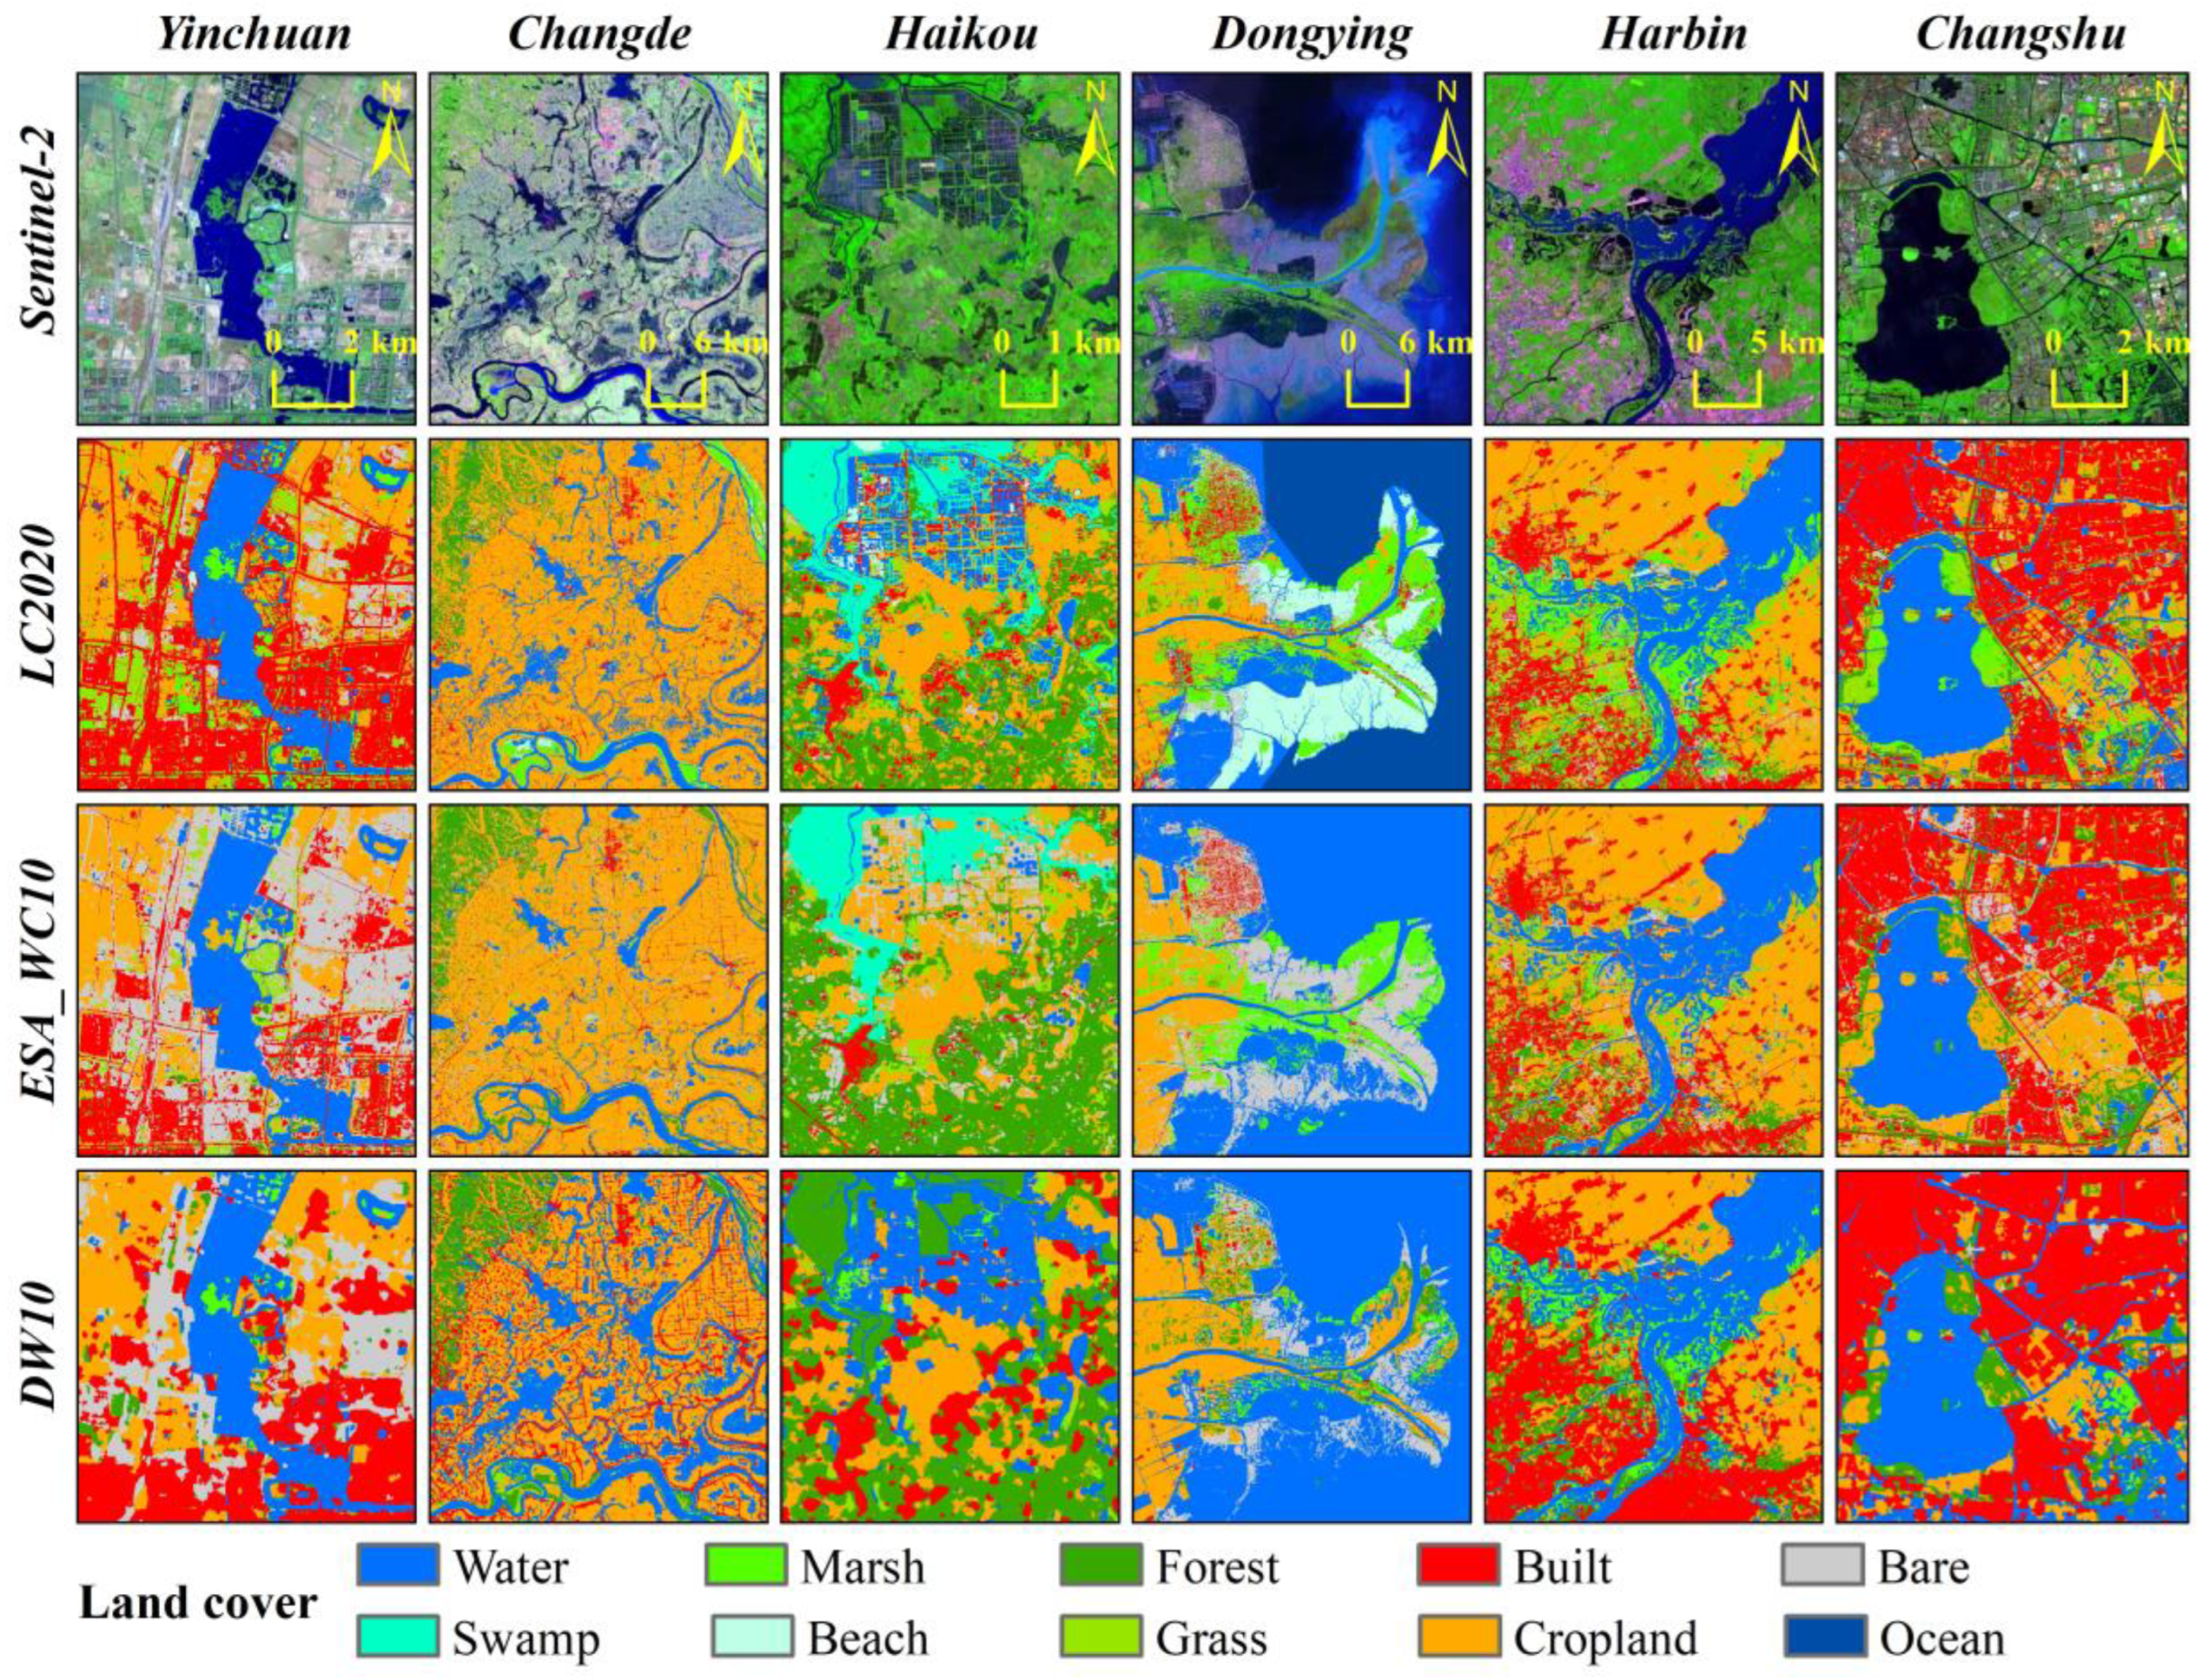
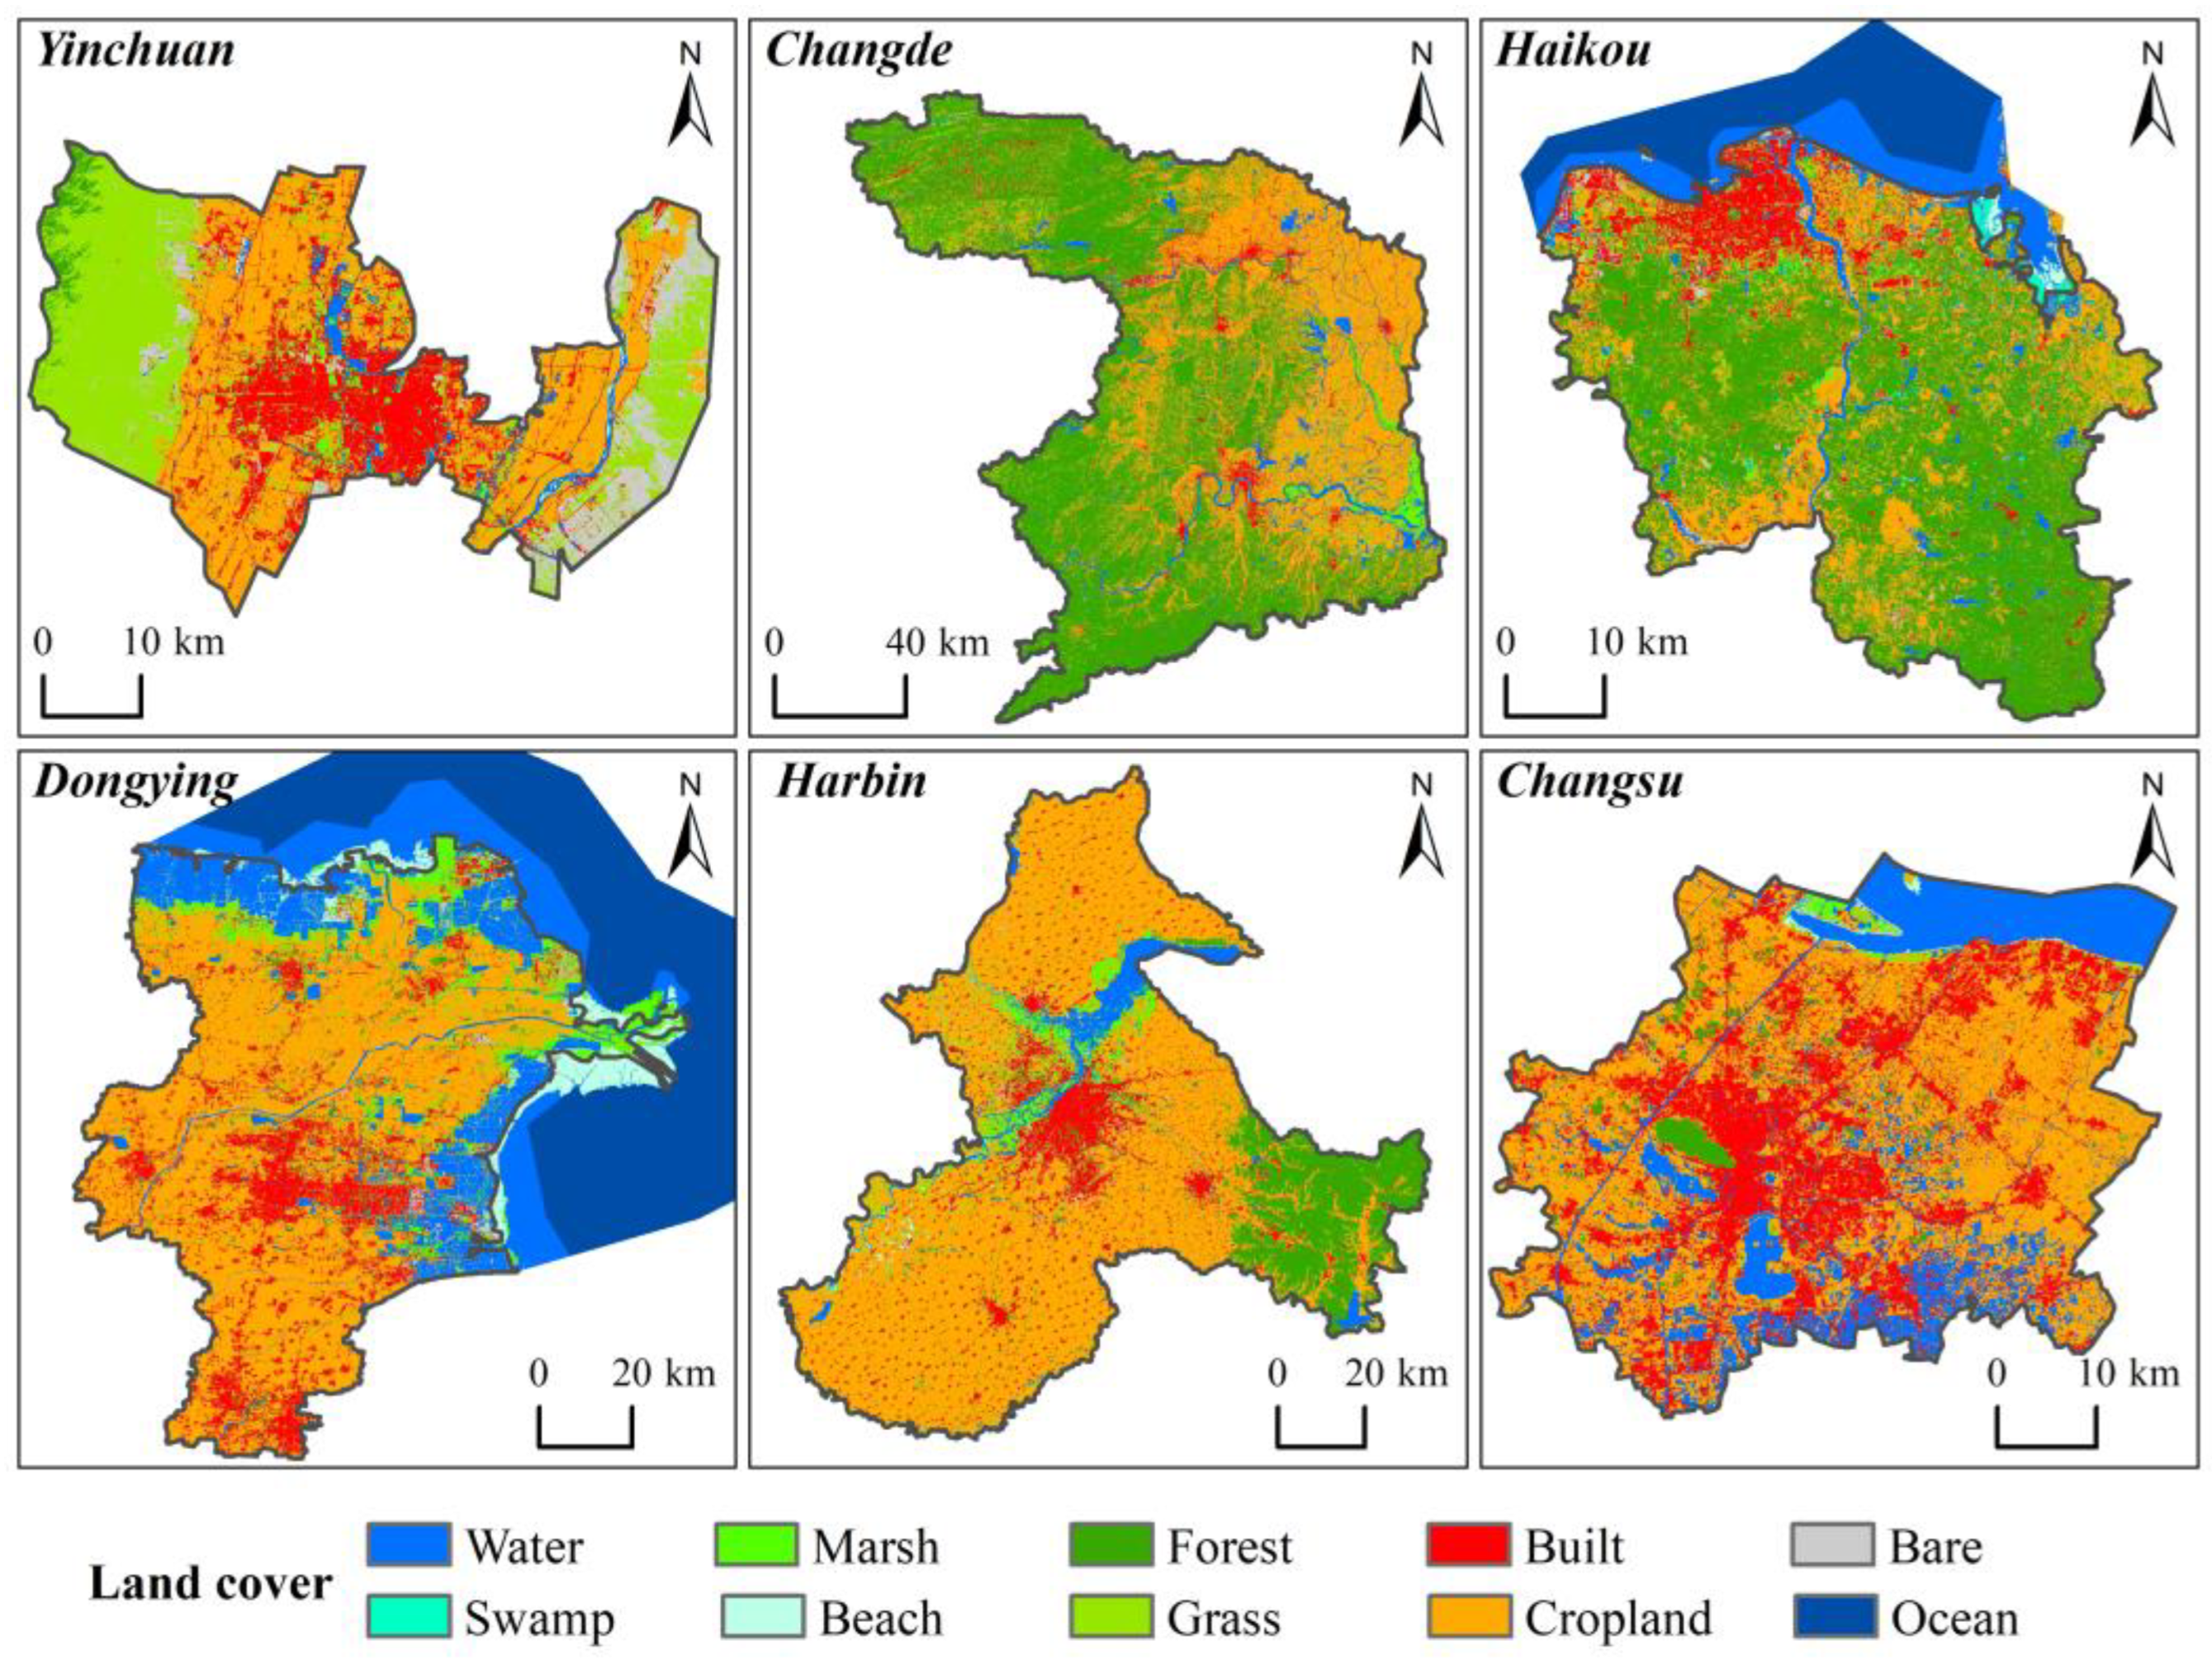
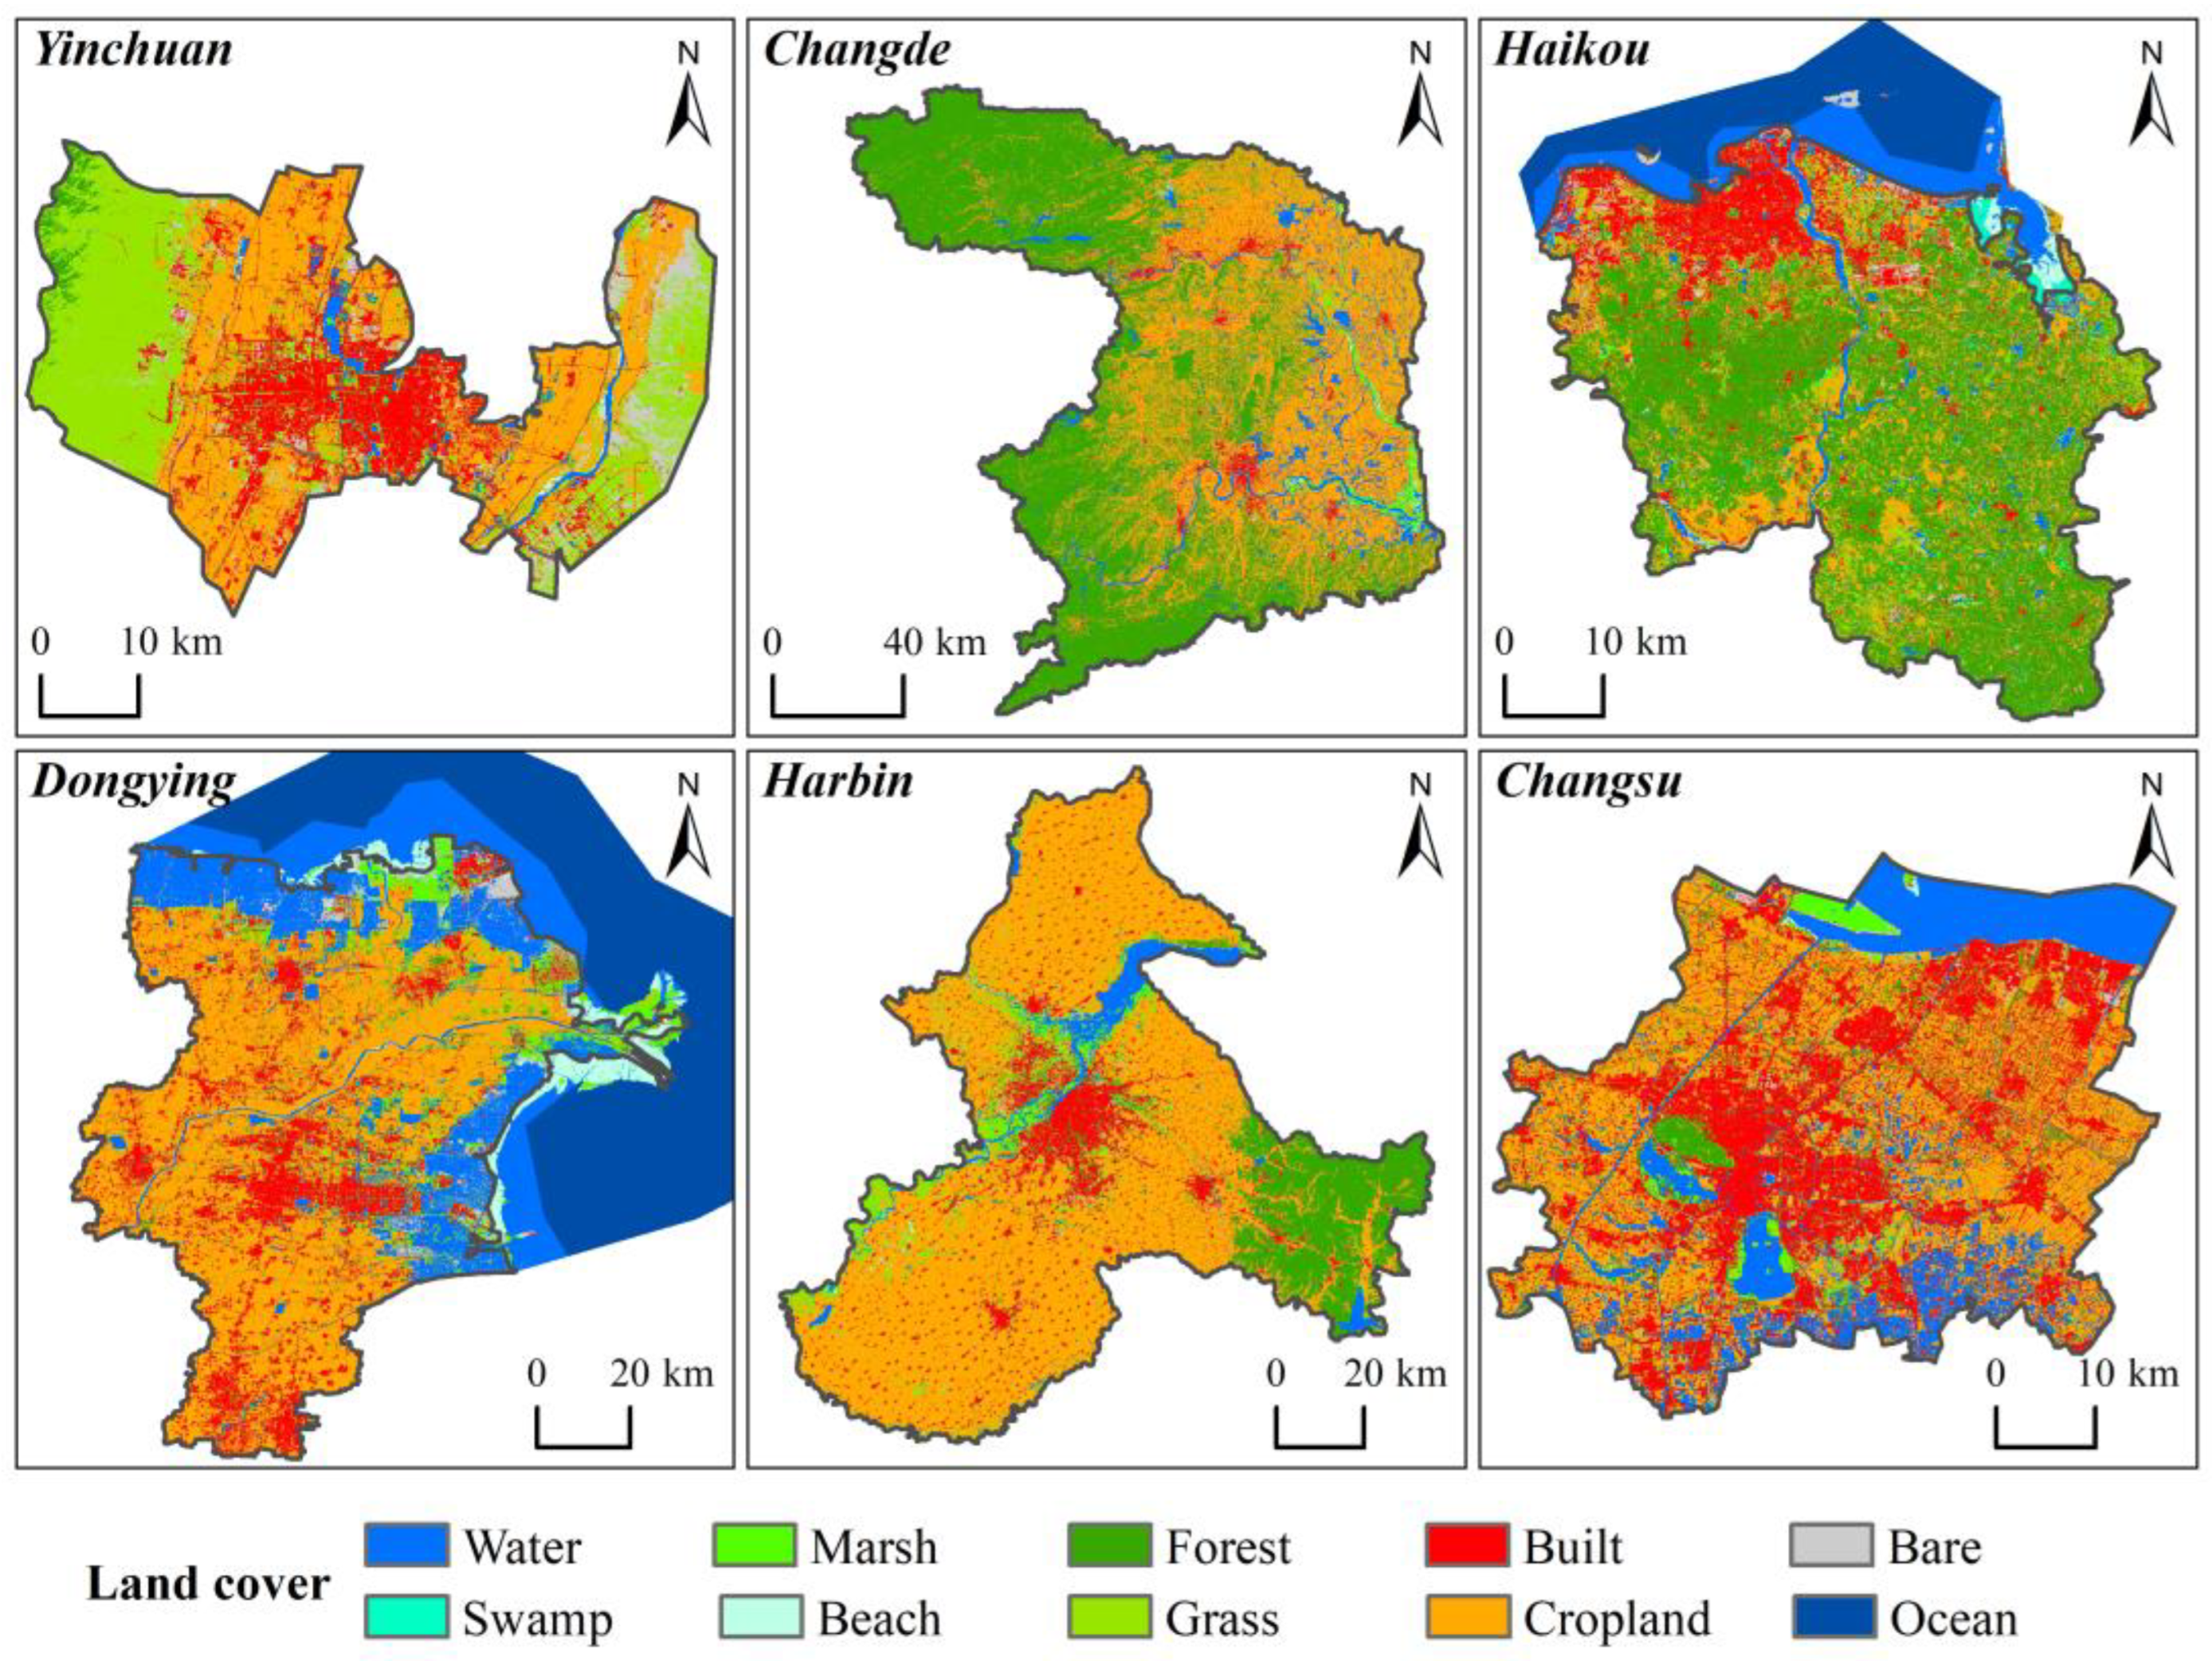
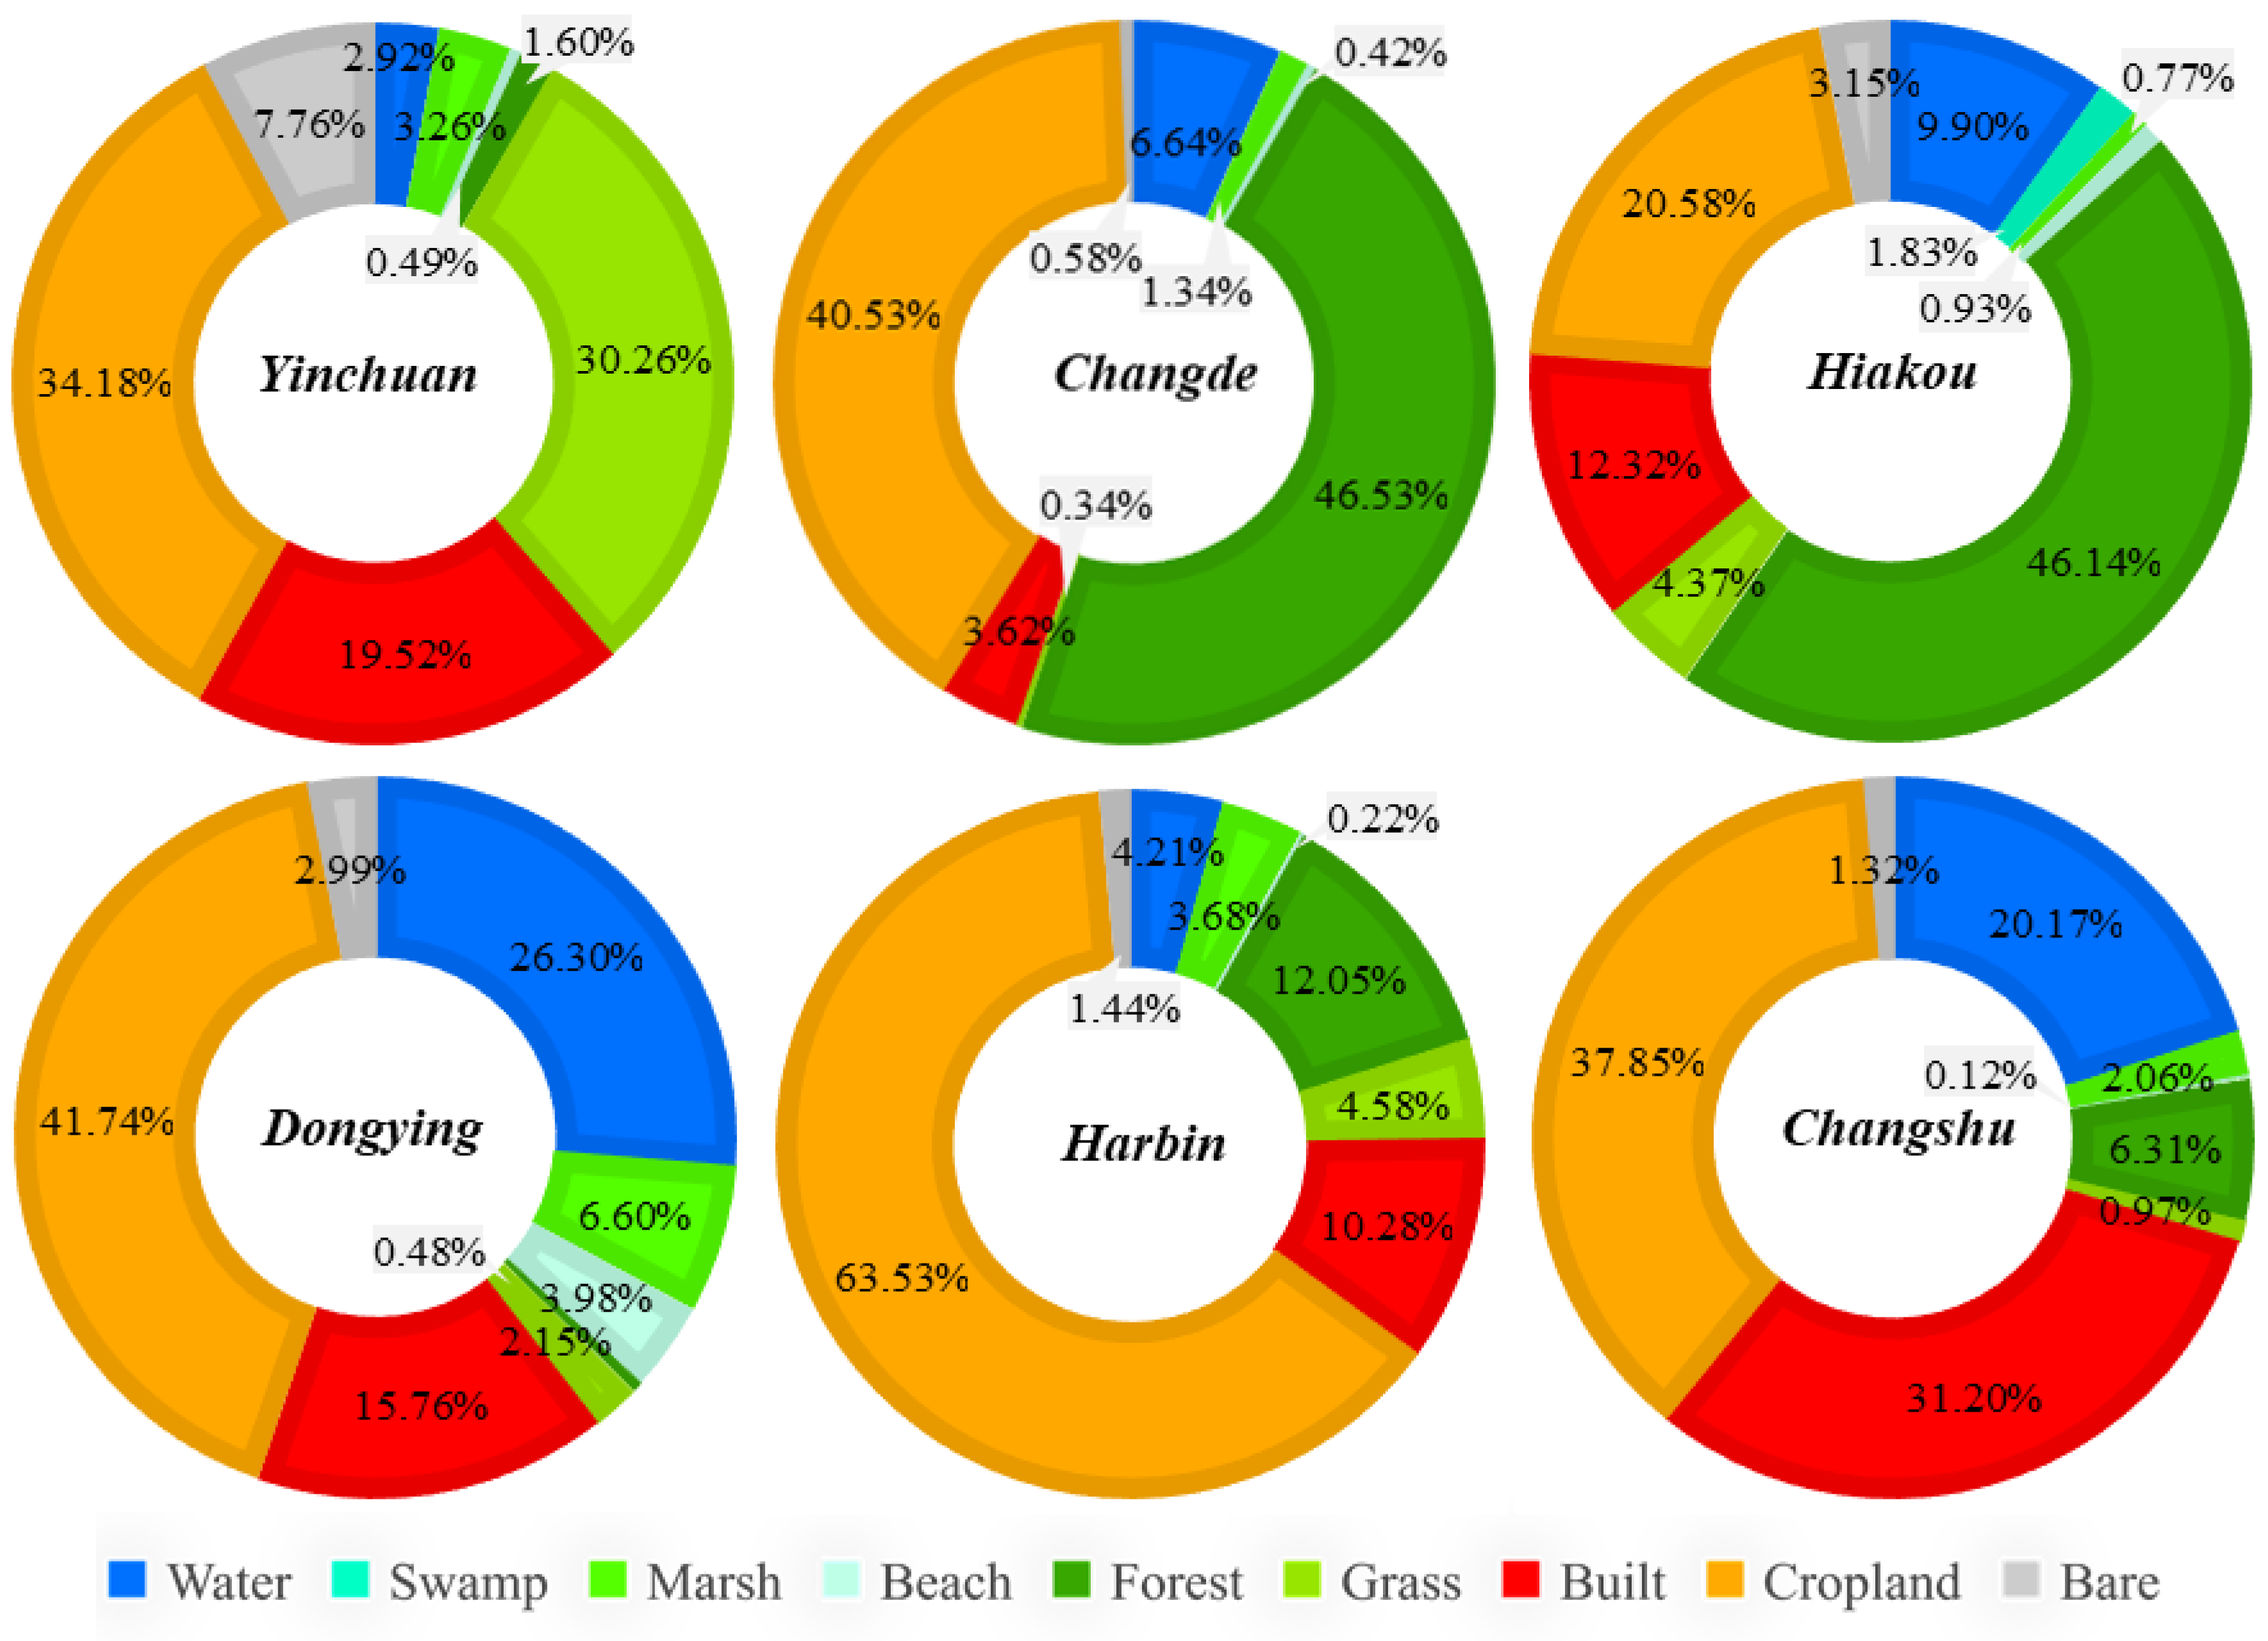
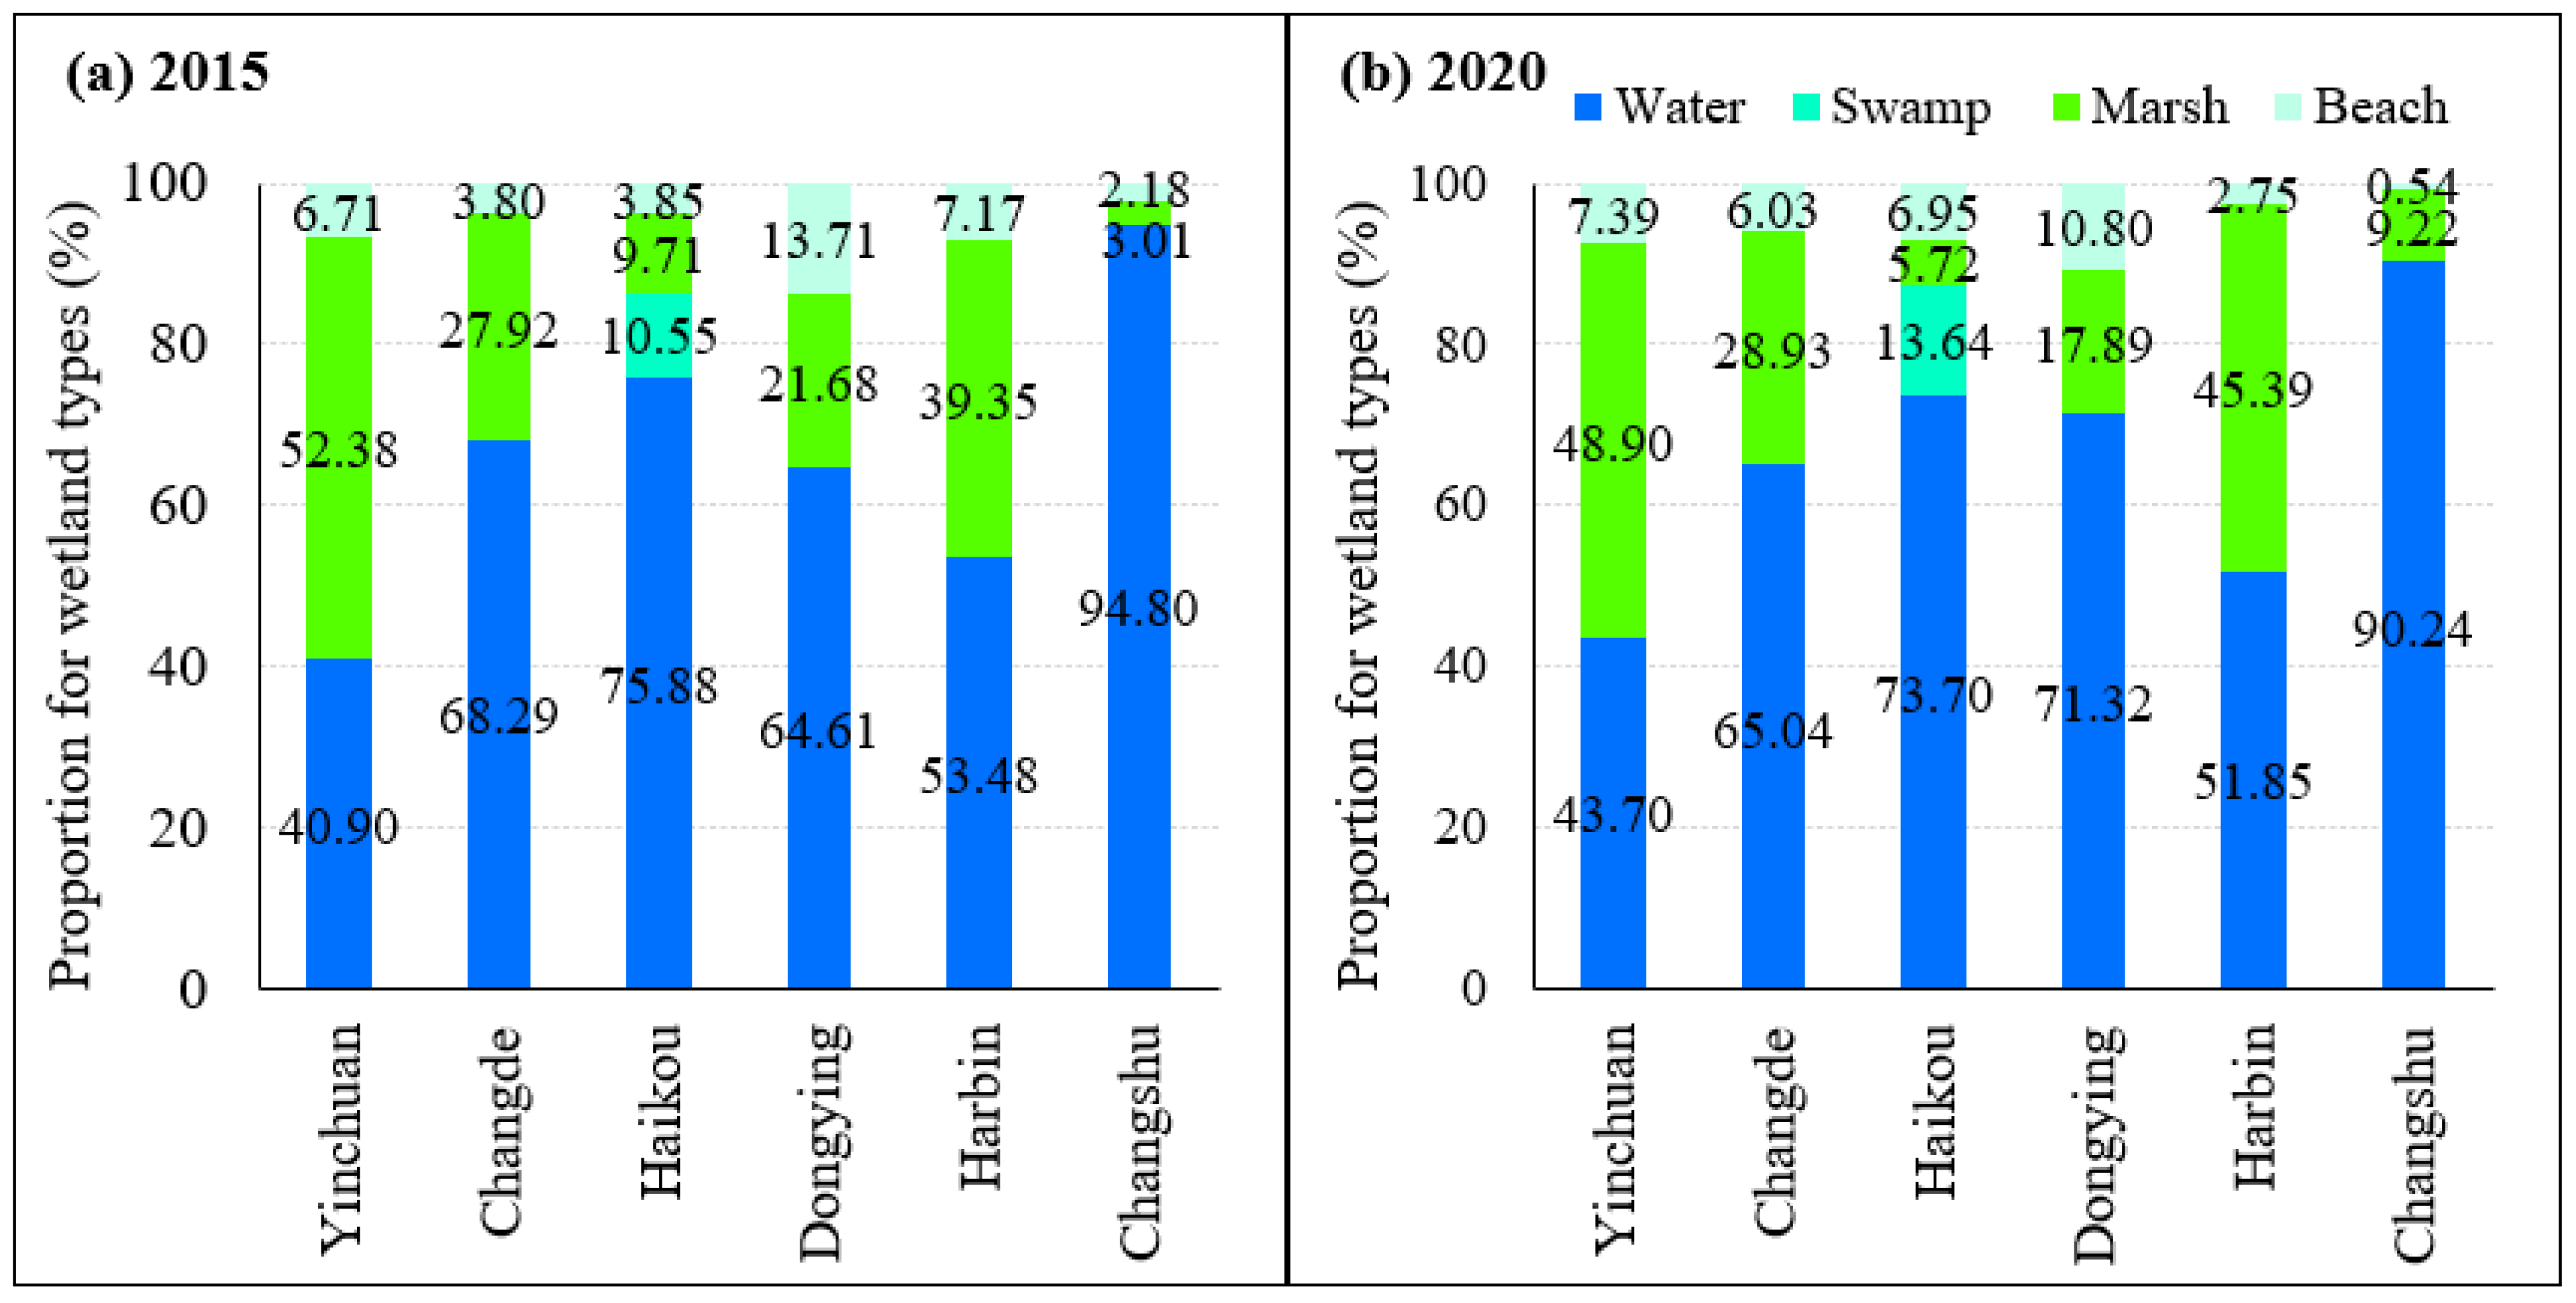
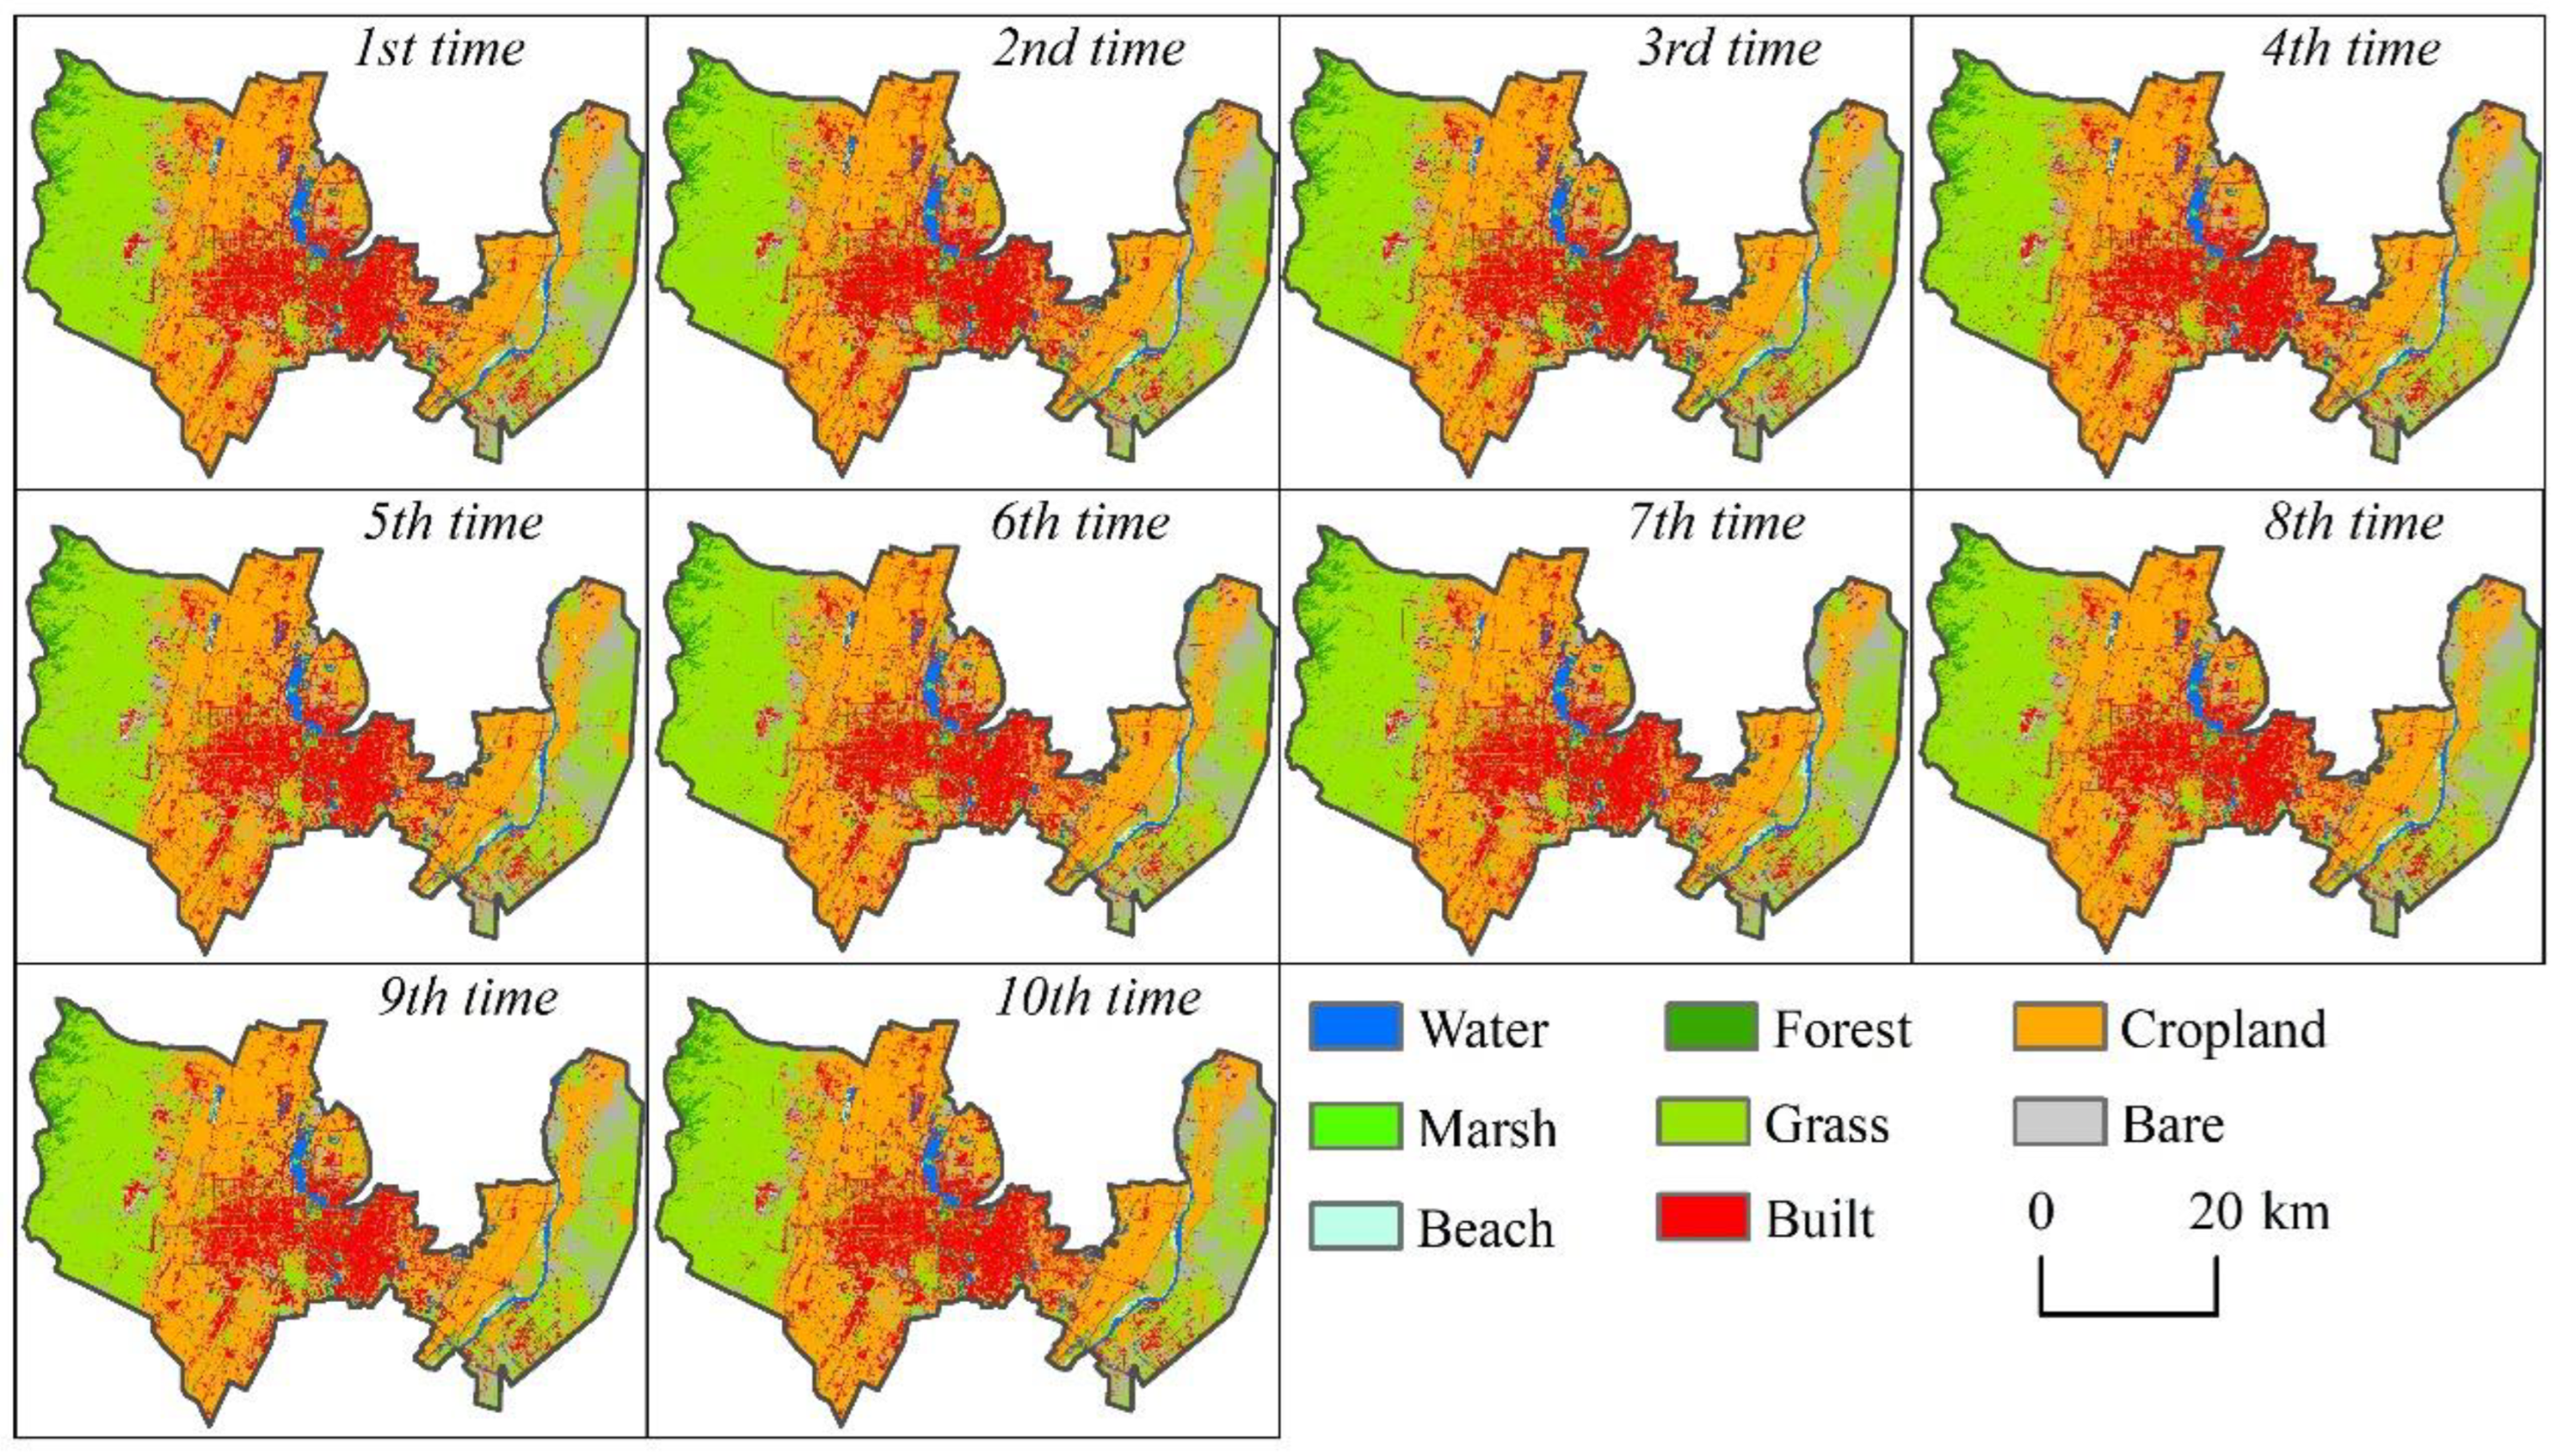
3.2. Land Cover Classification Maps and Statistics

Figure 6 and Figure 7 show the land cover mapping results of six cities in 2015 and 2020, respectively. We found that for cities, cropland or forested areas were the most common land cover type for the non-wetland category, while water was the most common of the wetland category. Among them, cropland in Yinchuan, Changde, Dongying, Harbin and Changshu accounted for more than 30% of the land coverages. There were different land cover characteristics due to the different distribution patterns and characteristics of the different cities. In Yinchuan, which is located in the inland arid area, the cropland occupied the largest fraction of the area (33.3–34.2%), followed by grassland (28.6–30.3%) and built area (19.3–19.5%), and the most common wetland type was marshes. In Changde, an important city in the Dongting Lake Basin, forested areas were the most common land cover types (48.9–50.0%), followed by cropland (39.0–39.0%), and water was the most common type of wetland (5.1–5.3%). In Haikou, a coastal city in the tropics, forested areas again comprised the largest land cover type (46.1–48.4%), followed by cropland (20.6–23.6%), and water was the most common type of wetland (9.9–11.1%). Dongying, a coastal city where the Yellow River estuary is located, was dominated by cropland (41.7–45.8%), followed by water (24.3–26.3%). Harbin, an inland city in the high latitude region, was dominated by cropland (63.5–63.8%), followed by forested areas (12.0–12.1%) and built areas (10.3–10.4%), and the most common wetland type was water (4.2–4.4%). Changshu, an inland city along the Yangtze River, was dominated by cropland (37.9–48.3%), followed by built areas (26.5–31.2%) and water (20.2–20.4%). Cropland was the most common non-wetland land cover type and occupied the largest proportion of urban areas in wetland cities in northern China, such as Yinchuan, Harbin and Dongying. Forest was the most common non-wetland land cover type in wetland cities in southern China, such as Changde and Haikou. Of the wetland land cover types, water occupied the highest fraction of the area in most cities.
By comparing the changes in different land cover types of six cities in 2015 and 2020, it was found that the built areas in most cities increased substantially, while the cropland decreased substantially (Figure 8). Different cities have different change patterns. The grassland and cropland in Yinchuan increased considerably; the proportion of grassland increased from 28.6% in 2015 to 30.3%, and that of cropland increased from 33.3% to 34.2%. However, the change in built area was not significant, and the water and marsh coverage types decreased slightly. The forest in Changde decreased significantly, from 50.0% to 48.9%, and the built area increased from 3.0% to 3.6%. Cropland and forest in Haikou decreased significantly, the proportion of cropland decreased from 23.6% to 20.6%, and the proportion of forestland decreased from 48.4% to 46.1%. However, the built area increased significantly, from 8.9% to 12.3%. Among the wetland types, the water and marshes decreased, while the swamps (mangroves) and beaches increased. The cropland in Dongying decreased significantly, and the proportion of cropland decreased from 45.8% to 41.7%, but the built area and water increased significantly. The proportion of built areas increased from 12.9% to 15.8%, and the proportion of water areas increased from 24.3% to 26.3%. Additionally, swamps and beaches both decreased. Land cover types in Harbin did not change significantly. The cropland in Changshu decreased significantly from 48.3% to 37.9%, while the built area and forest increased significantly. The proportion of built area increased from 26.5% to 31.2%, and the proportion of forestland increased from 2.8% to 6.3%. The change in water of the wetland type was not obvious, but the marsh coverage increased significantly. The increase in built area in these cities was mostly caused by the transformation of cropland or forest. For example, the cropland in Dongying and Changshu decreased significantly, the forest in Changde decreased significantly, and the cropland and forest in Haikou decreased.

3.3. Contribution of Land Cover Classification Results to Wetland City Certification

By calculating the wetland rate and wetland protection rate of the six cities, we found that Dongying had the highest wetland rate (Figure 9), and Haikou had the highest wetland protection rate (Figure 10). The wetland rates in 2015 and 2020 both met the requirements of the China Forestry and Grassland Administration in the “Measures for Nomination of Wetland City Accreditation”, which specified that the wetland rate of coastal cities should be more than 10%, that of inland plain cities should be more than 7%, and that of inland mountain cities should be more than 4%. The wetland protection rate of the six cities in 2020 was above 50%. Comparing the results of 2015 and 2020, we found that the wetland rate of each city was relatively stable. The wetland rates of Yinchuan, Haikou, Dongying and Harbin decreased slightly, while the wetland rates of Changde and Changshu increased slightly. The wetland rate of Yinchuan was 6.68–7.49%, Changde was 7.79–7.90%, Haikou was 13.43–14.62%, Dongying was 36.88–37.56%, Harbin was 8.12–8.16%, and Changshu was 21.49–22.35%. The wetland protection rate of the inland cities increased significantly, while the wetland protection rate of Haikou and Dongying coastal cities decreased. The wetland protection rate of Yinchuan increased from 52.94% to 55.82%, Changde increased from 57.27% to 59.06%, Harbin increased from 49.48% to 54.64%, and Changshu increased from 57.06% to 59.12%. While Haikou decreased from 73.74% to 72.70%, Dongying decreased from 57.47% to 55.75%. These results showed that the wetland coverage of the six wetland cities was relatively stable, and the proportion of wetland in most urban protected areas increased.
By analysing the proportion of different wetland types in six cities, we found that water is the main wetland type in wetland cities, followed by marshes (Figure 11). As an inland city in arid areas, Yinchuan is mainly composed of marshes (48.90–52.38%) and water (40.90–43.70%). Water was the most common wetland type in Changde, Haikou, Dongying, Harbin and Changshu, where it occupied more than 50% of the location. Among these, Changshu had the highest proportion of water coverage at more than 90%. The analysis of other wetland types showed that Haikou was the only city containing swamps (mangroves) among the six cities, and the proportion of wetlands in Haikou reached 10.55–13.64%. Beaches were the most common wetland type in Dongying at 10.80–13.71%. Marshes were the most common wetland type in Yinchuan, reaching 48.90–52.38%, and in Harbin, where they accounted for 39.35–45.39%. Therefore, marshes and water are the main wetland types in wetland cities located in inland, high latitudes and relatively arid areas. Water is the main wetland type in wetland cities located in coastal, low latitudes and relatively humid areas.

4. Discussion

4.1. Comparison with Other Studies

This study is the first to carry out land cover classification of four wetland types for the first group of wetland cities in China while also exploring their contributions to the creation of internationally recognized wetland cities. In terms of land cover data, this study comprehensively analysed the optical and radar data collected by Sentinel-1 and Sentinel-2 to complete the land cover classification. Additionally, this work adopted a 10-fold random forest method to improve the accuracy of the classification. At present, many studies use data from Sentinel-1 and Sentinel-2 to classify land cover, which is more advantageous than other satellite datasets for land cover classification [33,36]. Compared with other land cover products, this study includes four wetland types to characterize the unique wetland characteristics of the city. ESA_WC10 includes three wetland types: permanent water bodies, herbaceous wetlands, and mangroves. DW10 includes two wetland types: water and flood vegetation. In addition, this study used the results of the land cover classification to calculate the wetland rate and wetland protection rate, which can support the development of internationally recognized wetland cities and contribute to the wetland city accreditation. Our research found that the wetland rate and wetland protection rate of the first group of wetland cities in China still satisfy the requirements of the “Nomination Methods for Wetland City Accreditation”. Additionally, we also analysed the distribution characteristics of wetlands in the first wetland cities in China, and now have a deeper understanding of the wetland cities in China, which plays both a leading and supporting role in maintaining wetland cities.

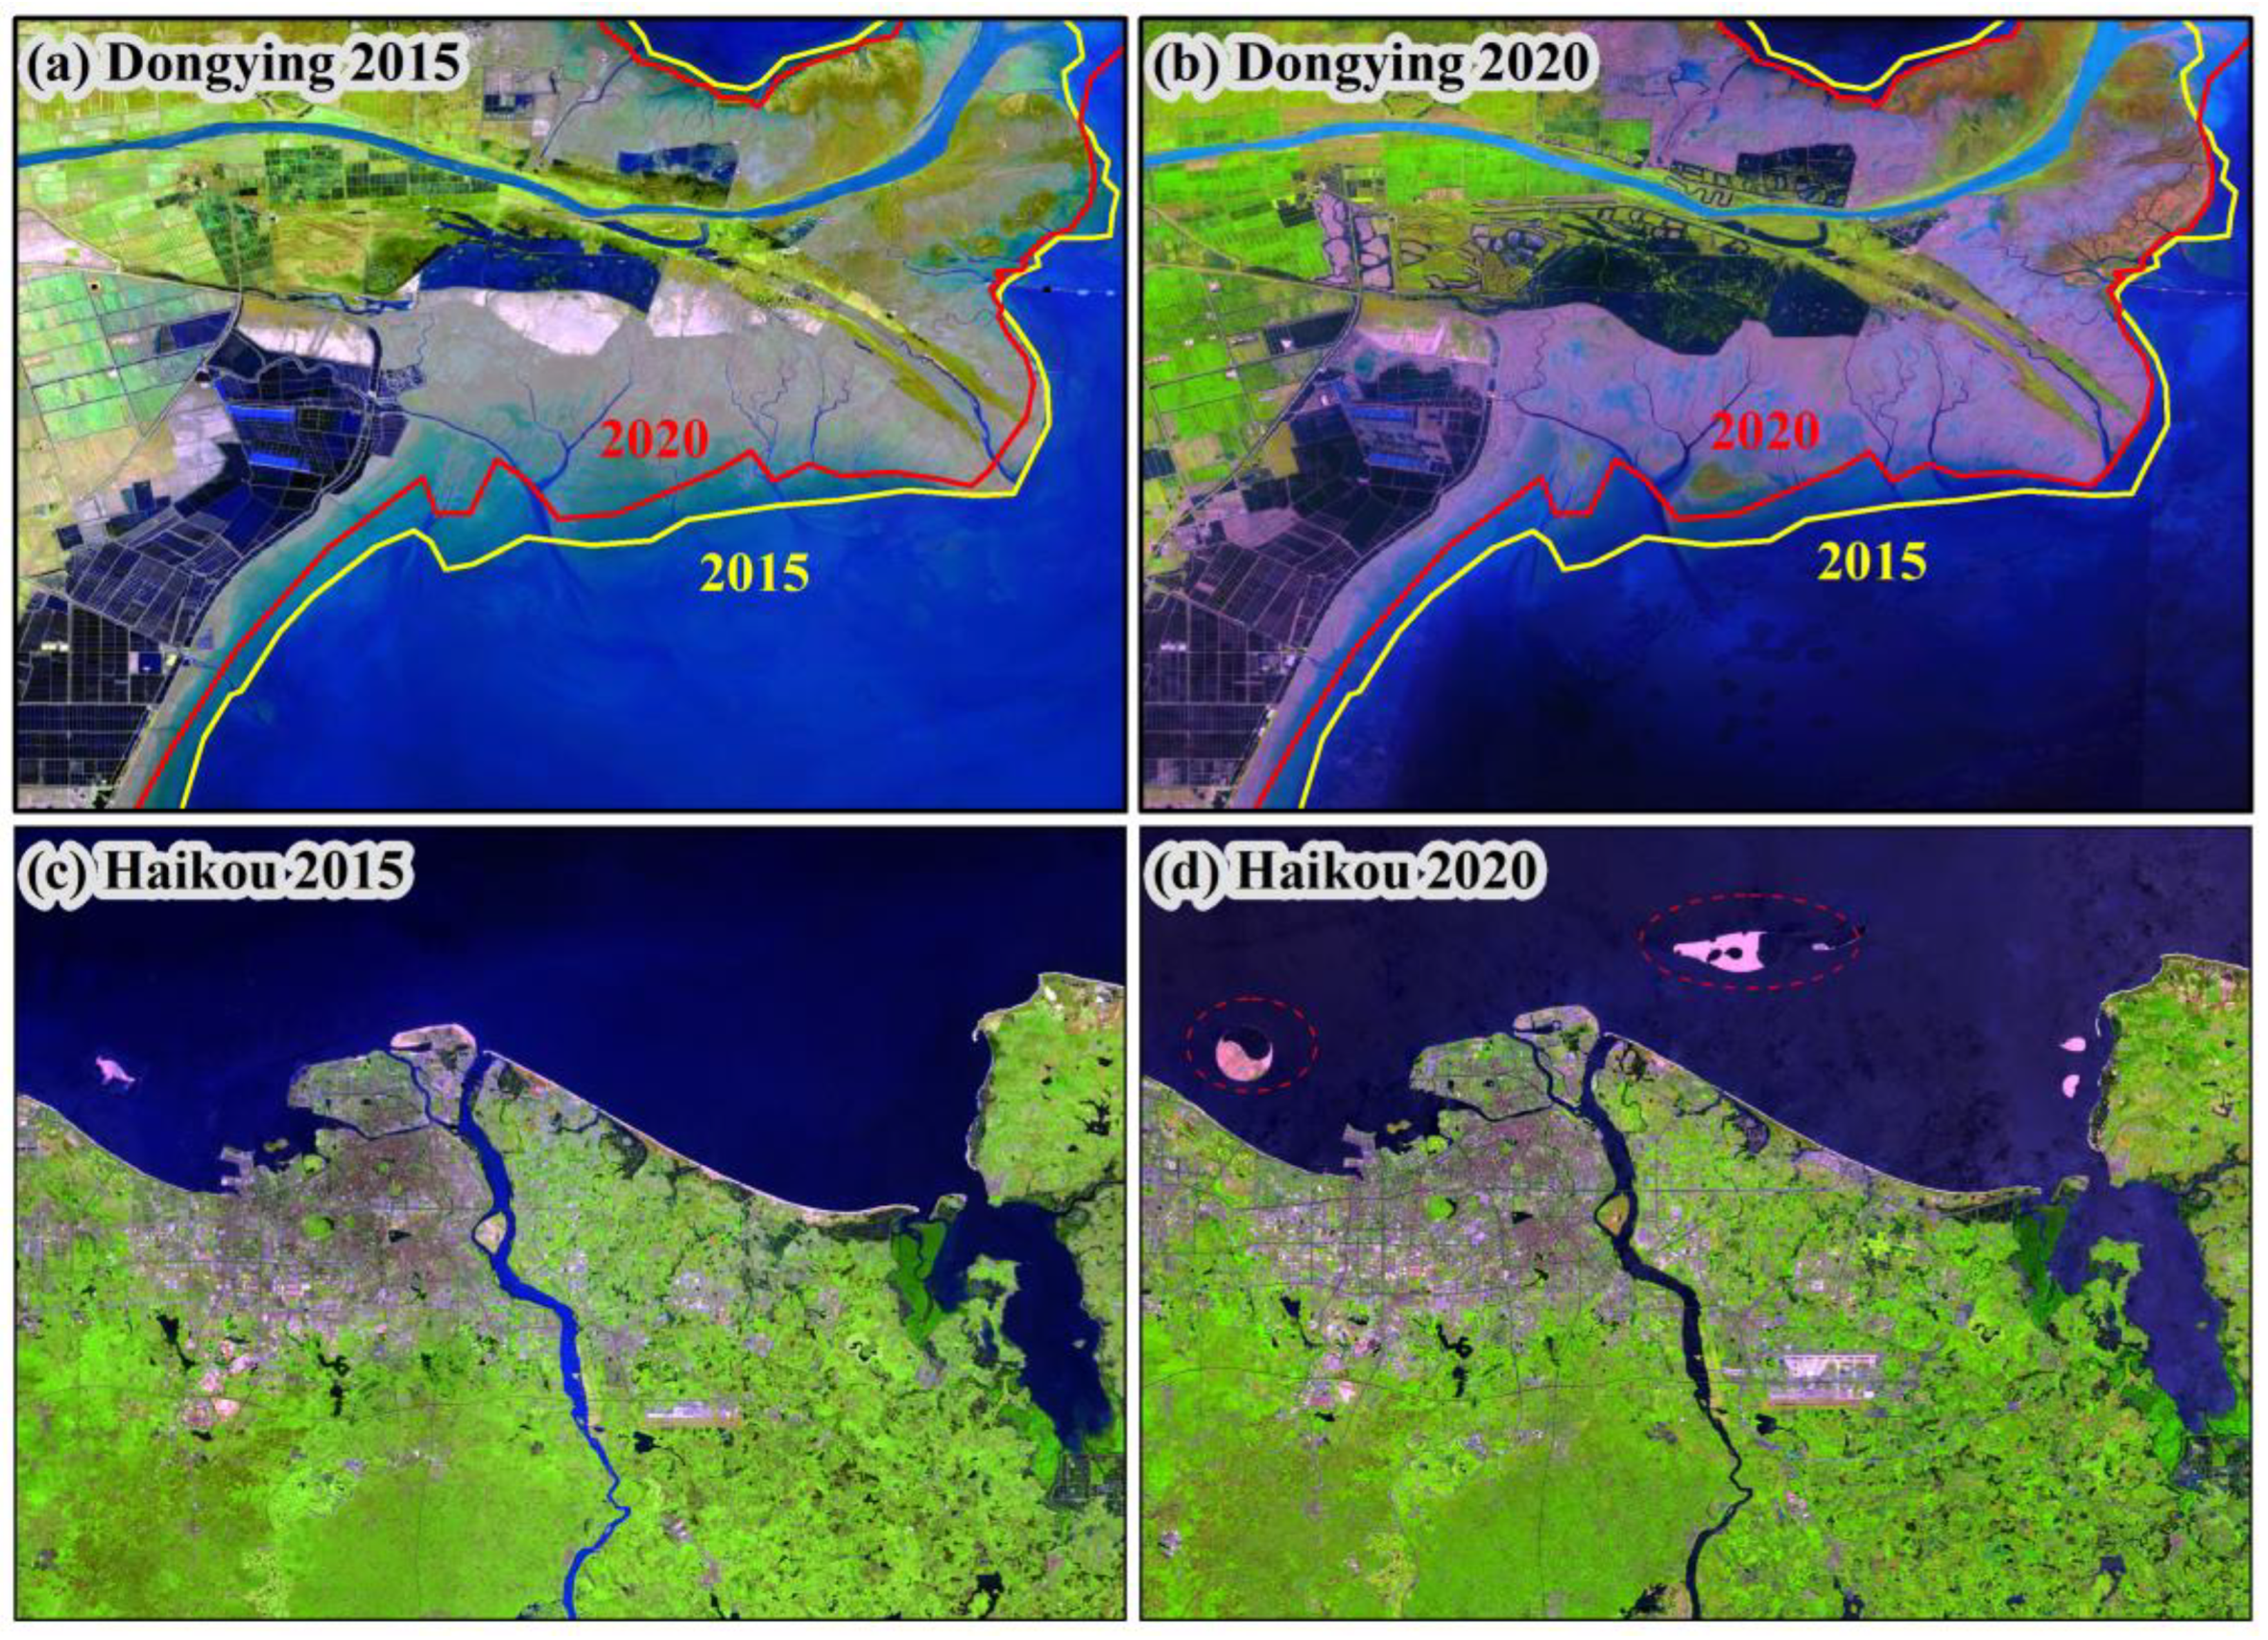
4.2. Reasons for the Change in Wetland Rate and Wetland Protection Rate in Different Cities

Our study found that the wetland rate was relatively stable, and the wetland protection rate increased significantly in the four inland cities, but decreased in the two coastal cities. The increase in the wetland protection rate is closely related to the strengthening of wetland protection by city governments in the process of establishing international wetland cities. For example, Yinchuan City has compiled the “Yinchuan Wetland Protection and Restoration System Work Plan” to carry out wetland protection and restoration work (http://www.yinchuan.gov.cn/xwzx/mrdt/201901/t20190131_1271443.html (accessed on 15 November 2022)). Harbin issued “Harbin Wetland Protection Measures” to strengthen wetland protection and management (http://www.harbin.gov.cn/art/2021/11/23/art_223_21145.htm (accessed on 15 November 2022)). Changshu formulated the “Changshu Wetland Protection Plan (2017–2030)” to promote wetland protection (http://www.changshu.gov.cn//zgcs/c108191/201707/8d3bbff9bcae4e67ab7f01535ab95fa5.shtml (accessed on 15 November 2022)). Haikou and Dongying also introduced relevant wetland protection policies to strengthen wetland protection [12]. However, from our results, we found that the wetland protection rate in these two cities decreased, which might be related to the change in coastline, leading to the change in coastal shallow water or tidal flats. The Yellow River Delta is the main wetland distribution area in Dongying. The main reason for the reduction in the wetland area in reserves may be related to the obvious reduction in the beach in the Yellow River Delta (Figure 12a,b). Many studies have noted that, due to the remarkable effect of sand control in the Yellow River in recent years, the sand content of the Yellow River has decreased [37]. Therefore, the accumulation of sediment in the Yellow River Delta is reduced, which in turn leads to the reduction of the beach in the Yellow River Delta. Haikou, as a tropical coastal city, has seen a substantial increase in coastline development, with a large number of artificial coastlines and artificial islands being constructed (Figure 12c,d). This will lead to the encroachment of this type of wetland in shallow coastal regions, and a decline in the wetland rates and wetland protection rates [38,39].

4.3. Deficiencies and Prospects

Although four wetland types were added to the land cover classification in this study, there are still some deficiencies. In the classification, it is easy to confuse grassland, marshes and cropland, and the beach and bare land are also easily misclassified. This is due to the spectral similarity among ground objects, and it is also an important problem that needs to be considered and solved in future land cover classification. In addition, shadows in urban areas are easily mistaken for water bodies, especially in cities at high latitudes. Methods for correcting land cover misclassification problems caused by shadows need to be developed to improve land cover classification.
Considering the abundance of remote sensing data, methods that can rapidly and effectively utilize real-time remote sensing data to monitor wetland cities need further exploration. This technology plays an important role in supporting the protection and management of urban wetlands and promotes the sustainable development of cities, while also contributing to the creation of internationally recognized wetland cities.

5. Conclusions

Based on Sentinel-1 and 2 data, this study used the 10-fold random forest method to obtain the land cover classification results of the first six wetland cities in China by using data from 2015 and 2020 with a resolution of 10 m, which included four wetland types. We analysed the wetland characteristics of the first six wetland cities in China and explored what contributions the land cover classification results of this study can provide to the establishment of other wetland cities. Our research found that:
(1) The land cover classification results obtained by combining Sentinel-1 and 2 data with a 10-fold random forest method were accurate. Additionally, the overall accuracies of the six cities were above 90%, the Kappa coefficients were above 0.88, and the user’s accuracy and producer’s accuracy of various categories were basically above 70%. Compared with other 10 m land cover data products, the wetland types considered here are more diverse, which is beneficial to the monitoring of wetland cities.
(2) By analysing the distribution characteristics of land cover types in six cities, it was found that Yinchuan, Dongying, Harbin and Changshu had more than 30% cropland, Changde and Haikou had more than 45% forested areas, and water accounted for the largest proportion of wetland types in all cities except Yinchuan. By comparing land cover changes from 2015 to 2020, it was found that the built area in Changde, Haikou, Dongying and Changshu increased significantly while cropland or forest decreased significantly.
(3) Through the analysis, it could be found that according to the results of land cover classification, the wetland rate and wetland protection rate can be calculated to contribute to the certification of wetland cities. The wetland rate and wetland protection rate of the six cities satisfy the requirements of the “Nomination Method for Wetland City Accreditation”. The wetland rate was more than 6% and the wetland protection rate was more than 50% in 2020. Compared with 2015 and 2020, the wetland rates of the six cities were relatively stable. The wetland protection rate of inland cities increased significantly, and the wetland rate of coastal cities decreased, which might be related to changes in the coastline.
This study can provide a reference for using remote sensing techniques to monitor internationally recognized wetland cities while also supporting the creation of additional wetland cities.

Author Contributions

Conceptualization, X.W. and W.J.; methodology, K.P., X.W. and Y.D.; writing—original draft preparation, X.W. and X.Y.; writing—review and editing, Z.L. and P.R. All authors have read and agreed to the published version of the manuscript.

Funding

This research was funded by the National Key Research and Development Program of China (2020YFC1807403), and the National Natural Science Foundation of China (U21A2022, U1901219 and 42071393).

Institutional Review Board Statement

Not applicable.

Informed Consent Statement

Not applicable.

Data Availability Statement

Land cover classification data for the first Chinese wetland cities in 2015 and 2020 are available in Zenodo (https://doi.org/10.5281/zenodo.7674675).

Conflicts of Interest

The authors declare no conflict of interest.

Appendix A

Figure A1. The ten times classification results of Yinchuan in 2020.
Remotesensing 15 01275 g0a1

References

  1. Wang, M.; Mao, D.; Wang, Y.; Song, K.; Yan, H.; Jia, M.; Wang, Z. Annual Wetland Mapping in Metropolis by Temporal Sample Migration and Random Forest Classification with Time Series Landsat Data and Google Earth Engine. Remote Sens. 2022, 14, 3191. [Google Scholar] [CrossRef]
  2. Junk, W.J.; An, S.; Finlayson, C.M.; Gopal, B.; Květ, J.; Mitchell, S.A.; Mitsch, W.J.; Robarts, R.D. Current State of Knowledge Regarding the World’s Wetlands and Their Future under Global Climate Change: A Synthesis. Aquat. Sci. 2013, 75, 151–167. [Google Scholar] [CrossRef] [Green Version]
  3. Alikhani, S.; Nummi, P.; Ojala, A. Urban Wetlands: A Review on Ecological and Cultural Values. Water 2021, 13, 3301. [Google Scholar] [CrossRef]
  4. Dong, M. Urban Wetland Ecosystem Ecology; Ecological research; Science Press: Beijing, China, 2018; pp. 10–20. [Google Scholar]
  5. Mao, D.; Wang, Z.; Wu, J.; Wu, B.; Zeng, Y.; Song, K.; Yi, K.; Luo, L. China’s Wetlands Loss to Urban Expansion. Land Degrad. Dev. 2018, 29, 2644–2657. [Google Scholar] [CrossRef]
  6. Kent, B.J.; Mast, J.N. Wetland Change Analysis of San Dieguito Lagoon, California, USA: 1928–1994. Wetlands 2005, 25, 780. [Google Scholar] [CrossRef]
  7. Hettiarachchi, M.; Morrison, T.H.; McAlpine, C. Forty-Three Years of Ramsar and Urban Wetlands. Glob. Environ. Chang. 2015, 32, 57–66. [Google Scholar] [CrossRef] [Green Version]
  8. Wang, H.; Liu, M.; Zhao, Y.; Wen, Y. International Wetland City Certification and suggestions for China’s promotion. World For. Res. 2017, 30, 6–11. (In Chinese) [Google Scholar]
  9. Zhang, M.; Cui, L.; Guo, Z.; Lei, Y.; Li, M.; Wang, H.; Yang, S.; Wei, Y.; Xiao, H. The concept, connotation and prospect of “wetland city” Wetland. Sci. Manag. 2017, 13, 63–66. (In Chinese) [Google Scholar]
  10. Ma, Z.; Zhang, M. From the 12th Conference of the Parties to the Wetlands Convention to see the development trend of international wetland protection and management. Wetl. Sci. 2015, 13, 523–527. (In Chinese) [Google Scholar]
  11. Zhang, H.; Jia, E.; Fang, Y.; Dong, K.; Jia, W. Experience and enlightenment of Haikou International Wetland City. Wetl. Sci. Manag. 2019, 15, 23–26. (In Chinese) [Google Scholar]
  12. Mahdianpari, M.; Granger, J.E.; Mohammadimanesh, F.; Warren, S.; Puestow, T.; Salehi, B.; Brisco, B. Smart Solutions for Smart Cities: Urban Wetland Mapping Using Very-High Resolution Satellite Imagery and Airborne LiDAR Data in the City of St. John’s, NL, Canada. J. Environ. Manag. 2021, 280, 111676. [Google Scholar] [CrossRef]
  13. Chen, J.; Chen, J.; Liao, A.; Cao, X.; Chen, L.; Chen, X.; He, C.; Han, G.; Peng, S.; Lu, M.; et al. Global Land Cover Mapping at 30m Resolution: A POK-Based Operational Approach. ISPRS J. Photogramm. Remote Sens. 2015, 103, 7–27. [Google Scholar] [CrossRef] [Green Version]
  14. Zhang, X.; Liu, L.; Chen, X.; Gao, Y.; Xie, S.; Mi, J. GLC_FCS30: Global Land-Cover Product with Fine Classification System at 30 m Using Time-Series Landsat Imagery. Earth Syst. Sci. Data 2021, 13, 2753–2776. [Google Scholar] [CrossRef]
  15. Yang, J.; Huang, X. The 30 m Annual Land Cover Dataset and Its Dynamics in China from 1990 to 2019. Earth Syst. Sci. Data 2021, 13, 3907–3925. [Google Scholar] [CrossRef]
  16. Brown, C.F.; Brumby, S.P.; Guzder-Williams, B.; Birch, T.; Hyde, S.B.; Mazzariello, J.; Czerwinski, W.; Pasquarella, V.J.; Haertel, R.; Ilyushchenko, S.; et al. Dynamic World, Near Real-Time Global 10 m Land Use Land Cover Mapping. Sci. Data 2022, 9, 251. [Google Scholar] [CrossRef]
  17. Zanaga, D.; Van De Kerchove, R.; Daems, D.; De Keersmaecker, W.; Brockmann, C.; Kirches, G.; Wevers, J.; Cartus, O.; Santoro, M.; Fritz, S.; et al. ESA WorldCover 10 m 2020 v100 (Version v100) [Data set]. Zenodo 2021. [Google Scholar] [CrossRef]
  18. Feng, S.; Li, W.; Xu, J.; Liang, T.; Ma, X.; Wang, W.; Yu, H. Land Use/Land Cover Mapping Based on GEE for the Monitoring of Changes in Ecosystem Types in the Upper Yellow River Basin over the Tibetan Plateau. Remote Sens. 2022, 14, 5361. [Google Scholar] [CrossRef]
  19. Forkuor, G.; Dimobe, K.; Serme, I.; Tondoh, J.E. Landsat-8 vs. Sentinel-2: Examining the Added Value of Sentinel-2’s Red-Edge Bands to Land-Use and Land-Cover Mapping in Burkina Faso. GIScience Remote Sens. 2018, 55, 331–354. [Google Scholar] [CrossRef]
  20. Zhang, F.; Yang, X. Improving Land Cover Classification in an Urbanized Coastal Area by Random Forests: The Role of Variable Selection. Remote Sens. Environ. 2020, 251, 112105. [Google Scholar] [CrossRef]
  21. Denize, J.; Hubert-Moy, L.; Betbeder, J.; Corgne, S.; Baudry, J.; Pottier, E. Evaluation of Using Sentinel-1 and -2 Time-Series to Identify Winter Land Use in Agricultural Landscapes. Remote Sens. 2019, 11, 37. [Google Scholar] [CrossRef] [Green Version]
  22. Valdivieso-Ros, C.; Alonso-Sarria, F.; Gomariz-Castillo, F. Effect of the Synergetic Use of Sentinel-1, Sentinel-2, LiDAR and Derived Data in Land Cover Classification of a Semiarid Mediterranean Area Using Machine Learning Algorithms. Remote Sens. 2023, 15, 312. [Google Scholar] [CrossRef]
  23. Mahdianpari, M.; Salehi, B.; Mohammadimanesh, F.; Homayouni, S.; Gill, E. The First Wetland Inventory Map of Newfoundland at a Spatial Resolution of 10 m Using Sentinel-1 and Sentinel-2 Data on the Google Earth Engine Cloud Computing Platform. Remote Sens. 2019, 11, 43. [Google Scholar] [CrossRef] [Green Version]
  24. Pekel, J.-F.; Cottam, A.; Gorelick, N.; Belward, A.S. High-Resolution Mapping of Global Surface Water and Its Long-Term Changes. Nature 2016, 540, 418–422. [Google Scholar] [CrossRef]
  25. Murray, N.J.; Phinn, S.R.; DeWitt, M.; Ferrari, R.; Johnston, R.; Lyons, M.B.; Clinton, N.; Thau, D.; Fuller, R.A. The Global Distribution and Trajectory of Tidal Flats. Nature 2019, 565, 222–225. [Google Scholar] [CrossRef] [PubMed]
  26. Mcowen, C.J.; Weatherdon, L.V.; Van Bochove, J.-W.; Sullivan, E.; Blyth, S.; Zockler, C.; Stanwell-Smith, D.; Kingston, N.; Martin, C.S.; Spalding, M.; et al. A Global Map of Saltmarshes. Biodivers. Data J. 2017, 5, e11764. [Google Scholar] [CrossRef] [PubMed]
  27. Zhang, T.; Hu, S.; He, Y.; You, S.; Yang, X.; Gan, Y.; Liu, A. A Fine-Scale Mangrove Map of China Derived from 2-Meter Resolution Satellite Observations and Field Data. ISPRS Int. J. Geo-Inf. 2021, 10, 92. [Google Scholar] [CrossRef]
  28. Zhang, Z.; Xu, N.; Li, Y.; Li, Y. Sub-Continental-Scale Mapping of Tidal Wetland Composition for East Asia: A Novel Algorithm Integrating Satellite Tide-Level and Phenological Features. Remote Sens. Environ. 2022, 269, 112799. [Google Scholar] [CrossRef]
  29. Wang, X.; Jiang, W.; Peng, K.; Li, Z.; Rao, P. A Framework for Fine Classification of Urban Wetlands Based on Random Forest and Knowledge Rules: Taking the Wetland Cities of Haikou and Yinchuan as Examples. GIScience Remote Sens. 2022, 59, 2144–2163. [Google Scholar] [CrossRef]
  30. Mao, D.; Wang, Z.; Du, B.; Li, L.; Tian, Y.; Jia, M.; Zeng, Y.; Song, K.; Jiang, M.; Wang, Y. National wetland mapping in China: A new product resulting from object-based and hierarchical classification of Landsat 8 OLI images. ISPRS J. Photogramm. Remote Sens. 2020, 164, 11–25. [Google Scholar] [CrossRef]
  31. Jia, M.; Mao, D.; Wang, Z.; Ren, C.; Zhu, Q.; Li, X.; Zhang, Y. Tracking Long-Term Floodplain Wetland Changes: A Case Study in the China Side of the Amur River Basin. Int. J. Appl. Earth Obs. Geoinf. 2020, 92, 102185. [Google Scholar] [CrossRef]
  32. Calderón-Loor, M.; Hadjikakou, M.; Bryan, B. High-resolution wall-to-wall land-cover mapping and land change assessment for Australia from 1985 to 2015. Remote Sens. Environ. 2021, 252, 112148. [Google Scholar] [CrossRef]
  33. Schulz, D.; Yin, H.; Tischbein, B.; Verleysdonk, S.; Adamou, R.; Kumar, N. Land Use Mapping Using Sentinel-1 and Sentinel-2 Time Series in a Heterogeneous Landscape in Niger, Sahel. ISPRS J. Photogramm. Remote Sens. 2021, 178, 97–111. [Google Scholar] [CrossRef]
  34. Peng, K.; Jiang, W.; Ling, Z.; Hou, P.; Deng, Y. Evaluating the Potential Impacts of Land Use Changes on Ecosystem Service Value under Multiple Scenarios in Support of SDG Reporting: A Case Study of the Wuhan Urban Agglomeration. J. Clean. Prod. 2021, 307, 127321. [Google Scholar] [CrossRef]
  35. Olofsson, P.; Foody, G.M.; Herold, M.; Stehman, S.V.; Woodcock, C.E.; Wulder, M.A. Good Practices for Estimating Area and Assessing Accuracy of Land Change. Remote Sens. Environ. 2014, 148, 42–57. [Google Scholar] [CrossRef]
  36. Hu, B.; Xu, Y.; Huang, X.; Cheng, Q.; Ding, Q.; Bai, L.; Li, Y. Improving Urban Land Cover Classification with Combined Use of Sentinel-2 and Sentinel-1 Imagery. ISPRS Int. J. Geo-Inf. 2021, 10, 533. [Google Scholar] [CrossRef]
  37. Zhu, Q.; Li, P.; Li, Z.; Pu, S.; Wu, X.; Bi, N.; Wang, H. Spatiotemporal Changes of Coastline over the Yellow River Delta in the Previous 40 Years with Optical and SAR Remote Sensing. Remote Sens. 2021, 13, 1940. [Google Scholar] [CrossRef]
  38. Fu, F. Research on the Development and Protection of Coastline in Jiangdong New District of Haikou City. Technol. Ind. Straits 2019, 237, 20–21+24. (In Chinese) [Google Scholar]
  39. Zhang, X.; Zhang, J.; Li, Q.; Chen, F.; Jiang, J. Comprehensive Evaluation of the Suitability of Coastline Resources Development in Haikou City. J. Appl. Oceanogr. 2021, 40, 493–501. (In Chinese) [Google Scholar]
Figure 1. Map of the first Chinese wetland cities (false colour composite based on R: Band 12, G: Band 8, B: Band 4 from the Sentinel-2 sensor).
Remotesensing 15 01275 g001
Figure 2. Overall accuracy (OA) and the Kappa coefficient in 6 cities.
Remotesensing 15 01275 g002
Figure 3. Producer’s accuracy (PA) and user’s accuracy (UA) for land cover types in 6 cities in 2015.
Remotesensing 15 01275 g003
Figure 4. Producer’s accuracy (PA) and user’s accuracy (UA) for land cover types in 6 cities in 2020.
Remotesensing 15 01275 g004
Figure 5. Visual comparison of this study (LC2020) with Sentinel-2 RGB, ESA_WC10 and DW10 products for the typical areas of 6 cities in 2020.
Remotesensing 15 01275 g005
Figure 6. Spatial distribution of land cover for 6 cities in 2015.
Remotesensing 15 01275 g006
Figure 7. Spatial distribution of land cover for 6 cities in 2020.
Remotesensing 15 01275 g007
Figure 8. Proportion of land cover within 6 cities during 2015 and 2020 (the inner ring denotes the year of 2015, the outer ring denotes the year of 2020).
Remotesensing 15 01275 g008
Figure 9. Wetland rate (WR) for 6 cities in 2015 and 2020.
Remotesensing 15 01275 g009
Figure 10. Wetland protection rate (WPR) for 6 cities in 2015 and 2020.
Remotesensing 15 01275 g010
Figure 11. Wetland proportion for wetland types for 6 cities in 2015 (a) and 2020 (b).
Remotesensing 15 01275 g011
Figure 12. Remote sensing images in the coastal area of Dongying and Haikou. The yellow and red solid lines indicate the coastal beach areas of Dongying coastal region in 2015 and 2020, respectively.
Remotesensing 15 01275 g012
Table 1. Area and wetland information about Chinese wetland cities (the area of brackets indicates the area, including coastal extension regions).
CityArea (km2)Wetland Characteristics
Yinchuan1805.03The city is located in the arid northwest region, which is where the Yellow River flows, characterized by swampy wetlands along the river
Changde18,176.79The city is located in the Dongting Lake Basin, characterized by lake wetlands
Haikou2232.42 (2745.46)The city is located in a low latitude area, characterized by offshore and coastal wetlands
Dongying7146.67 (11,900.37)The city located at the mouth of the Yellow River, characterized by the Yellow River Delta wetlands
Harbin10,184.40The city is located in a high latitude area, through which the Songhua River flows, characterized by alpine wetlands, swamps and riverine wetlands
Changshu1276.48The city is a county-level city belonging to Suzhou, Jiangsu Province. It is located in the economically developed Yangtze River Delta area and is characterized by wetlands along the Yangtze River and wetlands in Jiangnan water towns
Table 2. The number of remote sensing images of 6 cities in 2015 and 2020.
YearImageYinchuanChangdeHaikouDongyingHarbinChangshu
2015Sentinel-133920525827
Sentinel-210198732021
Landsat-834192661538
2020Sentinel-1117137154289112142
Sentinel-211119797372356107
Table 3. Land cover classification scheme for wetland cities.
ClassDescription
WetlandWaterPersistent water cover (e.g., ocean, estuaries, rivers, lakes, canals)
SwampNatural wetland with dominant woody vegetation, including forested wetland and shrub wetland
MarshNatural wetland with dominant herbaceous vegetation
BeachBeach environments between the normal water level and the flood level of rivers and lakes or below the flood level of seasonal lakes and rivers
Non-wetlandForestNatural woody vegetation coverage area, including forests and shrubs
GrassThe land is covered by natural herbaceous vegetation, and the coverage is greater than 10%, and urban artificial grassland.
BuiltThe surface is formed by artificial construction activities, including various residential areas, such as towns, industrial and mining, transportation facilities, etc.
CroplandLand cover for planting crops
BareNaturally, covered land with vegetation coverage of less than 10%, including desert, sandy land, gravel land, bare rock, saline–alkali land, etc.
Table 4. Training and validation sample points in 6 cities.
YearYinchuanChangdeHaikouDongyingHarbinChangshu
Training2020242818,3057789716231395042
2015250318,3056994475630744078
Validation2020122845531048127011681123
2015120545531135131211681117
Disclaimer/Publisher’s Note: The statements, opinions and data contained in all publications are solely those of the individual author(s) and contributor(s) and not of MDPI and/or the editor(s). MDPI and/or the editor(s) disclaim responsibility for any injury to people or property resulting from any ideas, methods, instructions or products referred to in the content.

