Abstract
Geomorphic parameters, which reflect the migration of drainage divide responses, are widely used to assess tectonic activity. There have been several large earthquakes in the history of the Hetao Basin, within which the Sertengshan Piedmont Fault is important. This study highlights certain references for regional seismic risk assessment. Few studies have been conducted on the Sertengshan area from the perspective of geomorphic parameters. In this paper, ksn, HI, and Vf were obtained to indicate the tectonic activity in the Sertengshan area, and and Gilbert metrics were extracted to explore the state of the drainage basin. The results show that the tectonic activity varies spatially and is strong in the western part of the southern Sertengshan region and the northern part corresponding to the turning point of the fault. Most of the Sertengshan area is in the prime and old stages of geomorphological evolution, whereas some areas are in the juvenile stage. The old stage was mainly concentrated in the northern region, and the southern part was younger than the northern region. Overall, the Sertengshan area is tectonically active and affected by the activity of the Sertengshan Piedmont Fault. The western part of the divide migrated northwest, while the central and eastern parts tended to move southward. We suggest that the divide migration is influenced by tectonic activity and tends to move towards the direction of lower tectonic activity.
1. Introduction
The Sertengshan is located in the central Inner Mongolia (Nei Monggol) Autonomous Region in the western section of Yinshan, to the east of Langshan. The Sertengshan Piedmont Fault is located in the Hetao Basin, where the Langshan, Sertengshan, Wulashan, and Daqingshan Piedmont Faults occur from west to east (Figure 1a,b). It has been active since the Late Quaternary and controls the Linhe Depression [1]. Previous studies have mainly focused on the fault segments [2,3,4] and palaeo-earthquakes [5,6,7] of the Sertengshan Piedmont Fault through geological methods such as trenching, Quaternary dating, and sedimentary stratigraphy. Based on the characteristics of the geometrical construction, Late Quaternary active tectonics, palaeoseismic activity, and segmentation boundary along the Sertengshan Piedmont Fault, Chen et al. [2] proposed a segmentation model for the Sertengshan Piedmont Fault, in which three segmentation points at Dahoudian, Wubulangkou, and Xiaoshetai cut the Sertengshan Piedmont Fault into four segments (Figure 1b). Based on the most recent palaeoseismic research on the eastern Sertengshan Piedmont Fault, He et al. [4] argued that the most eastern segmentation point should be located in Wayaotan, not Xiaoshetai (Figure 1b). Long et al. [8] further confirmed the independence of the West and East Sertengshan Piedmont Faults, the intersection of which is located at Wubulangkou, forming a T-shaped junction between the two segments (Figure 1b). Near Wubulangkou, the EW-striking western and NW-striking eastern segments are connected by a triangular relay ramp, and the continuous action of the normal faults smooths the turning part [9] (Figure 1c).
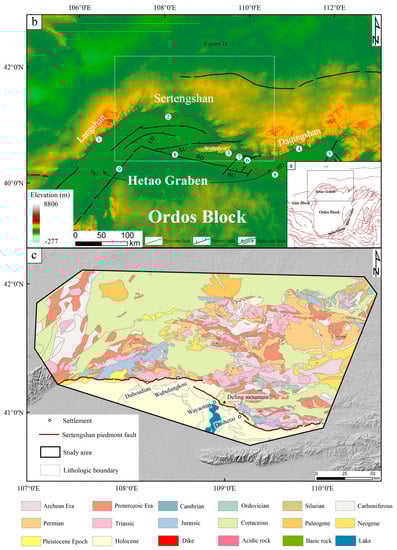
Figure 1.
Setting of the study area. (a) The geological setting map of the Ordos Block and nearby area. (b) Basic background of the Hetao Basin with reference to the literature [10]. Different elevations are given different colours. ① Langshan Piedmont Fault; ② Sertengshan Piedmont Fault; ③ Wulashan Piedmont Fault; ④ Daqingshan Piedmont Fault; ⑤ Hlinger Fault; ⑥ Shangguchenwan Fault; ⑦ Baotou Fault; ⑧ Northern Marginal Fault of Ordos; ⑨ Dengkou−Benjin Fault. DU−Dengkou uplift; LD−Linhe depression; XU−Xishanzui uplift; BD−Baiyanhua depression; BU−Baotou uplift; HD−Huhe depression. (c) Background of the study area. Lithologic data were derived from a digital 1:500,000 geological map published by the National Geological Archives.
Geomorphic parameters are widely used in assessing the strength of regional tectonic activity [11,12,13,14,15]. These include the normalised steepness index (ksn), the hypsometric integral (HI), the stream length–gradient index (SL), the valley floor width–valley height ratio (Vf), and the mountain front sinuosity ratio (Smf). ksn and SL reflect the regional tectonic activity from the perspective of the longitudinal profile gradient. Vf indicates the V- and U-shapes of the valley from the geometric parameters of the transverse section of the valley, reflecting the degree of regional erosion. HI represents the degree of tectonic activity in a basin based on the relationship between elevation and area. Chen et al. [16] obtained stream gradient indices, Hack profiles, and hypsometry in the Western Foothills of Taiwan to explore morphotectonic features. Chebotarev et al. [17] used mountain front sinuosity, the ratio of facet height and width to base length, basin shape, the hypsometric integral, the asymmetry factor, and the valley width-to-height ratio to better understand the tectonic geomorphology of the Tunka Fault. Many recent studies have extracted multiple parameters and synthesised them to form an index of relatively active tectonics (IRAT) to evaluate regional tectonic activity [11,12,13,14,15]. The drainage divide is an elevated terrain that separates neighbouring drainage basins [18,19], which is dynamic through time and space, shaping landscapes [20] and sensitively responding to asymmetrical tectonic uplift [20,21,22]. Drainage divide migration can be used to indicate fault activity [23] and asymmetric tectonic uplift [19,20], which are influenced by asymmetric uplift, precipitation, lithology, and landslides [20,23]. Previous studies came up with -map [21] and Gilbert metrics [24] to quantify drainage divide motion. Zhou et al. [25] introduced the cross-divide contrast index (C) to comprehensively analyse the differences in lithology, precipitation, channel height, and drainage basin morphology across the main drainage divide, which provides an opportunity to quantitatively predict the stable location of the drainage divide.
Previous studies on Langshan [26,27,28], Wulashan [20,29], and Daqingshan [30,31] have been conducted with geomorphic parameters contained in the Hetao Graben along with the Sertengshan. The vertical slip rates of the Sertengshan Piedmont Fault indicate a high risk of future earthquakes [3]. However, there is a lack of research on the use of geomorphic parameters in the Sertengshan. In this paper, ksn, HI, and Vf were extracted to explore the tectonic characteristics of the region, and and Gilbert metrics were obtained to explore the divide migration in the Sertengshan.
2. Materials and Methods
2.1. Data Sources
The Digital Elevation Model (DEM) data in this study came from the 30 m resolution elevation data of the Geospatial Data Cloud ASTER GDEM (http://www.gscloud.cn/ (accessed on 25 May 2022)). The precipitation data were obtained from the National Earth System Science Data Center of the National Science and Technology Infrastructure of China (http://www.geodata.cn (accessed on 13 June 2022)). The 1 km resolution annual precipitation data of China from 2001 to 2020 were obtained; the unit of data precipitation was 0.1 mm. The region vector and raster data were projected (WGS_1984_UTM_Zone_49N), and the precipitation data were resampled (900 m × 900 m) in ArcGIS.
There are currently many topographic analysis programs available [32,33,34]. In this paper, the extraction of geomorphic parameters was obtained by ArcGIS, TopoToolbox [35] and Topographic Analysis Kit (TAK) [36], and and Gilbert metrics are calculated with DivideTools [24].
2.2. Methods
2.2.1. Normalised Channel Steepness (ksn)
The channel erosion model provides the relationship between the steepness index, uplift, and erosion [37,38,39], using the formula
where is the erosion rate; is the upstream drainage area; is the erodibility coefficient that represents the comprehensive effect of climate, rock, and hydrology; and is the slope, which is obtained from the constants and [40].
Flint proposed the following relationship between the slope, upstream area, and steepness index [40]:
where is the steepness index, and is the channel concavity [41].
It is believed that the elevation at any point in a river can be expressed as a result of rock uplift and erosion, and the change in elevation over time can be expressed as the rock uplift rate minus the erosion rate [42,43]:
where is the rate of change in elevation over time, and is the uplift rate of the rock relative to the fixed datum [38].
When the steady-state condition is reached, , and , and the equation is expressed as [40]:
We divide both sides of this equation by , remove the exponent , and obtain the steepness index [40]:
2.2.2. Hypsometric Integral (HI)
The hypsometric integral (HI) expresses the altitude of a given area within a drainage basin [44].
It can be calculated by a simplified equation [45]:
where , , and represent the maximum, minimum, and mean elevations of the basin, respectively.
HI values range between 0 and 1; high values generally indicate active tectonics, whereas lower values indicate more eroded landscapes with less recent active tectonics [14].
Davis [46] proposed the erosion cycle theory, dividing the stages of geomorphic evolution into juvenile, prime, and old ages, based on which Strahler [44] presented a hypsometric curve (HC) to reflect the stage of geomorphic evolution. The horizontal and vertical coordinates of the hypsometric curve are the area ratio of the basin and its elevation ratio, respectively. The area under the curve is the HI value. Convex hypsometric curves characterise a young-stage basin, S-shaped curves indicate a mature-stage basin, and concave curves represent an old-stage basin [44].
2.2.3. Ratios of Valley Floor Width to Valley Height (Vf)
Valley floor width/height (Vf) reflects the cross-sectional V-shaped and wider U-shaped valleys [17], which are defined as follows [47]:
where Vf is the valley width-to-height ratio, Vfw is the valley floor width, Eld and Erd are the elevations of the left and right valley divides, respectively, and Ec is the elevation of the valley floor [48].
Vf = 2Vfw/[(Eld − Ec) + (Erd − Ec)]
Vf reflects active tectonics; Vf < 1 is related to active uplifting with V-shaped valleys, whereas Vf > 1 (U-shaped valleys) indicates moderate tectonic activity [14].
2.2.4. χ and Gilbert Metrics
Willett et al. [21] developed to provide the dynamic state of river basins, which is an integral from the outlet to a point along the channel [24]. Forte and Whipple [24] refer to the channel elevation differences across divides at a reference drainage area as ‘Gilbert metrics’ (mean upstream relief, mean upstream gradient, and elevation).
It is usually thought that drainage divides migrate towards the geometric centre under decreased asymmetric uplift conditions [21]. Ye et al. [19] studied the influence of the initial elevation on drainage divides and concluded that drainage divides are controlled by both the initial and final stable positions. Migration direction is related to cross-divide erosion differences, while might not be related to divide migration under the background of different uplift rate, lithology, and climate [49]. Gilbert metrics represent the current divide motion, and indicates the current or future divide instability [50].
3. Results
3.1. Geomorphic Indices
The basin parameter statistics are set out in Table 1.

Table 1.
Statistics of basin parameter.
The steepness index of drainage basins was calculated using CompileBasinStats in TAK [36]. The hypsometric integral (HI) values ranged from 0.29 to 0.63. The hypsometric curves were calculated with the MATLAB program [34] and divided into four types: convex, S, concave, and other shapes [51]. Vf values were extracted by ArcGIS from multiple locations within 0.5~4 km of the headwater, and their average values were calculated as Vf values of the basin [14]. Vf values vary from 0.54 to 37.88, reflecting the transformation from V-shaped valleys to U-shaped valleys.
In the south of the region, ksn was higher than in the western region, followed by the eastern region. The western and eastern parts of the turning point of the fault showed high HI values. The low Vf values were mainly distributed in the west, and S-shaped hypsometric curves were mostly presented. The S-shaped, other, and convex curves accounted for 42.86%, 28.57%, and 19.05% of the total number of southern regions, respectively. In the northern part of the region, ksn was higher than that in the southern basin in the central region, while the ksn of the rest of the northern region was generally lower. HI values were higher in the westernmost, some central, and eastern parts. The HI values of the basin on both sides of the CD segment were low, of which those in the northern part were lower than those in the southern region. Low Vf values were located in the western and central parts of the northern region, and the Vf values in the north of the divide between the DE and EF segments were generally lower than those in the southern part. The hypsometric curves were mostly concave. The concave, S-shaped, convex, and other curves accounted for 47.5%, 20%, 20%, and 12.5% of the total curves in the northern region, respectively (Figure 2).
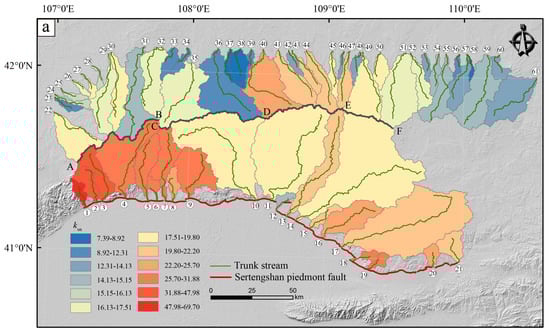
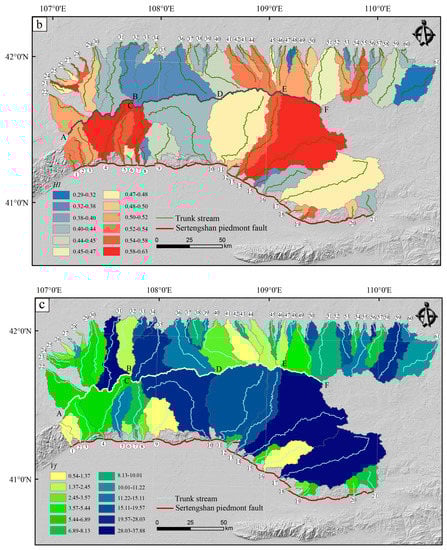
Figure 2.
The values of the geomorphic indices in the Sertengshan. (a) Normalised channel steepness (ksn) values. (b) Hypsometric integral (HI) values. (c) Ratio of valley width to valley height (Vf) values. The circled numbers indicate channel number.
Basins 1, 2, 4, 11, 24, 41, 44, 47, 51, 55, and 58 showed convex shapes and were mainly located in the western and central parts of the southern region and the central and eastern parts of the northern region. Basins 5, 7, 10, 12, 14, 17, 18, 19, 20, 25, 26, 27, 28, 29, 30, 43, and 50 are S-shaped, mostly located in the western part of the northern region and the western and eastern parts of the southern region. Basins 8, 21, 22, 23, 32, 33, 34, 35, 36, 37, 38, 39, 40, 42, 46, 48, 53, 54, 56, 57, and 61 were concave and mainly concentrated in the central and western parts of the northern region. Most basins showed an S-shape or a concave shape. (Figure 3).
Figure 3.
Hypsometric curves of basins with different maturity stages. (a) Convex hypsometric curves. (b) S-shaped hypsometric curves. (c) Concave hypsometric curves. (d) Other morphologic hypsometric curves.
3.2. χ and Gilbert Metrics
The main drainage divide was divided into AB, CD, DE, and EF segments. The high values were generally near the drainage divide, which in the south side were greater than those in the north. There were major high values in the eastern part of the southern flank, whereas on the northern flank, the western values were higher. In general, values indicate a relatively stable drainage divide (Figure 4).
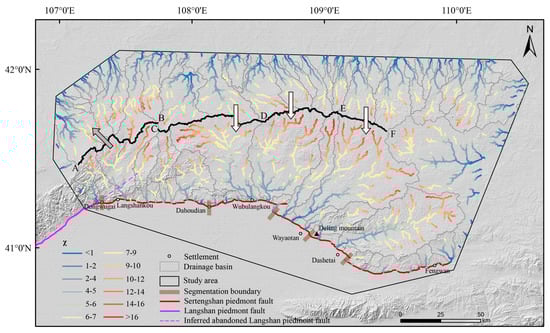
Figure 4.
values in the study area. The grey arrow represents the current forecast migration direction, and the white arrows indicate the future forecast migration direction. A, B, C, D, E and F are watershed boundaries.
Gilbert metrics represent the stability of the drainage divide (Figure 5). In terms of the histograms of the Gilbert metrics, segments CD and DE were stable, segment AB moved northwest, and segment EF tended to move southward. metrics indicate a stable divide in AB segment and a southward-moving divide in CD, DE, and EF segments.
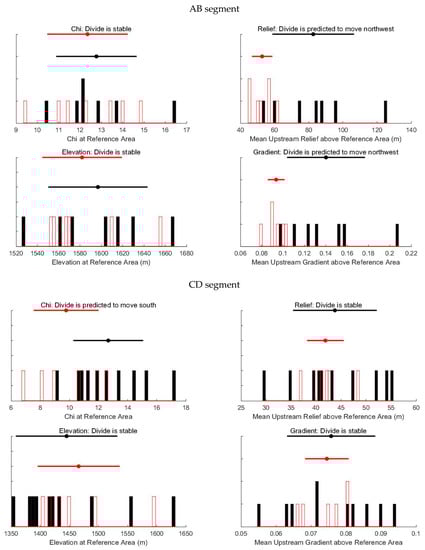
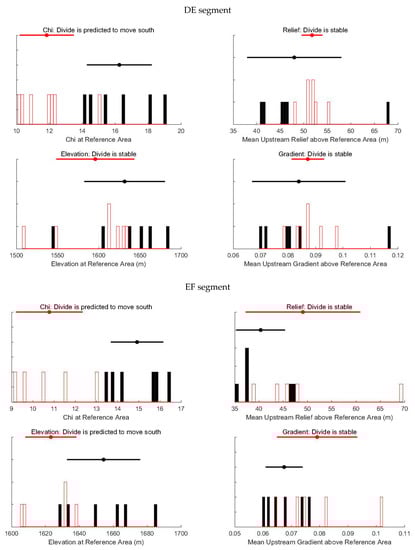
Figure 5.
Divide metrics histograms for the AB, CD, DE, and EF segments. Histograms with red rectangles represent watersheds on the north range, black fillings from the south flank. The results are calculated by the DivideTools [24] based on the TopoToolbox [35].
4. Discussion
4.1. Influencing Factors
The normalised steepness index (ksn) [39] and hypsometric integral (HI) [16,51] are affected by structure, rock erosion resistance, climate, and other factors [30].
The regional climate of the Nei Monggol Autonomous Region is dominated by a temperate continental climate, with annual precipitation between 100 and 500 mm. The average precipitation in the eastern region is higher, and that in the central and western regions is close to that of the perennial (Figure 6a). ksn and HI did not increase or decrease monotonically with the variation in precipitation. Therefore, precipitation had no significant effect on the geomorphic parameters.
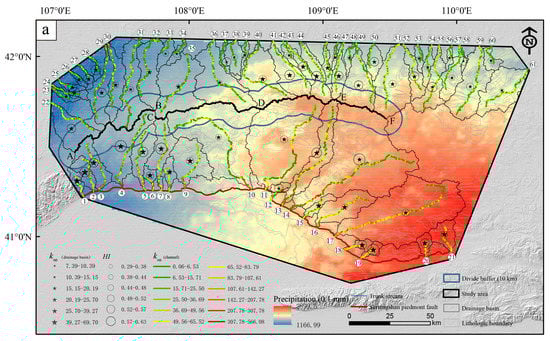
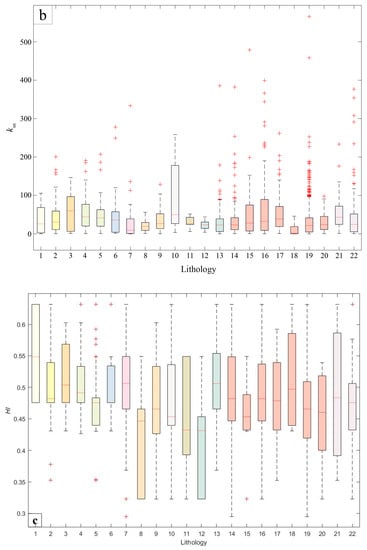
Figure 6.
(a) The distribution of regional precipitation, ksn and HI. The circled numbers indicate channel number. A, B, C, D, E and F are watershed boundaries. (b,c) Box plots of ksn and HI values, respectively, for each type of lithology. 1: Archaean magmatic rock; 2: Archaean metamorphic rocks; 3: Palaeoproterozoic magmatic rocks; 4: Middle Proterozoic magmatic rocks; 5: Mesoproterozoic sedimentary rocks; 6: Mesoproterozoic Jixian sedimentary rocks; 7: Mesoproterozoic metamorphic and sedimentary rock; 8: Neoproterozoic sedimentary rocks; 9: Proterozic sedimentary and metamorphic rocks; 10: Ordovician magmatic rock; 11: Ordovician magmatic and sedimentary rock; 12: Silurian sedimentary and metamorphic rocks; 13: Carboniferous sedimentary rocks; 14: Permian magmatic rocks; 15: Permian sedimentary and metamorphic rocks; 16: Triassic magmatic rocks; 17: Jurassic sedimentary rocks; 18: Cretaceous magmatic rocks; 19: Cretaceous sedimentary rocks; 20: Palaeogene sedimentary rocks; 21: Pleistocene sedimentary rocks; 22: Holocene sedimentary rocks.
Valley landforms are also affected by lithologic differences [52]. The lithology of the study area includes Neoproterozoic, Mesoproterozoic, Cambrian, Ordovician, Carboniferous, Permian, Jurassic, Cretaceous, and Quaternary sedimentary rocks; Proterozoic, Ordovician, and Permian metamorphic rocks; and Mesoproterozoic, Cambrian, Ordovician, Carboniferous, Permian, Triassic, and Cretaceous magmatic rocks. Each HI value corresponded to a drainage basin containing a variety of lithologies. The steepness index of the channel was extracted and calculated. Some lithologies in the study area were selected. There was no clear correlation between the steepness index, HI, and lithology (Figure 6b,c). Consequently, lithology cannot be considered as the main influence on ksn and HI in general.
4.2. Divide Migration
It is believed that χ might indicate the future state of the watershed, whereas the Gilbert metrics tend to indicate the present [24]. Based on and Gilbert metrics, the western divide (AB section) is moving northwest and might be stable in the future. The middle of the divide (CD and DE segments) is stable at present but has a southward migration trend, and the east of the divide (EF segment) has a southward migration trend overall.
Changes in drainage area can produce perturbations of and ksn [21]. increases with area gain, while ksn decreases with it [22]. The divide tends to migrate towards the side where the relief and gradient have lower values, whereas for the elevation metric, the values are higher [23]. anomalies are not supposed to accurately indicate the state of the divides where there is spatial variability in rock uplift rate, rock properties or climate [22]. ksn can predict the direction of divide migration [23], and drainage divides tend to migrate to the side with lower values [22]. A previous study suggested that it is necessary to select a region close to the divide when using geomorphic parameters to analyse the stability of the divide, avoiding the influence of other factors [53]. To verify the divide migration from and Gilbert metrics, a buffer zone (buffer radius 10 km) of the divide was extracted, within which the distribution of the channel steepness index values’ cross-divide was obtained (Figure 7). Abnormally high values of the acquired ksn were removed (Figure 7a). The results showed that the values of ksn were higher in segment AB and its eastern region. In the DE and EF segments and their western regions, the northern values were higher than those in the southern part (Figure 7b). Therefore, the ksn values’ cross-divide indicates that the western divide is likely to migrate to the north, while the central and eastern divide tend to migrate to the south, which is consistent with the results of and Gilbert metrics on the whole.
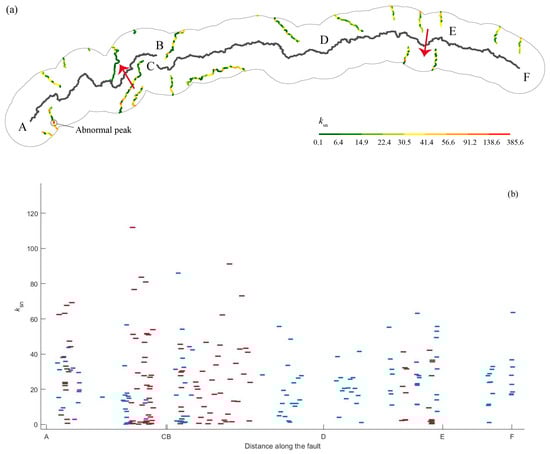
Figure 7.
(a) ksn distribution in watershed buffer; the arrow indicates the migration direction of the watershed. (b) The red lines represent the southern part of the divide, and blue the northern part. A, B, C, D, E and F are watershed boundaries.
4.3. Tectonic Implications
From the above analysis, it can be concluded that precipitation and lithology have a limited influence on the geomorphic index, and the main remaining factor is the difference in uplift rate. Higher HI values indicate greater tectonic activity [16]. The steepness index reliably indicates erosion and uplift rates [54,55], which are positively associated with the uplift rate [37,56]. According to previous studies, the vertical sliding rate of the Sertengshan Piedmont Fault tends to be higher in the west and lower in the east [5,7,8]. The distribution characteristics of ksn and HI along the fault zone in the southern region were generally consistent with the vertical slip rate results of previous studies. Therefore, ksn and HI reflect the differences in regional tectonic uplift rates.
The steepness index shows a positive relationship with the erosion rate [57,58]. In the southern part of the divide, the steepness index was higher in the western region (basin 1–9) and in the eastern basins, including basins 18 and 19, reflecting a higher erosion rate. In the northern part of the watershed, a higher rate of erosion was observed, mainly in basins 40–47.
The hypsometric integral indicates the regional tectonic activity [16]. High values reflect higher uplift rates and young active tectonics, whereas low values are associated with eroded geomorphics and old tectonics [12,14]. In the southern watershed, the western (basins 1–7), right (basins 13–14), and some eastern basins (basins 18–19) had higher hypsometric integrals, indicating higher tectonic activity. The high value in the northern part of the divide corresponds to the position in the southern part, which is mainly located in the western part and the corresponding position in the strike turning of the fault zone. In the northern part of the region, the old stage was more common, followed by the juvenile and mature stages. The southern part of the region was mostly in the mature and juvenile stages. The juvenile stage was mainly located in the western part and the fault turning point of the southern region and the central to eastern part of the northern region. Overall, the region is in a young stage of evolution, and the southern part is younger than the northern part.
Vf indicates the intensity of the tectonic activity; low Vf values reflect high uplift and erosion rates, whereas high Vf values indicate reduced incision and relatively low uplift rates [59]. South of the divide, channel erosion was strong in the west of the region (basins 1–9) and in basins 12, 15, 18, 19, 20, and 21. In the northern part, channel erosion was stronger in the western (basins 22–30) and central (basins 40–49) parts.
ksn, HI, and Vf reflecting the same characteristics of regional tectonic activities in general are mainly located in the western part and some eastern parts of the southern region and the central part of the northern region, indicating unbalanced tectonic activity in the Sertengshan area. Previous studies have considered that the Sertengshan Piedmont Fault has segmental characteristics [2,3,4] and that there is strong tectonic activity west of it [1]. The vertical slip rate exhibits a downward trend from west to east along the Sertengshan Piedmont Fault [5,8]. The geomorphic parameters in the southern divide region indicate strong tectonic activity in the western part, which corresponds to the results of previous studies on the vertical slip rate.
From the perspective of fault segmentation, the Sertengshan Piedmont Fault can be divided into an EW-striking West Sertengshan Piedmont Fault and a generally NW-striking East Sertengshan Piedmont Fault [2]; the segmentation point is Wubulangkou. The segmentation points considered, Dahoudian, Wubulangkou, Dashetai, and Wayaotan, are located between the outlets of basins 9 and 10, the eastern side of the outlet of basin 12, directly in the drainage of basin 18, and between the outlets of basins 15 and 16. In addition, no obvious geomorphic fault step zone was found at the intersection between the NE-striking Langshan Piedmont Fault and the EW-striking Sertengshan Piedmont Fault [60]. The largest fault step zone along the Langshan–Sertengshan Piedmont Fault, approximately 5 km wide, is at Wubulangkou, whereas the second largest fault step zone, approximately 3 km wide, is at Dashetai (Figure 4). The ksn index, particularly in the bedrock river channels, also demonstrates a positive linear relationship with the vertical uplift rate [37,41,61]. The high vertical uplift rate area from ksn revealed in this study is consistent with the western side of the Dahoudian, the westernmost segmentation point, and near Dashetai, the easternmost segmentation point of the Sertengshan Piedmont Fault. HI and Vf indices also implied high regional tectonic activity. The two indices in our study also demonstrate high uplift and erosion rates in these two areas, the western sides of Dahoudian and Dashetai, and additional drainage basins located along the East Sertengshan Piedmont Fault. After combining terrace analyses along the Langshan Range Front [62,63], Dong et al. [27] further deduced the final link-up of segments of the Langshan Piedmont Fault that occurred recently, most likely in the Late Pleistocene. No fault step zone exists in Dahoudian and Wayaotan. We can reasonably infer that all segmentation points of the Sertengshan Piedmont Fault are in the final link-up stage from the viewpoint of the normal fault evolution model [64,65,66]. The classic normal evolution model [64,65,66] demonstrates an obvious increase in the vertical uplift rate at the linkage area in the final linkage stage, as verified by field observations [67,68,69]. This indicates that the vertical uplift rates at all segmentation points along the Sertengshan Piedmont Fault are likely to accelerate or reach a high rate. The wave train model for knickpoint migration research [70] revealed the dominant role of the drainage area, and a compilation of mean rates of knickpoint propagation for time durations ranged from 102 to 107 years. This likely explains why HI and Vf revealed high tectonic or erosional rates in multiple basins. It was concluded that all five possible segmentation points, Dongwugai, Dahoudian, Wubulangkou, Wayaotan, and Xiaoshetai, were in the final linkage stage. This also implies a potentially high-seismic-risk area.
Dong et al. [27] had proposed the “link-up” model of the NE-striking Langshan Piedmont Fault and further inferred that link-up occurred in the late Pleistocene. The Langshan Piedmont Fault is now connected to the Sertengshan Piedmont Fault [60,71]. Abandoned fault branches after fault linkage are extensive, not only from the viewpoint of theoretical model research [64,65,66] and geological observation case study [67,68,69]. Normal fault evolution research on the Langshan Piedmont Fault [72,73] indicated the existence of abundant abandoned faults. We reasonably inferred an abandoned fault, which probably affected the bedrock river channel evolution in the southeastern flank of Langshan on the north side of the Sertengshan Piedmont Fault along the extension direction of the Langshan Piedmont Fault (Figure 4). This may explain the difference in migration direction between the AB and CD–DE–EF sections (Figure 4).
4.4. The Model of Geomorphic Evolution
The geomorphic indices indicate that Sertengshan is experiencing asymmetric uplift, with greater tectonic activity occurring in the western region south of the divide and in the central region north of the divide. There were different stages of regional geomorphic evolution, and the southern part was generally younger than the northern part. The results of the geomorphic parameters show that the river valleys in the western region of the southern divide and the central region of the northern divide are narrow with a large channel gradient. These regions are in the stages of juvenile and prime evolution, reflecting high tectonic activity. According to the tectonic activity of the geomorphic parameters and divide migration reflected by the and Gilbert metrics, the divide migrated to the northwest in the western region and south in the central and eastern regions, which seemed to be in the direction of weak tectonic activity. It is possible that the stronger the regional tectonic activity, the larger the uplift and erosion rate, and that the channel has a strong ability to trace the source of erosion, which contains more frequent river capture [21].
Based on the above analysis, the Sertengshan area was affected by the tectonic activity of the Sertengshan Piedmont Fault. Most of the northern part of the region is in the old stage of erosion that may have developed earlier. The western part of the Sertengshan Piedmont Fault has strong tectonic activity, and the western part of the southern divide is uplifted with a high erosion rate and strong tectonic activity. Therefore, the divide tends to move in the northwest direction, where the erosion rate is relatively low. According to the above analysis, the northwest divide migration direction might also have been influenced by abandoned faults between the Langshan and Sertengshan Piedmont Faults. Different activity properties were observed in different sections of the Sertengshan. At the fault turning point, the western sections of the Sertengshan Piedmont Fault continue eastward after passing through Wubulangkou, and the eastern sections of the Sertengshan Piedmont Fault continue northwest, which are gradually connected by the compressive stress caused by the movement and connection of the fault zones towards each other [71]. Tectonic activity is strong at the fault turning point, and geomorphological evolution occurs in the juvenile and prime stages. Southward migration of the divide in the central and eastern parts of the region may be affected by the characteristics of the drainage area. The part near the fault zone gradually stabilised, and the erosion rate decreased, whereas the northern region continued to uplift with a high erosion rate, and the divide migrated southward (Figure 8).
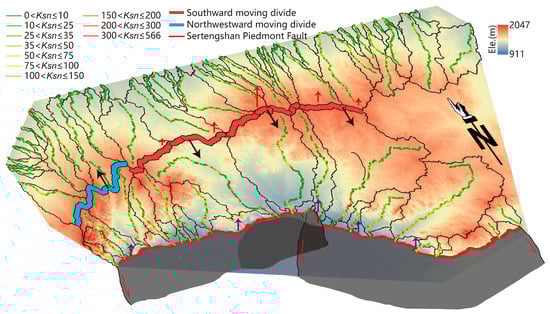
Figure 8.
The brief model of geomorphic evolution. Red arrows indicate the comparatively different regional uplifting rate, black arrows indicate the divide moving direction in the future, while purple arrows indicate the comparatively high tectonic uplifting rate locations. The half-transparent grey surfaces represent the underlying fault planes of the Sertengshan Piedmont Fault, while the lighter half-transparent grey surface between represents the developing fault plane.
It is generally believed that the main drainage divide migrates towards the high-uplift side when the mountain belt experiences asymmetric uplift and moves back towards the geometric centre when the magnitude of the asymmetric uplift decreases [21,74]. It has also been suggested that not all drainage divides migrate towards the geometric centre, which indicates a decrease in uplift asymmetry [19]. In agreement with previous theories, this study concludes that the western divide may develop towards the state of the central and eastern watersheds in the future. After a stable trend in the future, the divide will migrate southward and reach a steady state as the landform in the southern part of the region gradually enters the prime and old-age stages, and the erosion rate decreases. The current southward migration trend in the central and eastern parts of the divide may be due to the lower rate of erosion in the southern part of the divide compared to the northern part, and the divide may be in the process of returning to the geometric centre.
5. Conclusions
This paper explores the tectonic activity characteristics of the Sertengshan area through the geomorphic parameters ksn, HI, and Vf, and the watershed state was explored by and Gilbert metrics. The results showed that ksn, HI, and Vf parameters indicate strong tectonic activity in the western part of the southern region and the central part of the northern region. In general, the results of and Gilbert metrics indicate that the western divide of the Sertengshan region moves to the northwest and may be stable in the future. At present, the central region has a southward movement trend and may be in a stable state, whereas the eastern region has a southward movement trend. We posit that the divide migration trend in the Sertengshan area might be related to the tectonic activity of the Sertengshan Piedmont Fault, which moves from the side with high tectonic activity towards the side with lower tectonic activity. The fault zone is located in the southern part of the region; however, the central part of the northern region exhibits high tectonic activity. This may have been affected by tectonic activity around the fault turning point, which is in a state of tectonic stress accumulation. Our geomorphic index analysis confirmed that the segmentation points along the Sertengshan Piedmont Fault are at the final linkage stage, where the vertical slip rate is increasing, implying a higher seismic risk.
Based on the results of this study, it is concluded that geomorphic parameters provide a good indication of regional tectonic activity, and the distribution of geomorphic parameters along the Sertengshan Piedmont Fault can reflect the structural characteristics of the fault segments. Divide migration is affected by many factors and understanding the degree of tectonic activity using geomorphic parameters may provide a reference for the state of a divide.
Similar to Langshan, Wulashan, and Daqingshan, Sertengshan is generally in the prime stage, and in a state of disequilibrium. The study of tectonic activity in the Sertengshan area, combined with previous studies on Langshan, Wulashan, and Daqingshan, may provide the basis for a comprehensive study of tectonic activity in the Hetao Basin, which is of great significance for the prediction of future earthquakes.
Author Contributions
Conceptualization, K.S. and S.D.; methodology, K.S and S.D.; software, K.S.; validation, K.S.; formal analysis, K.S.; investigation, K.S.; resources, K.S. and S.D.; data curation, K.S.; writing—original draft preparation, K.S.; writing—review and editing, K.S., S.D. and Y.W.; visualization, K.S. and S.D.; supervision, S.D. and Y.W.; project administration, S.D.; funding acquisition, S.D. All authors have read and agreed to the published version of the manuscript.
Funding
This research was funded by National Nonprofit Fundamental Research Grant of China, Institute Geology, China, Earthquake Administration (IGCEA1716).
Data Availability Statement
Not applicable.
Acknowledgments
Our sincere thanks go to the editor and two anonymous reviewers, whose comments helped improve the manuscript a lot.
Conflicts of Interest
The authors declare no conflict of interest.
References
- Research Group of “Active Fault System around Ordos Margin”. State Seismological Administration. Active Fault System around Ordos, 1st ed.; Seismological Press: Beijing, China, 1988. [Google Scholar]
- Chen, L.; Ran, Y.; Yang, X. Late Quarternary Activity and Segmentation Model of the Sertengshan Piedmont Fault. Earthq. Res. China 2003, 19, 255–265. [Google Scholar]
- Zhang, H.; He, Z.; Ma, B.; Long, J.; Liang, K.; Wang, J. The vertical slip rate of the Sertengshan piedmont fault, Inner Mongolia, China. J. Asian Earth Sci. 2017, 143, 95–108. [Google Scholar] [CrossRef]
- He, Z.; Ma, B.; Long, J.; Wang, J.; Zhang, H. New Progress in Paleoearthquake Studies of the East Sertengshan Piedmont Fault, Inner Mongolia, China. J. Earth Sci. 2018, 29, 441–451. [Google Scholar] [CrossRef]
- Yang, X.; Ran, Y.; Hu, B.; Guo, W. Active Fault and Paleoearthquakes of the Piedmont Fault (Wuju-Mengkou-Dongfeng Village) for Seertang Mountains, Inner Mongolia. Earthq. Res. China 2002, 18, 9–22. [Google Scholar]
- Zhang, H. Late Quanternary Activity of the Sertengshan Piedmont Fault Zone; The Institute of Crustal Dynamics, CEA: Beijing, China, 2017. [Google Scholar]
- Chen, L.; Ran, Y.; Chang, Z. Characteristics of Late Quaternary Faulting and Paleoseismic Events on the East of Delingshan Segment of the Sertengshan Piedmont Fault. Seismol. Geol. 2003, 25, 555–565. [Google Scholar]
- Long, J.; He, Z.; Zhang, H.; Ma, B. Characteristics of Structural Geomorphology and Segmentation of Sertengshan Piedmont Fault from Dahoudian to Wayaotan. Geoscience 2017, 31, 71–80. [Google Scholar]
- Liang, K.; Ma, B.; Tian, Q.; Liu, S. Tectonic Evolution of the Turning Point of the Eastern and Western Section of the Seertengshan Piedmont Fault. Technol. Earthq. Disaster Prev. 2019, 14, 600–616. [Google Scholar]
- Dong, S.; Zhang, P.; Zheng, W.; Yu, Z.; Lei, Q.; Yang, H.; Liu, J.; Gong, H. Paleoseismic observations along the Langshan range-front fault, Hetao Basin, China: Tectonic and seismic implications. Tectonophys. Int. J. Geotecton. Geol. Phys. Inter. Earth 2018, 730, 63–80. [Google Scholar] [CrossRef]
- Alipoor, R.; Poorkermani, M.; Zare, M.; Hamdouni, R.E. Active tectonic assessment around Rudbar Lorestan dam site, High Zagros Belt (SW of Iran). Geomorphology 2011, 128, 1–14. [Google Scholar] [CrossRef]
- Hamdouni, R.E.; Irigaray, C.; Fernández, T.; Chacón, J.; Keller, E.A. Assessment of relative active tectonics, southwest border of the Sierra Nevada (southern Spain). Geomorphology 2008, 96, 150–173. [Google Scholar] [CrossRef]
- Kumar, N.; Dumka, R.K.; Mohan, K.; Chopra, S. Relative active tectonics evaluation using geomorphic and drainage indices, in Dadra and Nagar Haveli, western India. Geod. Geodyn. 2022, 13, 219–229. [Google Scholar] [CrossRef]
- Mahmood, S.A.; Gloaguen, R. Appraisal of active tectonics in Hindu Kush: Insights from DEM derived geomorphic indices and drainage analysis. Geosci. Front. 2012, 3, 407–428. [Google Scholar] [CrossRef]
- Saber, R.; Caglayan, A.; Isik, V. Relative tectonic activity assessment and kinematic analysis of the North Bozgush fault Zone, NW Iran. J. Asian Earth Sci. 2018, 164, 219–236. [Google Scholar] [CrossRef]
- Chen, Y.; Sung, Q.; Cheng, K. Along-strike variations of morphotectonic features in the Western Foothills of Taiwan: Tectonic implications based on stream-gradient and hypsometric analysis. Geomorphology 2003, 56, 109–137. [Google Scholar] [CrossRef]
- Chebotarev, A.; Arzhannikova, A.; Arzhannikov, S. Long-term throw rates and landscape response to tectonic activity of the Tunka Fault (Baikal Rift) based on morphometry. Tectonophysics 2021, 810, 228864. [Google Scholar] [CrossRef]
- Xie, H. Dynamic Divide Migration as a Response to Asymmetric Uplift: An Example from the Zhongtiao Shan, North China. Remote Sens. 2020, 12, 4188. [Google Scholar] [CrossRef]
- Ye, Y.; Tan, X.; Zhou, C. Initial topography matters in drainage divide migration analysis: Insights from numerical simulations and natural examples. Geomorphology 2022, 409, 108266. [Google Scholar] [CrossRef]
- He, C.; Rao, G.; Yang, R.; Hu, J.; Qi, Y.; Ci, J. Divide migration in response to asymmetric uplift: Insights from the Wula Shan horst, North China. Geomorphology 2019, 339, 44–57. [Google Scholar] [CrossRef]
- Willett, S.D.; Mccoy, S.W.; Perron, J.T.; Goren, L.; Chen, C. Dynamic Reorganization of River Basins. Science 2014, 343, 1117. [Google Scholar] [CrossRef]
- Whipple, K.X.; Forte, A.M.; Dibiase, R.A.; Gasparini, N.M.; Ouimet, W.B. Timescales of landscape response to divide migration and drainage capture: Implications for the role of divide mobility in landscape evolution. J. Geophys. Res. Earth Surf. 2017, 122, 248–273. [Google Scholar] [CrossRef]
- Zeng, X.; Tan, X. Drainage divide migration in response to strike-slip faulting: An example from northern Longmen Shan, eastern Tibet. Tectonophysics 2023, 848, 229720. [Google Scholar] [CrossRef]
- Forte, A.M.; Whipple, K.X. Criteria and tools for determining drainage divide stability. Earth Planet. Sci. Lett. 2018, 493, 102–117. [Google Scholar] [CrossRef]
- Zhou, C.; Tan, X.; Liu, Y.; Shi, F. A cross-divide contrast index (C) for assessing controls on the main drainage divide stability of a mountain belt. Geomorphology 2022, 398, 108071. [Google Scholar] [CrossRef]
- Liu, X.; Zhang, X.; Ye, P.; He, Z.; Fu, L.; Jia, L.; He, X. Extraction of tectonic geomorphologic parameters based on DEM and analysis of difference on tectonic activity about Langshan Mountain, Inner Mongolia. J. Geomech. 2016, 22, 152–161. [Google Scholar]
- Dong, S.; Zhang, P.; Zheng, H.; Zheng, W.; Chen, H. Drainage Responses to the Activity of the Langshan Range-Front Fault and Tectonic Implications. J. Earth Sci. 2018, 29, 197–213. [Google Scholar] [CrossRef]
- He, C.; Cheng, Y.; Rao, G.; Chen, P.; Hu, J.; Yu, Y.; Yao, Q. Geomorphological signatures of the evolution of active normal faults along the Langshan Mountains, North China. Geodin. Acta 2018, 30, 163–182. [Google Scholar] [CrossRef]
- Fan, L. The Indicating Significance of the Geomorphic Parameters of the Lateral Water System in Wula Mountain, Inner Mongolia, to the Uplift of the Mountain. Master’s Thesis, China University of Geosciences (Beijing), Beijing, China, 2019. [Google Scholar]
- Gao, Z.; Liu, X.; Shao, Y.; Xie, H. Geomorphological Characteristics of Daqingshan Drainage Area in the Northern Margin of Hetao Basin. Seismol. Geol. 2019, 41, 1317–1332. [Google Scholar]
- Li, X. Bedrock Rivers in the Daqing Shan in Inner Mongolia, Northern China:Implications for Late Cenozoic Tectonic History in the Hetao Basin and the Yellow River Evolution. Doctoral Dissertation, Institute of Geology, China Earthquake Administration, Beijing, China, 2020. [Google Scholar]
- Shahzad, F.; Gloaguen, R. TecDEM: A MATLAB based toolbox for tectonic geomorphology, Part 1: Drainage network preprocessing and stream profile analysis. Comput. Geosci. 2011, 37, 250–260. [Google Scholar] [CrossRef]
- Daxberger, H.; Dalumpines, R.; Scott, D.M.; Riller, U. The ValleyMorph Tool: An automated extraction tool for transverse topographic symmetry (T-) factor and valley width to valley height (Vf-) ratio. Comput. Geosci. 2014, 70, 154–163. [Google Scholar] [CrossRef]
- Jaiswara, N.K.; Kotluri, S.K.; Pandey, P.; Pandey, A.K. MATLAB functions for extracting hypsometry, stream-length gradient index, steepness index, chi gradient of channel and swath profiles from digital elevation model (DEM) and other spatial data for landscape characterisation. Appl. Comput. Geosci. 2020, 7, 100033. [Google Scholar] [CrossRef]
- Schwanghart, W.; Scherler, D. Short Communication: TopoToolbox 2—MATLAB-based software for topographic analysis and modeling in Earth surface sciences. Earth Surf. Dyn. 2014, 2, 1–7. [Google Scholar] [CrossRef]
- Forte, A.M.; Whipple, K.X. Short communication: The Topographic Analysis Kit (TAK) for TopoToolbox. Earth Surf. Dyn. 2019, 7, 87–95. [Google Scholar] [CrossRef]
- Snyder, N.P.; Whipple, K.X.; Tucker, G.E.; Merritts, D.J. Landscape response to tectonic forcing: Digital elevation model analysis of stream profiles in the Mendocino triple junction region, northern California. Geol. Soc. Am. Bull. 2000, 112, 1250–1263. [Google Scholar] [CrossRef]
- Kirby, E.; Whipple, K. Quantifying differential rock-uplift rates via stream profile analysis. Geol. Soc. Am. 2001, 29, 415–418. [Google Scholar] [CrossRef]
- Whipple, K.X.; Tucker, G.E. Dynamics of the stream-power river incision model: Implications for height limits of mountain ranges, landscape response timescales, and research needs. J. Geophys. Res. 1999, 104, 17661–17674. [Google Scholar] [CrossRef]
- Venditti, J.G.; Li, T.; Deal, E.; Dingle, E.; Church, M. Struggles with stream power: Connecting theory across scales. Geomorphology 2020, 366, 106817. [Google Scholar] [CrossRef]
- Wobus, C.; Whipple, K.X.; Kirby, E.; Snyder, N.; Johnson, J.; Spyropolou, K.; Crosby, B.; Sheehan, D. Tectonics from topography: Procedures, promise, and pitfalls. Geol. Soc. Am. 2006, 398, 55–74. [Google Scholar] [CrossRef]
- Howard, A.D.; Kerby, G. Channel changes in badlands. Geol. Soc. Am. Bull. 1983, 94, 739–752. [Google Scholar] [CrossRef]
- Howard, A.D.; Dietrich, W.E.; Seidl, M.A. Modeling fluvial erosion on regional to continental scales. J. Geophys. Res. 1994, 99, 13971–13986. [Google Scholar] [CrossRef]
- Strahler, A.N. Hypsometric (area-altitude) analysis of erosional topography. Bull. Geol. Soc. Am. 1952, 63, 1117. [Google Scholar] [CrossRef]
- Wilson, R. Elevation-Relief Ratio, Hypsometric Integral, and Geomorphic Area-Altitude Analysis. Geol. Soc. Am. Bull. 1971, 82, 1079–1084. [Google Scholar] [CrossRef]
- Davis, W.M. The geographical cycle. Geogr. J. 1899, 14, 481–504. [Google Scholar] [CrossRef]
- Bull, W.B.; McFadden, L.D. Tectonic Geomorphology North and South of the Garlock Fault, California. In Geomorphology in Arid Regions; Routledge: London, UK, 1980; pp. 115–138. [Google Scholar] [CrossRef]
- Ntokos, D.; Lykoudi, E.; Rondoyanni, T. Geomorphic analysis in areas of low-rate neotectonic deformation: South Epirus (Greece) as a case study. Geomorphology 2016, 263, 156–169. [Google Scholar] [CrossRef]
- Wu, Y.; Yang, R.; He, C.; He, J. Caution on determining divide migration from cross-divide contrast in χ. Geol. J. 2022, 57, 4090–4098. [Google Scholar] [CrossRef]
- Dal Pai, M.O.; Salgado, A.A.R.; de Sordi, M.V.; de Carvalho Junior, O.A.; de Paula, E.V. Comparing morphological investigation with χ index and gilbert metrics for analysis of drainage rearrangement and divide migration in inland plateaus. Geomorphology 2023, 423, 108554. [Google Scholar] [CrossRef]
- Amine, A.; El ouardi, H.; Zebari, M.; Ei makrini, H. Active tectonics in the Moulay Idriss Massif (South Rifian Ridges, NW Morocco): New insights from geomorphic indices and drainage pattern analysis. J. Afr. Earth Sci. 2020, 167, 103833. [Google Scholar] [CrossRef]
- Li, Z.; Wang, X.; Yu, Y.; Zhang, H.; Su, Q.; Miao, X.; Lu, H. The impacts of base level and lithology on fluvial geomorphic evolution at the tectonically active Laohu and Hasi Mountains, northeastern Tibetan Plateau. Sci. China Earth Sci. 2021, 51, 994–1008. [Google Scholar] [CrossRef]
- Bai, L.; Tan, X.; Zhou, C. Drainage divide stability at Wulashan, northern margin of the Ordos block, China: Evidence from the analysis of χ value. J. Geomech. 2022, 28, 513–522. [Google Scholar]
- Shi, X.; Yang, Z.; Dong, Y.; Zhou, B. Tectonic uplift of the northern Qinling Mountains (Central China) during the late Cenozoic: Evidence from DEM-based geomorphological analysis. J. Asian Earth Sci. 2019, 184, 104005. [Google Scholar] [CrossRef]
- Nativ, R.; Haviv, I. Constraining channel steepness index as a proxy for incision rate: Evolution of bedrock channels along the Golan Heights volcanic plateau. In Proceedings of the Israel Geological Society Meeting, Mizpe Ramon, Israel; 2017. [Google Scholar] [CrossRef]
- Hu, X.; Pan, B.; Kirby, E.; Li, Q.; Geng, H.; Chen, J. Spatial differences in rock uplift rates inferred from channel steepness indices along the northern flank of the Qilian Mountain, northeast Tibetan Plateau. Chin. Sci Bull 2010, 55, 3205–3214. [Google Scholar] [CrossRef]
- Kirby, E.; Whipple, K.X. Expression of active tectonics in erosional landscapes. J. Struct. Geol. 2012, 44, 54–75. [Google Scholar] [CrossRef]
- Vanacker, V.; Blanckenburg, F.V.; Govers, G.; Molina, A.; Campforts, B.; Kubik, P.W. Transient river response, captured by channel steepness and its concavity. Geomorphology 2015, 228, 234–243. [Google Scholar] [CrossRef]
- Keller, E.A.; Pinter, N. Active Tectonics: Earthquake, Uplift, and Landscape, 2nd ed.; Prentice Hall: Upper Saddle River, NJ, USA, 2002. [Google Scholar]
- Dong, S. Late Quaternary Tectonic Activity and Paleoseismology along the Langshan Range-Front Fault. Doctoral Dissertation, Institute of Geology, China Earthquake Administration, Beijing, China, 2016. [Google Scholar]
- Duvall, A.; Kirby, E.; Burbank, D. Tectonic and lithologic controls on bedrock channel profiles and processes in coastal California. J. Geophys. Res. Earth Surf. 2004, 109, F03002. [Google Scholar] [CrossRef]
- Jia, L.; Zhang, X.; He, Z.; He, X.; Wu, F.; Zhou, Y.; Fu, L.; Zhao, J. Late Quaternary climatic and tectonic mechanisms driving river terrace development in an area of mountain uplift: A case study in the Langshan area, Inner Mongolia, northern China. Geomorphology 2015, 234, 109–121. [Google Scholar] [CrossRef]
- Jia, L.; Zhang, X.; Ye, P.; Zhao, X.; He, Z.; He, X.; Zhou, Q.; Li, J.; Ye, M.; Wang, Z.; et al. Development of the alluvial and lacustrine terraces on the northern margin of the Hetao Basin, Inner Mongolia, China: Implications for the evolution of the Yellow River in the Hetao area since the late Pleistocene. Geomorphology 2016, 263, 87–98. [Google Scholar] [CrossRef]
- Ackermann, R.V.; Schlische, R.W.; Withjack, M.O. The geometric and statistical evolution of normal fault systems: An experimental study of the effects of mechanical layer thickness on scaling laws. J. Struct. Geol. 2001, 23, 1803–1819. [Google Scholar] [CrossRef]
- Cowie, P.A.; Sornette, D.; Vanneste, C. Multifractal Scaling Properties of a Growing Fault Population. Geophys. J. Int. 1995, 122, 457–469. [Google Scholar] [CrossRef]
- Cowie, P.A.; Vanneste, C.; Sornette, D. Statistical physics model for the spatiotemporal evolution of faults. J. Geophys. Res. Solid Earth 1993, 98, 21809–21821. [Google Scholar] [CrossRef]
- Crider, J.G.; Pollard, D.D. Fault linkage: Three-dimensional mechanical interaction between echelon normal faults. J. Geophys. Res. Solid Earth 1998, 103, 24373–24391. [Google Scholar] [CrossRef]
- Trudgill, B.; Cartwright, J. Relay-ramp forms and normal-fault linkages, Canyonlands National Park, Utah. Geol. Soc. Am. Bull. 1994, 106, 1143–1157. [Google Scholar] [CrossRef]
- Peacock, D.C.P.; Sanderson, D.J. Geometry and development of relay ramps in normal fault systems. AAPG Bull. 1994, 78, 147–165. [Google Scholar] [CrossRef]
- Loget, N.; Driessche, J. Wave train model for knickpoint migration. Geomorphology 2009, 106, 376–382. [Google Scholar] [CrossRef]
- Liang, K.; He, Z.; Ma, B.; Tian, Q.; Liu, S. Joint-rupture pattern and newly generated structure of fault intersections on the northern margin of the Linhe Basin, northwestern Ordos Block, China. Tectonics 2021, 40, e2021TC006845. [Google Scholar] [CrossRef]
- Zhao, H.; Zhang, J.; Lin, Y.; Qi, J.; Zhang, B.; Niu, P.; Yun, L.; Zhang, Y.; Wang, Y. Relay structures and linkage characteristics of normal fault: An example from the Langshan piedmont normal fault zone. Acta Geol. Sin. 2019, 93, 1601–1617. [Google Scholar]
- Zhao, H.; Zhang, J.; Li, Y.; Qü, J.; Zhang, B.; Zhang, Y.; Yun, L.; Wang, Y. Characteristics of Cenozoic faults in Langshan area, Inner Mongolia: Constraint on the development of normal faults. Geol. China 2019, 46, 1433–1453. [Google Scholar]
- Shi, F.; Tan, X.; Zhou, C.; Liu, Y. Impact of asymmetric uplift on mountain asymmetry: Analytical solution, numerical modeling, and natural examples. Geomorphology 2021, 389, 107862. [Google Scholar] [CrossRef]
Disclaimer/Publisher’s Note: The statements, opinions and data contained in all publications are solely those of the individual author(s) and contributor(s) and not of MDPI and/or the editor(s). MDPI and/or the editor(s) disclaim responsibility for any injury to people or property resulting from any ideas, methods, instructions or products referred to in the content. |
© 2023 by the authors. Licensee MDPI, Basel, Switzerland. This article is an open access article distributed under the terms and conditions of the Creative Commons Attribution (CC BY) license (https://creativecommons.org/licenses/by/4.0/).