
Impact of Extreme Climate on the NDVI of Different Steppe Areas in Inner Mongolia, China


Abstract
:1. Introduction
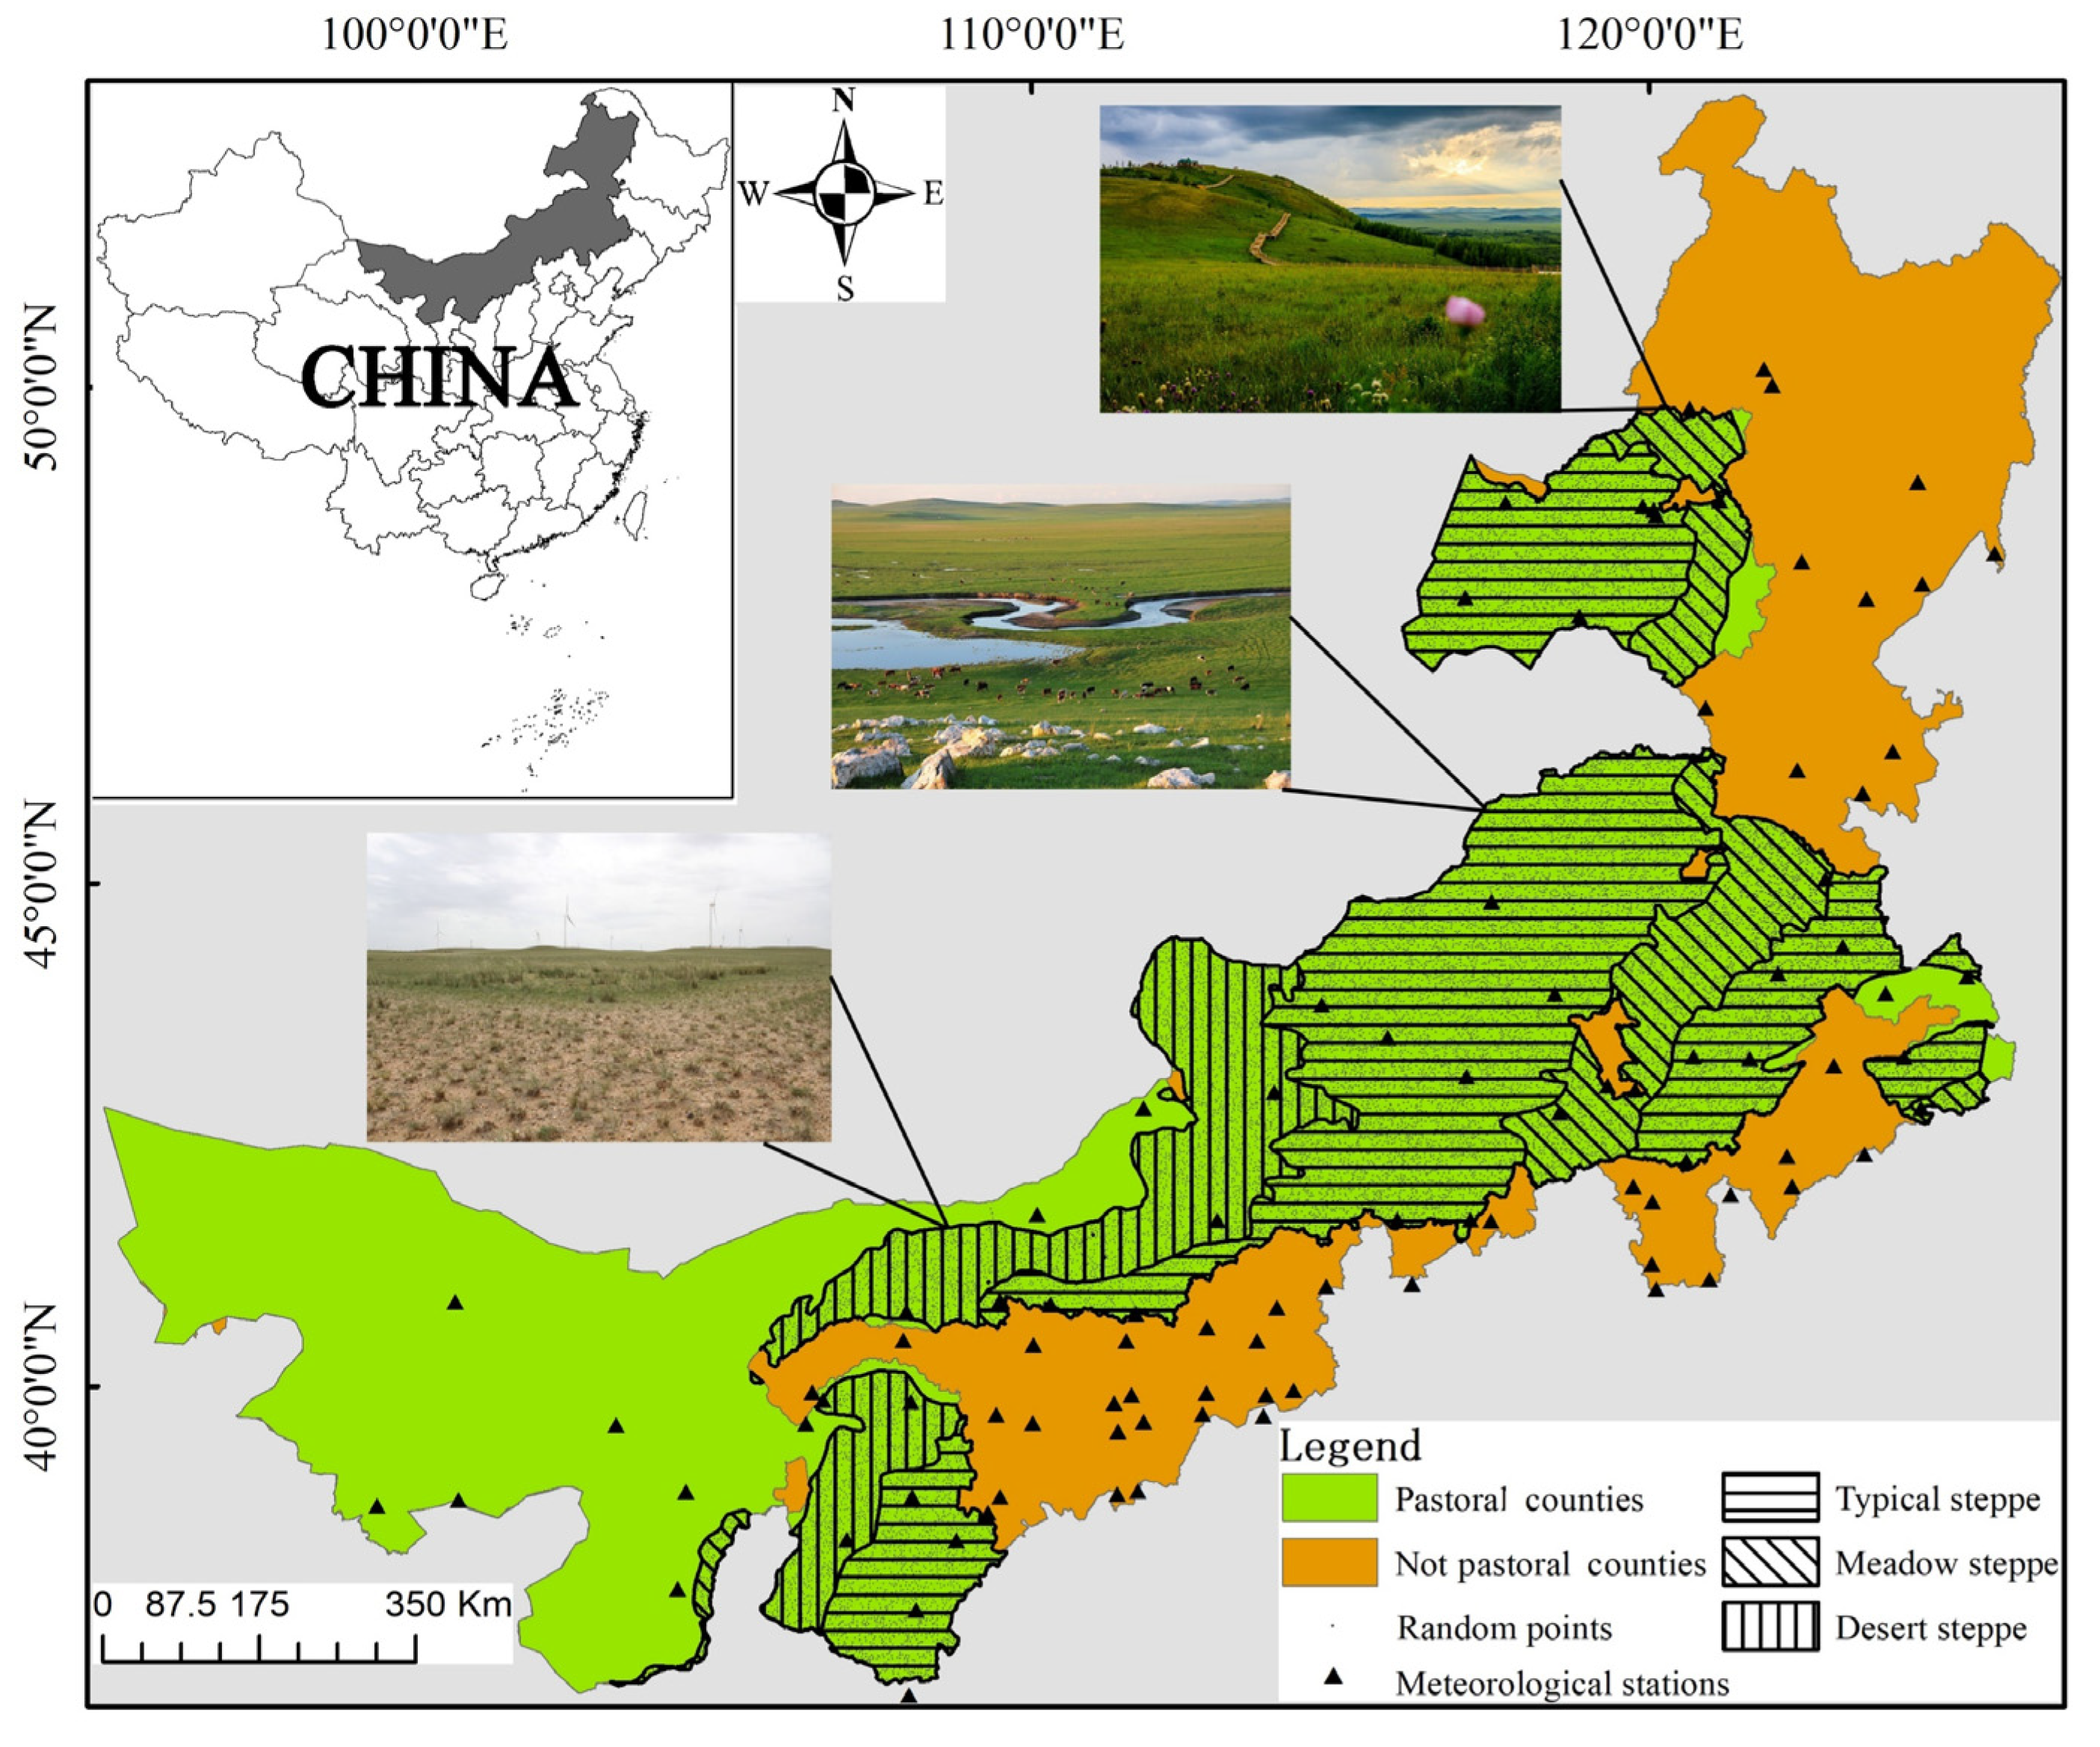
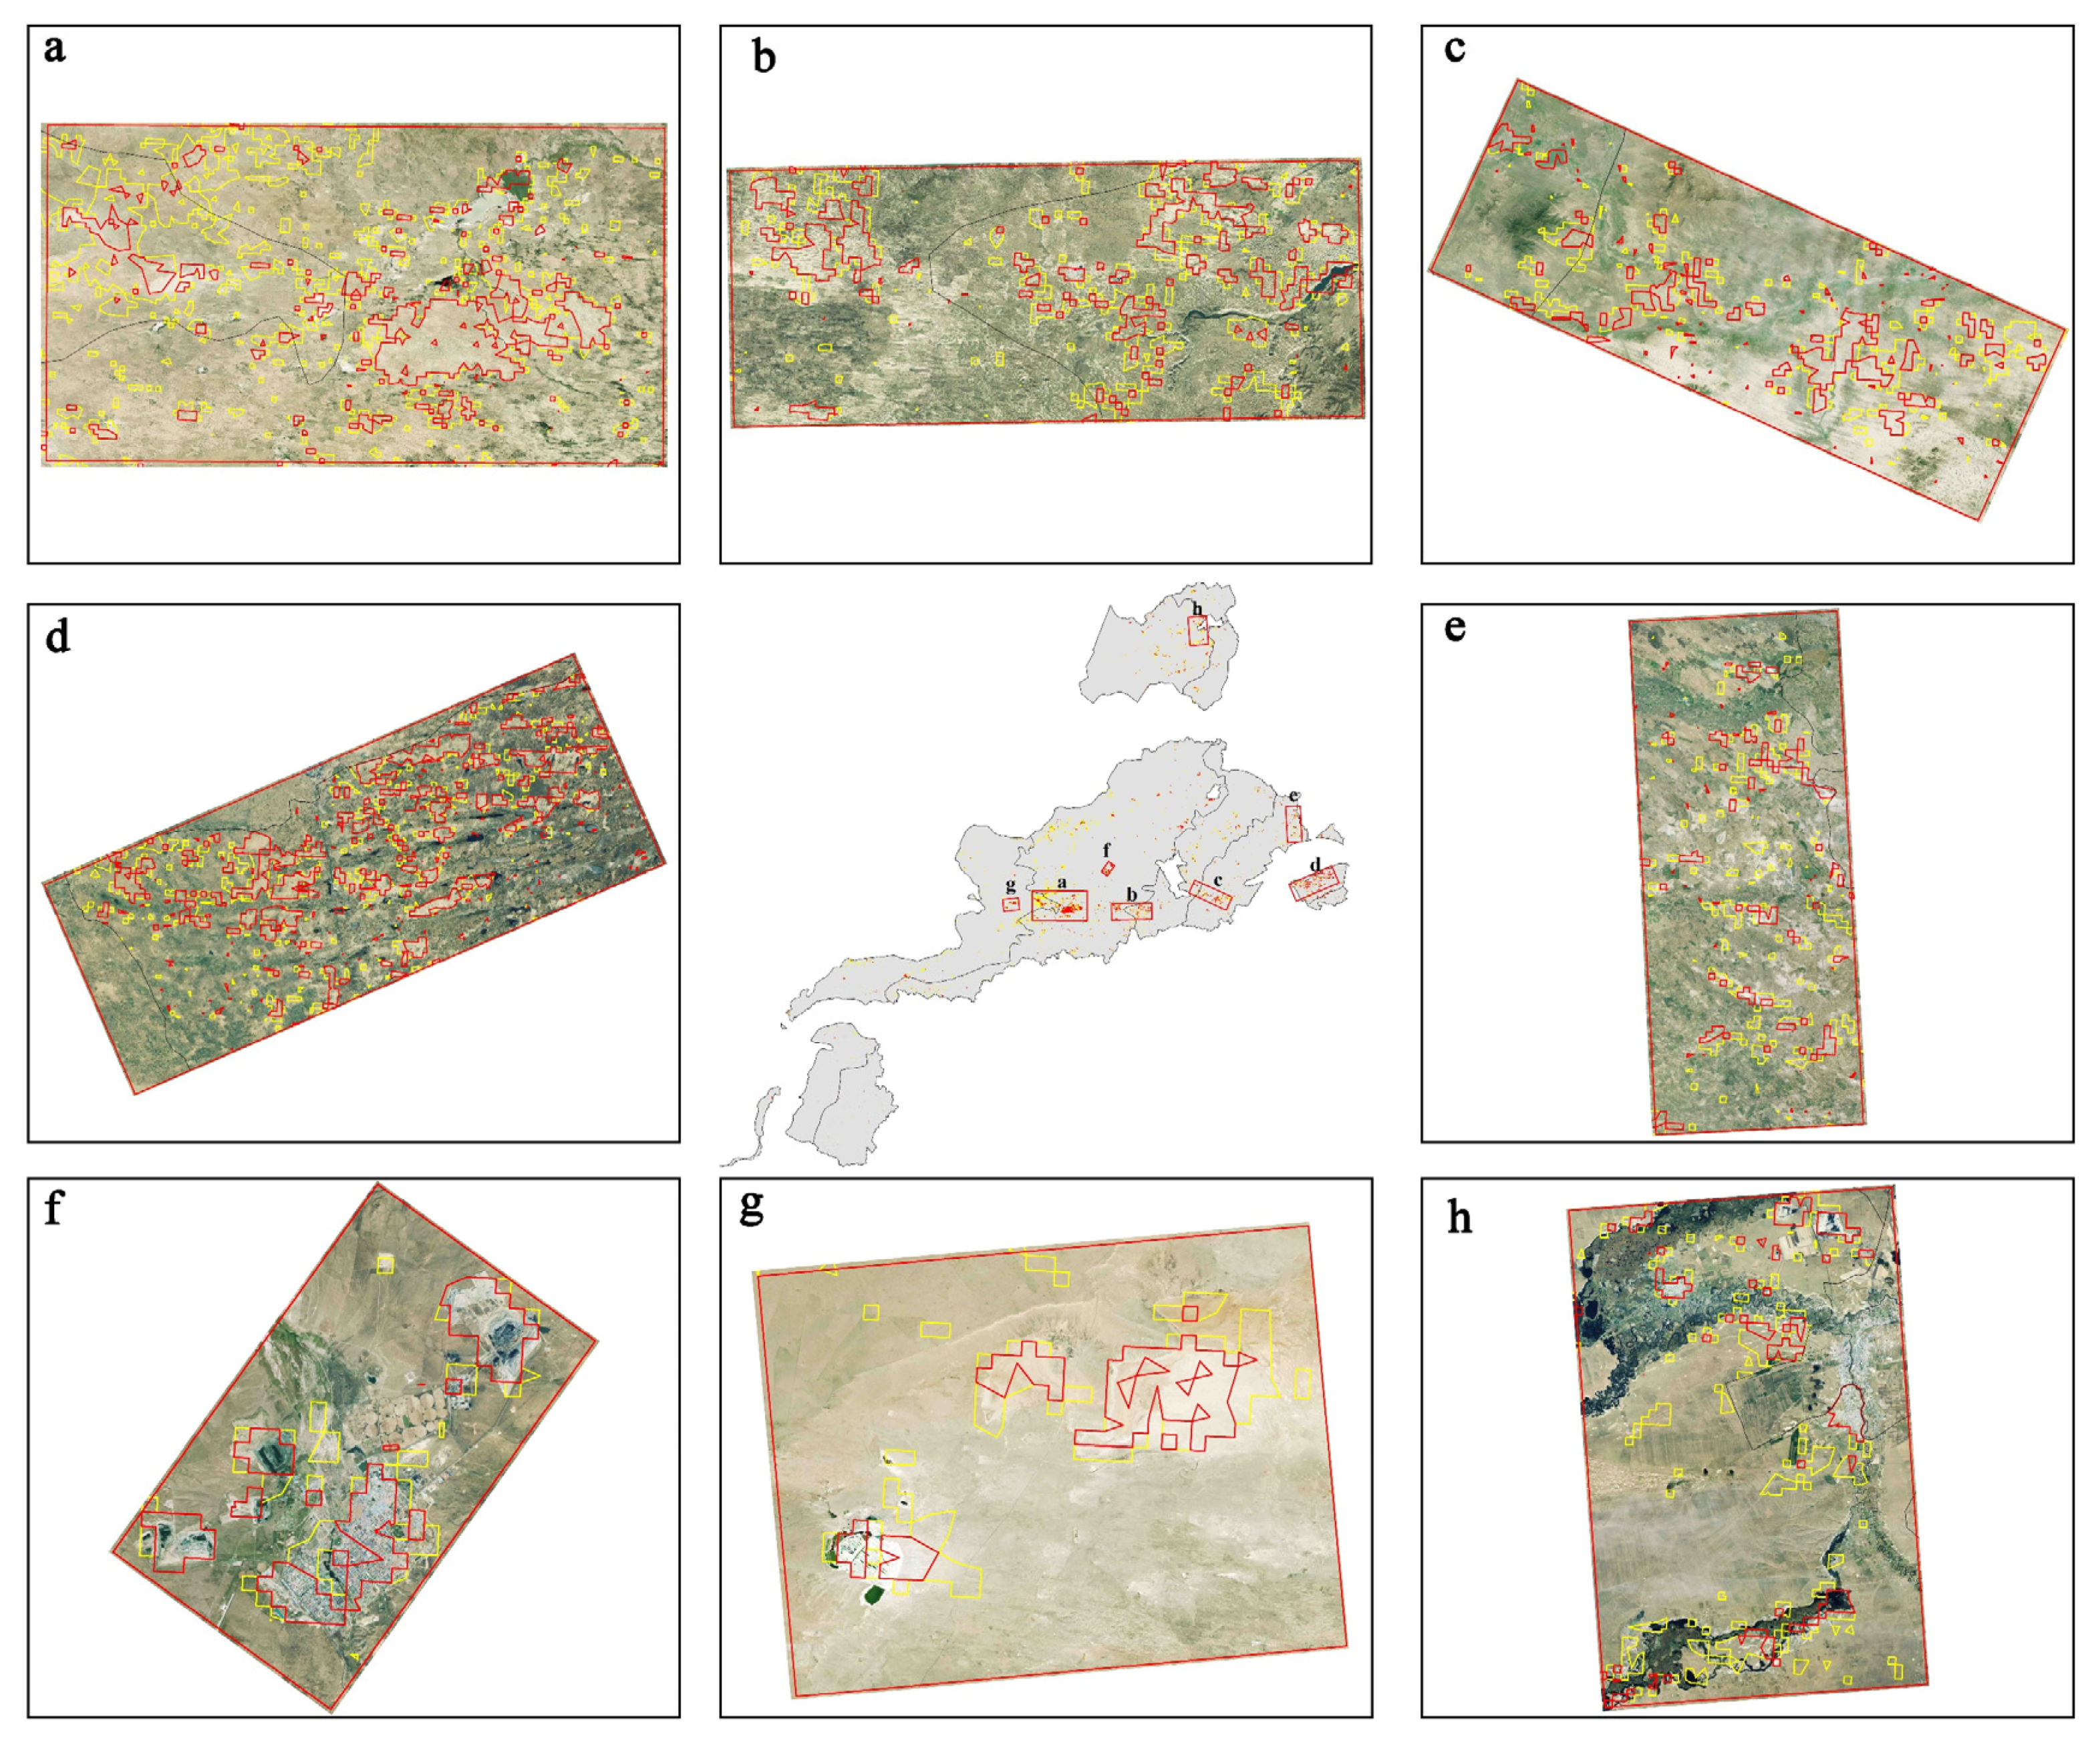
2. Study Area
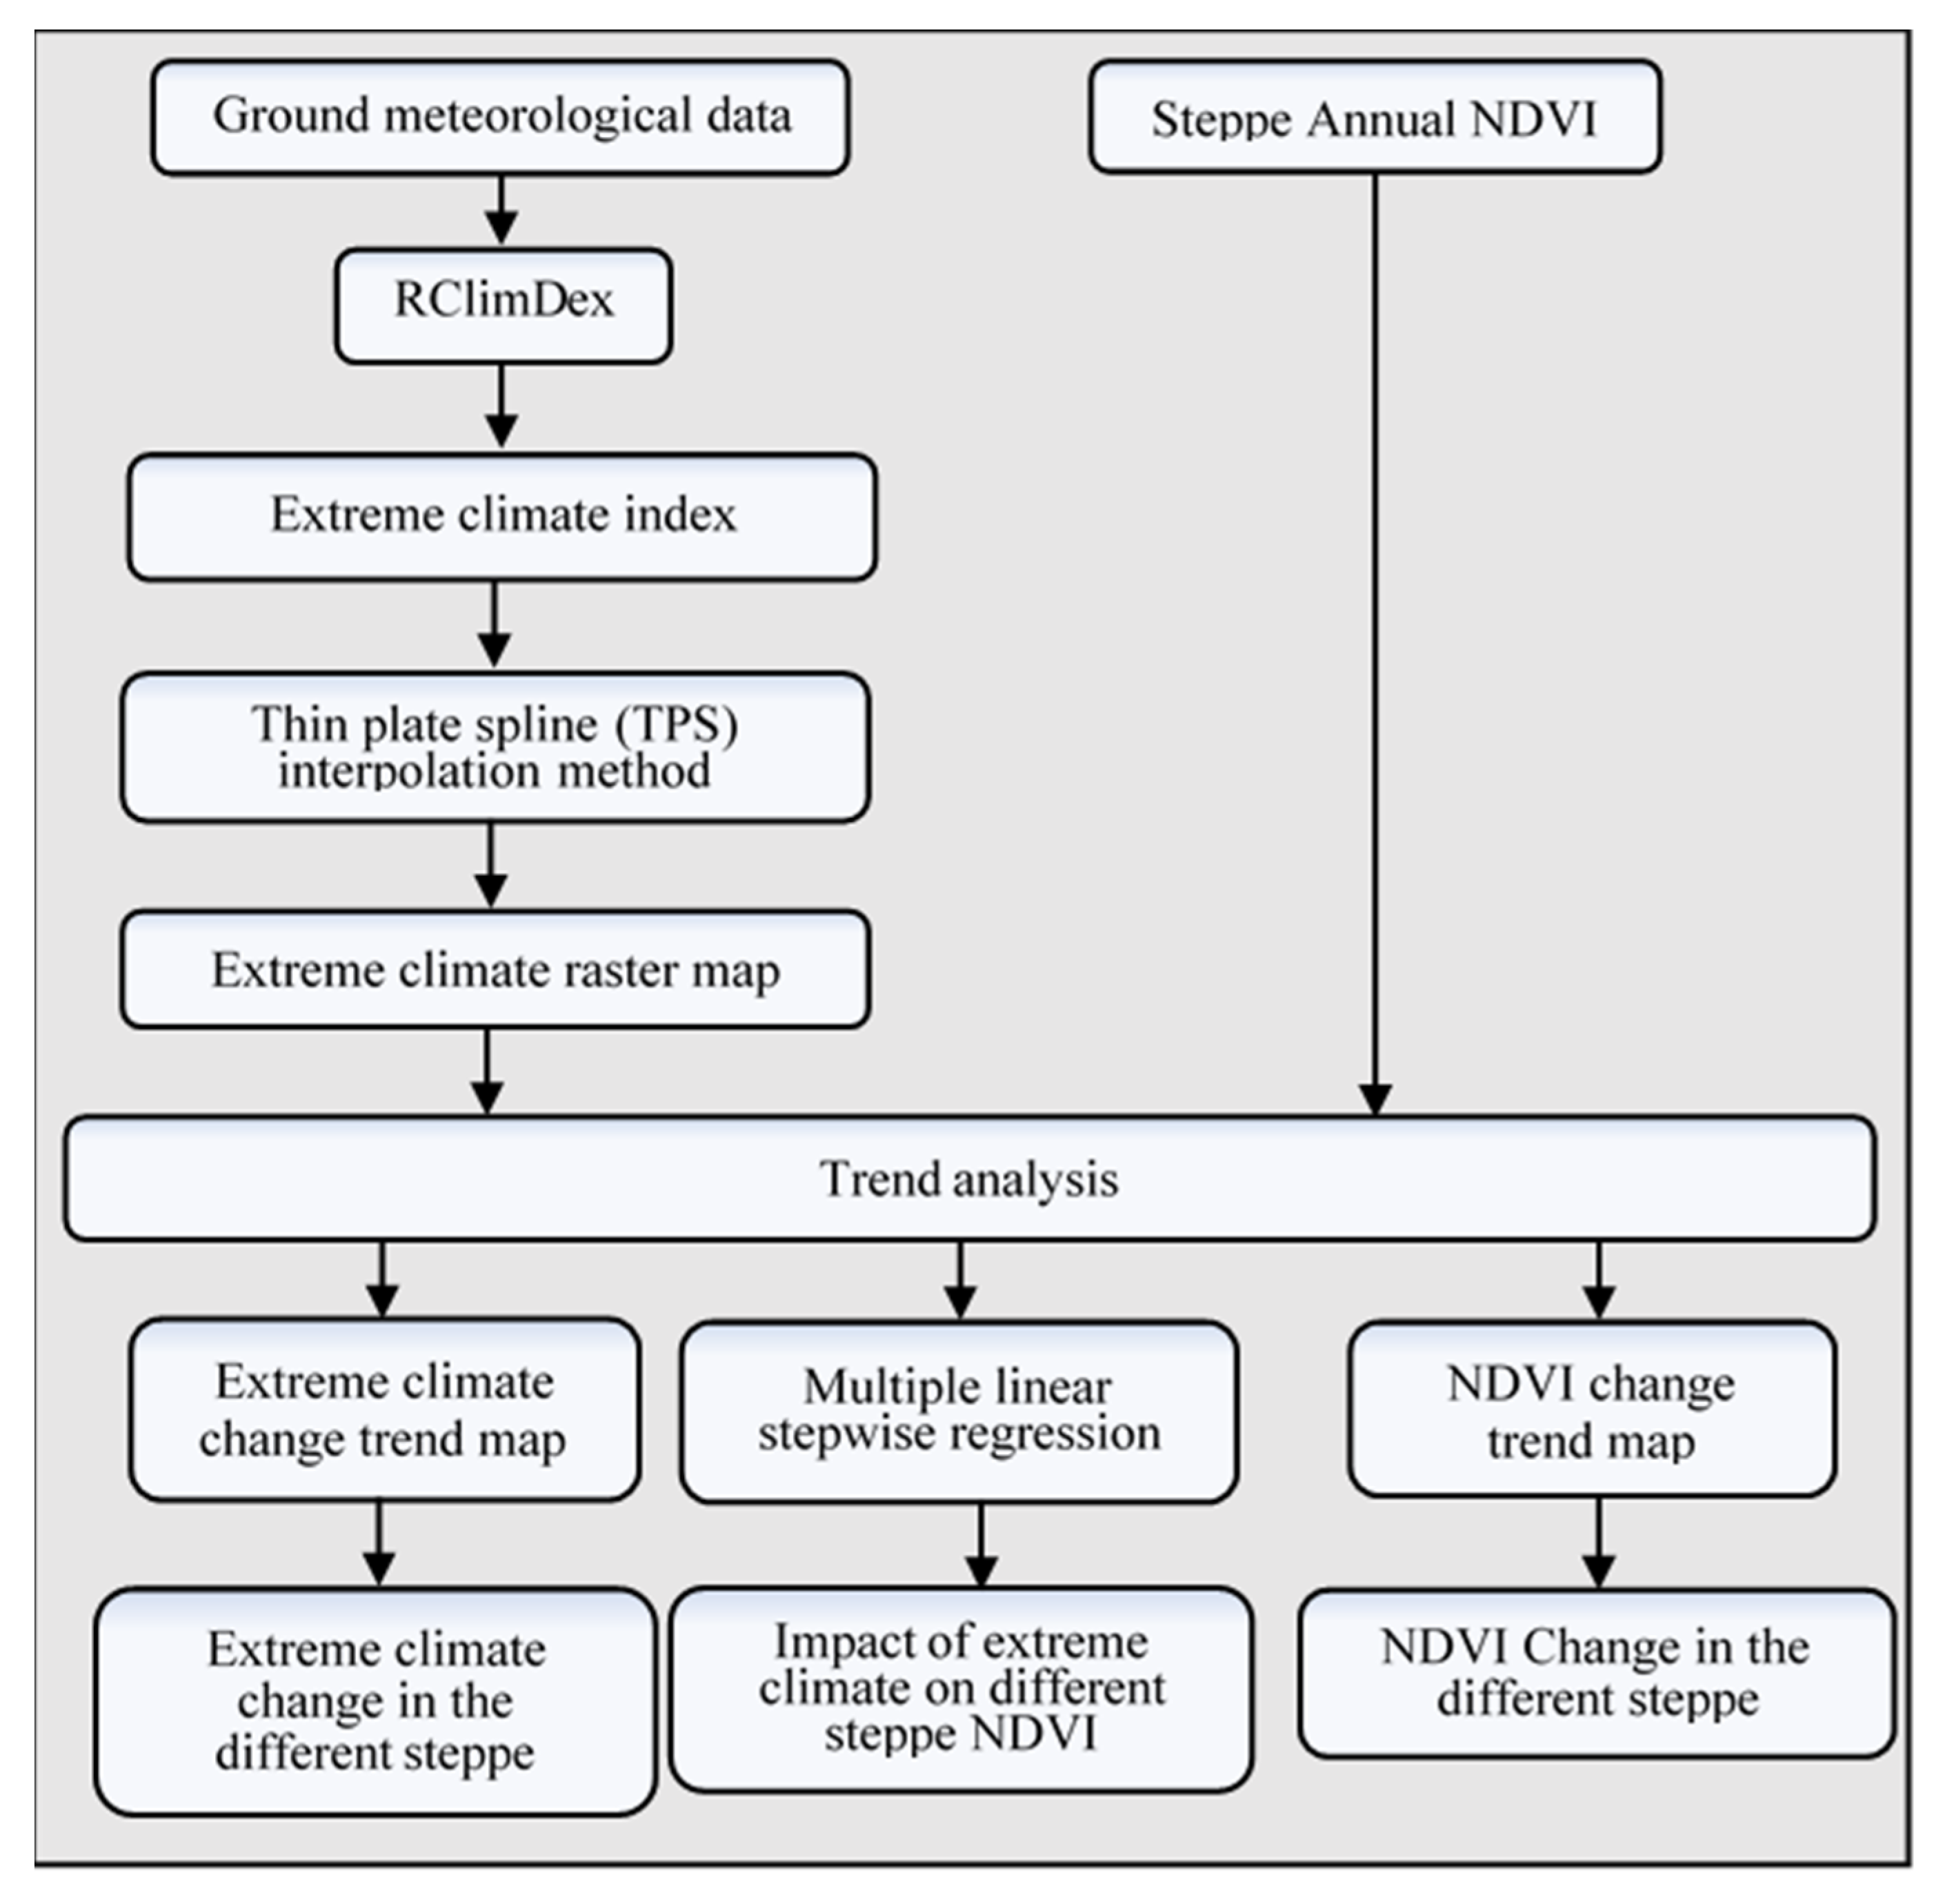
3. Materials and Methods
3.1. Data and Data Processing
3.1.1. NDVI Dataset
3.1.2. Extreme Climate Data
3.2. Methodology
3.2.1. Interpolation of Meteorological Data
3.2.2. Dynamic Variation of NDVI
3.2.3. Sample Selection
3.2.4. The Multiple Linear Stepwise Regression (MLSR)
4. Results
4.1. Dynamic Variation of Different Steppe NDVI
4.2. Extreme Temperature Variation of Different Steppe Types
4.3. Extreme Precipitation Variation of Different Steppe Types
4.4. Impact of Extreme Climate Change Trends on NDVI in Different Steppe Types
5. Discussion
5.1. NDVI Dynamics
5.2. Extreme Climate Change in Different Steppe Types
5.3. Degree of Influence of Extreme Climate on Changes in Steppe NDVI
6. Conclusions
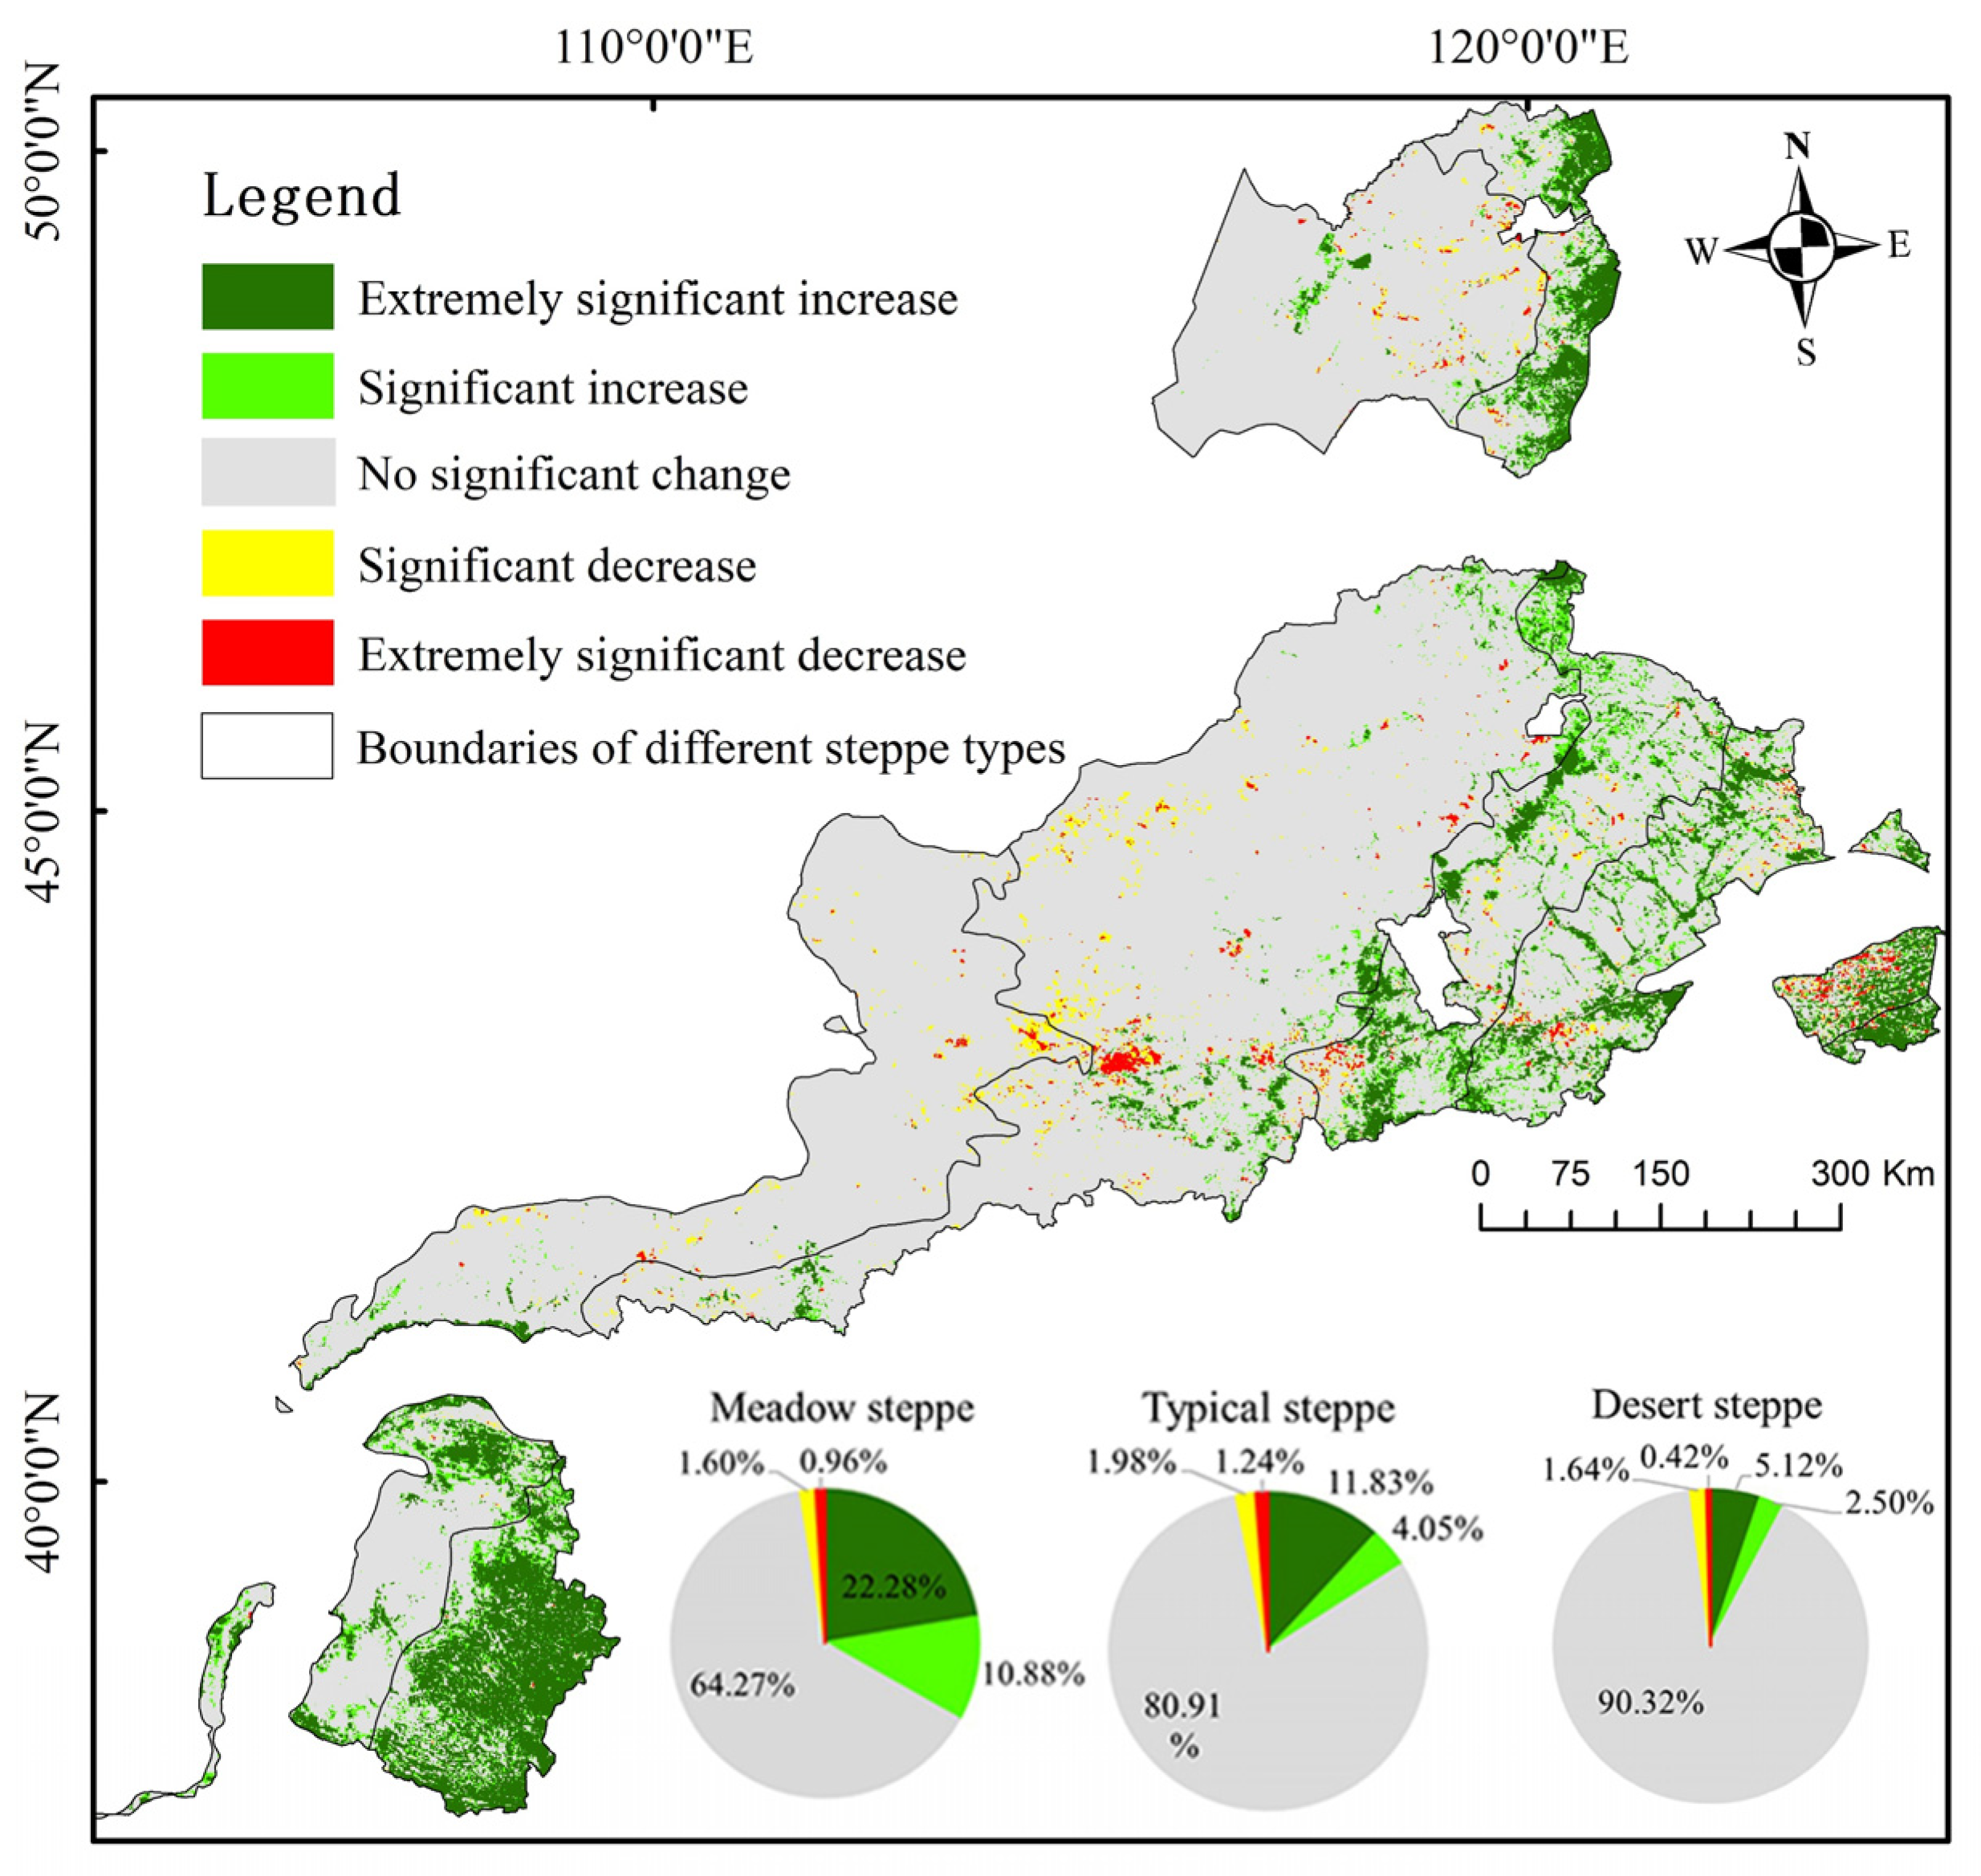
- From 1998 to 2017, the NDVI of the Inner Mongolian steppe increased significantly overall; however, some localized areas saw a decrease. Among the different steppe types, meadow steppe increased by 33.10% and decreased by 2.54%, typical steppe increased by 12.28% and decreased by 3.22%, and desert steppe increased by 7.62% and decreased by 2.06%.
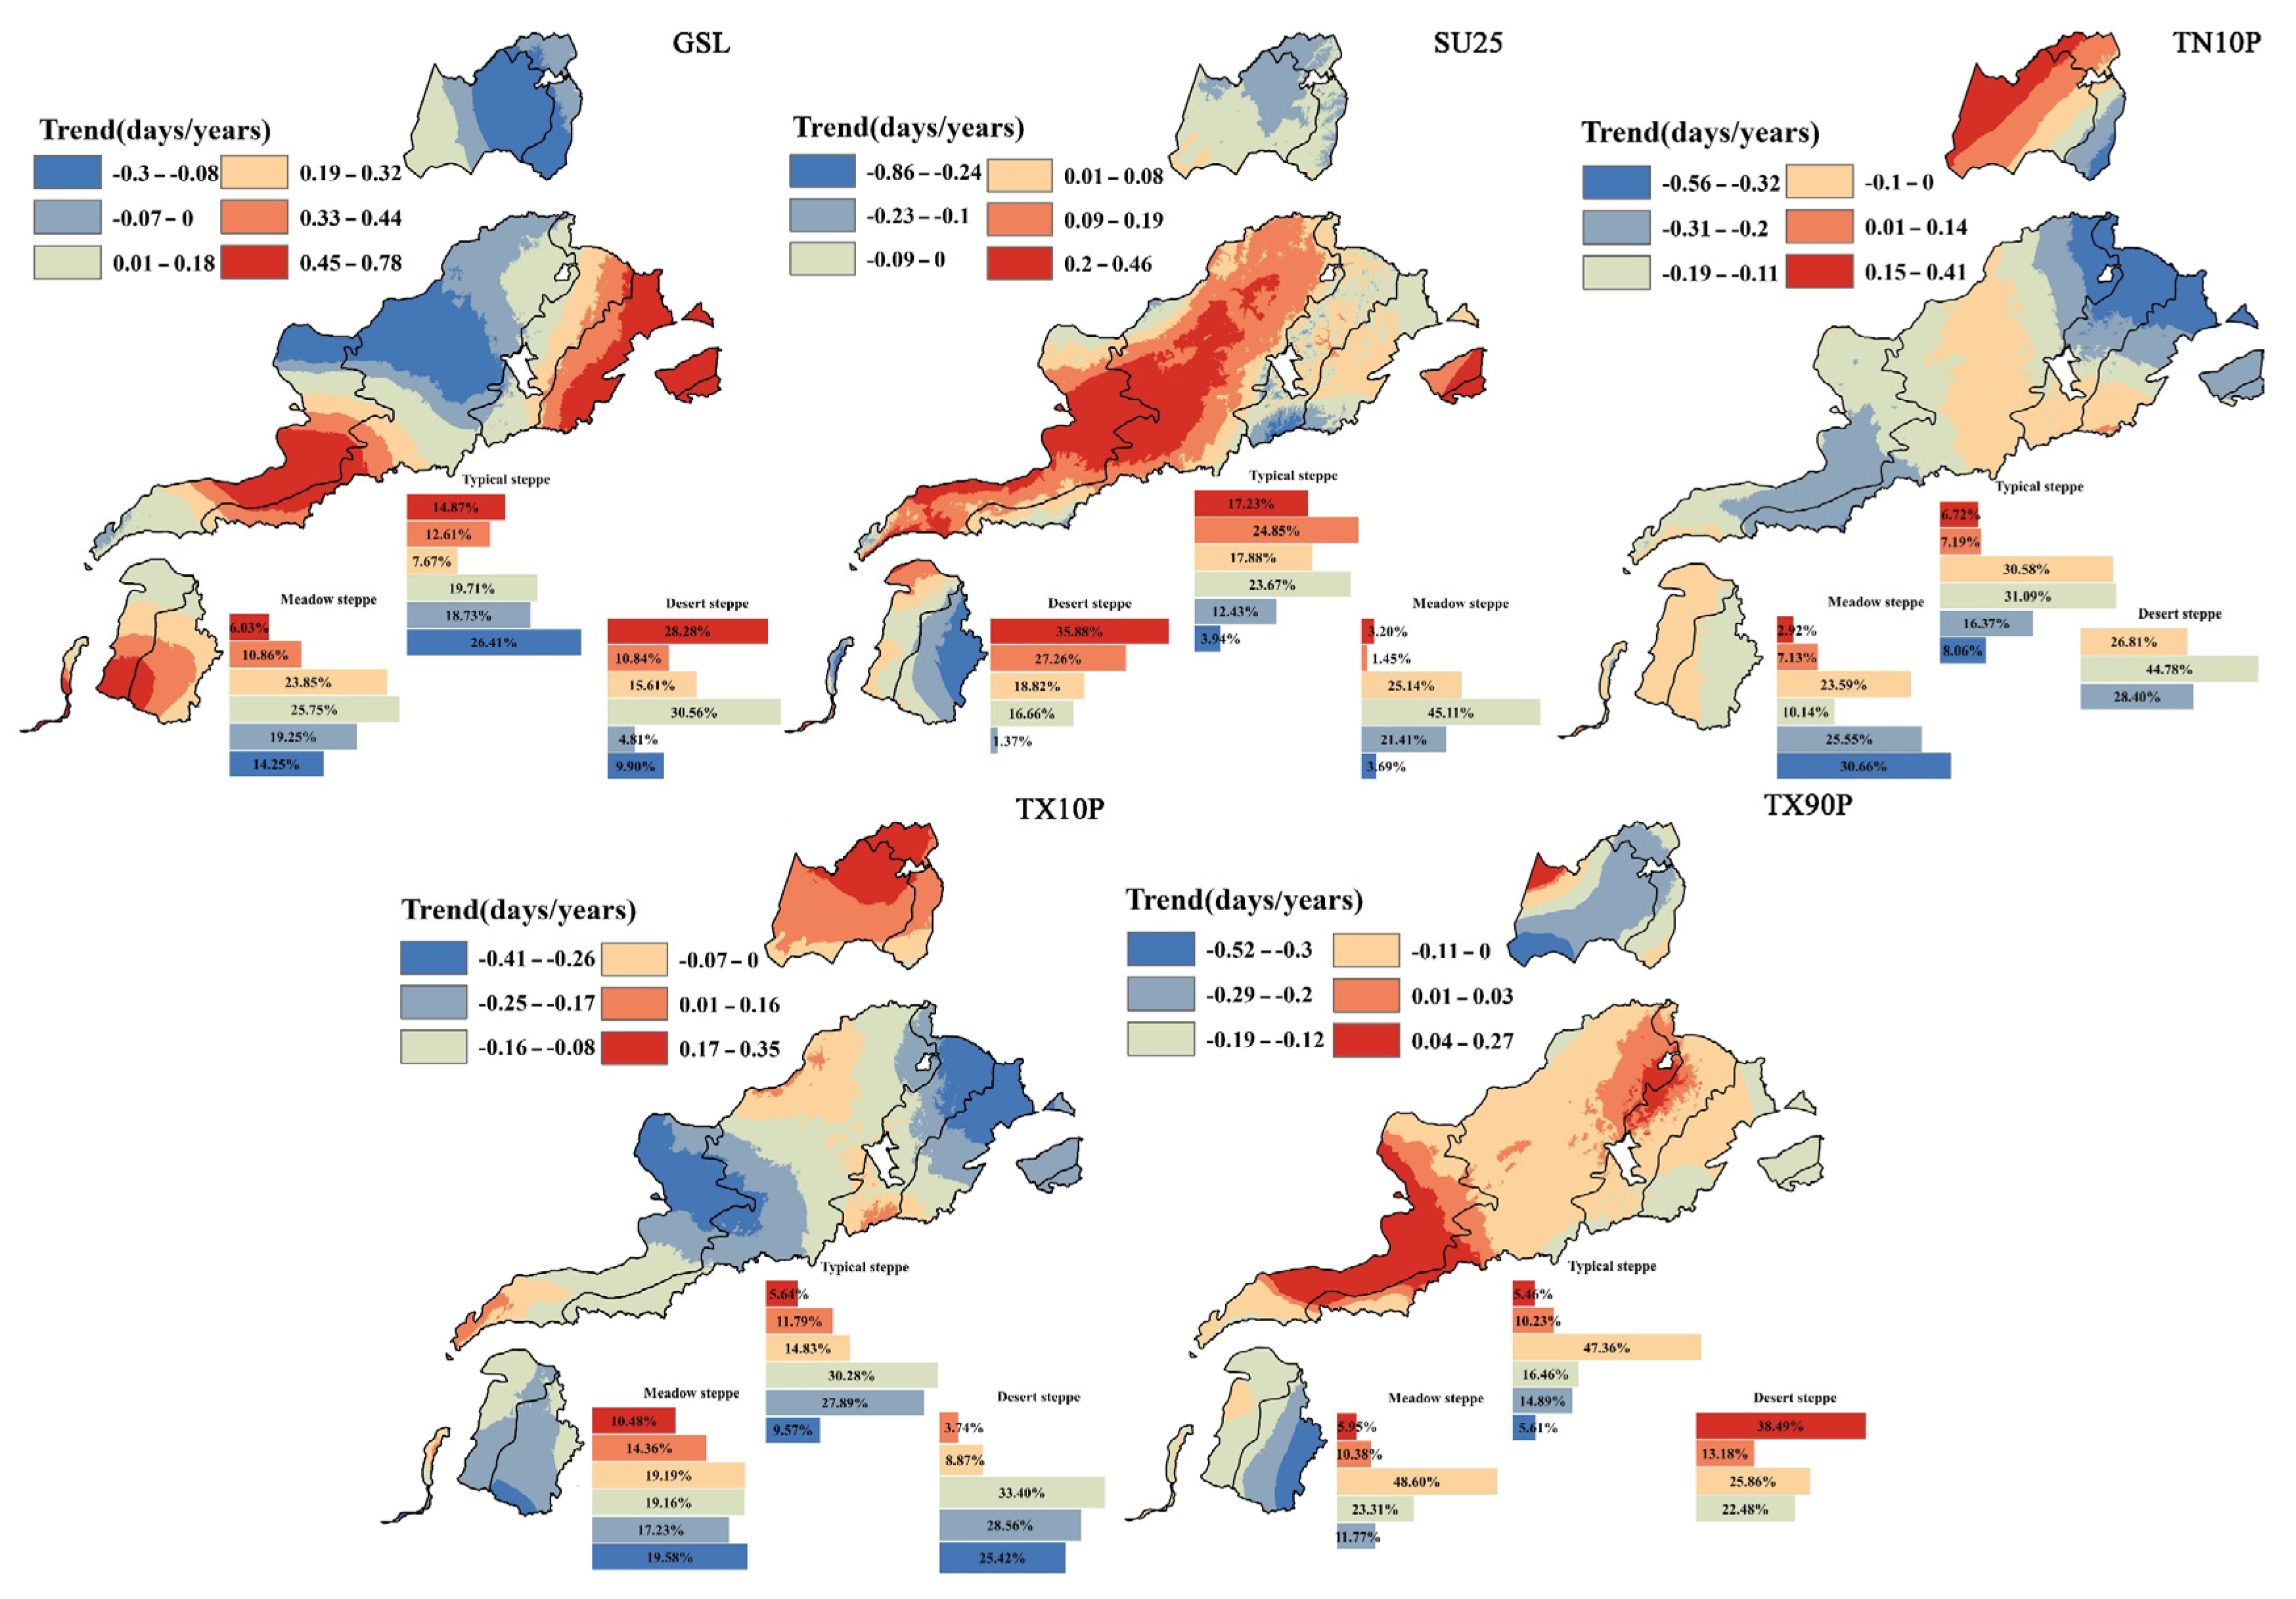
- During the study period, the Inner Mongolian steppe exhibited an increase in the extreme temperature index related to warming and a decreasing trend in the extreme temperature index related to cooling. This was most obvious for the desert steppe, followed by typical steppe and then meadow steppe.
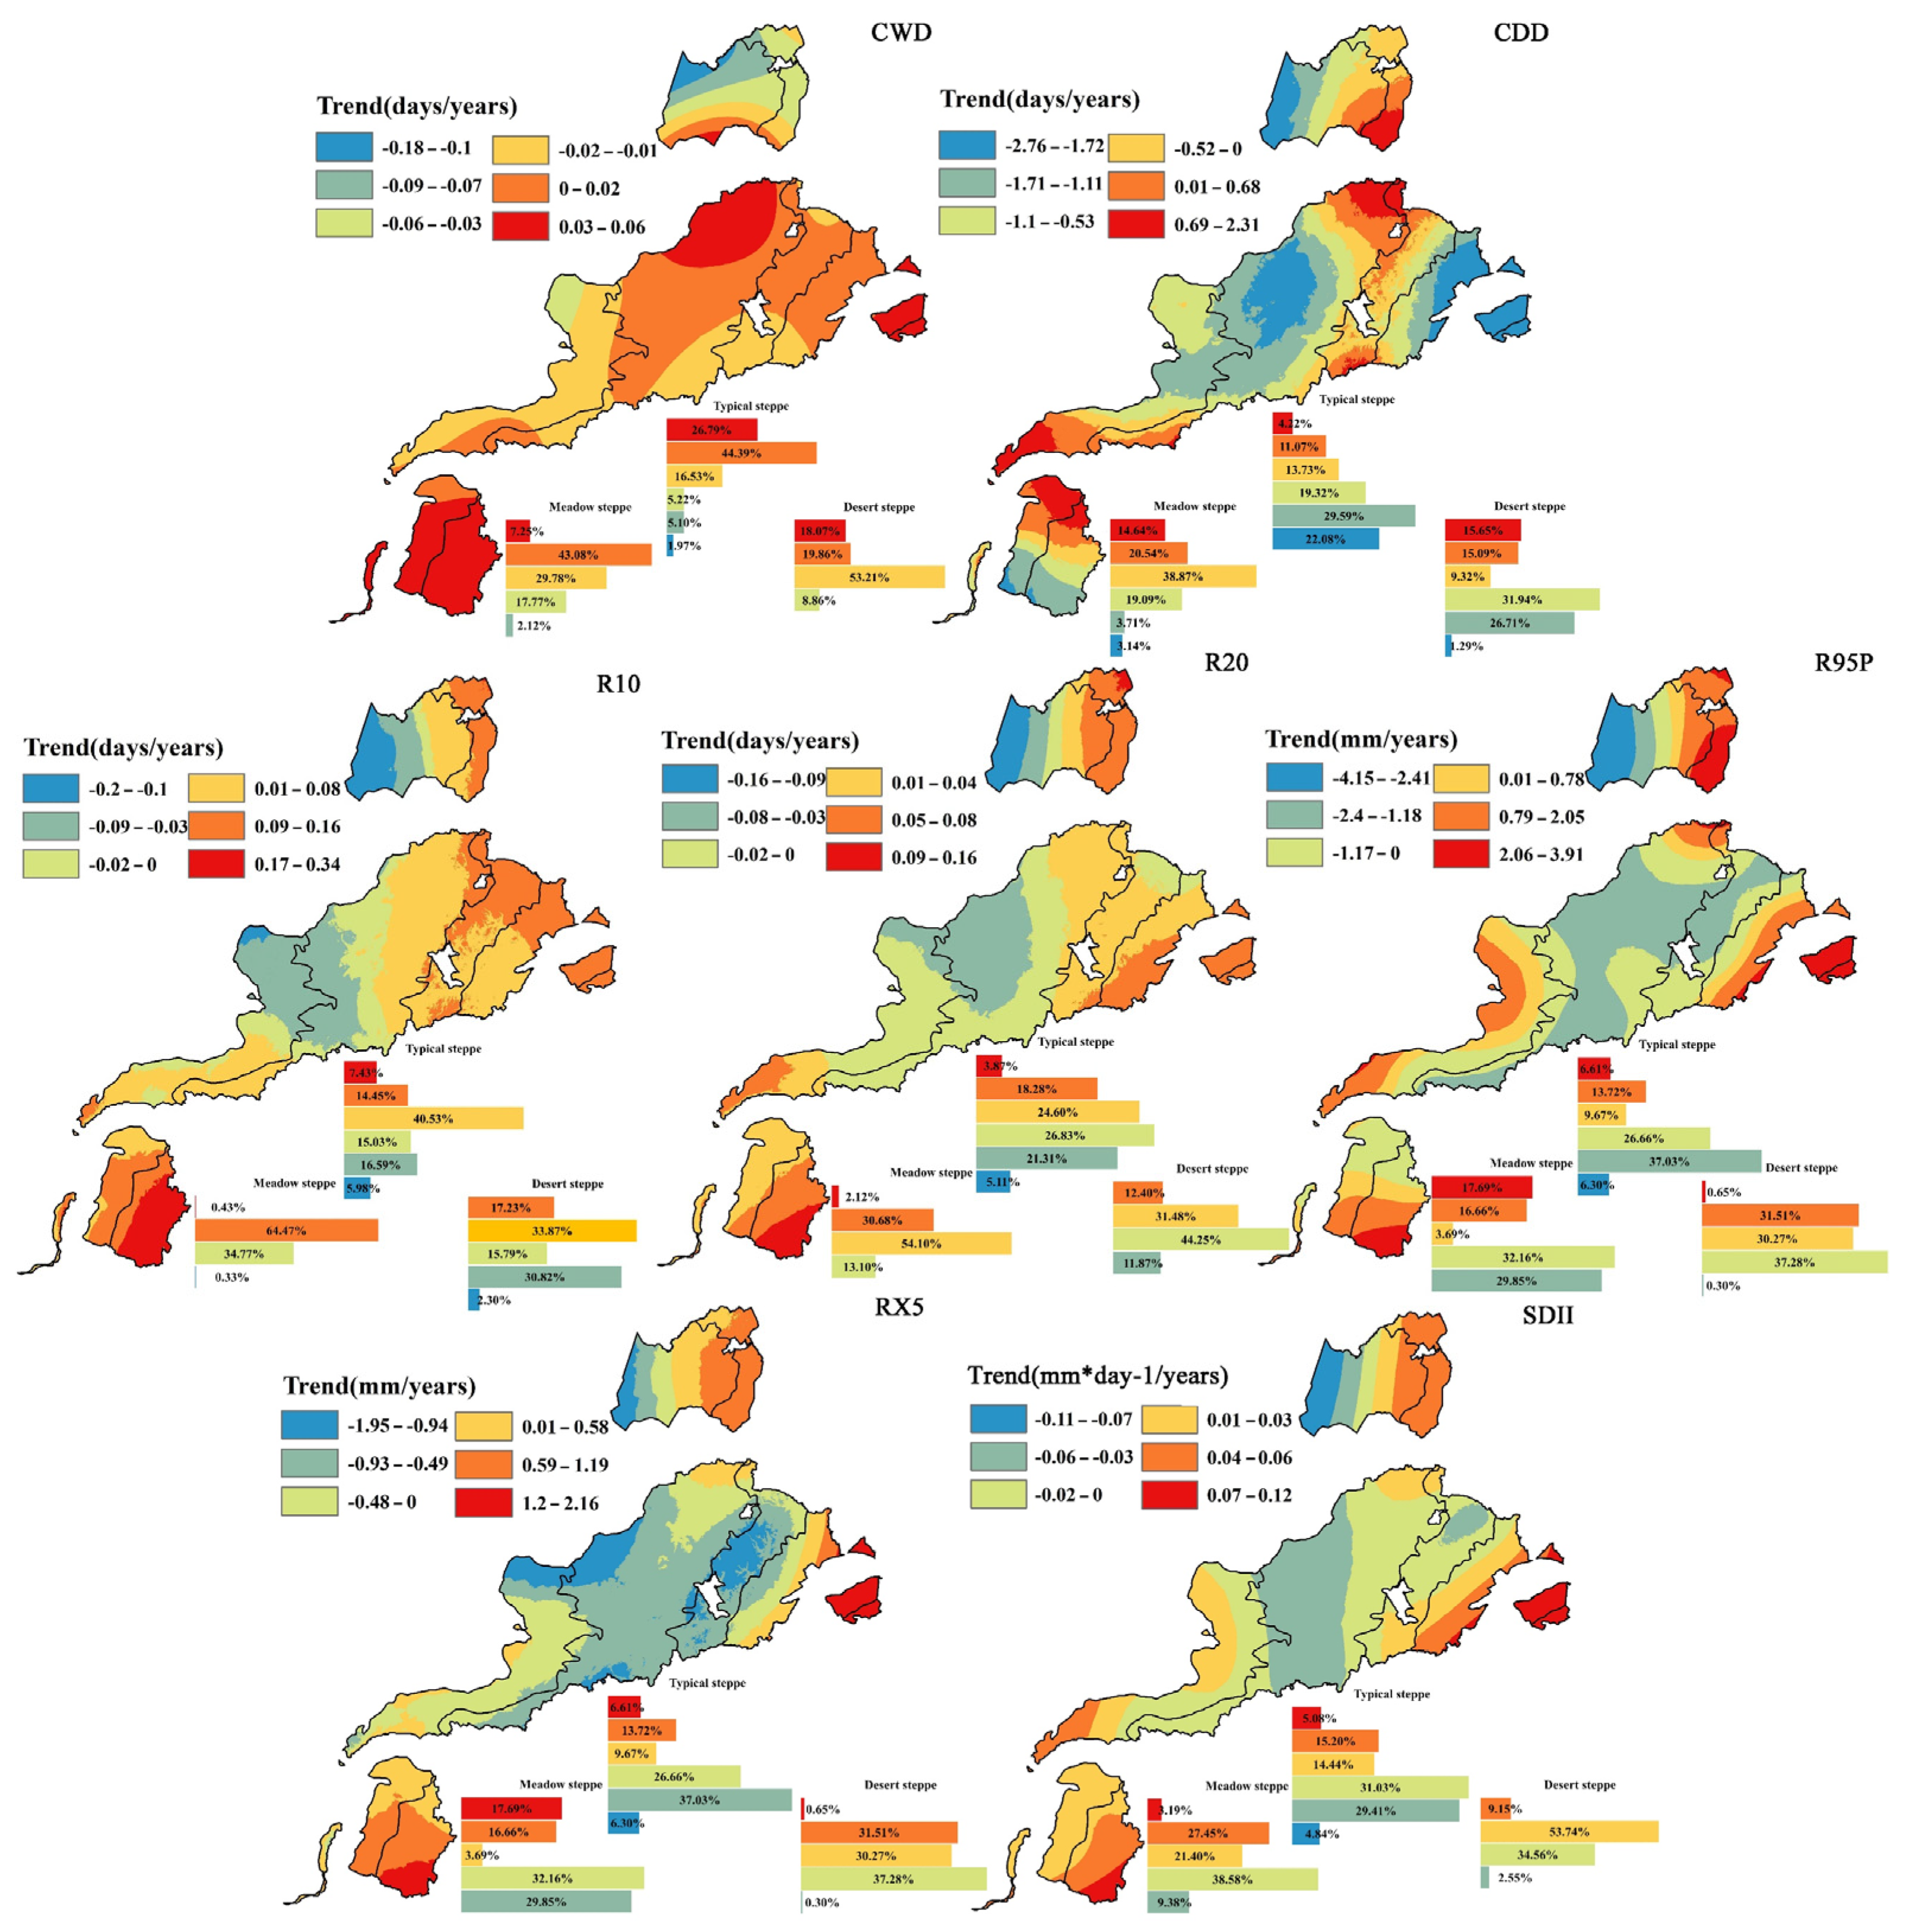
- The extreme precipitation index did not change significantly in the steppe of Inner Mongolia but spatially exhibited an increasing trend in the northeast and southwest and a decreasing trend in the central region. There were no conspicuous differences in changes among the three steppe types.
- The impacts of extreme climate change on the NDVI trend of different steppe types in Inner Mongolia differed. The explanation rate of NDVI changes in the desert steppe was high (R2 = 0.413), followed by typical steppe (R2 = 0.229), and meadow steppe (R2 = 0.109).
- Among the three models established, desert steppe was most affected by the TX90P index (standardized coefficient −0.236), typical steppe was most affected by the R10 index (standardized coefficient 0.337), and meadow steppe was most affected by the R95P index (standardized coefficient 0.203).
Author Contributions
Funding
Institutional Review Board Statement
Informed Consent Statement
Conflicts of Interest
References
- Joughin, I.; Abdalati, W.; Fahnestock, M. Large fluctuations in speed on Greenland’s Jakobshavn Isbrae glacier. Nature 2004, 432, 608–610. [Google Scholar] [CrossRef] [PubMed]
- Trenberth, K.E. Framing the way to relate climate extremes to climate change. Clim. Chang. 2012, 115, 283–290. [Google Scholar] [CrossRef] [Green Version]
- Coumou, D.; Rahmstorf, S. A decade of weather extremes. Nat. Clim. Chang. 2012, 2, 491–496. [Google Scholar] [CrossRef]
- Diffenbaugh, N.S.; Singh, D.; Mankin, J.S.; Horton, D.E.; Swain, D.L.; Touma, D.; Charland, A.; Liu, Y.; Haugen, M.; Tsiang, M.; et al. Quantifying the influence of global warming on unprecedented extreme climate events. Proc. Natl. Acad. Sci. USA 2017, 114, 4881–4886. [Google Scholar] [CrossRef] [PubMed] [Green Version]
- Wang, X.; Jiang, D.; Lang, X. Future extreme climate changes linked to global warming intensity. Sci. Bull. 2017, 62, 1673–1680. [Google Scholar] [CrossRef] [Green Version]
- Fischer, E.M.; Sippel, S.; Knutti, R. Increasing probability of record-shattering climate extremes. Nat. Clim. Chang. 2021, 11, 689–695. [Google Scholar] [CrossRef]
- Islam, A.; Islam, H.M.T.; Shahid, S.; Khatun, M.K.; Ali, M.M.; Rahman, M.S.; Ibrahim, S.M.; Almoajel, A.M. Spatiotemporal nexus between vegetation change and extreme climatic indices and their possible causes of change. J. Environ. Manag. 2021, 289, 112505. [Google Scholar] [CrossRef]
- Tan, Z.; Tao, H.; Jiang, J.; Zhang, Q. Influences of Climate Extremes on NDVI (Normalized Difference Vegetation Index) in the Poyang Lake Basin, China. Wetlands 2015, 35, 1033–1042. [Google Scholar] [CrossRef]
- Bo, L.; Hongliang, S.; Sidi, Z.; Hanxi, P. Discussion on Vegetation Resources and Utilization Directions of Grassland in Hulunbuir Pastoral Area. Chin. Resour. Sci. 1980, 4, 30–36. [Google Scholar]
- Meng, X.; Gao, X.; Li, S.; Lei, J. Spatial and Temporal Characteristics of Vegetation NDVI Changes and the Driving Forces in Mongolia during 1982–2015. Remote Sens. 2020, 12, 603. [Google Scholar] [CrossRef] [Green Version]
- Na, L.; Na, R.; Zhang, J.; Tong, S.; Shan, Y.; Ying, H.; Li, X.; Bao, Y. Vegetation Dynamics and Diverse Responses to Extreme Climate Events in Different Vegetation Types of Inner Mongolia. Atmosphere 2018, 9, 394. [Google Scholar] [CrossRef] [Green Version]
- Xu, X.; Jiang, H.; Guan, M.; Wang, L.; Huang, Y.; Jiang, Y.; Wang, A. Vegetation responses to extreme climatic indices in coastal China from 1986 to 2015. Sci. Total Environ. 2020, 744, 140784. [Google Scholar] [CrossRef] [PubMed]
- Li, C.; Wang, J.; Hu, R.; Yin, S.; Bao, Y.; Ayal, D.Y. Relationship between vegetation change and extreme climate indices on the Inner Mongolia Plateau, China, from 1982 to 2013. Ecol. Indic. 2018, 89, 101–109. [Google Scholar] [CrossRef]
- John, R.; Chen, J.; Ou-Yang, Z.-T.; Xiao, J.; Becker, R.; Samanta, A.; Ganguly, S.; Yuan, W.; Batkhishig, O. Vegetation response to extreme climate events on the Mongolian Plateau from 2000 to 2010. Environ. Res. Lett. 2013, 8, 035033. [Google Scholar] [CrossRef]
- Cheng, Q.; Zhong, F.; Wang, P. Potential linkages of extreme climate events with vegetation and large-scale circulation indices in an endorheic river basin in northwest China. Atmos. Res. 2021, 247, 105256. [Google Scholar] [CrossRef]
- You, G.; Liu, B.; Zou, C.; Li, H.; McKenzie, S.; He, Y.; Gao, J.; Jia, X.; Altaf Arain, M.; Wang, S.; et al. Sensitivity of vegetation dynamics to climate variability in a forest-steppe transition ecozone, north-eastern Inner Mongolia, China. Ecol. Indic. 2021, 120, 106833. [Google Scholar] [CrossRef]
- Sun, J.; Qin, X.; Yang, J. The response of vegetation dynamics of the different alpine grassland types to temperature and precipitation on the Tibetan Plateau. Environ. Monit. Assess. 2016, 188, 20. [Google Scholar] [CrossRef] [Green Version]
- Wang, S.; Guo, L.; He, B.; Lyu, Y.; Li, T. The stability of Qinghai-Tibet Plateau ecosystem to climate change. Phys. Chem. Earth Parts A/B/C 2020, 115, 102827. [Google Scholar] [CrossRef]
- Duan, H.; Xue, X.; Wang, T.; Kang, W.; Liao, J.; Liu, S. Spatial and Temporal Differences in Alpine Meadow, Alpine Steppe and All Vegetation of the Qinghai-Tibetan Plateau and Their Responses to Climate Change. Remote Sens. 2021, 13, 669. [Google Scholar] [CrossRef]
- Bao, G.; Bao, Y.; Sanjjava, A.; Qin, Z.; Zhou, Y.; Xu, G. NDVI-indicated long-term vegetation dynamics in Mongolia and their response to climate change at biome scale. Int. J. Clim. 2015, 35, 4293–4306. [Google Scholar] [CrossRef]
- Guo, L.; Zuo, L.; Gao, J.; Jiang, Y.; Zhang, Y.; Ma, S.; Zou, Y.; Wu, S. Revealing the Fingerprint of Climate Change in Interannual NDVI Variability among Biomes in Inner Mongolia, China. Remote Sens. 2020, 12, 1332. [Google Scholar] [CrossRef] [Green Version]
- Li, C.; Filho, W.L.; Wang, J.; Yin, J.; Fedoruk, M.; Bao, G.; Bao, Y.; Yin, S.; Yu, S.; Hu, R. An assessment of the impacts of climate extremes on the vegetation in Mongolian Plateau: Using a scenarios-based analysis to support regional adaptation and mitigation options. Ecol. Indic. 2018, 95, 805–814. [Google Scholar] [CrossRef]
- Zhang, Q.; Buyantuev, A.; Fang, X.; Han, P.; Li, A.; Li, F.Y.; Liang, C.; Liu, Q.; Ma, Q.; Niu, J.; et al. Ecology and sustainability of the Inner Mongolian Grassland: Looking back and moving forward. Landsc. Ecol. 2020, 35, 2413–2432. [Google Scholar] [CrossRef]
- Tong, S.; Li, X.; Zhang, J.; Bao, Y.; Bao, Y.; Na, L.; Si, A. Spatial and temporal variability in extreme temperature and precipitation events in Inner Mongolia (China) during 1960–2017. Sci. Total Environ. 2019, 649, 75–89. [Google Scholar] [CrossRef] [PubMed]
- Wang, D.; Ba, L. Ecology of meadow steppe in northeast China. Rangel. J. 2008, 30, 247–254. [Google Scholar] [CrossRef]
- Zhang, T.; Guo, R.; Gao, S.; Guo, J.; Sun, W. Responses of plant community composition and biomass production to warming and nitrogen deposition in a temperate meadow ecosystem. PLoS ONE 2015, 10, e0123160. [Google Scholar] [CrossRef]
- Tang, Z.; An, H.; Deng, L.; Wang, Y.; Zhu, G.; Shangguan, Z. Effect of desertification on productivity in a desert steppe. Sci. Rep. 2016, 6, 27839. [Google Scholar] [CrossRef]
- Wu, J.; Zhang, Q.; Li, A.; Liang, C. Historical landscape dynamics of Inner Mongolia: Patterns, drivers, and impacts. Landsc. Ecol. 2015, 30, 1579–1598. [Google Scholar] [CrossRef]
- Yang, D.; Wei, P.-T.; Yi, G.-H.; Zhang, T.-B.; Qin, Y. Remote sensing monitoring and analysis of influencing factors of drought in Inner Mongolia growing season since 2000. J. Nat. Resour. 2021, 36, 459–475. [Google Scholar] [CrossRef]
- Resources and Environment Data Cloud Platform of the Chinese Academy of Sciences. Available online: http://www.resdc.cn/ (accessed on 7 June 2021).
- Inner Mongolia Autonomous Region Statistics Bureau. 2016 Inner Mongolia Statistical Yearbook; China Statistics Press: Beijing, China, 2016.
- Spatial Distribution Data Set of China Annual Vegetation Index (NDVI). Data Registration and Publication System of Chinese Academy of Sciences. Available online: http://www.resdc.cn/ (accessed on 6 January 2022).
- Zongxing, L.; He, Y.; Wang, P.; Theakstone, W.H.; An, W.; Wang, X.; Lu, A.; Zhang, W.; Cao, W. Changes of daily climate extremes in southwestern China during 1961–2008. Glob. Planet. Chang. 2012, 80–81, 255–272. [Google Scholar] [CrossRef]
- Hutchinson, M.F.; Xu, T. Anusplin Version 4.2 User Guide; Centre for Resource and Environmental Studies, The Australian National University: Canberra, Australia, 2004; p. 54. [Google Scholar]
- Li, S.; Sun, Z.; Tan, M.; Li, X. Effects of rural–urban migration on vegetation greenness in fragile areas: A case study of Inner Mongolia in China. J. Geogr. Sci. 2016, 26, 313–324. [Google Scholar] [CrossRef] [Green Version]
- Kokaly, R.F.; Clark, R.N. Spectroscopic determination of leaf biochemistry using band-depth analysis of absorption features and stepwise multiple linear regression. Remote Sens. Environ. 1999, 67, 267–287. [Google Scholar] [CrossRef]
- Liu, Y.; Tian, J.; Liu, R.; Ding, L. Influences of Climate Change and Human Activities on NDVI Changes in China. Remote Sens. 2021, 13, 4326. [Google Scholar] [CrossRef]
- Li, J.; Liu, Q.; Liu, P. spatio-temporal change and driving forces of fraction of vegetation coverage in Hulunbuir(1998–2018). Acta Ecol. Sin. 2022, 42, 1–16. [Google Scholar]
- Zhang, G.; Dong, J.; Xiao, X.; Hu, Z.; Sheldon, S. Effectiveness of ecological restoration projects in Horqin Sandy Land, China based on SPOT-VGT NDVI data. Ecol. Eng. 2012, 38, 20–29. [Google Scholar] [CrossRef]
- Sun, Z.; Mao, Z.; Yang, L.; Liu, Z.; Han, J.; Wanag, H.; He, W. Impacts of climate change and afforestation on vegetation dynamic in the Mu Us Desert, China. Ecol. Indic. 2021, 129, 108020. [Google Scholar] [CrossRef]
- Duan, H.; Wang, T.; Xue, X.; Yan, C. Dynamic monitoring of aeolian desertification based on multiple indicators in Horqin Sandy Land, China. Sci. Total Environ. 2019, 650, 2374–2388. [Google Scholar] [CrossRef]
- Wang, X.; Li, Y.; Wang, X.; Li, Y.; Lian, J.; Gong, X. Temporal and Spatial Variations in NDVI and Analysis of the Driving Factors in the Desertified Areas of Northern China From 1998 to 2015. Front. Environ. Sci. 2021, 9, 1–16. [Google Scholar] [CrossRef]
- Gou, F.; Liang, W.; Sun, S.; Jin, Z.; Zhang, W.; Yan, J. Analysis of the desertification dynamics of sandy lands in Northern China over the period 2000–2017. Geocarto Int. 2019, 36, 1938–1959. [Google Scholar] [CrossRef]
- Fan, J.; Xu, Y.; Ge, H.; Yang, W. Vegetation growth variation in relation to topography in Horqin Sandy Land. Ecol. Indic. 2020, 113, 106215. [Google Scholar] [CrossRef]
- Wang, Y.; Zhang, J.; Tong, S.; Guo, E. Monitoring the trends of aeolian desertified lands based on time-series remote sensing data in the Horqin Sandy Land, China. Catena 2017, 157, 286–298. [Google Scholar] [CrossRef]
- Li, Y.; Wang, Y.; Song, J. Trends in extreme climatic indices across the temperate steppes of China from 1961 to 2013. J. Plant Ecol. 2019, 12, 485–497. [Google Scholar] [CrossRef]
- Lu, N.; Wilske, B.; Ni, J.; John, R.; Chen, J. Climate change in Inner Mongolia from 1955 to 2005—trends at regional, biome and local scales. Environ. Res. Lett. 2009, 4, 045006. [Google Scholar] [CrossRef] [Green Version]
- Guo, L.; Wu, S.; Zhao, D.; Yin, Y.; Leng, G.; Zhang, Q. NDVI-Based Vegetation Change in Inner Mongolia from 1982 to 2006 and Its Relationship to Climate at the Biome Scale. Adv. Meteorol. 2014, 2014, 692068. [Google Scholar] [CrossRef]
- You, Q.; Kang, S.; Aguilar, E.; Pepin, N.; Flügel, W.-A.; Yan, Y.; Xu, Y.; Zhang, Y.; Huang, J. Changes in daily climate extremes in China and their connection to the large scale atmospheric circulation during 1961–2003. Clim. Dyn. 2010, 36, 2399–2417. [Google Scholar] [CrossRef]
- John, R.; Chen, J.; Lu, N.; Wilske, B. Land cover/land use change in semi-arid Inner Mongolia: 1992–2004. Environ. Res. Lett. 2009, 4, 045010. [Google Scholar] [CrossRef]
- Zhang, H.; Fan, J.; Cao, W.; Harris, W.; Li, Y.; Chi, W.; Wang, S. Response of wind erosion dynamics to climate change and human activity in Inner Mongolia, China during 1990 to 2015. Sci. Total Environ. 2018, 639, 1038–1050. [Google Scholar] [CrossRef]
- Yang, F.; Zhou, G. Sensitivity of temperate desert steppe carbon exchange to seasonal droughts and precipitation variations in Inner Mongolia, China. PLoS ONE 2013, 8, e55418. [Google Scholar] [CrossRef]
- Xu, Z.; Hou, Y.; Zhang, L.; Liu, T.; Zhou, G. Ecosystem responses to warming and watering in typical and desert steppes. Sci. Rep. 2016, 6, 34801. [Google Scholar] [CrossRef] [Green Version]
- Hou, Y.; Zhou, G.; Xu, Z.; Liu, T.; Zhang, X. Interactive effects of warming and increased precipitation on community structure and composition in an annual forb dominated desert steppe. PLoS ONE 2013, 8, e70114. [Google Scholar] [CrossRef] [Green Version]
- Karl, T.R.; Kukla, G.; Razuvayev, V.N.; Changery, M.J.; Quayle, R.G.; Heim, R.R.; Easterling, D.R.; Fu, C.B. Global warming: Evidence for asymmetric diurnal temperature change. Geophys. Res. Lett. 1991, 18, 2253–2256. [Google Scholar] [CrossRef]
- Han, F.; Kang, S.; Buyantuev, A.; Zhang, Q.; Niu, J.; Yu, D.; Ding, Y.; Liu, P.; Ma, W. Effects of climate change on primary production in the Inner Mongolia Plateau, China. Int. J. Remote Sens. 2016, 37, 5551–5564. [Google Scholar] [CrossRef]
- Wenli, Y.; Qiong, H. Wulanbateer. Impacts of climate change over last 50 years on net primary productivity in typical steppe of Inner Mongolia. Chin. J. Agrometeorol. 2008, 29, 294–297. [Google Scholar]
- Wang, Y.; Duan, L.; Liu, T.; Luo, Y.; Li, D.; Tong, X.; Li, W.; Lei, H.; Singh, V.P. Evaluation of non-stationarity in summer precipitation and the response of vegetation over the typical steppe in Inner Mongolia. Clim. Dyn. 2021, 1–21. [Google Scholar] [CrossRef]
- Lin, Y.; Xin, X.; Zhang, H.; Wang, X. The implications of serial correlation and time-lag effects for the impact study of climate change on vegetation dynamics—A case study with Hulunber meadow steppe, Inner Mongolia. Int. J. Remote Sens. 2015, 36, 5031–5044. [Google Scholar] [CrossRef]


| ID | Indicator Name | Definition | Unit | |
|---|---|---|---|---|
| Precipitation | CDD | Consecutive dry days. | Maximum length of dry spell, maximum number of consecutive days with RR < 1 mm: let be the daily precipitation amount on day i in period j. Count the largest number of consecutive days where < 1 mm. | Days |
| CWD | Consecutive wet days. | Maximum length of wet spell, maximum number of consecutive days with RR ≥ 1 mm: let be the daily precipitation amount on day i in period j. Count the largest number of consecutive days where ≥ 1 mm. | Days | |
| R10 | Number of heavy precipitation days. | Annual count of days when PRCP ≥ 10 mm: let be the daily precipitation amount on day i in period j. Count the number of days where ≥ 10 mm. | Days | |
| R20 | Number of very heavy precipitation days. | Annual count of days when PRCP ≥ 20 mm: let be the daily precipitation amount on day i in period j. Count the number of days where ≥ 20 mm. | Days | |
| R95P | Very wet days. | Annual total PRCP when RR > 95th percentile. | mm | |
| RX5 | Max 5-day precipitation amount. | Monthly maximum consecutive 5-day precipitation. | mm | |
| SDII | Simple daily intensity index. | Annual total precipitation divided by the number of wet days (defined as PRCP ≥ 1.0 mm) in the year. | mm/day | |
| Tempe-rature | GSL | Growing season length. | The number of days between the beginning of the day on which the average daily mean temperature was >5 ℃ and the day on which the average daily mean temperature was <5 °C for at least 6 days. | Days |
| SU25 | Summer days. | Annual count when TX (daily maximum) > 25 °C. | Days | |
| TN10P | Cool nights. | Percentage of days when TN < 10th percentile. | Days | |
| TX10P | Cool days. | Percentage of days when TX < 10th percentile. | Days | |
| TX90P | Warm days. | Percentage of days when TX > 90th percentile. | Days |
| Model | Unstandardized Coefficients | Standardized Coefficiens | t | Sig. | Collinearity Statistics | ||
|---|---|---|---|---|---|---|---|
| B | Std. Error | Tolerance | VIF | ||||
| Adjusted R2:0.109 | |||||||
| (Constant) | −2.331 × 10⁻⁵ | 0.000 | −0.114 | 0.909 | |||
| Slope R10 | 0.022 | 0.002 | 0.176 | 10.203 | 0.000 *** | 0.877 | 1.140 |
| Slope R95P | 0.000 | 0.000 | 0.203 | 10.839 | 0.000 *** | 0.742 | 1.348 |
| Slope CWD | 0.011 | 0.003 | 0.083 | 3.476 | 0.001 *** | 0.458 | 2.182 |
| Slope CDD | 0.001 | 0.000 | 0.178 | 7.752 | 0.000 *** | 0.494 | 2.025 |
| Slope GSL_ | 0.004 | 0.001 | 0.193 | 6.169 | 0.000 *** | 0.265 | 3.771 |
| Model | Unstandardized Coefficients | Standardized Coefficiens | t | Sig. | Collinearity Statistics | ||
|---|---|---|---|---|---|---|---|
| B | Std. Error | Tolerance | VIF | ||||
| Adjusted R2: 0.229 | |||||||
| (Constant) | 0.000 | 0.000 | 2.293 | 0.022 | |||
| Slope CDD | 0.000 | 0.000 | 0.085 | 7.965 | 0.000 *** | 0.512 | 1.954 |
| Slope CWD | −0.006 | 0.002 | −0.053 | −3.571 | 0.000 *** | 0.259 | 3.856 |
| Slope GSL | 0.003 | 0.000 | 0.150 | 11.809 | 0.000 *** | 0.359 | 2.785 |
| Slope R10 | 0.017 | 0.001 | 0.337 | 16.515 | 0.000 *** | 0.139 | 7.189 |
| Slope R95P | 0.000 | 0.000 | −0.067 | −3.820 | 0.000 *** | 0.186 | 5.366 |
| Slope RX5 | 0.000 | 0.000 | 0.053 | 2.737 | 0.006 ** | 0.152 | 6.577 |
| Slope SU25 | −0.003 | 0.001 | −0.090 | −4.727 | 0.000 *** | 0.161 | 6.220 |
| Slope TN10P | 0.007 | 0.000 | 0.245 | 15.129 | 0.000 *** | 0.221 | 4.525 |
| Slope TX10P | −0.007 | 0.001 | −0.225 | −12.599 | 0.000 *** | 0.183 | 5.478 |
| Slope TX90P | −0.001 | 0.001 | −0.030 | −1.702 | 0.089 * | 0.189 | 5.278 |
| Model | Unstandardized Coefficients | Standardized Coefficiens | t | Sig. | Collinearity Statistics | ||
|---|---|---|---|---|---|---|---|
| B | Std. Error | Tolerance | VIF | ||||
| Adjusted R2:0.413 | |||||||
| (Constant) | 0.000 | 0.000 | 4.564 | 0.000 *** | |||
| Slope R20 | 0.009 | 0.003 | 0.089 | 3.222 | 0.001 *** | 0.160 | 6.244 |
| Slope R95P | 0.000 | 0.000 | −0.183 | −10.884 | 0.000 *** | 0.433 | 2.311 |
| Slope RX5 | 0.001 | 0.000 | 0.167 | 9.163 | 0.000 *** | 0.370 | 2.705 |
| Slope SDII | 0.032 | 0.005 | 0.189 | 6.710 | 0.000 *** | 0.155 | 6.435 |
| Slope SU25 | −0.004 | 0.000 | −0.167 | −11.247 | 0.000 *** | 0.558 | 1.793 |
| Slope TX90P | −0.008 | 0.001 | −0.236 | −13.946 | 0.000 *** | 0.428 | 2.336 |
Publisher’s Note: MDPI stays neutral with regard to jurisdictional claims in published maps and institutional affiliations. |
© 2022 by the authors. Licensee MDPI, Basel, Switzerland. This article is an open access article distributed under the terms and conditions of the Creative Commons Attribution (CC BY) license (https://creativecommons.org/licenses/by/4.0/).
Share and Cite
Chen, K.; Ge, G.; Bao, G.; Bai, L.; Tong, S.; Bao, Y.; Chao, L. Impact of Extreme Climate on the NDVI of Different Steppe Areas in Inner Mongolia, China. Remote Sens. 2022, 14, 1530. https://doi.org/10.3390/rs14071530
Chen K, Ge G, Bao G, Bai L, Tong S, Bao Y, Chao L. Impact of Extreme Climate on the NDVI of Different Steppe Areas in Inner Mongolia, China. Remote Sensing. 2022; 14(7):1530. https://doi.org/10.3390/rs14071530
Chicago/Turabian StyleChen, Kuan, Genbatu Ge, Gang Bao, Liga Bai, Siqin Tong, Yuhai Bao, and Luomeng Chao. 2022. "Impact of Extreme Climate on the NDVI of Different Steppe Areas in Inner Mongolia, China" Remote Sensing 14, no. 7: 1530. https://doi.org/10.3390/rs14071530
APA StyleChen, K., Ge, G., Bao, G., Bai, L., Tong, S., Bao, Y., & Chao, L. (2022). Impact of Extreme Climate on the NDVI of Different Steppe Areas in Inner Mongolia, China. Remote Sensing, 14(7), 1530. https://doi.org/10.3390/rs14071530