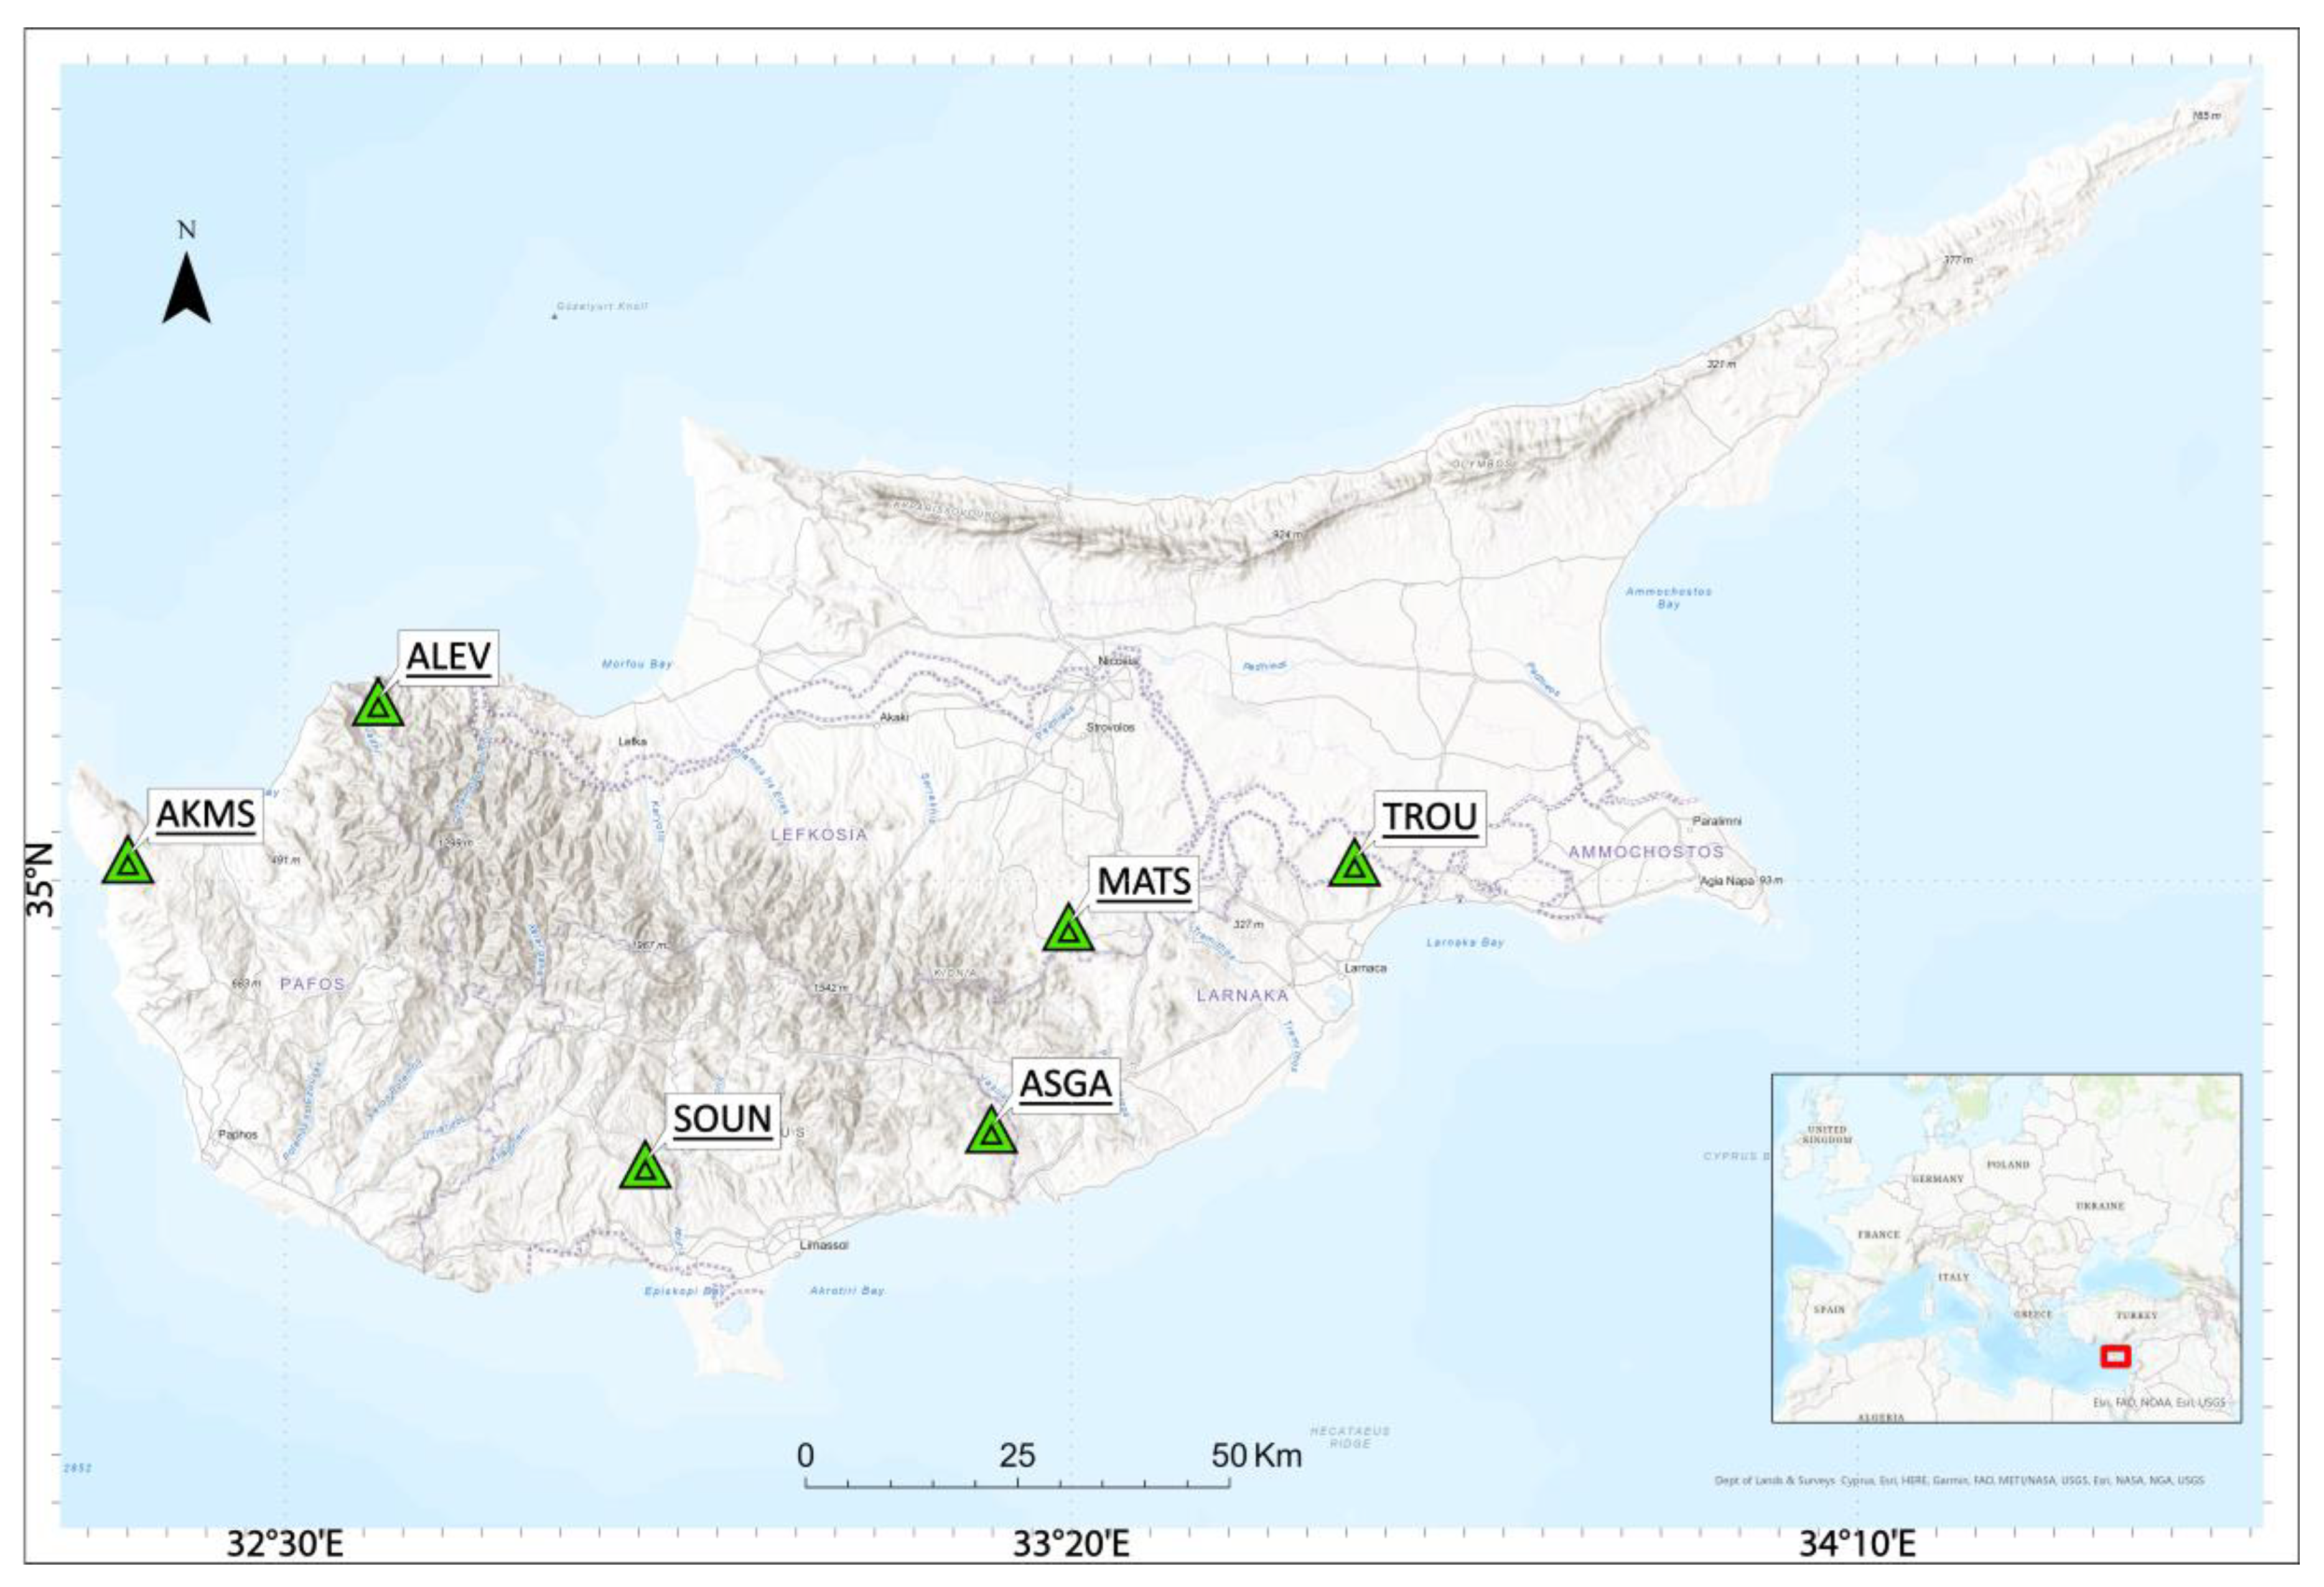
Figure 1.
Site Locations of the Permanent Segment. Green triangles indicate the reference stations.
Figure 1.
Site Locations of the Permanent Segment. Green triangles indicate the reference stations.
Figure 2.
The suitability analysis procedure for the determination of the CRs’ final location.
Figure 2.
The suitability analysis procedure for the determination of the CRs’ final location.
Figure 3.
(a) Multipath graph at ALEV site for 24 h data acquisition, with an elevation cut-off angle of 0 degrees; (b) Observation availability of the tracked signals transmitted from each satellite at different elevation angles.
Figure 3.
(a) Multipath graph at ALEV site for 24 h data acquisition, with an elevation cut-off angle of 0 degrees; (b) Observation availability of the tracked signals transmitted from each satellite at different elevation angles.
Figure 4.
(a) Geometry of a triangular CR. θ represents the azimuth angle and ψ the elevation angle; (b) Adjustment of a triangular trihedral CR. ψ represents the elevation angle, Φ the off-nadir angle, and α the CR tilt angle from the base plate.
Figure 4.
(a) Geometry of a triangular CR. θ represents the azimuth angle and ψ the elevation angle; (b) Adjustment of a triangular trihedral CR. ψ represents the elevation angle, Φ the off-nadir angle, and α the CR tilt angle from the base plate.
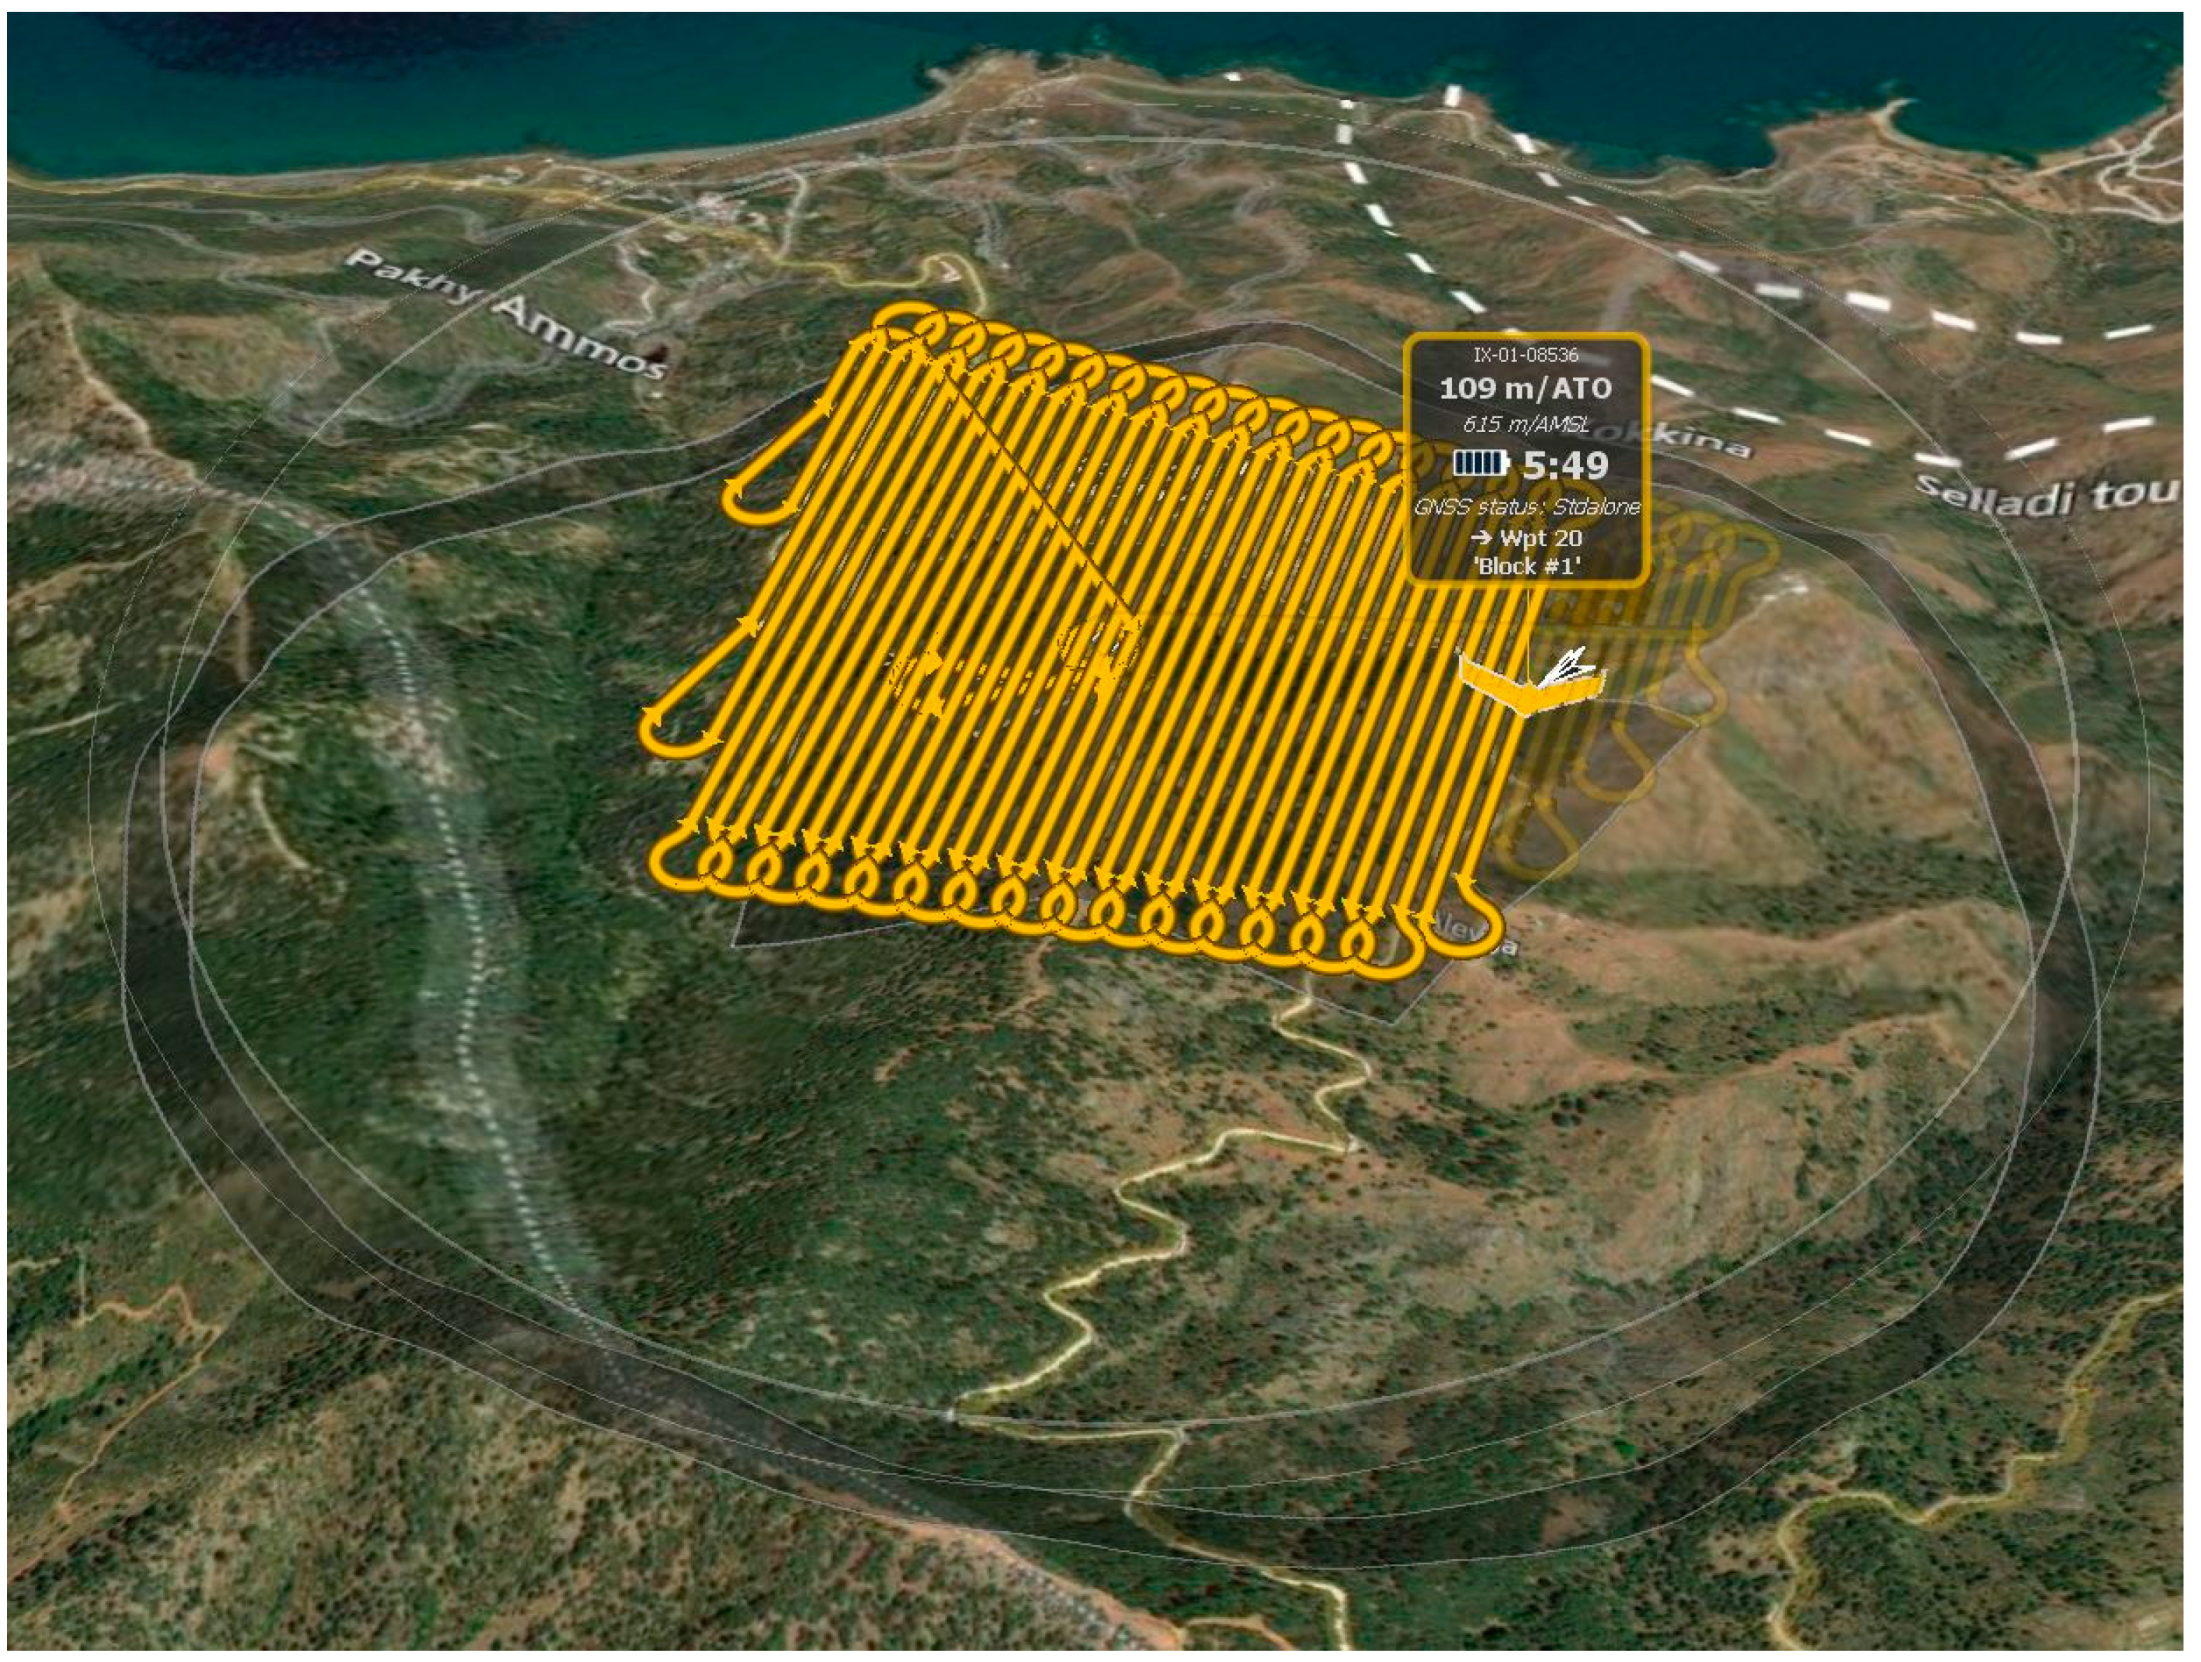
Figure 5.
Flight Planning using the eMotion Software.
Figure 5.
Flight Planning using the eMotion Software.
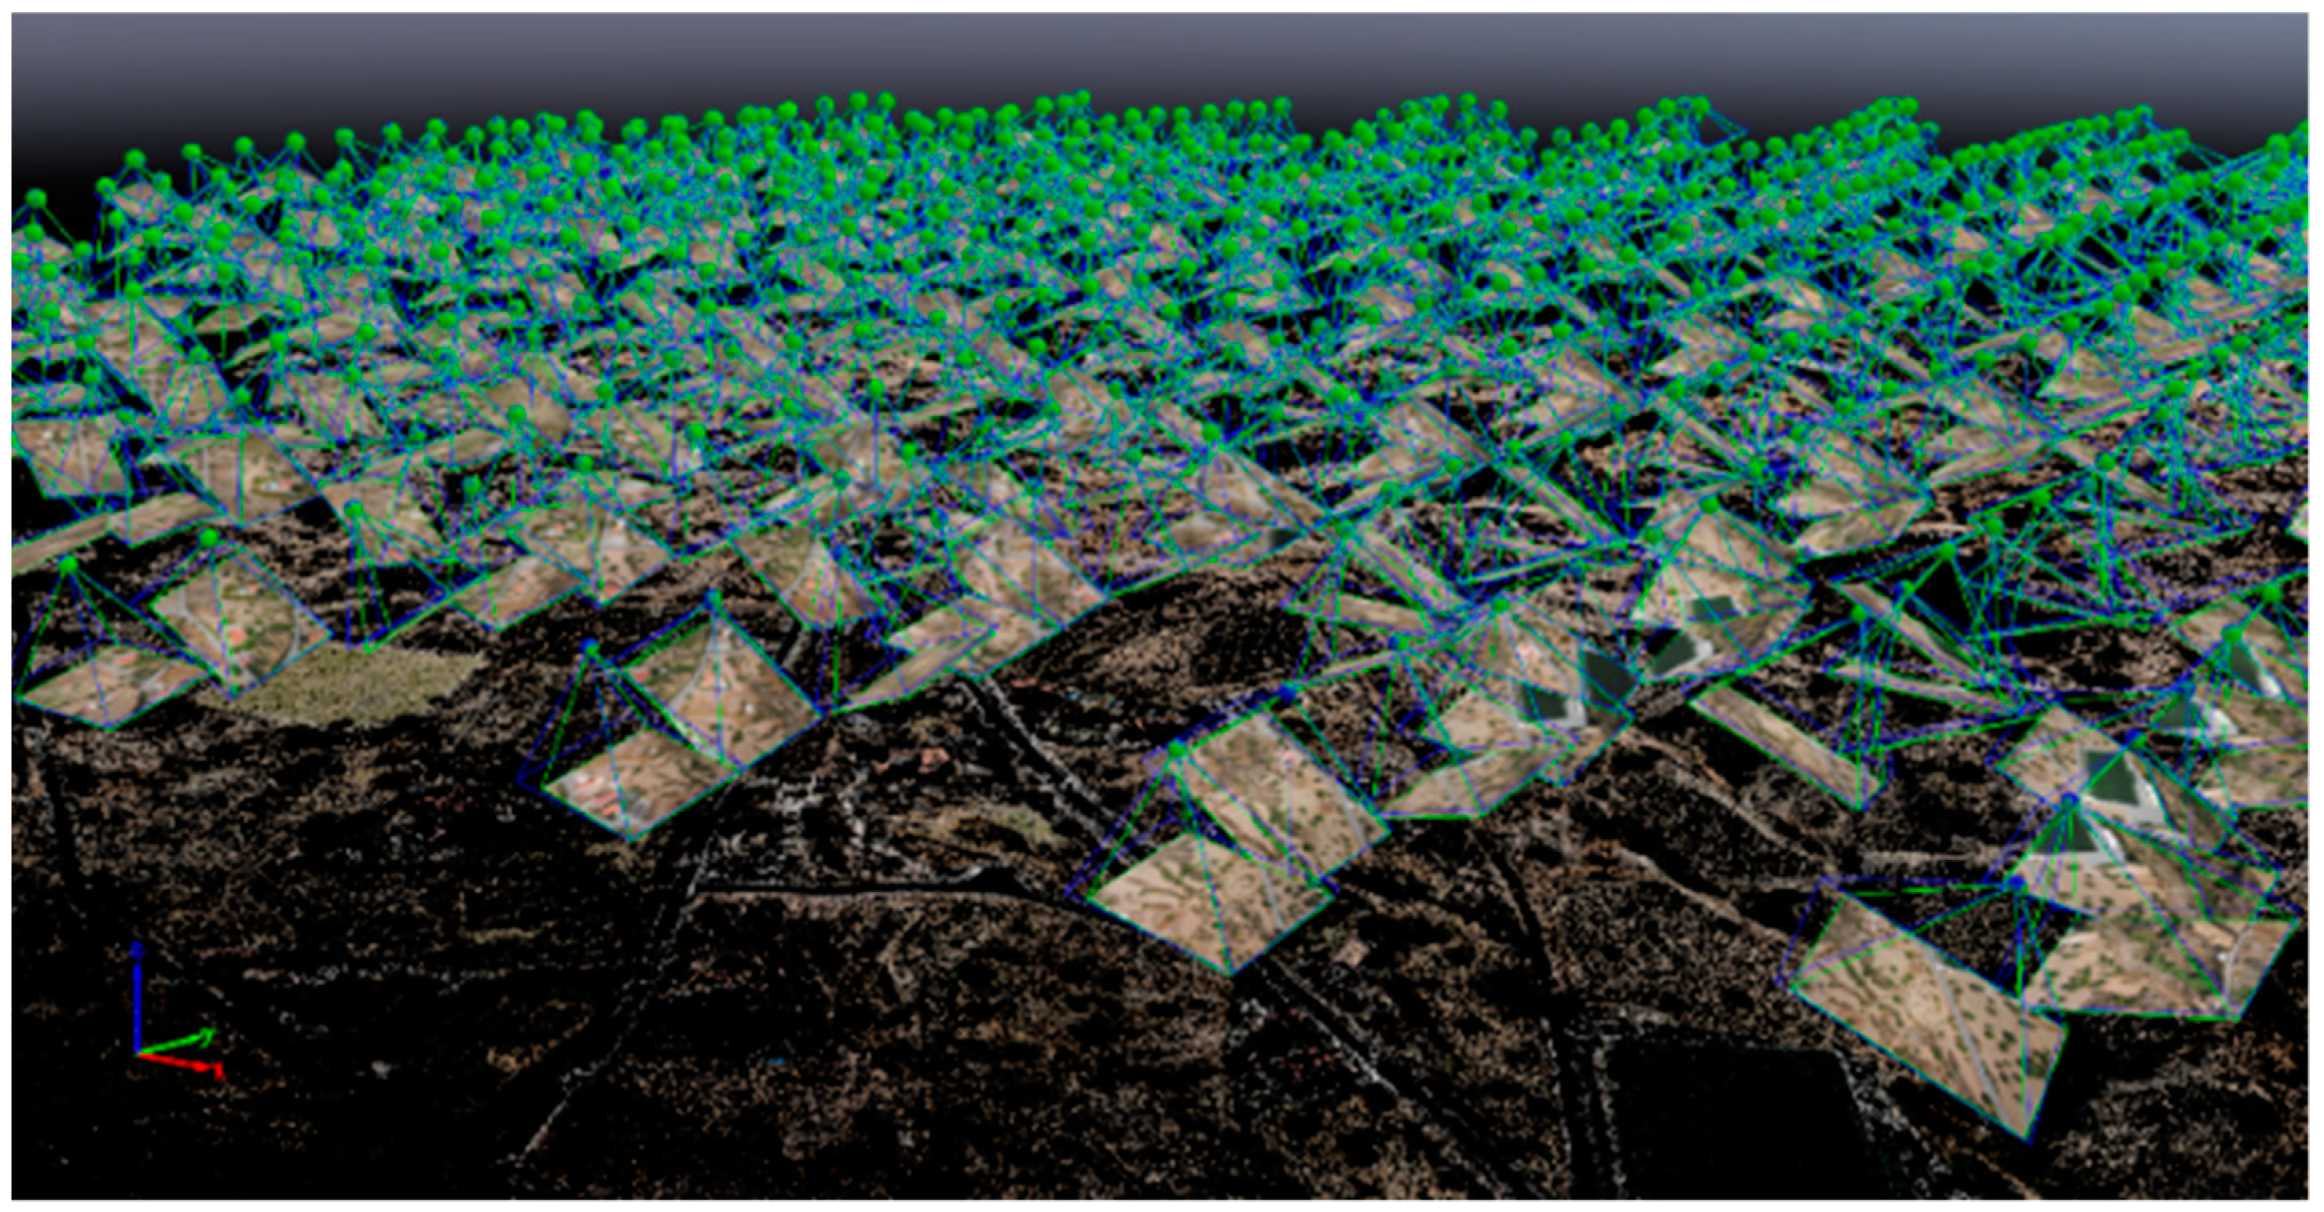
Figure 6.
The produced point cloud from the acquired images (one nadir and two obliques).
Figure 6.
The produced point cloud from the acquired images (one nadir and two obliques).
Figure 7.
Output slope raster (in degrees). White colour indicates terrain with ≤5, light brown ≤ 10, and dark brown ≤ 90 of steepness.
Figure 7.
Output slope raster (in degrees). White colour indicates terrain with ≤5, light brown ≤ 10, and dark brown ≤ 90 of steepness.
Figure 8.
Output aspect raster map. Each colour indicates the slope facing direction.
Figure 8.
Output aspect raster map. Each colour indicates the slope facing direction.
Figure 9.
Output land cover map. Each colour indicates the classified values.
Figure 9.
Output land cover map. Each colour indicates the classified values.
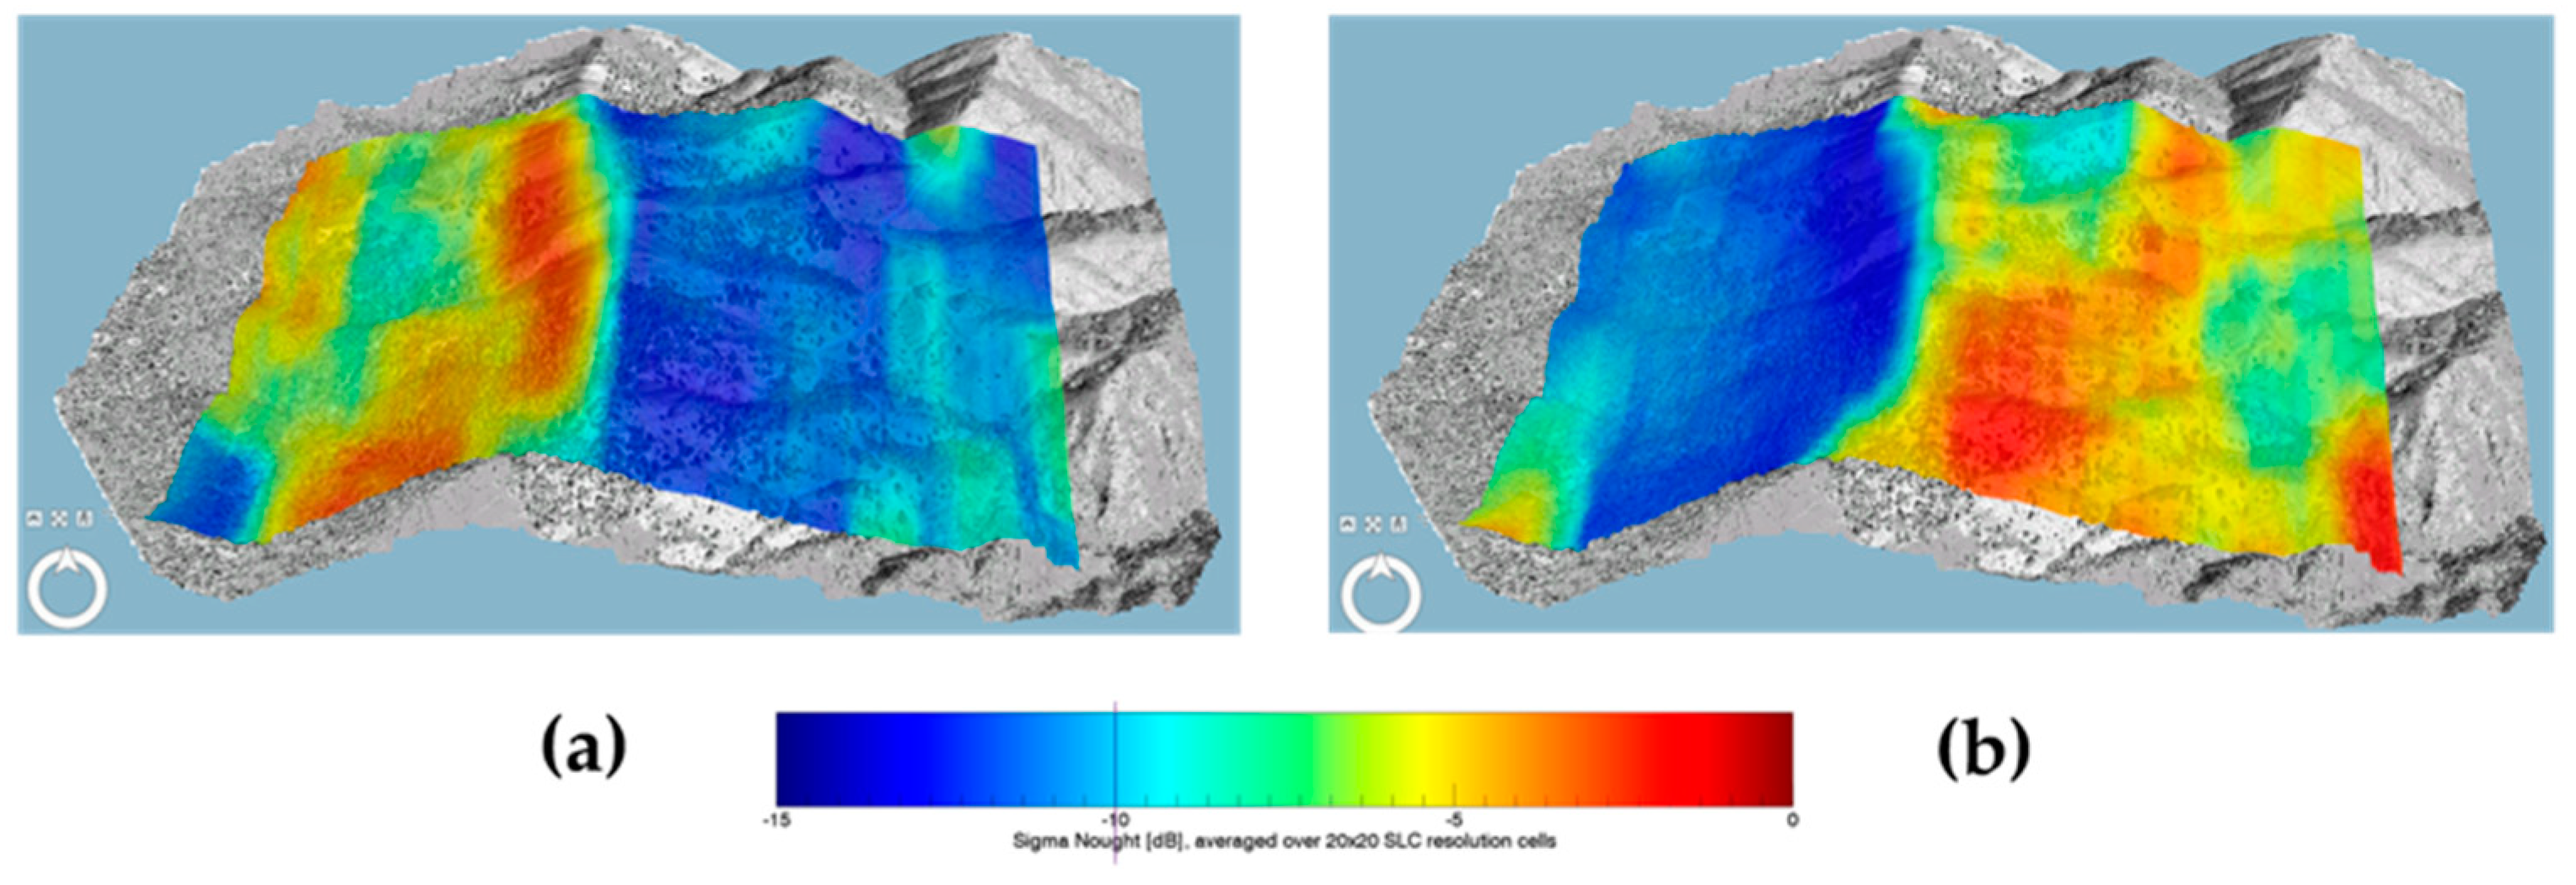
Figure 10.
The generated sigma 0 images. (a) The values acquired from the ascending pass; (b) The values acquired from the descending pass. The purple line designates the suitable sigma 0 value of a Sentinel 1-SLC product. Lower values are more favourable.
Figure 10.
The generated sigma 0 images. (a) The values acquired from the ascending pass; (b) The values acquired from the descending pass. The purple line designates the suitable sigma 0 value of a Sentinel 1-SLC product. Lower values are more favourable.
Figure 11.
Sigma 0 images overlayed on ALEV DSM. (a) The subset of the ascending pass; (b) The subset of the descending pass. The sigma 0 most favourable values are depicted from purple to blue colour.
Figure 11.
Sigma 0 images overlayed on ALEV DSM. (a) The subset of the ascending pass; (b) The subset of the descending pass. The sigma 0 most favourable values are depicted from purple to blue colour.
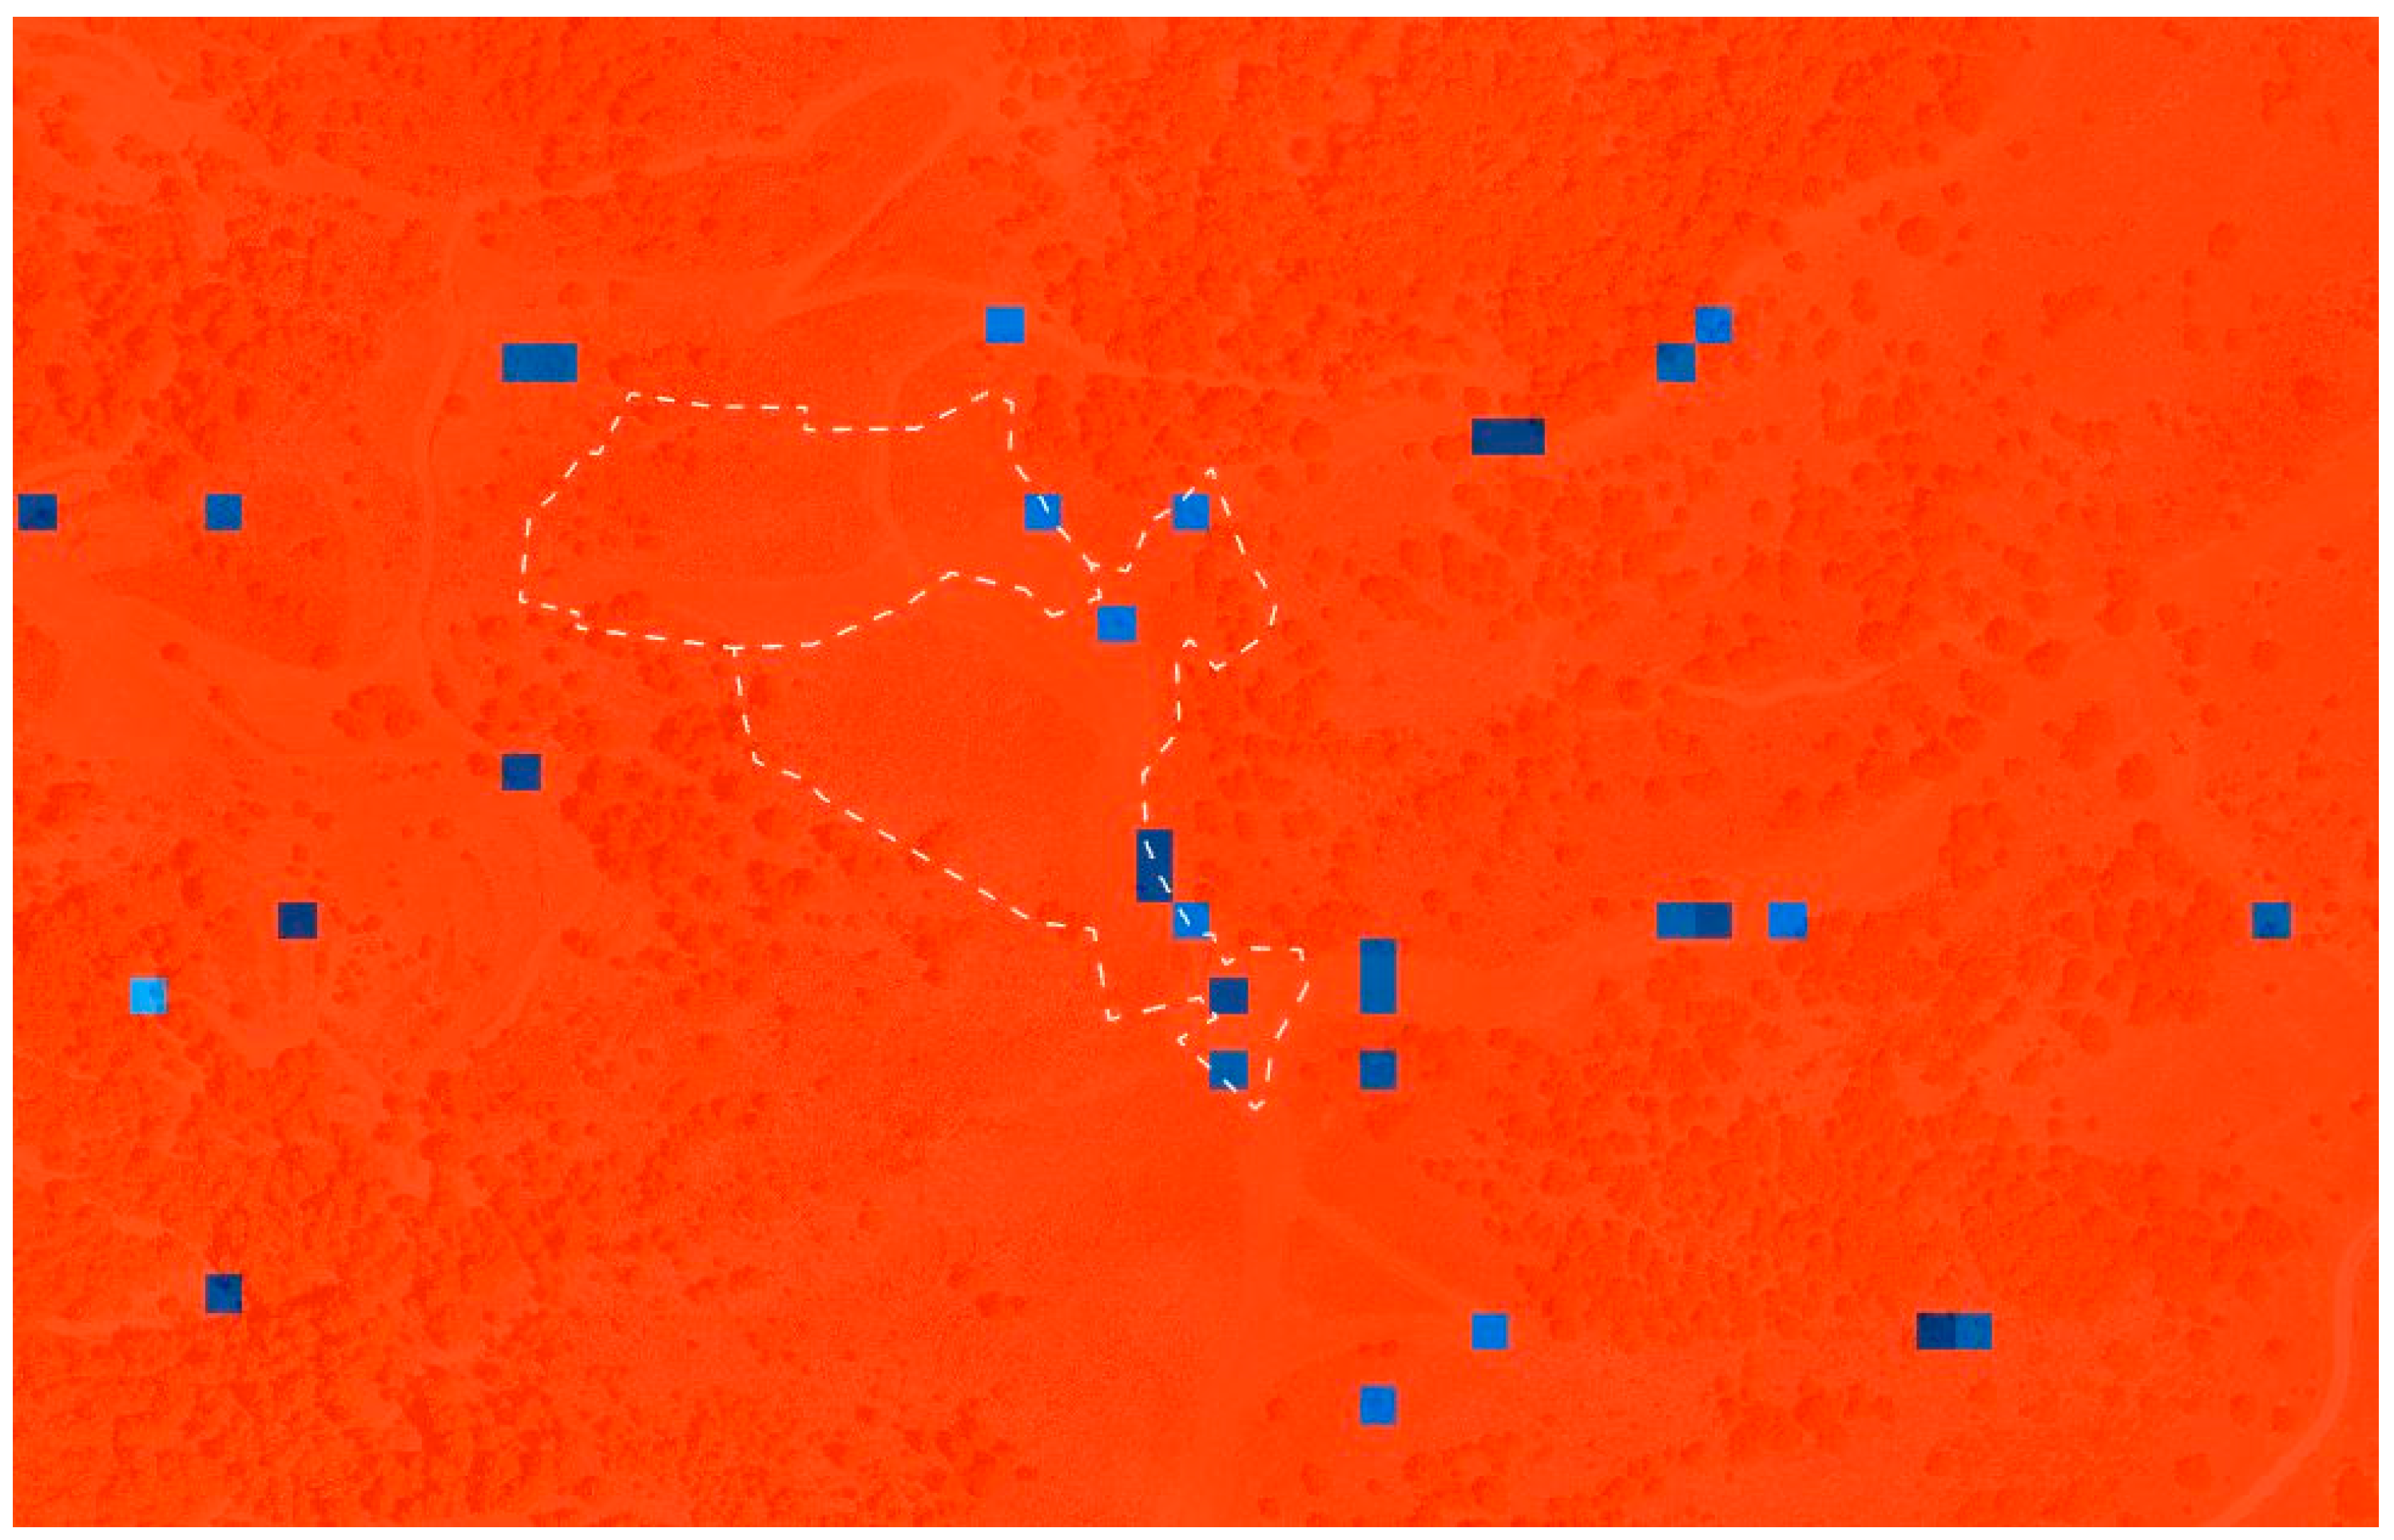
Figure 12.
The weighted raster layer illustrates the candidate locations for the monumentation of CR for the ascending pass. The restricted areas are red in colour, and colour ranging from light blue to darker blue indicates suitable locations from the least to the most favourable, respectively. The white dashed polygons determine the boundaries of the AOI.
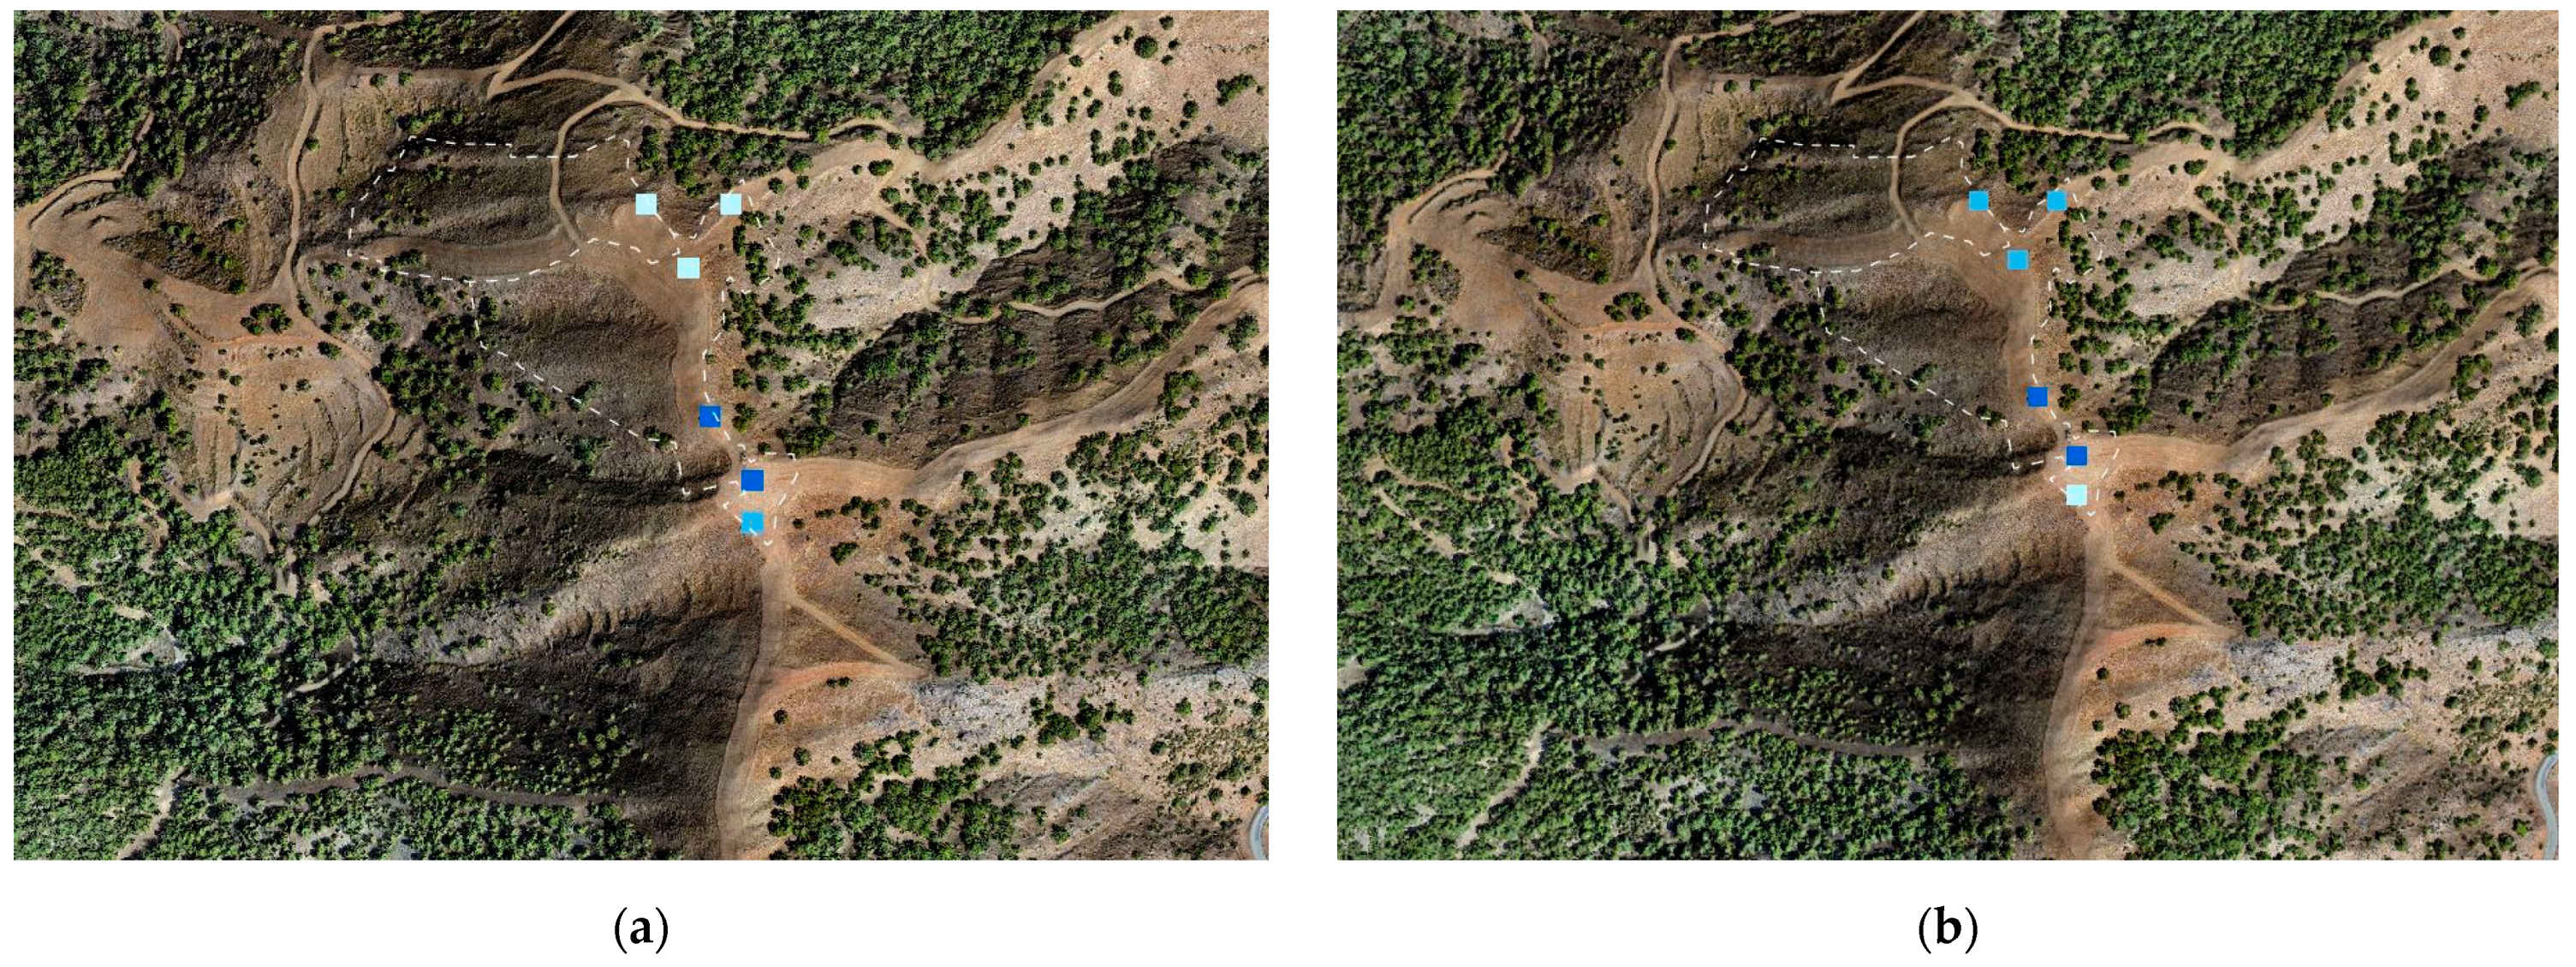
Figure 13.
The candidate locations inside the AOI boundaries. (a) CR candidate sites for the ascending pass; (b) CR candidate sites for the descending direction.
Figure 13.
The candidate locations inside the AOI boundaries. (a) CR candidate sites for the ascending pass; (b) CR candidate sites for the descending direction.
Figure 14.
The elevation profile of the two CRs in ALEV location. The distance between them is 230 m. CR1 is referred to the site of the ascending pass and CR2 to the descending.
Figure 14.
The elevation profile of the two CRs in ALEV location. The distance between them is 230 m. CR1 is referred to the site of the ascending pass and CR2 to the descending.
Figure 15.
Viewshed perspective of the candidate sites with sigma 0 values overlayed on the terrain. Red lines demonstrate the open face orientation angle of 45°. The lower red line illustrates the baseplate line of sight when CR is tilted at a specific angle. The upper red line points at the line of sight at an elevation angle of 35.26°. (a) viewshed perspective of the CR for the ascending pass; (b) 3D viewshed of the CR for the descending direction.
Figure 16.
The View Dome visibility analysis of the GNSS antenna illustrates its visible volumetric spaces in 3D. The height of the antenna was determined at 2 m, and the horizontal orange line indicates the elevation cut off angle of 0 degrees. Thus, all obstructions above that line prevent the signal from being received directly at a certain elevation angle.
Figure 17.
The elevation profile between the GNSS antenna and the CR for the ascending pass. The distance between them is over 200 m.
Figure 17.
The elevation profile between the GNSS antenna and the CR for the ascending pass. The distance between them is over 200 m.
Figure 18.
The elevation profile between the GNSS antenna and the CR for the descending pass. The distance between them is 45 m, greater than the constraint of 30 m.
Figure 18.
The elevation profile between the GNSS antenna and the CR for the descending pass. The distance between them is 45 m, greater than the constraint of 30 m.
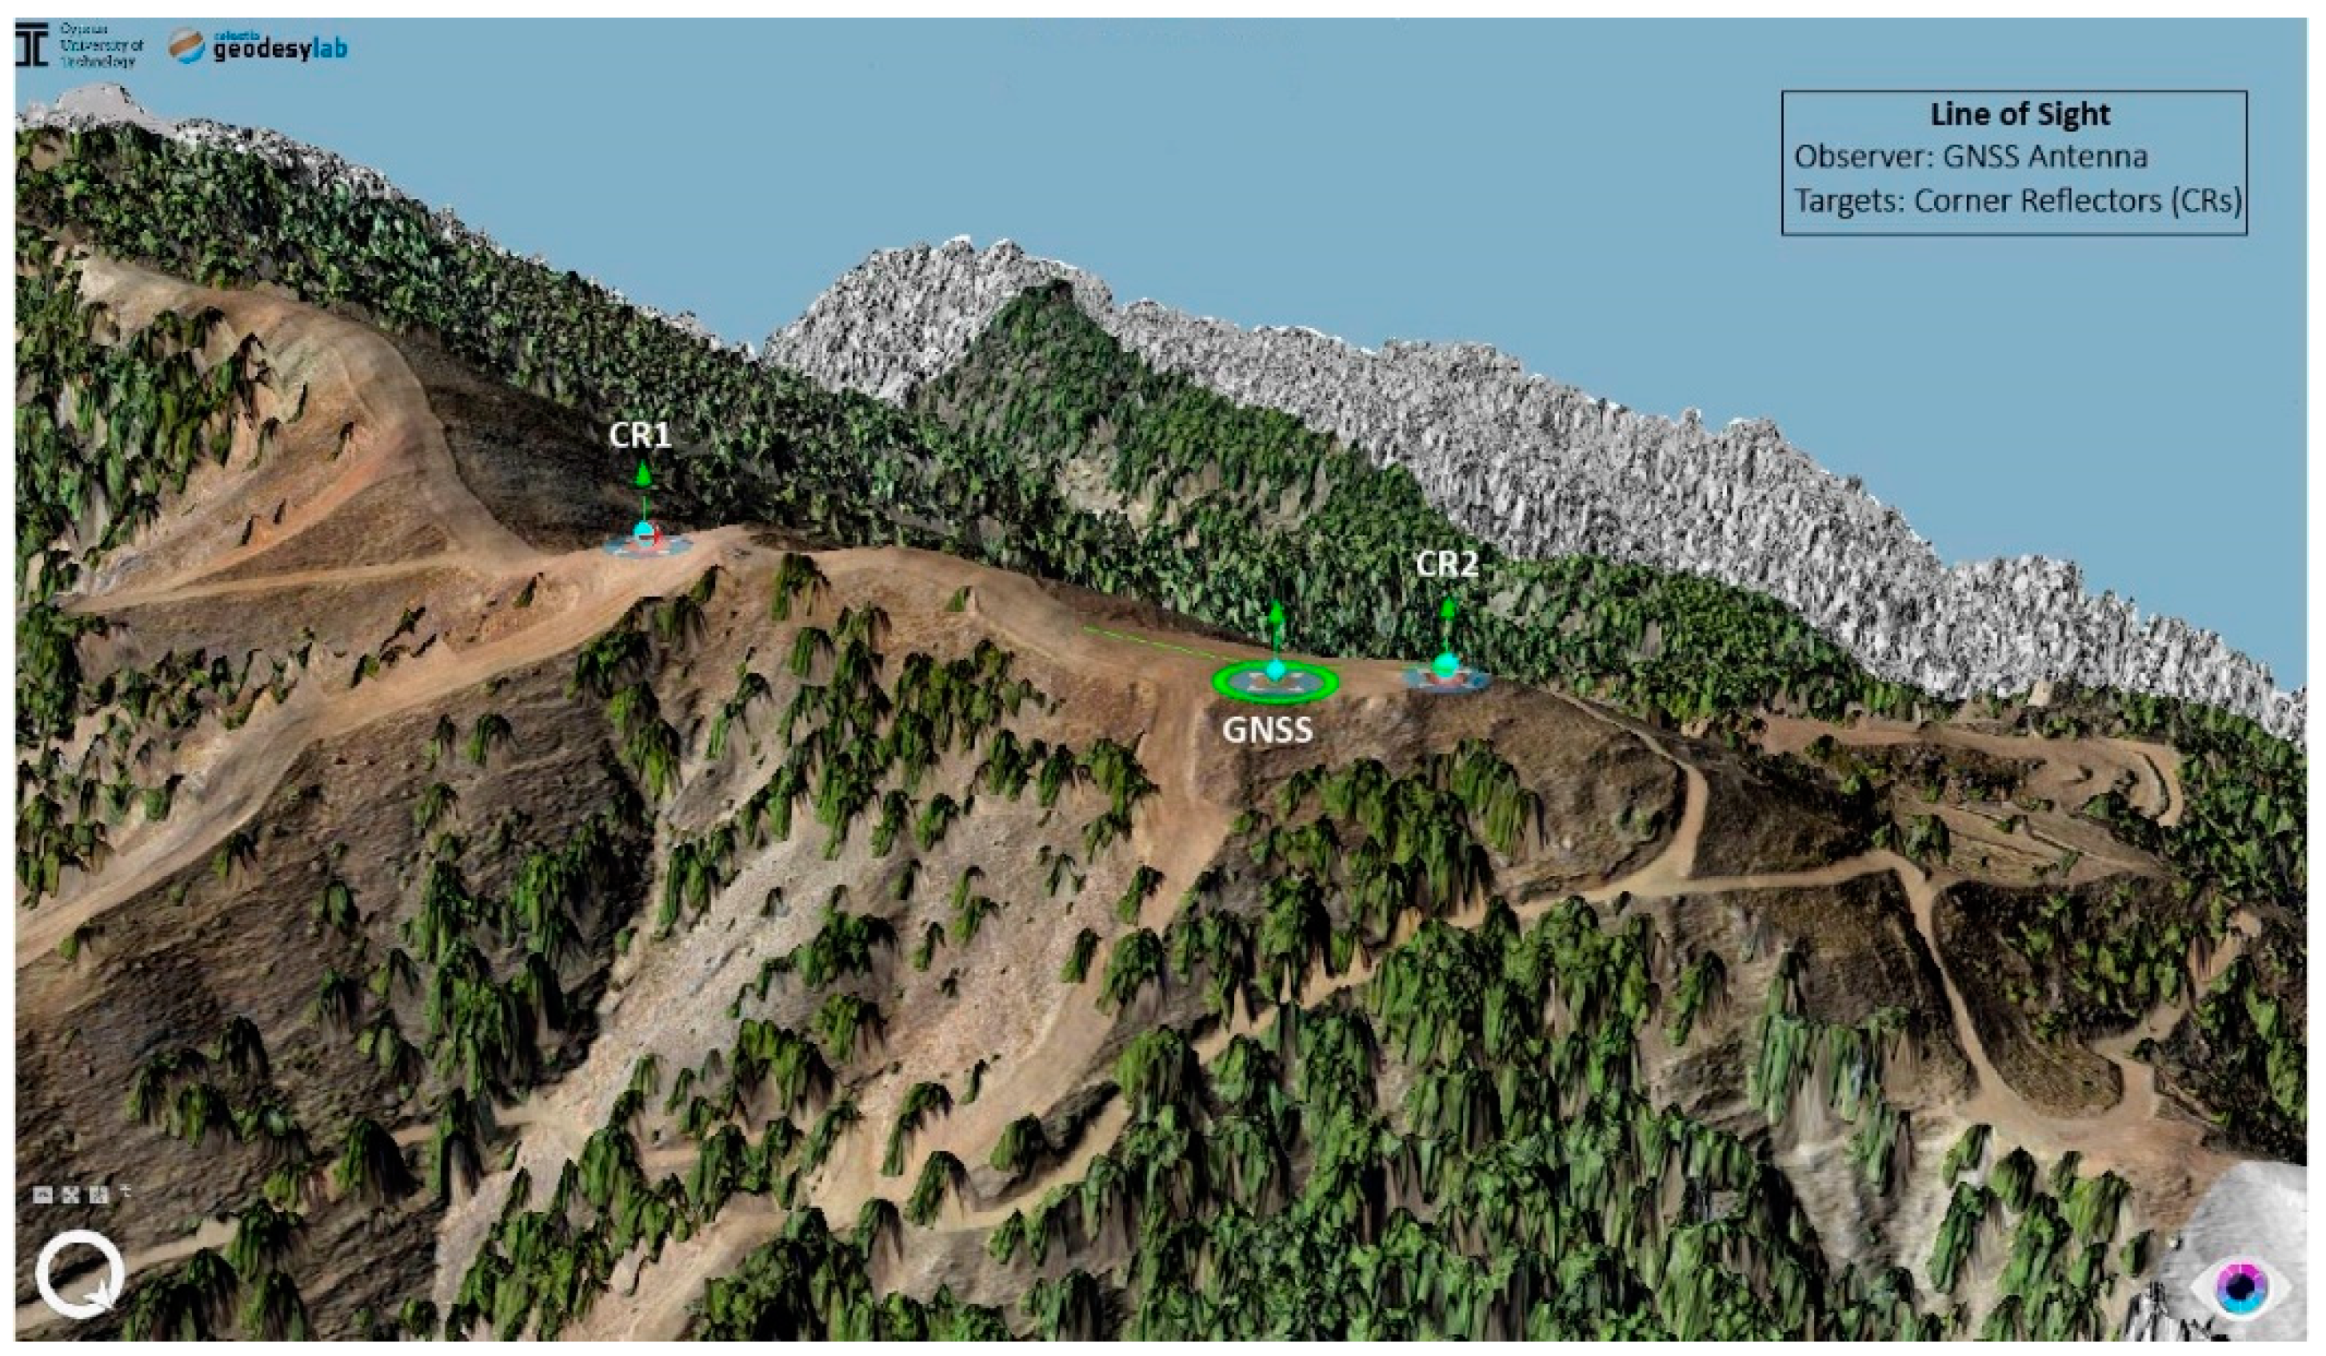
Figure 19.
The Line of Sight between GNSS antenna and the two CRs.
Figure 19.
The Line of Sight between GNSS antenna and the two CRs.
Figure 20.
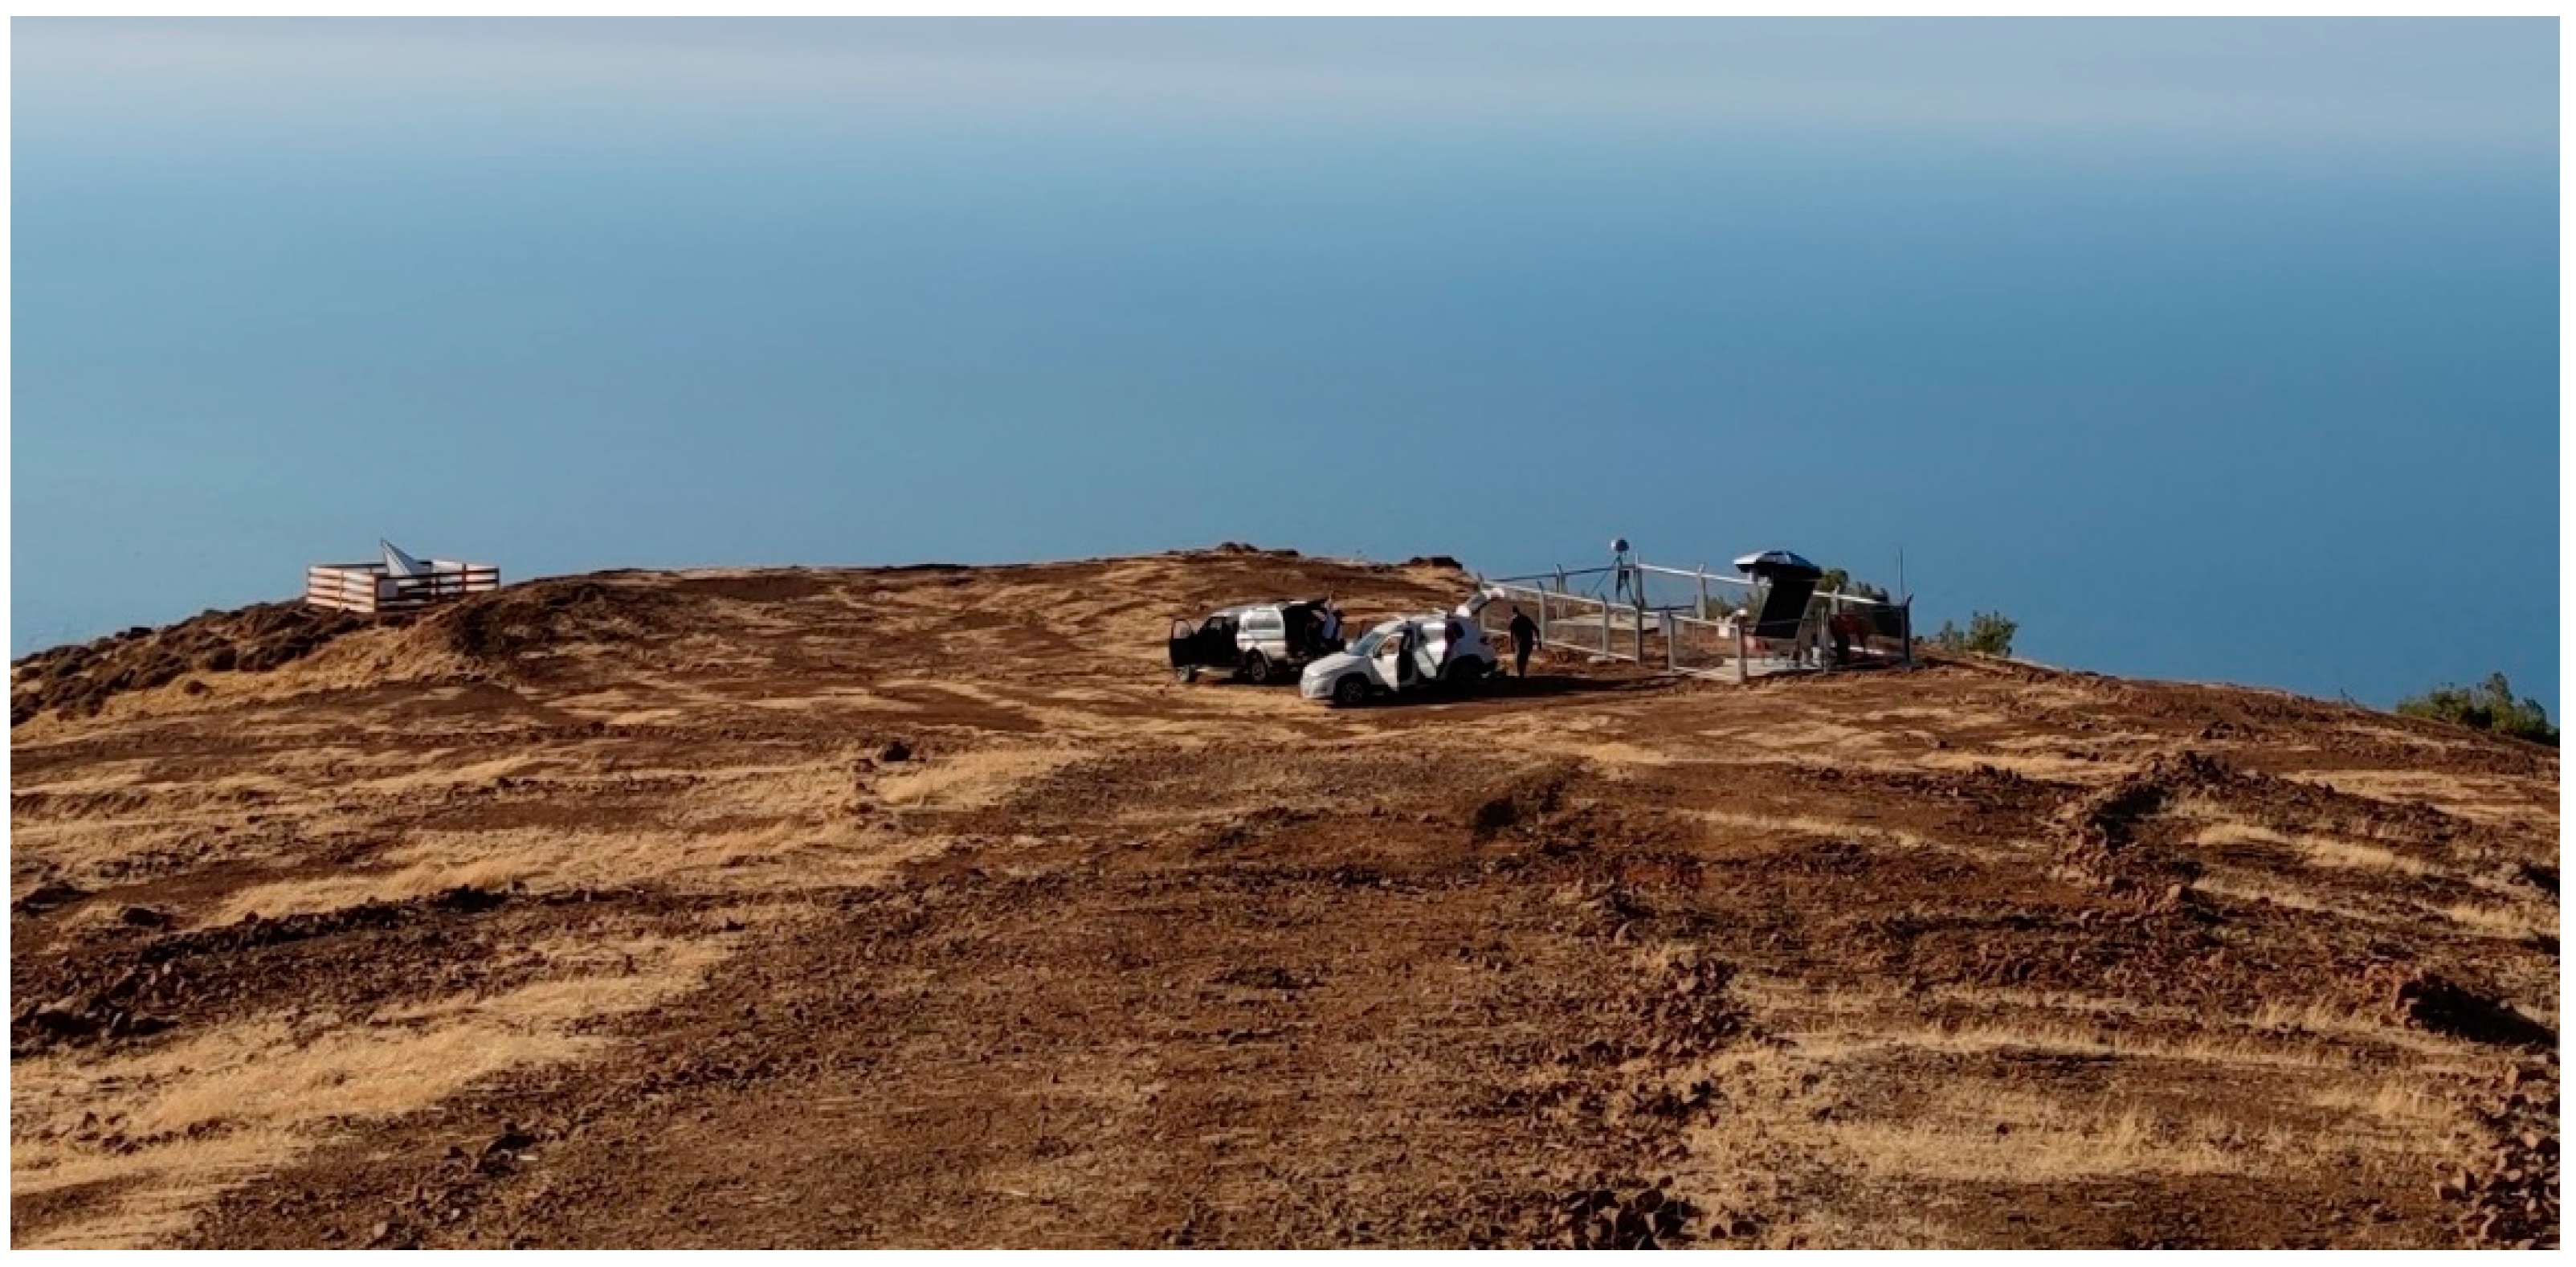
The ALEV site’s GNSS and CR (for the descending pass) collocation.
Figure 20.
The ALEV site’s GNSS and CR (for the descending pass) collocation.
Figure 21.
The sigma 0 of the CR for the descending pass in the SOUN site. The RCS was calculated at 36.79 dBm2. (a) The backscatter coefficient before the CR installation and (b) after the CR installation.
Figure 21.
The sigma 0 of the CR for the descending pass in the SOUN site. The RCS was calculated at 36.79 dBm2. (a) The backscatter coefficient before the CR installation and (b) after the CR installation.
Figure 22.
Satellite availability in ALEV GNSS permanent station. (a) The skyplot of the GNSS constellation; (b) The number of satellites tracked and used by the GNSS receiver.
Figure 22.
Satellite availability in ALEV GNSS permanent station. (a) The skyplot of the GNSS constellation; (b) The number of satellites tracked and used by the GNSS receiver.
Figure 23.
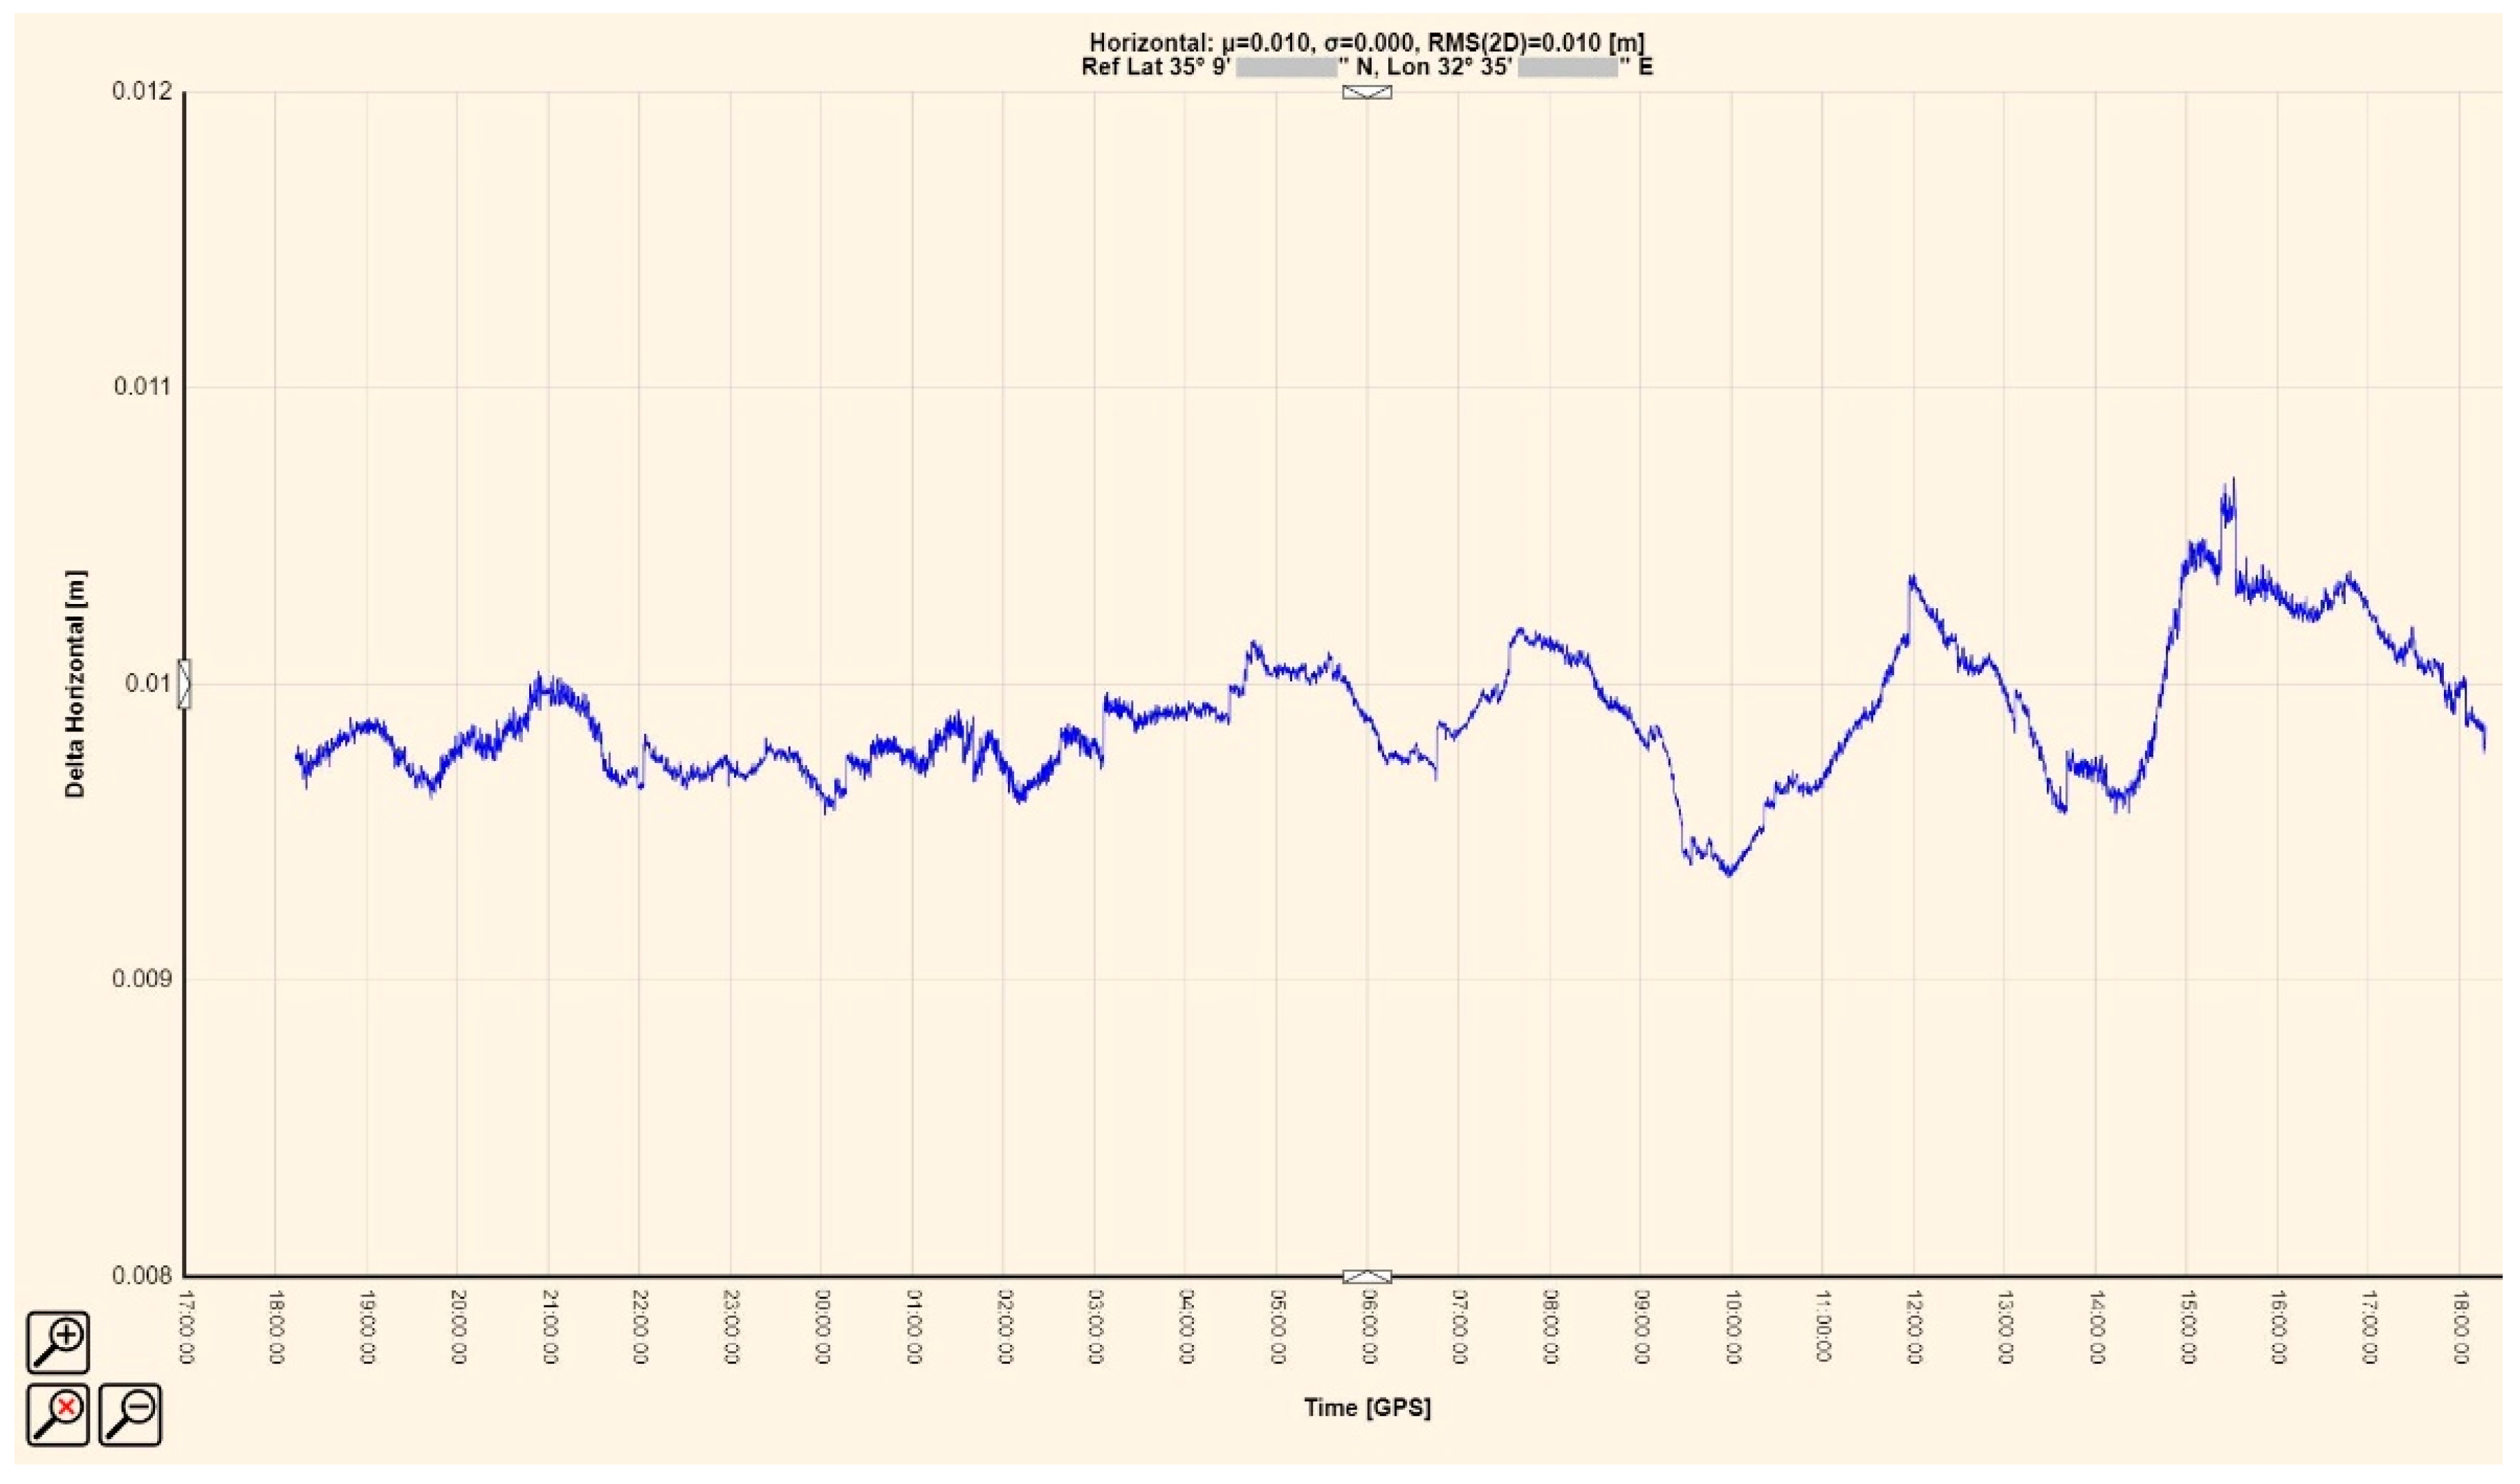
The horizontal stability of the ALEV GNSS monument in 24 h observations.
Figure 23.
The horizontal stability of the ALEV GNSS monument in 24 h observations.
Table 1.
The requirements used for the suitability analysis.
Table 1.
The requirements used for the suitability analysis.
| Criteria (Factors) | Favourable Values |
|---|
Backscatter coefficient
(sigma 0) | ≤−10 dB (at C-band) |
| Land Cover | Stable solid surface, no dense vegetation, and trees, no metallic structures |
| Slope | <10° |
| Land Ownership | Government control area |
| Geological Formation | No marls, clays, sand, silts, or gravel |
| Ground Surface Aspect | Flat, or Oriented toward the direction of the satellite pass |
| Distance between CRs and CORS | Distance between GNSS antenna and CRs > 30 m with no inter-visibility.
Distance between the 2 CR sites > 200 m |
| Incidence Angle | The radar signal’s average incidence angle with the target |
Table 2.
The generated values from the aspect raster map and the way they are visualized in
Figure 8.
Table 2.
The generated values from the aspect raster map and the way they are visualized in
Figure 8.
| Aspect Direction | Values (Degrees) | Colour |
|---|
| Flat | −1 1 | |
| North | 0–22.5 | |
| Northeast | 22.8–67.5 | |
| East | 67.5–112.5 | |
| Southeast | 112.5–157.5 | |
| South | 157.5–202.5 | |
| Southwest | 202.5–247.5 | |
| West | 247.5–292.5 | |
| Northwest | 292.5–337.5 | |
| North | 337.5–360 | |
Table 3.
The classified values of the land cover map.
Table 3.
The classified values of the land cover map.
| Class Name | Colour |
|---|
| Tree | |
| Bush | |
| Soil | |
| Exposed rock | |
| Road hard surface | |
Table 4.
Reclassification of raster layers for the suitability analysis of CRs’ sites selection for the ascending and descending orbit directions.
Table 4.
Reclassification of raster layers for the suitability analysis of CRs’ sites selection for the ascending and descending orbit directions.
| Criteria | Input Values | Output Values (Ascending) | Output Values (Descending) |
|---|
Slope
(degrees) | 0 to 5 | 1 | 1 |
| 5 to 10 | 2 | 2 |
| 10 to 90 | 3 | 3 |
Aspect
(degrees) | North (0–22.5) | 1 | 1 |
| Northeast (22.5–67.5) | 1 | 2 |
| East (67.5–112.5) | 1 | 3 |
| Southeast (112.5–157.5) | 1 | 2 |
| South (157.5–202.5) | 1 | 1 |
| Southwest (202.5–247.5) | 2 | 1 |
| West (247.5–292.5) | 3 | 1 |
| Northwest (292.5–337.5) | 2 | 1 |
| Flat (−1) | 3 | 3 |
| Land Cover | Tree | 1 | 1 |
| Bush | 2 | 2 |
| Soil | 3 | 3 |
| Rock | 2 | 2 |
| Hard Surface Road | 1 | 1 |
Sigma 0
(dB) | −23.38 to −10 | 1 | 1 |
| −10 to 0 | 2 | 2 |
| 0 to 5.84 | 3 | 3 |
Table 5.
AHP intensity scale of importance [
46].
Table 5.
AHP intensity scale of importance [
46].
| Intensity of Importance | Definition |
|---|
| 1 | Equal importance |
| 3 | Moderate importance |
| 5 | Essential or strong importance |
| 7 | Demonstrated importance |
| 9 | Absolute importance of one over another |
| 2, 4, 6, 8 | Intermediate values between the two adjacent judgments |
Table 6.
Pairwise comparison matrix for the criteria weights with respect to the goal.
Table 6.
Pairwise comparison matrix for the criteria weights with respect to the goal.
| | Slope | Aspect | Land Cover | Sigma 0 | Weight |
|---|
| Slope | 1 | 2 | 0.5 | 0.2 | 0.13 |
| Aspect | 0.5 | 1 | 0.33 | 0.2 | 0.09 |
| Land Cover | 2 | 3 | 1 | 0.5 | 0.26 |
| Sigma 0 | 5 | 5 | 2 | 1 | 0.52 |
Table 7.
Weights of the reclassified values with respect to the Slope criterion.
Table 7.
Weights of the reclassified values with respect to the Slope criterion.
| Slope | 1 | 2 | 3 | Weight |
|---|
| 1 | 1 | 2 | 9 | 0.58 |
| 2 | 0.5 | 1 | 9 | 0.37 |
| 3 | 0.11 | 0.11 | 1 | 0.05 |
Table 8.
Weights of the reclassified values with respect to the Aspect criterion for the ascending and descending direction, respectively.
Table 8.
Weights of the reclassified values with respect to the Aspect criterion for the ascending and descending direction, respectively.
| Aspect | 1 | 2 | 3 | Weight |
|---|
| 1 | 1 | 0.14 | 0.11 | 0.06 |
| 2 | 7 | 1 | 0.33 | 0.29 |
| 3 | 9 | 3 | 1 | 0.65 |
Table 9.
Weights of the reclassified values with respect to the Land Cover criterion.
Table 9.
Weights of the reclassified values with respect to the Land Cover criterion.
| Land Cover | 1 | 2 | 3 | Weight |
|---|
| 1 | 1 | 0.125 | 0.11 | 0.05 |
| 2 | 8 | 1 | 0.33 | 0.31 |
| 3 | 9 | 3 | 1 | 0.64 |
Table 10.
Weights of the reclassified values with respect to the Sigma 0 criterion.
Table 10.
Weights of the reclassified values with respect to the Sigma 0 criterion.
| Sigma 0 | 1 | 2 | 3 | Weight |
|---|
| 1 | 1 | 5 | 9 | 0.75 |
| 2 | 0.2 | 1 | 3 | 0.18 |
| 3 | 0.11 | 0.33 | 1 | 0.07 |
Table 11.
Raster layers participating in WO analysis. The weights of the criteria and the assigned scale values are derived from AHP analysis.
Table 11.
Raster layers participating in WO analysis. The weights of the criteria and the assigned scale values are derived from AHP analysis.
| Criteria | Weight (%) | Input Values | Scale Value |
|---|
| Slope | 13 | 1 (0 to 5) | 6 |
| 2 (5 to 10) | 4 |
| 3 (10 to 90) | Restricted |
Apect
(for ascending pass) | 9 | 1 (N, NE, E, S, SE) | Restricted |
| 2 (NW, SW) | 3 |
| 3 (W, Flat) | 7 |
| Land Cover | 26 | 1 (Tree, RoadHs) | Restricted |
| 2 (Rock, Bush) | 3 |
| 3 (Soil) | 6 |
| Sigma 0 | 52 | 1 (−23.38 to −10) | 8 |
| 2 (−10 to 0) | 2 |
| 3 (0 to 5.84) | Restricted |
Table 12.
The average incidence angle and the sigma 0 value for the two locations. The data were acquired using Sentinel-1 SLC products from August to September 2020.
Table 12.
The average incidence angle and the sigma 0 value for the two locations. The data were acquired using Sentinel-1 SLC products from August to September 2020.
| Location | Absolute Orbit | Direction and Relative Orbit | Average Incidence Angle | Average Sigma 0 (dB) |
|---|
| Corner Reflector 1 | 23,286 | Ascending (160) | 39.7° | −10.65 |
| Corner Reflector 2 | 23,293 | Descending (167) | 39.22° | −11.53 |
Table 13.
The viewshed parameters for both CRs to succeed maximum RCS.
Table 13.
The viewshed parameters for both CRs to succeed maximum RCS.
| Viewshed Information | Data |
|---|
| Viewpoint | CR for ascending pass |
| Azimuth | 260° |
| Baseplate elevation angle | 15° |
| Total elevation angle of CR | 51° |
| Viewpoint | CR for descending pass |
| Azimuth | 100° |
| Baseplate elevation angle | 16° |
| Total elevation angle of CR | 51° |
| Open face orientation angle | 45° |
| Open face elevation angle | 35.26° |
Table 14.
The average normalized RCS values derived from each CR in each location.
Table 14.
The average normalized RCS values derived from each CR in each location.
| Site | CR ID | Average RCS (dBm2) | Difference 1 (dBm2) |
|---|
| SOUN | 1 | 35.61 | 2.77 |
| 2 | 35.69 | 2.69 |
| MATS | 1 | 34.24 | 4.14 |
| 2 | 35.27 | 3.11 |
| TROU | 1 | 34.25 | 4.13 |
| 2 | 35.17 | 3.21 |
| ALEV | 1 | 34.22 | 4.16 |
| 2 | 34.19 | 4.19 |
| AKMS | 1 | 34.43 | 3.95 |
| 2 | 35.33 | 3.05 |
| ASGA | 1 | 34.81 | 3.57 |
| 2 | 34.72 | 3.66 |
