Article

Failure Mechanism Analysis of Mining-Induced Landslide Based on Geophysical Investigation and Numerical Modelling Using Distinct Element Method

1
Institute of Geomechanics, Chinese Academy of Geological Sciences, Beijing 100081, China
2
Chinese Academy of Geological Sciences, China University of Geosciences, Beijing 100083, China
3
Key Laboratory of Active Tectonics and Geological Safety, Ministry of Natural Resources, Beijing 100081, China
4
China Geological Survey, Beijing 100037, China
5
Department of Geological and Surveying & Mapping Engineering, Chang’an University, Xi’an 710054, China
*
Author to whom correspondence should be addressed.
Remote Sens. 2022, 14(23), 6071; https://doi.org/10.3390/rs14236071
Submission received: 2 November 2022 / Revised: 25 November 2022 / Accepted: 28 November 2022 / Published: 30 November 2022
(This article belongs to the Special Issue Ground Deformation Source Modeling Using Remote Sensing Techniques)

Abstract

:
Underground mining activity in the karst mountain in southwestern China has induced several large-scale rocky landslides and has caused serious casualties. At present, there is a lack of systematic research on the formation mechanism of landslides in this area using multi-method fusion technology. First, the orthophoto images of the landslide area obtained by UAV photography were used to analyze the deformation characteristics of the landslide. Second, the failure characteristics of the strata overlying the goaf were analyzed by geophysical detection. Finally, the deformation response characteristics of the mountain under underground mining were analyzed by UDEC numerical simulation. The results revealed that during the underground mining, the failure process of the mountain occurred in four stages: fracture expansion, subsidence and collapse, shear sliding, and multi-level sliding. Gently dipping soft–hard alternant strata and a blocky rock mass structure formed the geological foundation of the landslides. Underground mining accelerated the fracturing of the overlying strata and the formation of a stepped penetrating sliding surface. Tensile movement of the structural planes of hard sandstone in the free face, and shear sliding of the weak mudstone layer, were the main causes of the landslides. The slope instability mode was tension-shear fracturing, shear sliding, back toppling, and compressive shear failure. In addition, the fracture propagation in the overlying strata and damaged geological structure revealed by the geophysical detection were consistent with the simulation results. This study provides ideas for the precise countermeasures of disaster prevention and mitigation for similar landslides in this area.

Graphical Abstract

1. Introduction

Mining operations in mountainous and hilly areas often induce large-scale landslide disasters, and landslides induced by underground mining around the world have caused enormous fatalities, injuries, and significant economic losses (Table 1), such as the Frank landslide in Canada and the Aberfan landslide in South Wales, UK [1,2,3,4]. Guizhou Province has the largest coal reserves and production in the karst mountain in southwestern China. The wide Upper Permian Longtan Formation strata mostly contain clustered coal seams [5]. Most of the mines in Guizhou Province are located in the middle and low mountainous areas, which are highly eroded and have a large topographic relief. The high and steep mountains are associated with developed structures and the strata are composed of alternating soft and hard rocks, resulting in a very fragile geological environment. Hence, the number of landslide disasters induced by underground mining in this area is the largest in China [6]. These disasters have caused enormous losses to people’s lives and property and have threatened the safety of the major engineering facilities. For example, the Yanjiaozhai landslide in Nayong County in 2004 caused 44 deaths and destroyed 12 houses [7]. The Madaling landslide in Duyun City in 2006 severely damaged roads and farmland [8]. In 2013, a mountain in Yudong Village, Kaili City, collapsed, killing five people, blocking roads, and forming a dammed lake [9]. In addition, the Pusa landslide in Nayong County in 2017 caused 35 deaths and affected over 500 people [10]. All of the above mining-induced landslides occurred in mountainous areas that have the characteristics of “soft–hard alternant (or hard on soft), upper steep and lower gentle” dual structure. These areas also contained nearly horizontal or gently dipping strata and were controlled by 2–3 groups of dominant structural planes. Underground mining activities were the main factor inducing these landslides [11].
The mechanism of landslides induced by underground mining is complex and is affected by various factors, including (1) high and steep terrain, (2) good free face conditions, (3) weak interlayers, vertical fractures, and/or dissolution fractures, and (4) the tensile cantilever effect caused by the roof of the goaf [12,13]. Once the goaf is formed, the stress field, geological conditions, and groundwater conditions of the overlying strata will change, which induces the rock mass to separate from the bedrock, resulting in a landslide disaster [14,15]. In recent years, a variety of deformation and failure modes have been proposed for different types of landslides induced by underground mining, and can be classified into two categories: (1) single or dual deformation and failure modes, such as locking section shearing, toppling-slipping, toppling-falling, sitting, and fragmentation caving [9,16,17,18]; and (2) a combination of multiple deformation and failure modes based on basic deformation and instability models, such as stepped creeping-tensile cracking-shearing-slipping, bending-tensile cracking–plastic flow-tensile cracking–creeping-tensile cracking, slipping-tension-shearing, tensile cracking-toppling-slipping, and tension-shearing-slipping-toppling models [8,19,20,21,22]. The above results have important theoretical and practical significance for research on the mechanism of landslides induced by underground mining. Further, some researchers have conducted related research on the formation mechanism of landslides induced by underground mining in soft–hard alternant strata in the karst mountain in southwestern China [8,10,19,22,23], but the research methods were relatively single, and there is still a lack of systematic research using multi-method fusion.
The Faer slope in Guizhou Province is a typical landslide induced by underground mining. Due to the occurrence of mining in the past 20 years, the deformation of the rock strata has been intensified, and the landslide body has been broken, causing several slips with a maximum volume of 1.0 × 10⁷ m3. Deformation monitoring of the Faer slope has revealed that the landslide is undergoing continuous deformation, and the damage to the mountain is becoming more and more serious [23]. This unstable slope directly threatens the lives and property of nearly a thousand people in Qingwei Village, Jiudianzi Village, and Xiaozhai Village (Figure 1). In this study, based on a surface deformation survey, unmanned aerial vehicle (UAV) photography, and geophysical detection, we used discrete element analysis to study the response effect between the stress-strain evolution, rock mass loosening, fracture propagation, and mountain failure in the gently dipping soft–hard alternant strata under underground mining conditions. Then, the slope instability mode was determined. The results of this study provide a reference for disaster prevention and mitigation of landslides in soft–hard alternant strata induced by underground mining.

2. Materials and Methods

2.1. Study Area

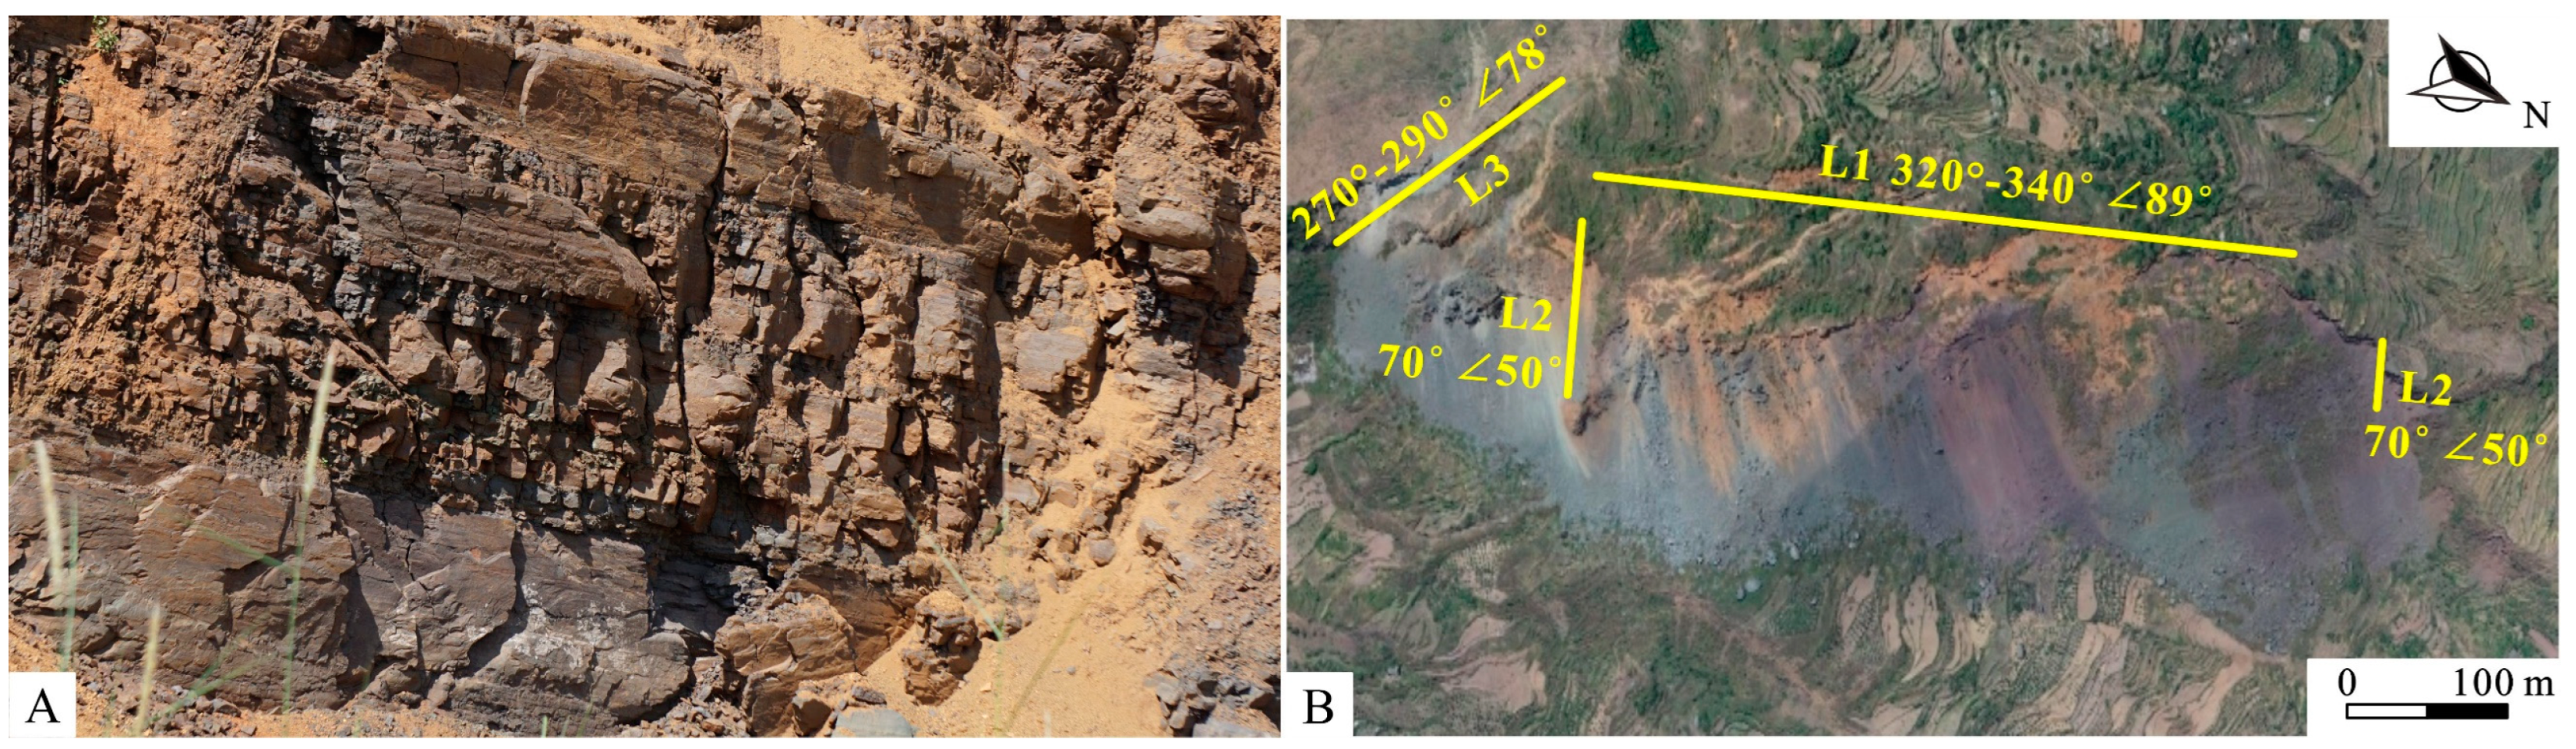
2.1.1. Geomorphology and Structure

The Faer slope is a monocline located in Jianshanying, Shuicheng County, Guizhou Province, China (104°44′01″E, 26°18′32″N) (Figure 1A). It is a low-medium to medium-low mountain landform and was formed by tectonic erosion. The terrain is high in the southeast and low in the northwest. The highest point is located at the top of the southeast side of the Jianshanying monoclinic mountain, with an elevation of 1526 m. The lowest point is located in the riverbed at the western exit of the Wanhe River, with an elevation of 950 m. Thus, the maximum elevation difference is nearly 600 m. The upper part of the mountain is steep and the lower part is gentle, with three alternating steep-gentle sections. The free faces are on the northeast and south sides. The strike of the slope is along the strike of the monoclinic (NW-SE). Based on the field survey, the elevation of the rear edge is 1320–1526 m, the elevation of the front accumulation area is 1100–1380 m, and the maximum elevation difference between the front and rear edges is 220 m. The area has undergone multiple periods of crustal movement and tectonic activity, and the tectonic development is complex. On the northwest side is the Dazhai anticline and the Yangmeishu syncline, on the northeast side is the Taishaba anticline and Malong syncline, on the southwest side is the Haqingchi anticline and Bajiaotang anticline, and on the southeast side is the Gesuohe anticline and Faer anticline. That is, the structural pattern is characterized by alternating belts and blocks and diamond-shaped combinations [24]. The landslide area is mainly controlled by the Yangmeishu syncline and Bajiaotang anticline, and is located in the southeast wing of the syncline and the core of the anticline (Figure 2). There are several groups of NW-trending faults nearby, including faults F2, F3, and F5, as well as a few NE-trending faults, including faults F1 and F3. Due to the influence of the NW-trending main faults, many NW-trending cracks have developed in the rear edge of the slope (Figure 3).

2.1.2. Stratigraphic Structure

The outcropping strata in the study area include: (1) Quaternary (Q4) residual-slope sediments and collapse deposits, and (2) Lower Triassic Feixianguan Formation (T1f) thick siltstone and sandstone intercalated with 4–5 thin layers of silty mudstone, mudstone, and other soft rocks. The stratigraphic occurrence is NW70°–90° ∠ 10°–17°, and the lithology is mainly hard rock, with a thickness of 200 m, forming a steep 40°–55° escarpment landform. (3) The Upper Permian Longtan Formation (P3l) is composed of argillaceous siltstone, fine sandstone, mudstone, and coal. The rocks have a low strength and are easily weathered, and the landform is characterized by gentle (10–25°) slopes and valleys (Figure 3). The Faer slope is developed in the Feixianguan Formation, with a sliding angle of 32°. It is a gently dipping layered slope and is characterized by a typical dual structure composed of soft–hard alternant (or hard on soft), upper steep and lower gentle, that is, the lithology of the upper part of the slope is dominated by hard rock such as sandstone, and the slope is steep, while the lower lithology is dominated by soft rocks such as argillaceous siltstone and coal, and the slope is gentle. (Figure 4).

2.1.3. Mining Activities
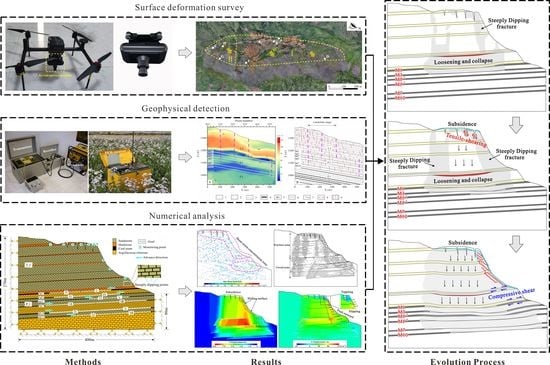
The underlying coal seams in the Faer slope area belong to the Upper Permian Longtan formation (P3l) coal-measure strata. There are a total of 10 exposed coal seams in the area, which are labeled as M1, M3, M5−2, M5−3, M7, M10, M12, M13−1, M13−2, and M14 from top to bottom. The total thickness is 16 m, with an average thickness of 1.4–2.3 m. The dip angles of the coal seams are 10–17°, and their occurrence is consistent with that of the formation. According to the coal mining data, the area has a long history of mining. From 2004 to 2018, five coal seams were successively mined, including M1, M3, M5−2, M5−3, and M7. Since 2018, the mining has focused on the deep M10 coal seam. The coal seams were mined using inclined shaft or horizontal tunnel development and the long wall mining method. The roof was managed using the full collapse method. Currently, the goaf formed by the coal seam mining has completely covered the entire landslide body, and a large number of NW-trending surface cracks have formed in the top of the slope (Figure 3 and Figure 4). These cracks have widened and deepened as the mining face continues to advance, which has accelerated the mountain’s deformation and increased the risk of landslide occurrence.

2.2. Methods

In order to analyze the evolution process and formation mechanism of the Faer landslide, the orthophoto images of the landslide area obtained by UAV photography were used to analyze the deformation characteristics of the landslide, and the failure characteristics of the strata overlying the goaf were analyzed by geophysical detection, and the deformation response characteristics of the mountain under underground mining were analyzed by UDEC numerical simulation. The flowchart dealing with the methodology is shown in Figure 5.

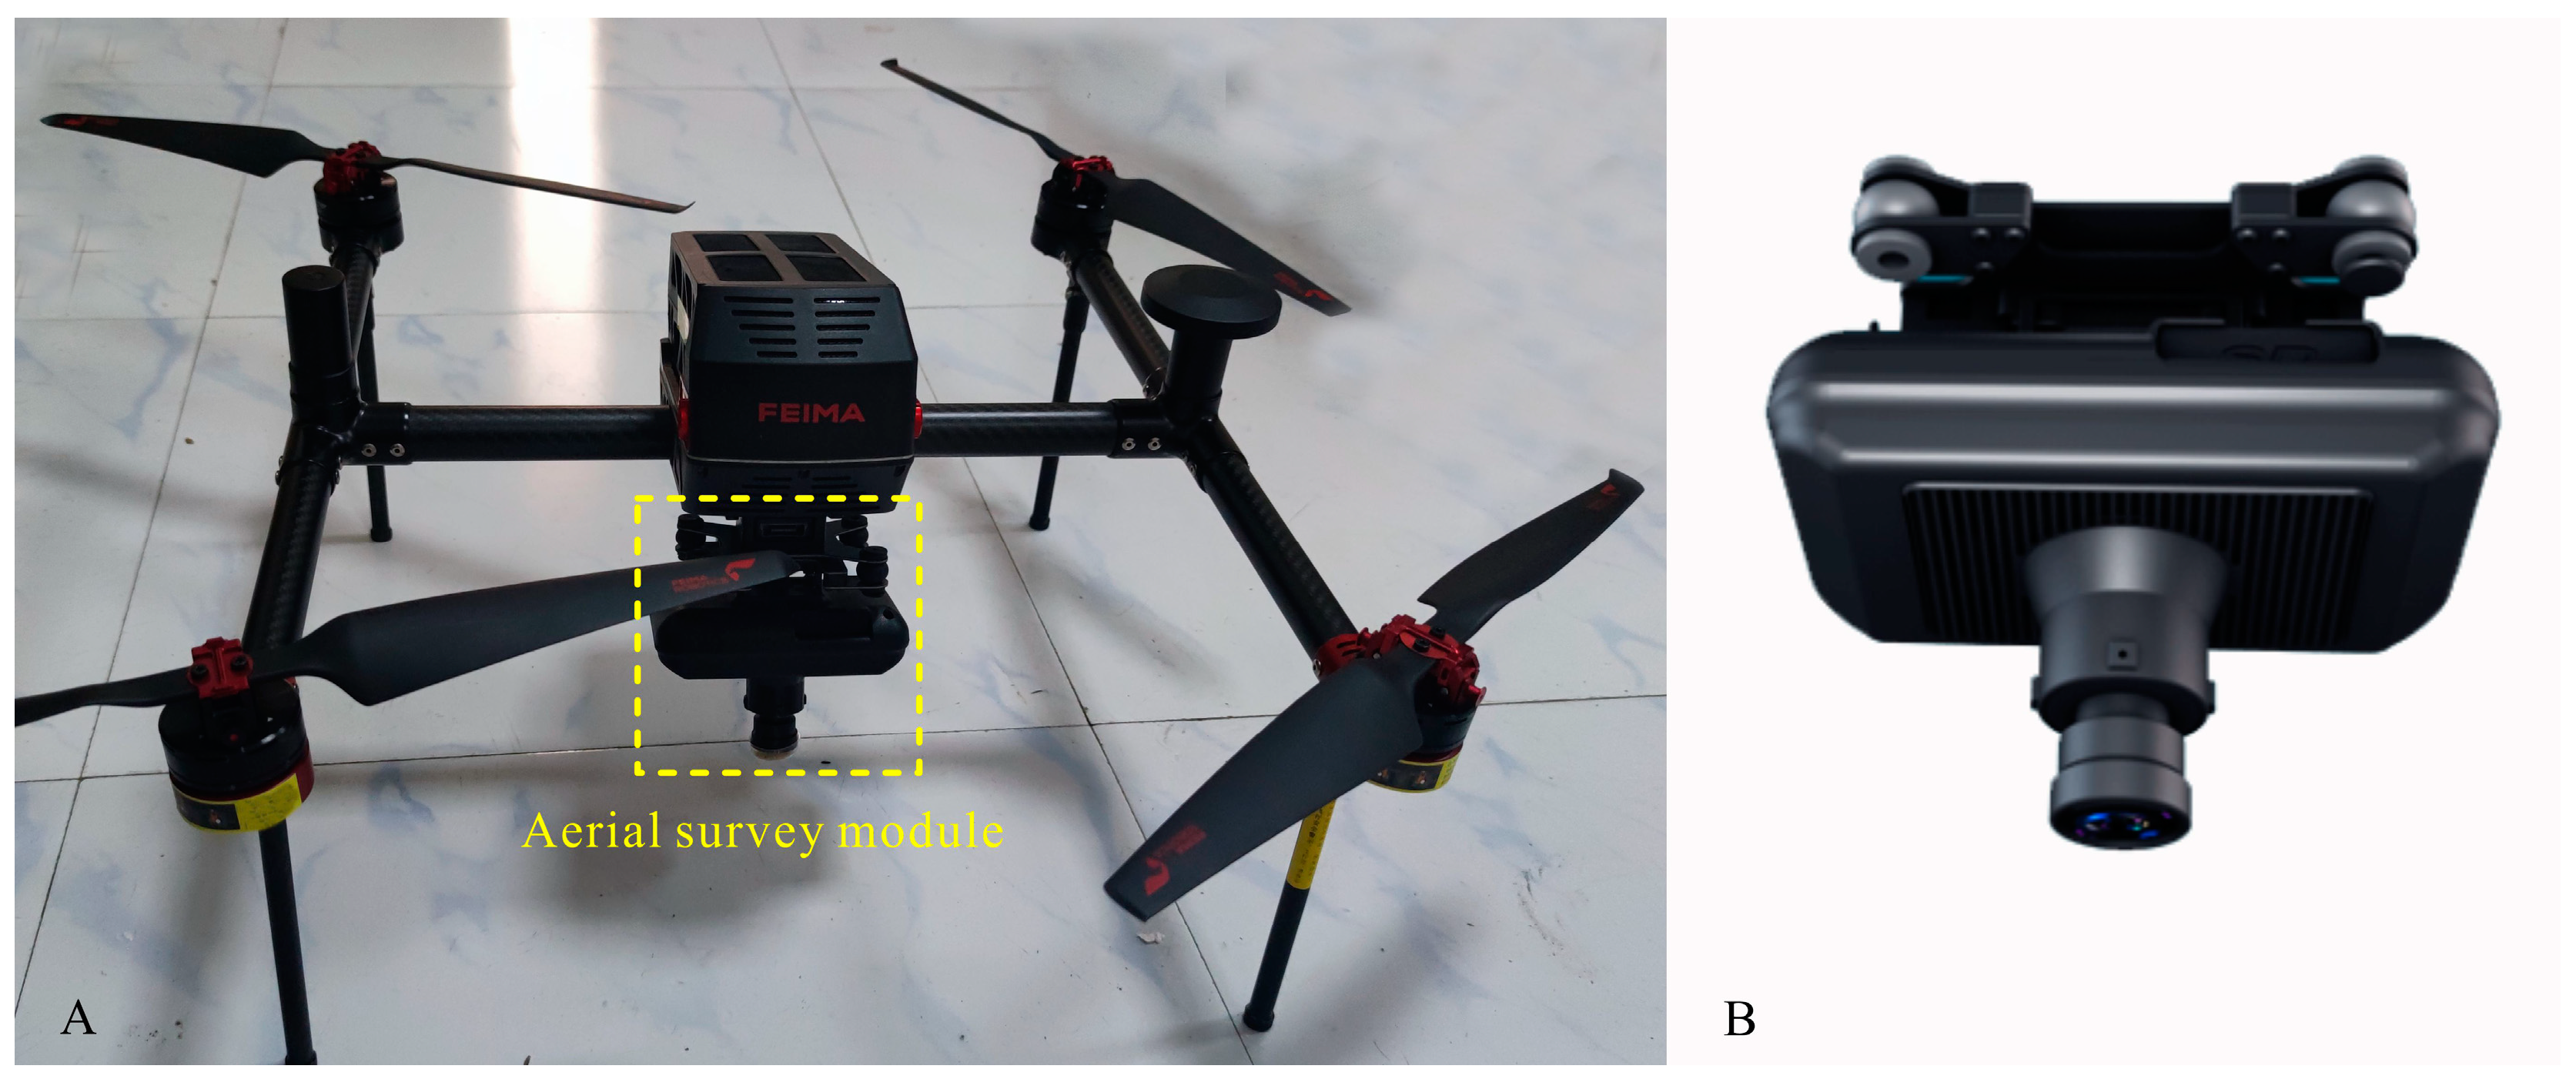
2.2.1. Surface Deformation Survey

UAV photogrammetry (using an optical vision camera integrated UAV) is a safe, time-efficient and reliable assessment technique. The common points between overlapping images can be used to conduct a feature matching in order to generate an orthophoto [25,26]. E2000S UAV (Pegasus Robot Technology Co., Ltd., Shenzhen, China, Figure 6A) was used to obtain an orthophoto of the Faer landslide area (Figure 7 and Figure 8). The UAV is equipped with an aerial survey module E-CAM2000, carrying a high-precision SONY a6000 camera with a sensor size of 23.5 × 15.6 mm (APS-C), 24.3 million effective pixels, and a 25 mm fixed-focus lens (Figure 6B). This UAV has the function of precise terrain-following flight, and with the UAV Manager Professional software, the E2000S can achieve accurate terrain-following flight, which can improve the image acquisition resolution and ensure the consistency of image resolution. In addition, it also has an automatic obstacle avoidance function, and the E200OS is equipped with a front-facing millimeter-wave radar obstacle avoidance module that can automatically detect obstacles in front of it and improve the safety level. The design speed is 13.5 m/s, the flight height is 513 m, and the overlap is 80% × 60%. The study area is characterized by strong tectonic activity, and three dominant structural planes are developed in the regional strata, namely, J1: 225° ∠ 89°, J2: 165° ∠ 50°, and J3: 186° ∠ 78°. Based on the orthophotographic morphology, these three structural planes not only cut the rock mass into blocks and weaken the strength of the rock mass (Figure 7A), but they also control rear edge boundary L1 and lateral boundaries L2 and L3 of the Faer slope. Rear edge crack L1 is parallel to the scarp and has a length of 900 m. Lateral crack L2 is almost perpendicular to L1, while L3 controls the boundary of the SE lateral tensile-cracking area at the top of the monocline mountain (Figure 7B). Based on the controlling effects of the dominant structural planes on the deformation boundaries of the slope and the different degrees of deformation in the different areas of the landslide body, the landslide body can be divided into two deformation zones: zone I and zone II. L1 and L2 are the slipping control boundaries of zone I, and the 2D shape is approximately rectangular. L2 and L3 are the slipping control boundaries of zone II, and the 2D shape is triangular (Figure 8).

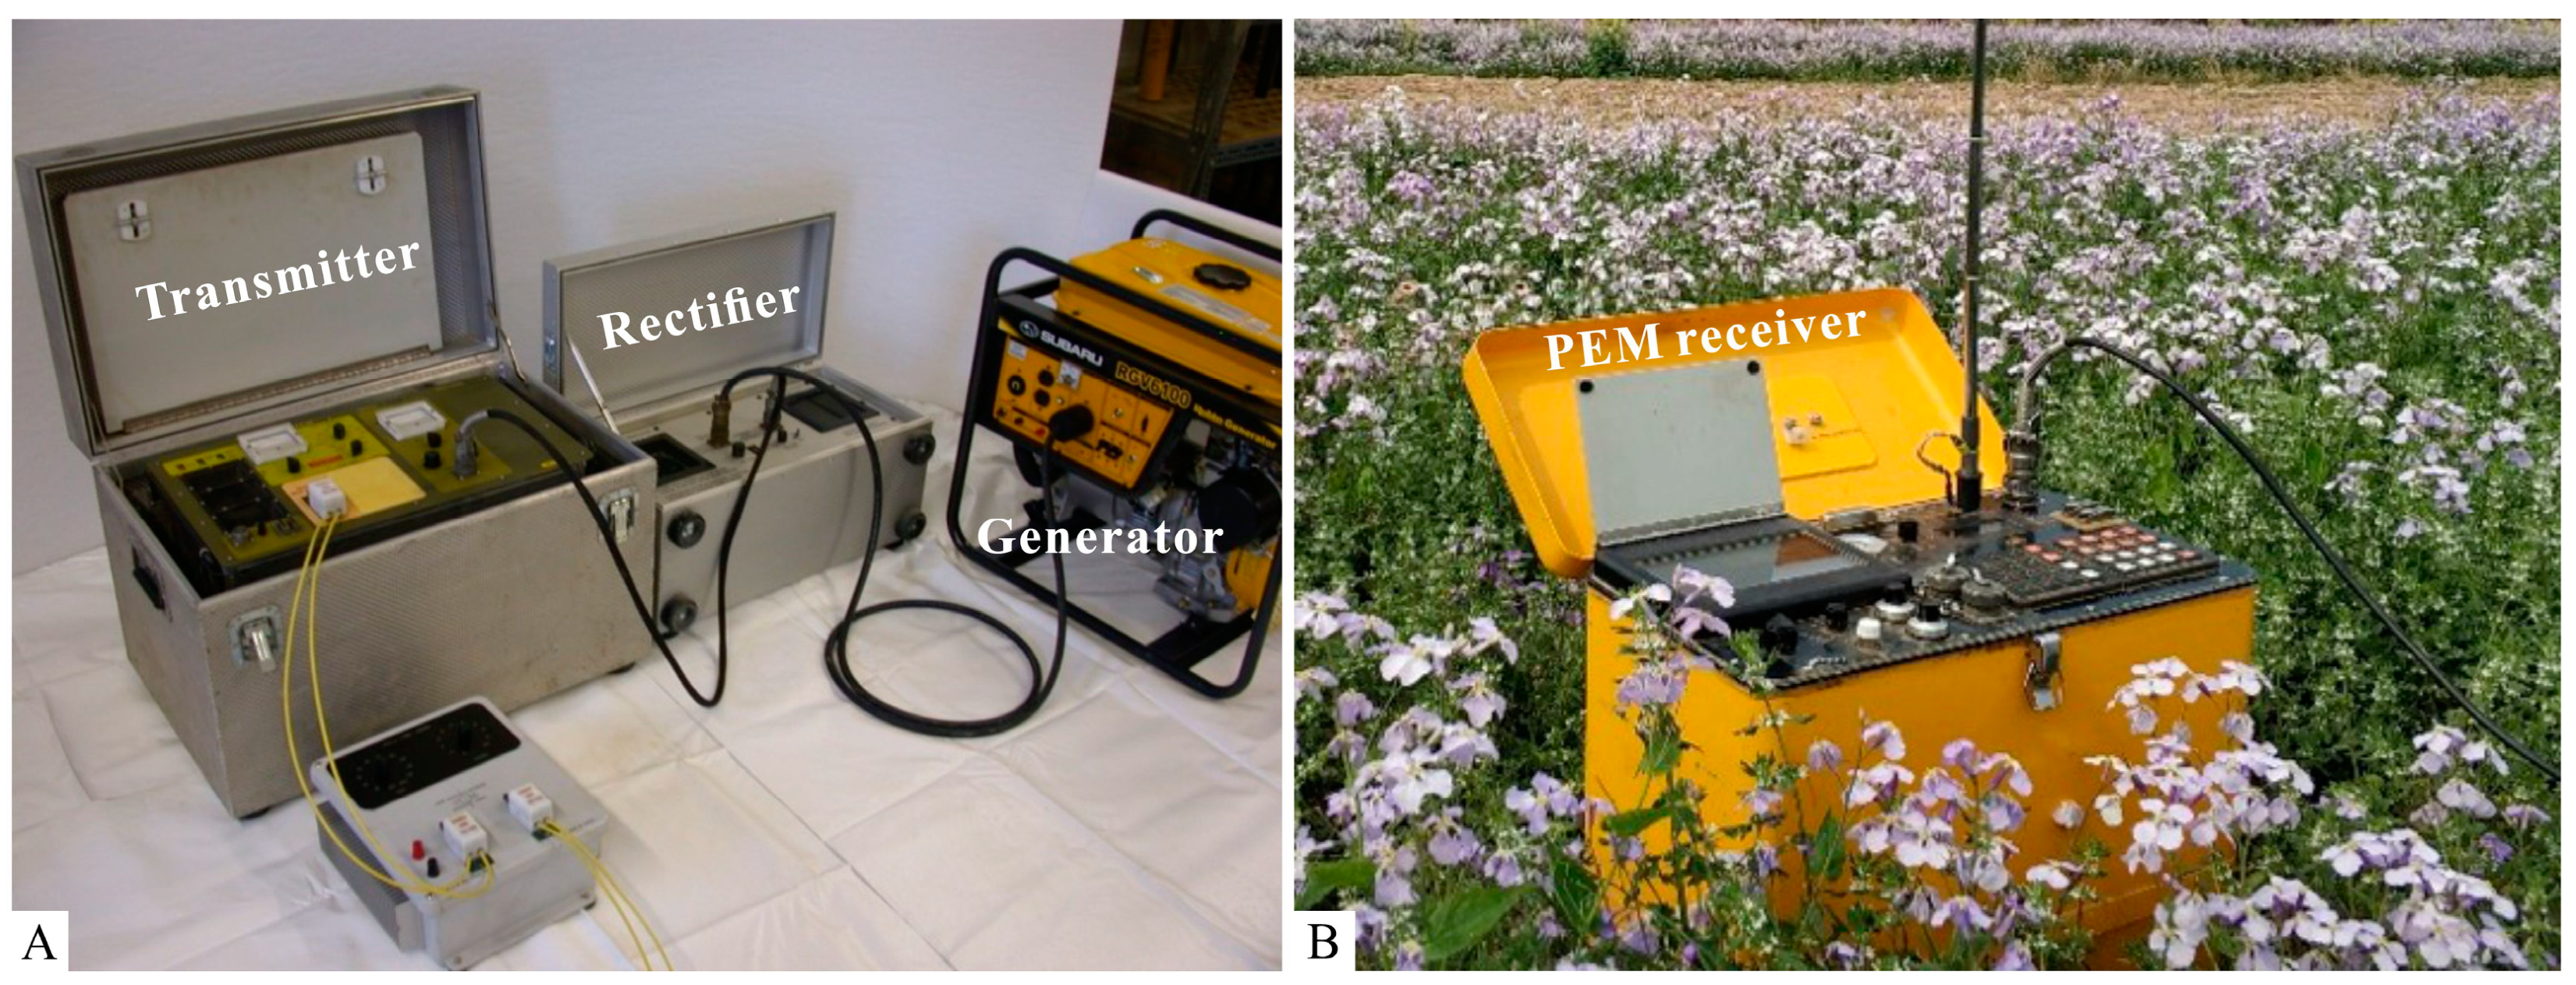
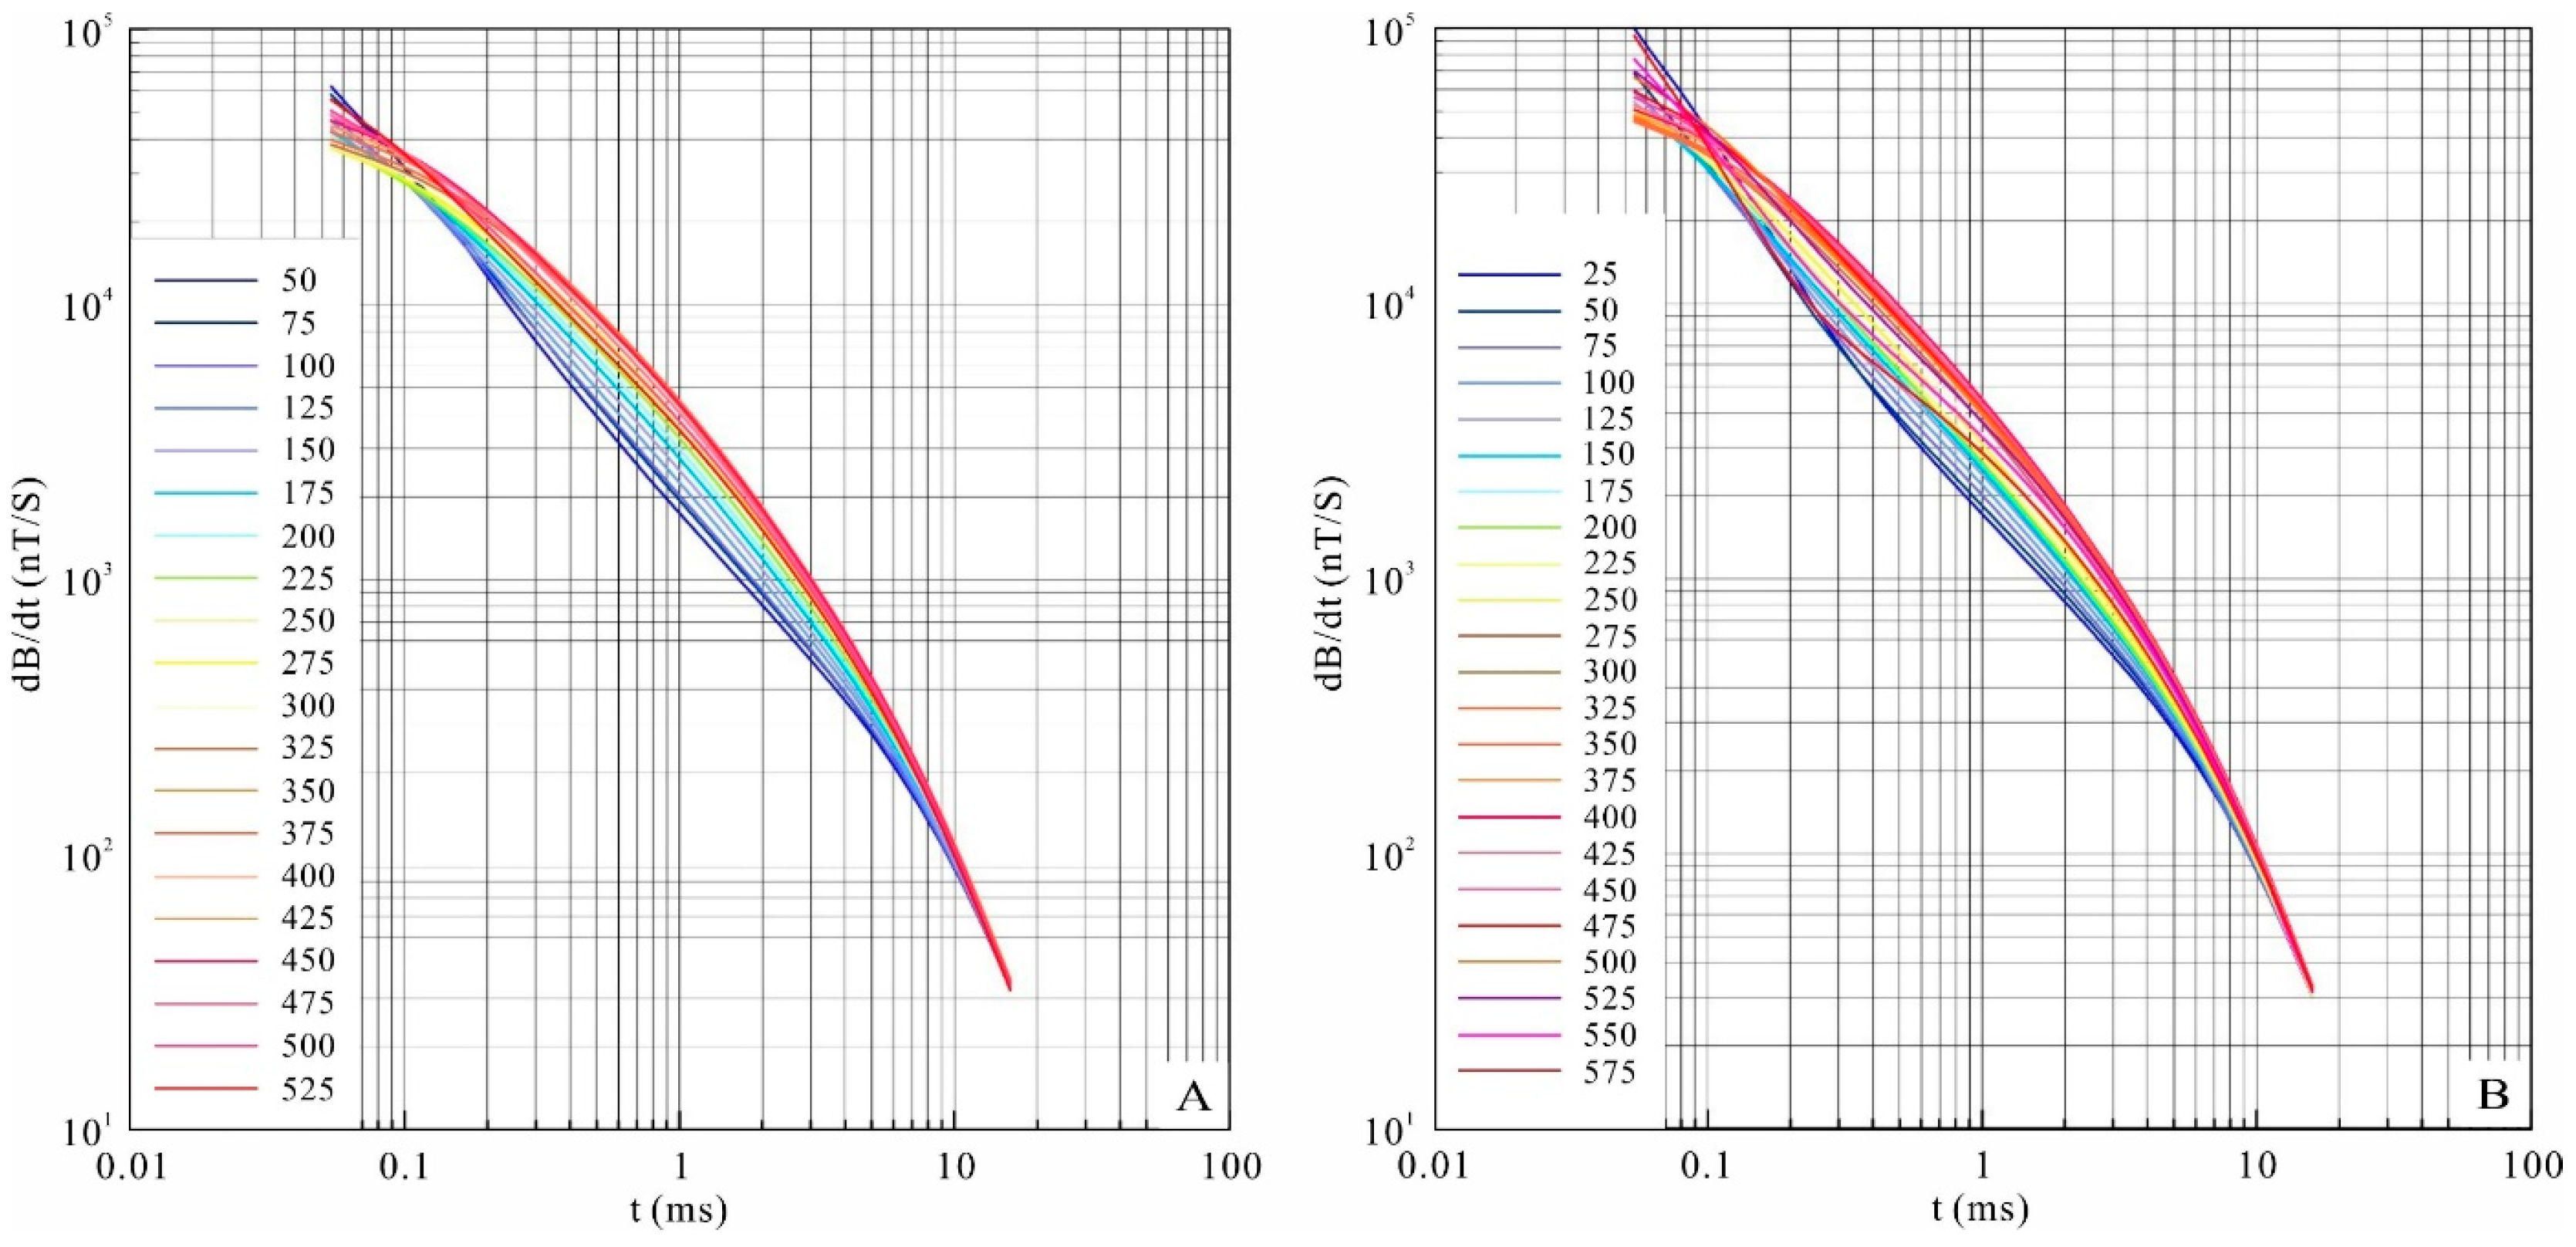
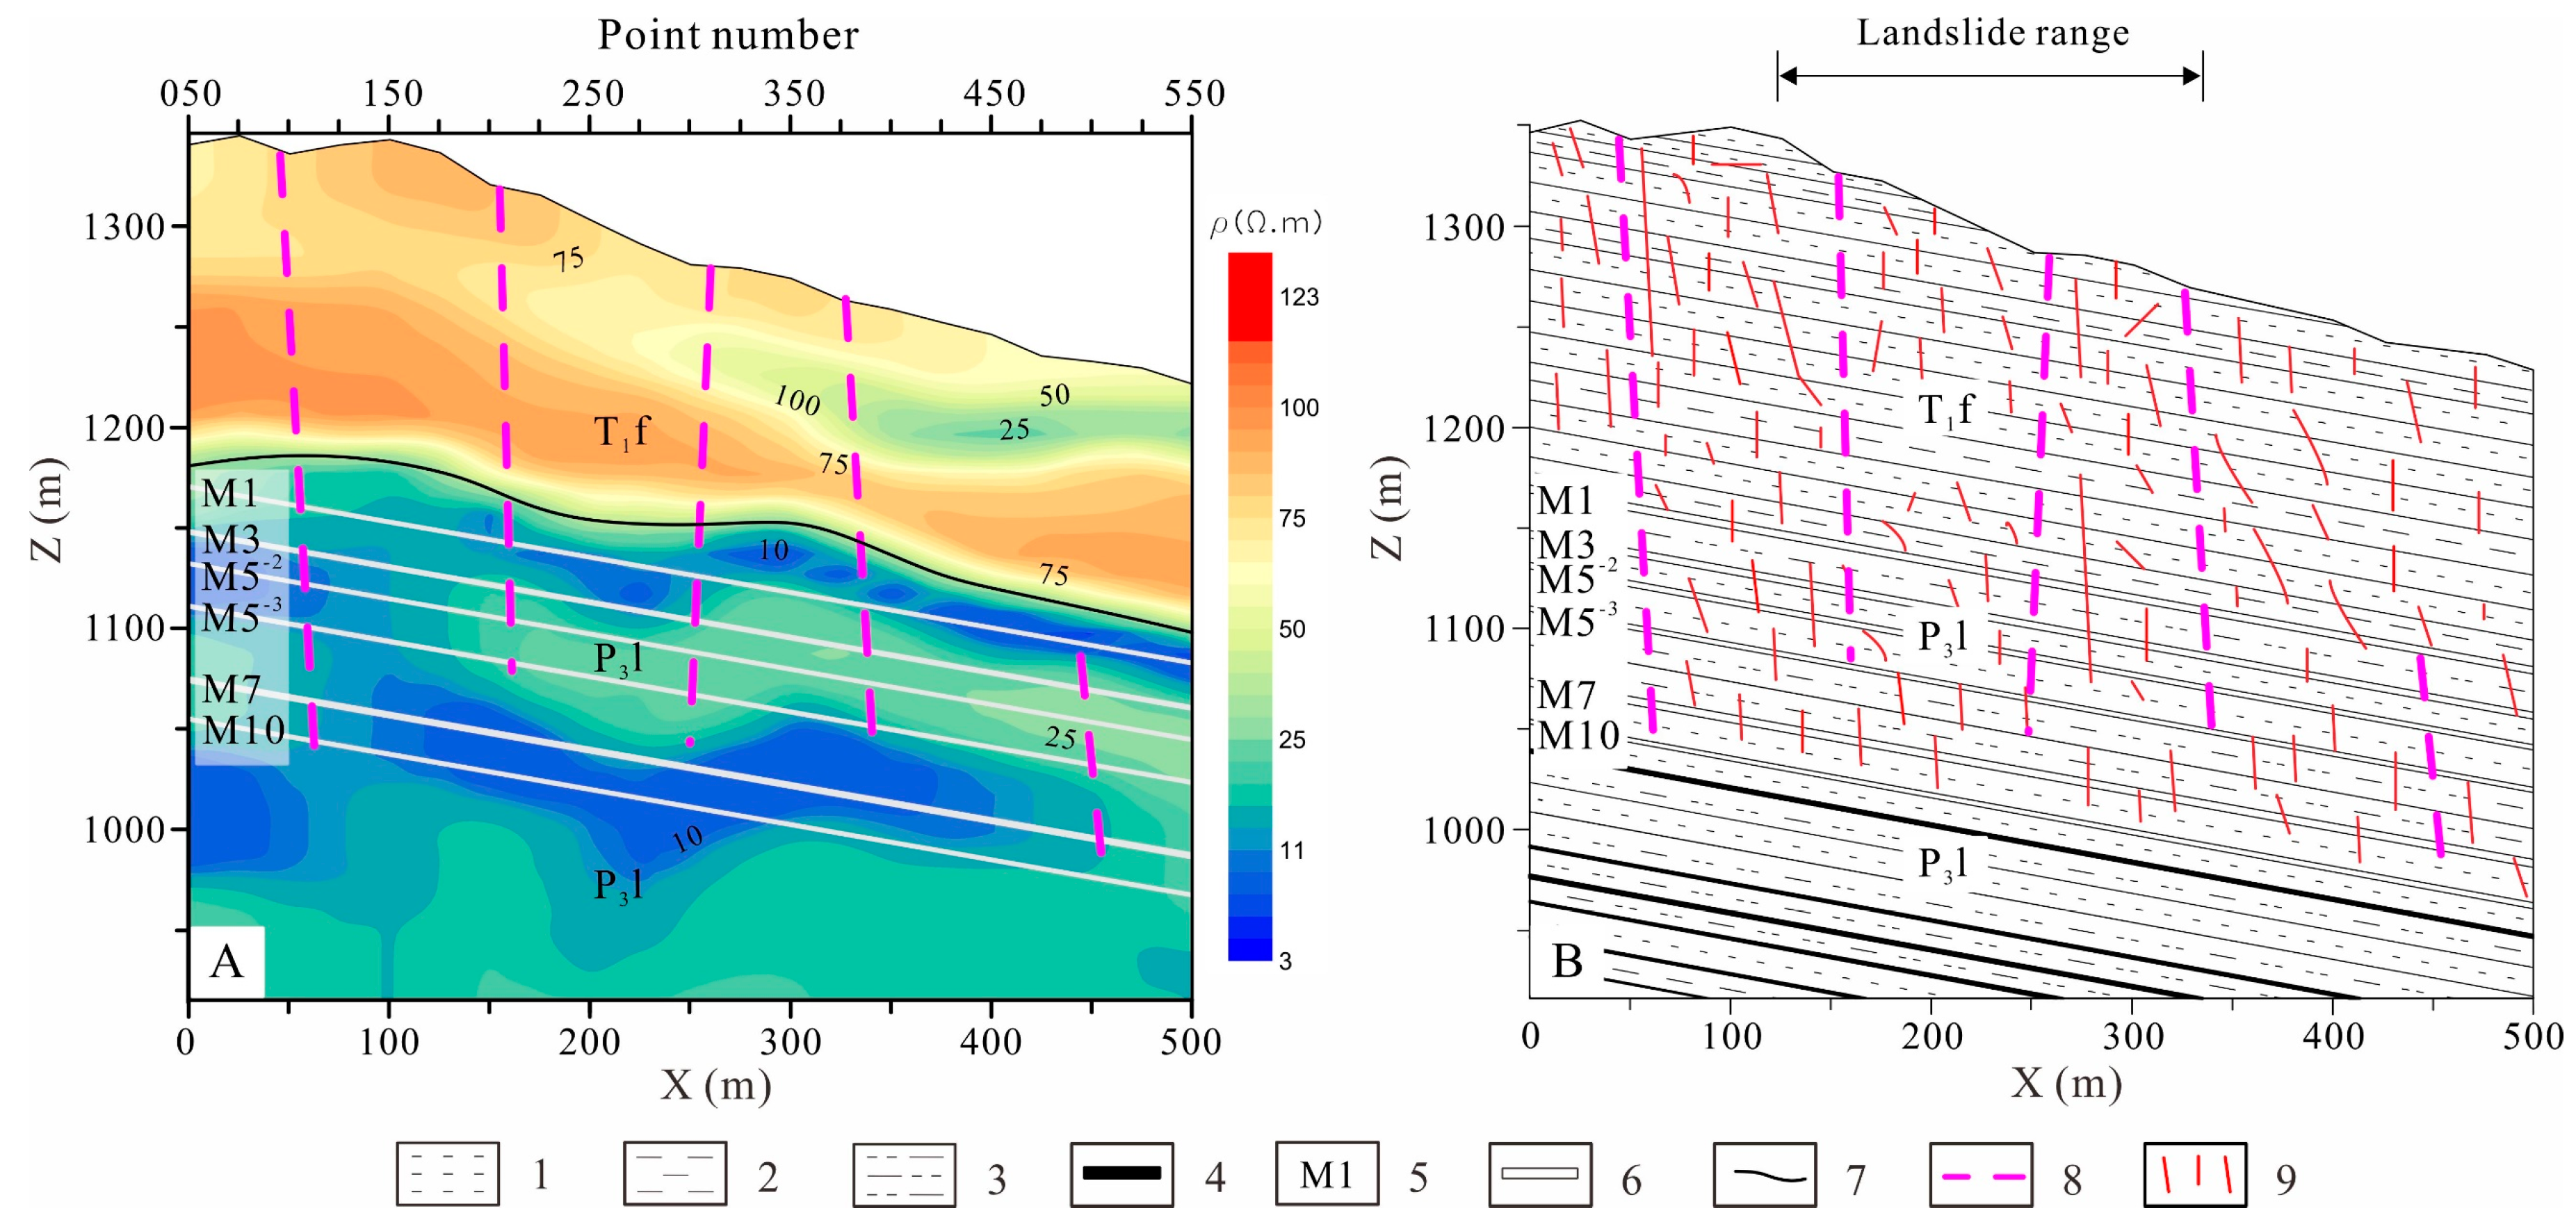
2.2.2. Geophysical Detection

Geophysical electromagnetic methods can be used to detect the degree and range of damage to a rock mass based on the differences in its electrical conductivity. These methods have been widely applied to the detection of the goaf and the fracture evolution of the overlying strata [27,28]. In order to detect the geological structure of the strata overlying the goaf in the Faer slope, the transient electromagnetic method (TEM) was used. Fixed-loop TEM uses a large-scale loop transmitter on the ground to excite the target, and a receiving system is used to collect the transient responses. The device emits a large magnetic moment and has a large coverage, and it is mainly used for wide-area, deep, fine detection.
The field data acquisition system used in this study was a pulse electromagnetic (PEM) detection system (Crone Geophysics, Mississauga, ON, Canada) (Figure 9), which consisted of a 4.8 kW transmitting system and a receiving system. The transmitting system was composed of a 5 kW generator, a rectifier, a transmitter, and a loop frame. The receiving system included a PEM receiver and ground probes. A quartz clock was used to synchronize the transmitting system and the receiving system. A total of three TEM ground survey lines (II-II′, III-III′, and IV-IV′ in Figure 3) were set up in this study, all of which were perpendicular to the scarp. The dimensions of the transmitting loop frame were 300 m × 600 m, each survey line was 500–600 m, and the line distance was 70–80 m. The measuring point spacing was 20–25 m, the emission current was 20 A, the emission time base was 20 ms (fundamental frequency of 12.5 Hz), the falling edge was 500 μs, and the number of superpositions was 128–512.
In the TEM data processing, the smoke ring imaging method and one-dimensional inversion were used to determine the distribution of the underground electrical structure. Specifically, the global apparent resistivity was calculated first, and then, the apparent depth was calculated based on the eddy current diffusion velocity according to the smoke ring theory. Taking the apparent resistivity and apparent depth as the initial parameters, the borehole data were used to carry out one-dimensional inversion. The characteristic points of the resistivity and depth were corrected, and the quasi-two-dimensional depth-resistivity geoelectrical section was finally obtained. Before the data processing, it was necessary to perform calibration analysis on the raw measurement data to verify their accuracy. The induced electromotive force data obtained using the TEM at each measuring point consisted of a set of transient response data, the variation of which reflects the electrical conductivity of the geological structure below the measuring point [29,30]. Therefore, the induced electromotive force attenuation curve for each point reflects the variation in the secondary field with time to a certain extent. Figure 10 shows the induced electromotive force attenuation curves for all of the measuring points on survey lines II-II′ and IV-IV′. It can be seen that the curves for measuring points 25–575 have different patterns. For the measuring points with a small number, in the early stage of the secondary field, the value is large and the attenuation speed is high. The attenuation slows in the middle stage, and then, it speeds up again in the late stage. For the measuring points with a large number, in the early and middle stages of the secondary field, the value is small and the attenuation speed is low. In the late stage, the slope of the curve increases, indicating a large attenuation speed, which is similar to the pattern for the measuring points with a small number. In summary, the raw data curve is smooth and continuous, without spikes, indicating normal attenuation and a good data quality.

2.2.3. Numerical Analysis

The rock strata have been separated by joints into blocks of arbitrary shapes and the joints control the movement behavior of the rock mass. The discrete element method (DEM) can be used to efficiently simulate the large deformation and large displacement of rock blocks [31,32]. The Universal Distinct Element Code (UDEC) is an ideal tool for studying the potential failure of discontinuous media (e.g., rock masses with joints and fissures). It can automatically identify new contact surfaces of discrete blocks and allows large displacements and rotations of the blocks, including complete detachment [31]. This software is already widely used in the analysis of slope stability induced by underground mining [33,34,35,36]. Based on the geological profile of the Faer landslide body (Figure 4), a plane strain model (Figure 11) was created using UDEC software in order to simulate the stress field, strain field, fracture propagation, and deformation response of the strata overlying the goaf under underground mining conditions. The bottom of the model was 400 m long, and the left and right boundaries were 270 m and 90 m high, respectively. The thickness of the ore layer was based on the actual mining thickness, that is, there were six ore layers from top to bottom, the thicknesses of which were 2.3 m, 1.8 m, 1.4 m, 1.5 m, 2.3 m, and 1.4 m. The spacings between the coal seams from top to bottom were 12 m, 9 m, 13 m, 22 m, and 11 m. The boundary conditions were as follows. The bottom of the model was supported by a fixed hinge, that is, the vertical and horizontal displacements were constrained. The horizontal displacements on two sides of the model were fixed. In order to measure the displacement field in the different areas of the model during the mining process, monitoring points ①–⑥ and ⑦–⑩ were placed at the top of the model and on the slope, respectively (Figure 11). The Mohr-Coulomb model was used for the coal seam and rock mass, and the joint plane contact-Coulomb slip model was used for the joint material. The rock mass parameters used in the simulation were based on the geological disaster survey data and existing research results for this area [37,38]. The values of the parameters were determined through trial calculations and inversion (Table 2). The mining process in the simulation was the same as the actual mining sequence in the Faer Coal Mine, that is, the coal seams were mined from top to bottom in the sequence of M1, M3, M5−2, M5−3, M7, and M10, and the mining lengths of these coal seams were 200 m, 210 m, and 130 m, 320 m, 320 m, and 250 m, respectively. Along the strike of the coal seam, the advancement directions of the above six working faces were different. Coal seams M1, M3, and M5−2 were mined from the outside to the inside of the slope; while M5−3, M7, and M10 were mined from the inside to the outside of the slope. In this study, each set of coal seams was set to be mined in two stages, i.e., a total of 12 stages of mining. The mining stages were labeled I–XII (Figure 11).

3. Results

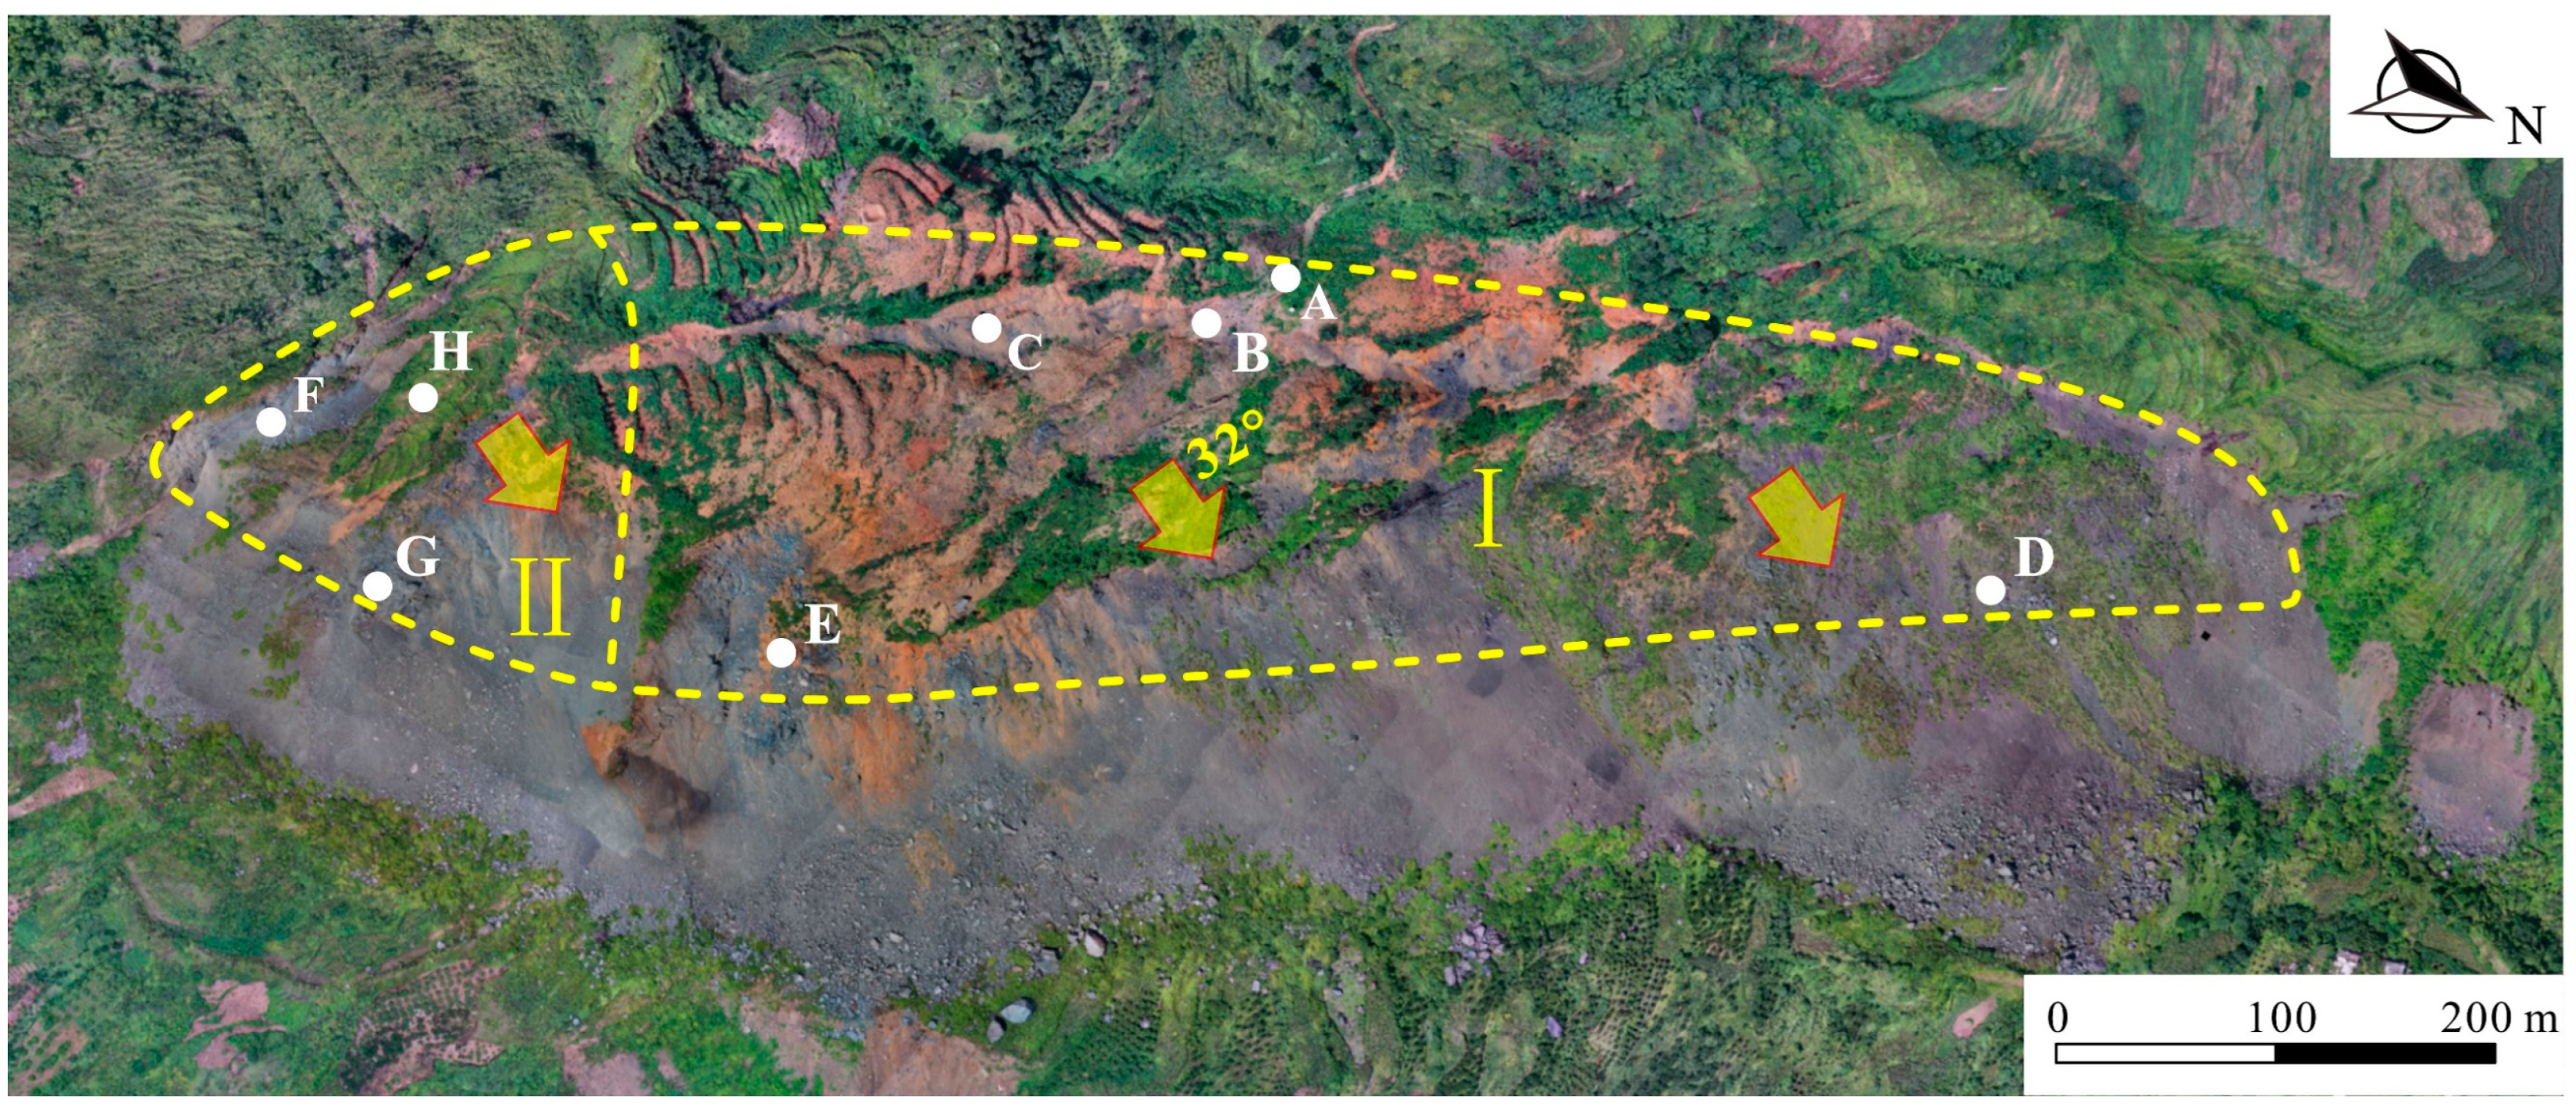
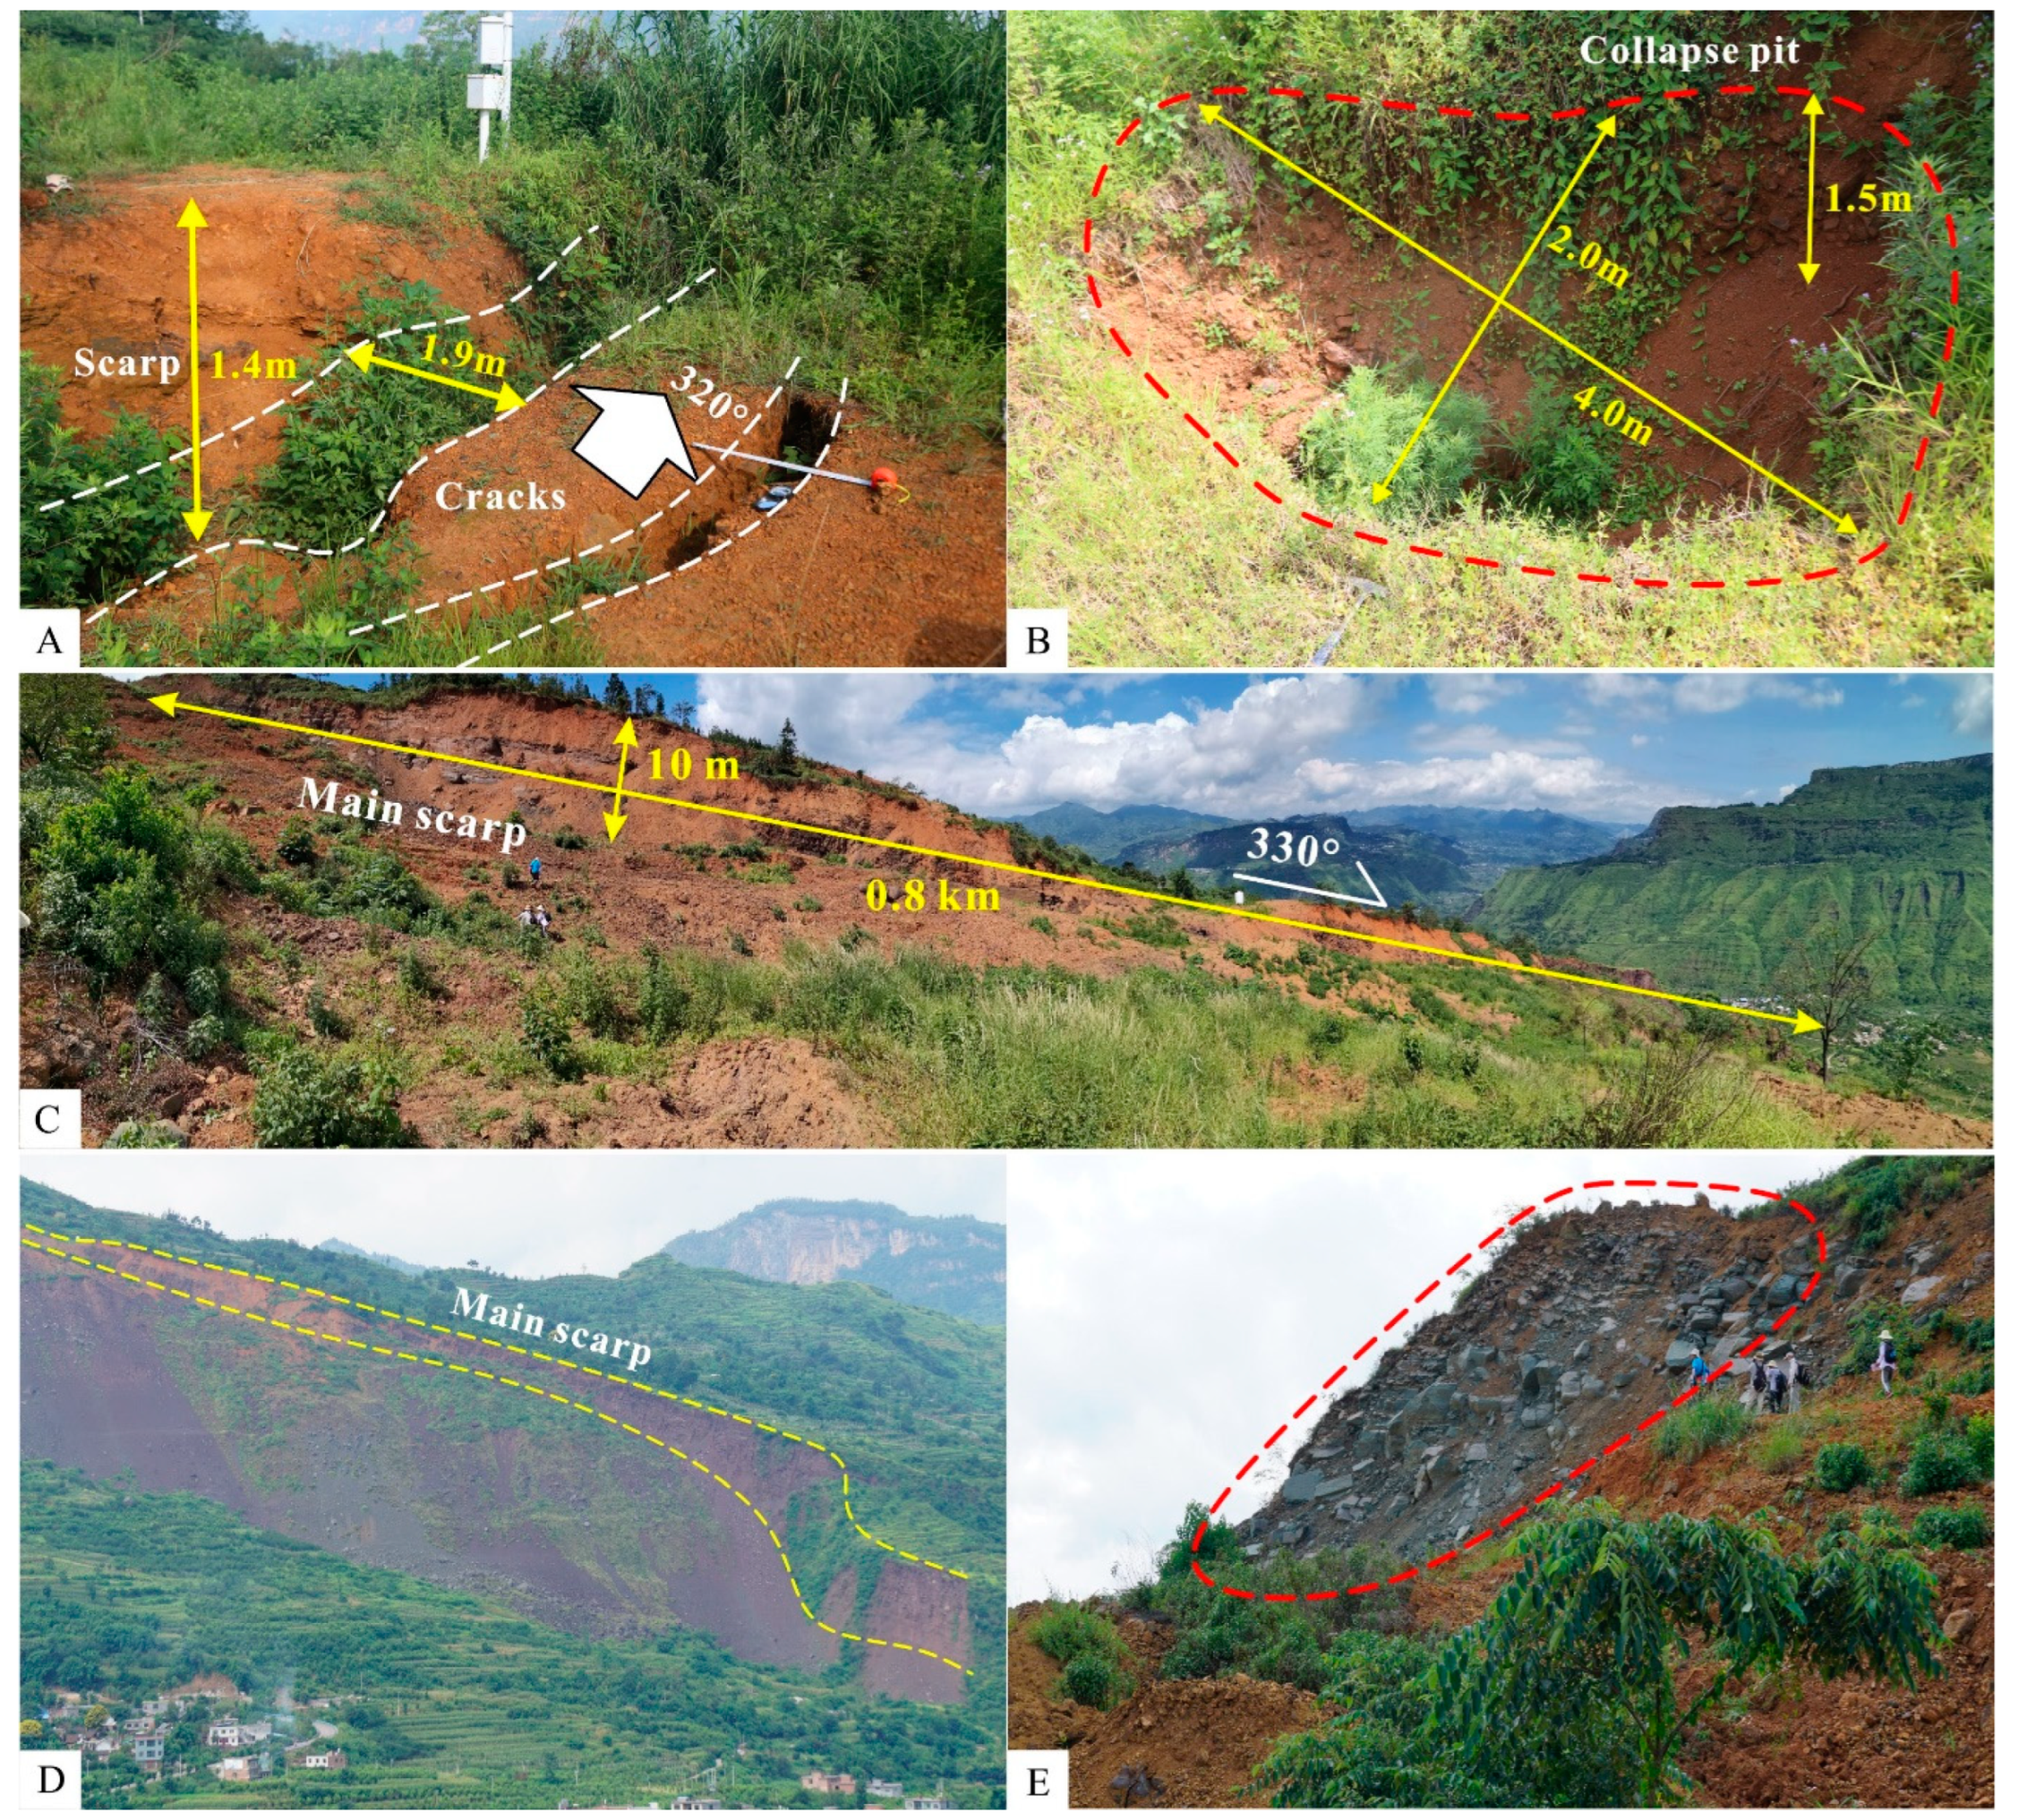
3.1. Surface Deformation Characteristics

Based on UAV photography and surface deformation survey, there is a large amount of goaf under zone I, which has caused a massive amount of uneven subsidence on the top of the mountain. The subsidence ranges from 0.5 to 10 m. The main damage modes are surface cracks, subsidence scarps, and collapse pits. The trend of the surface cracks is N30°–40°W, with a width of 0.1–3 m. The surface cracks are parallel to the boundary of the mining face. Under the control of dominant structural plane J1, a smooth, straight, NW-SE trending scarp with a length of 0.8 km and a height of 1–15 m has formed on the rear edge of the landslide body. The cracks around the scarp have continued to grow, and the boundary of the landslide body has continued to expand toward the top of the mountain (Figure 12A–D). In contrast to non-mining-induced landslides, there is bulging in the surface area where a large-scale rock mass protrudes toward the free face, forming a convex slope with a fragmented rock mass. This is most likely a special phenomenon caused by underground mining. A large number of blocky rocks have collapsed, slid, and accumulated at the foot of the gentle slope in the form of rock piles (Figure 12E).
Figure 12. Deformation characteristics of zone I: (A) subsidence scarp and tensile cracks; (B) collapse pit; (C) scarp at the rear edge; (D) front view of NW side; and (E) bulging of landslide surface. The specific locations of features A–E are shown in Figure 8.
Remotesensing 14 06071 g012
Under the disturbance of underground mining activities, zone II has subsided along dominant structural plane J3. Moreover, under the good free face conditions, the mountain has slid in the N32° E direction. Due to these movements, the rock mass has undergone tensile-cracking and a large trough with a vertical offset of 31 m and a horizontal offset of 51 m has formed. The rock mass on the free face side is in a fragmented state and the strength has been greatly reduced, and thus, partial collapse has occurred (Figure 13F–G). It should be noted that the stratigraphic structure in this area changes significantly at this point. Since the strata on the south side of dominant structural plane J3 is not within the influence range of the goaf, these strata have not moved and have retained the original anti-dip structure. However, for the strata on the north side of J3, the stratigraphic structure has changed from the initial anti-dip structure to lateral and dip structures due to the simultaneous vertical subsidence and sliding towards the free face (Figure 13H), which have greatly reduced the stability of the landslide body.
Figure 13. Deformation characteristics of zone II: (F) large-scale tensile cracking trough on the SE side; (G) fractured rock mass on the SE side; and (H) change in the stratigraphic structure. The specific locations of features F–H are shown in Figure 8.
Remotesensing 14 06071 g013

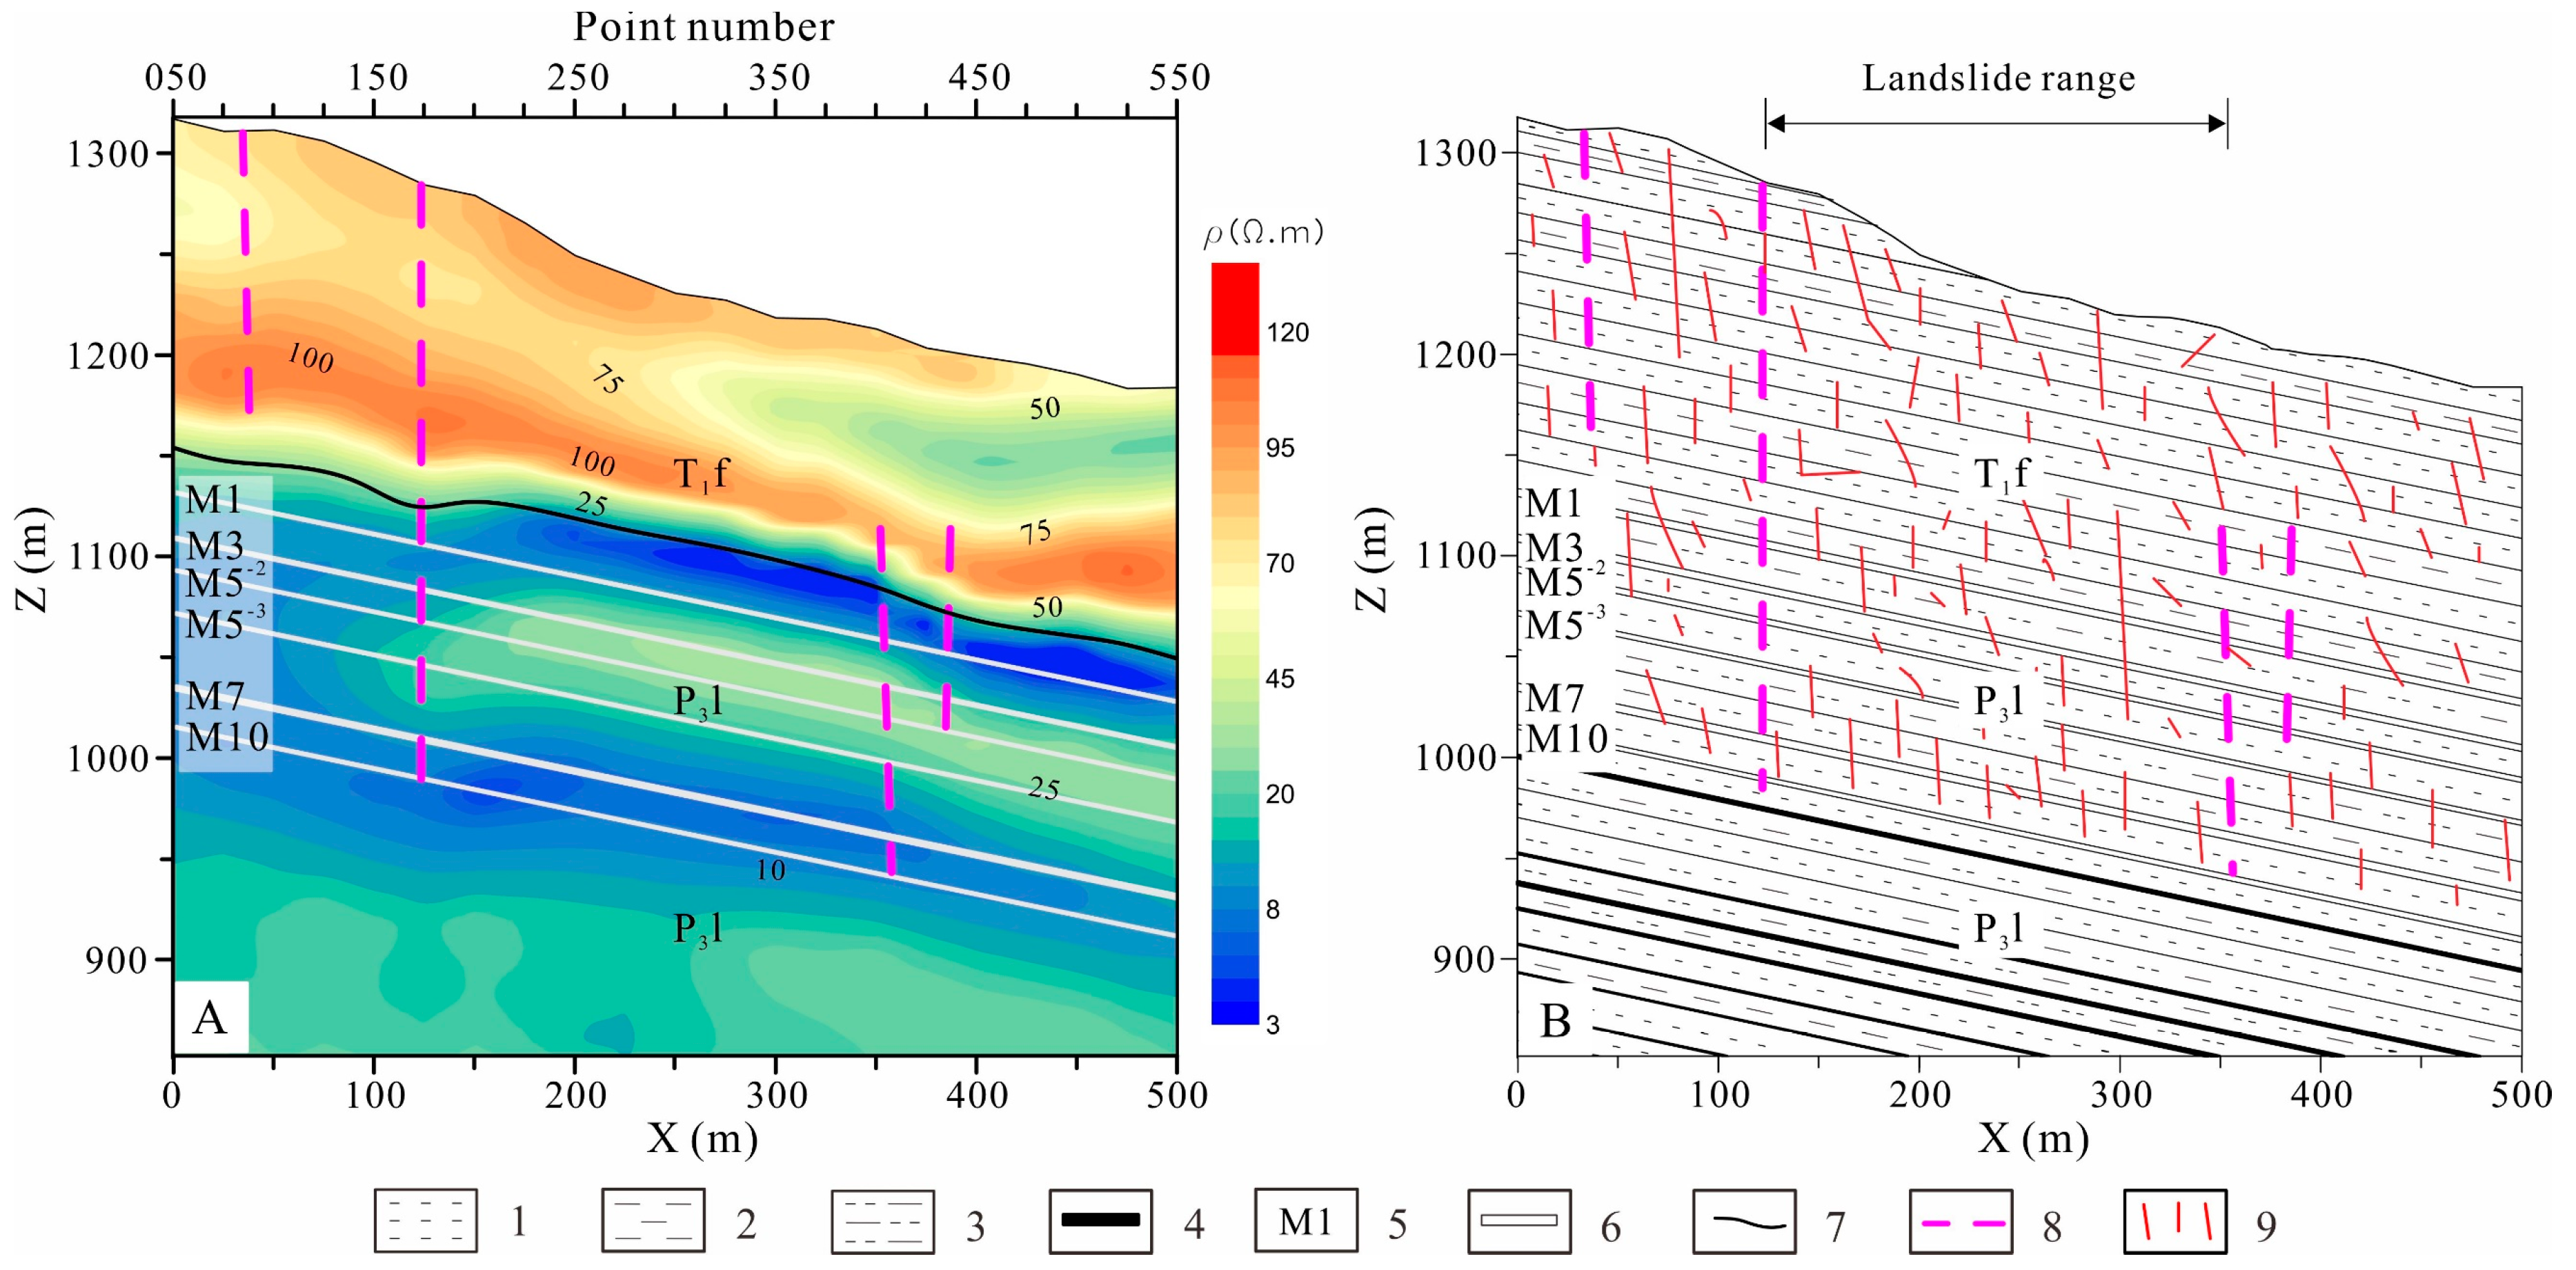
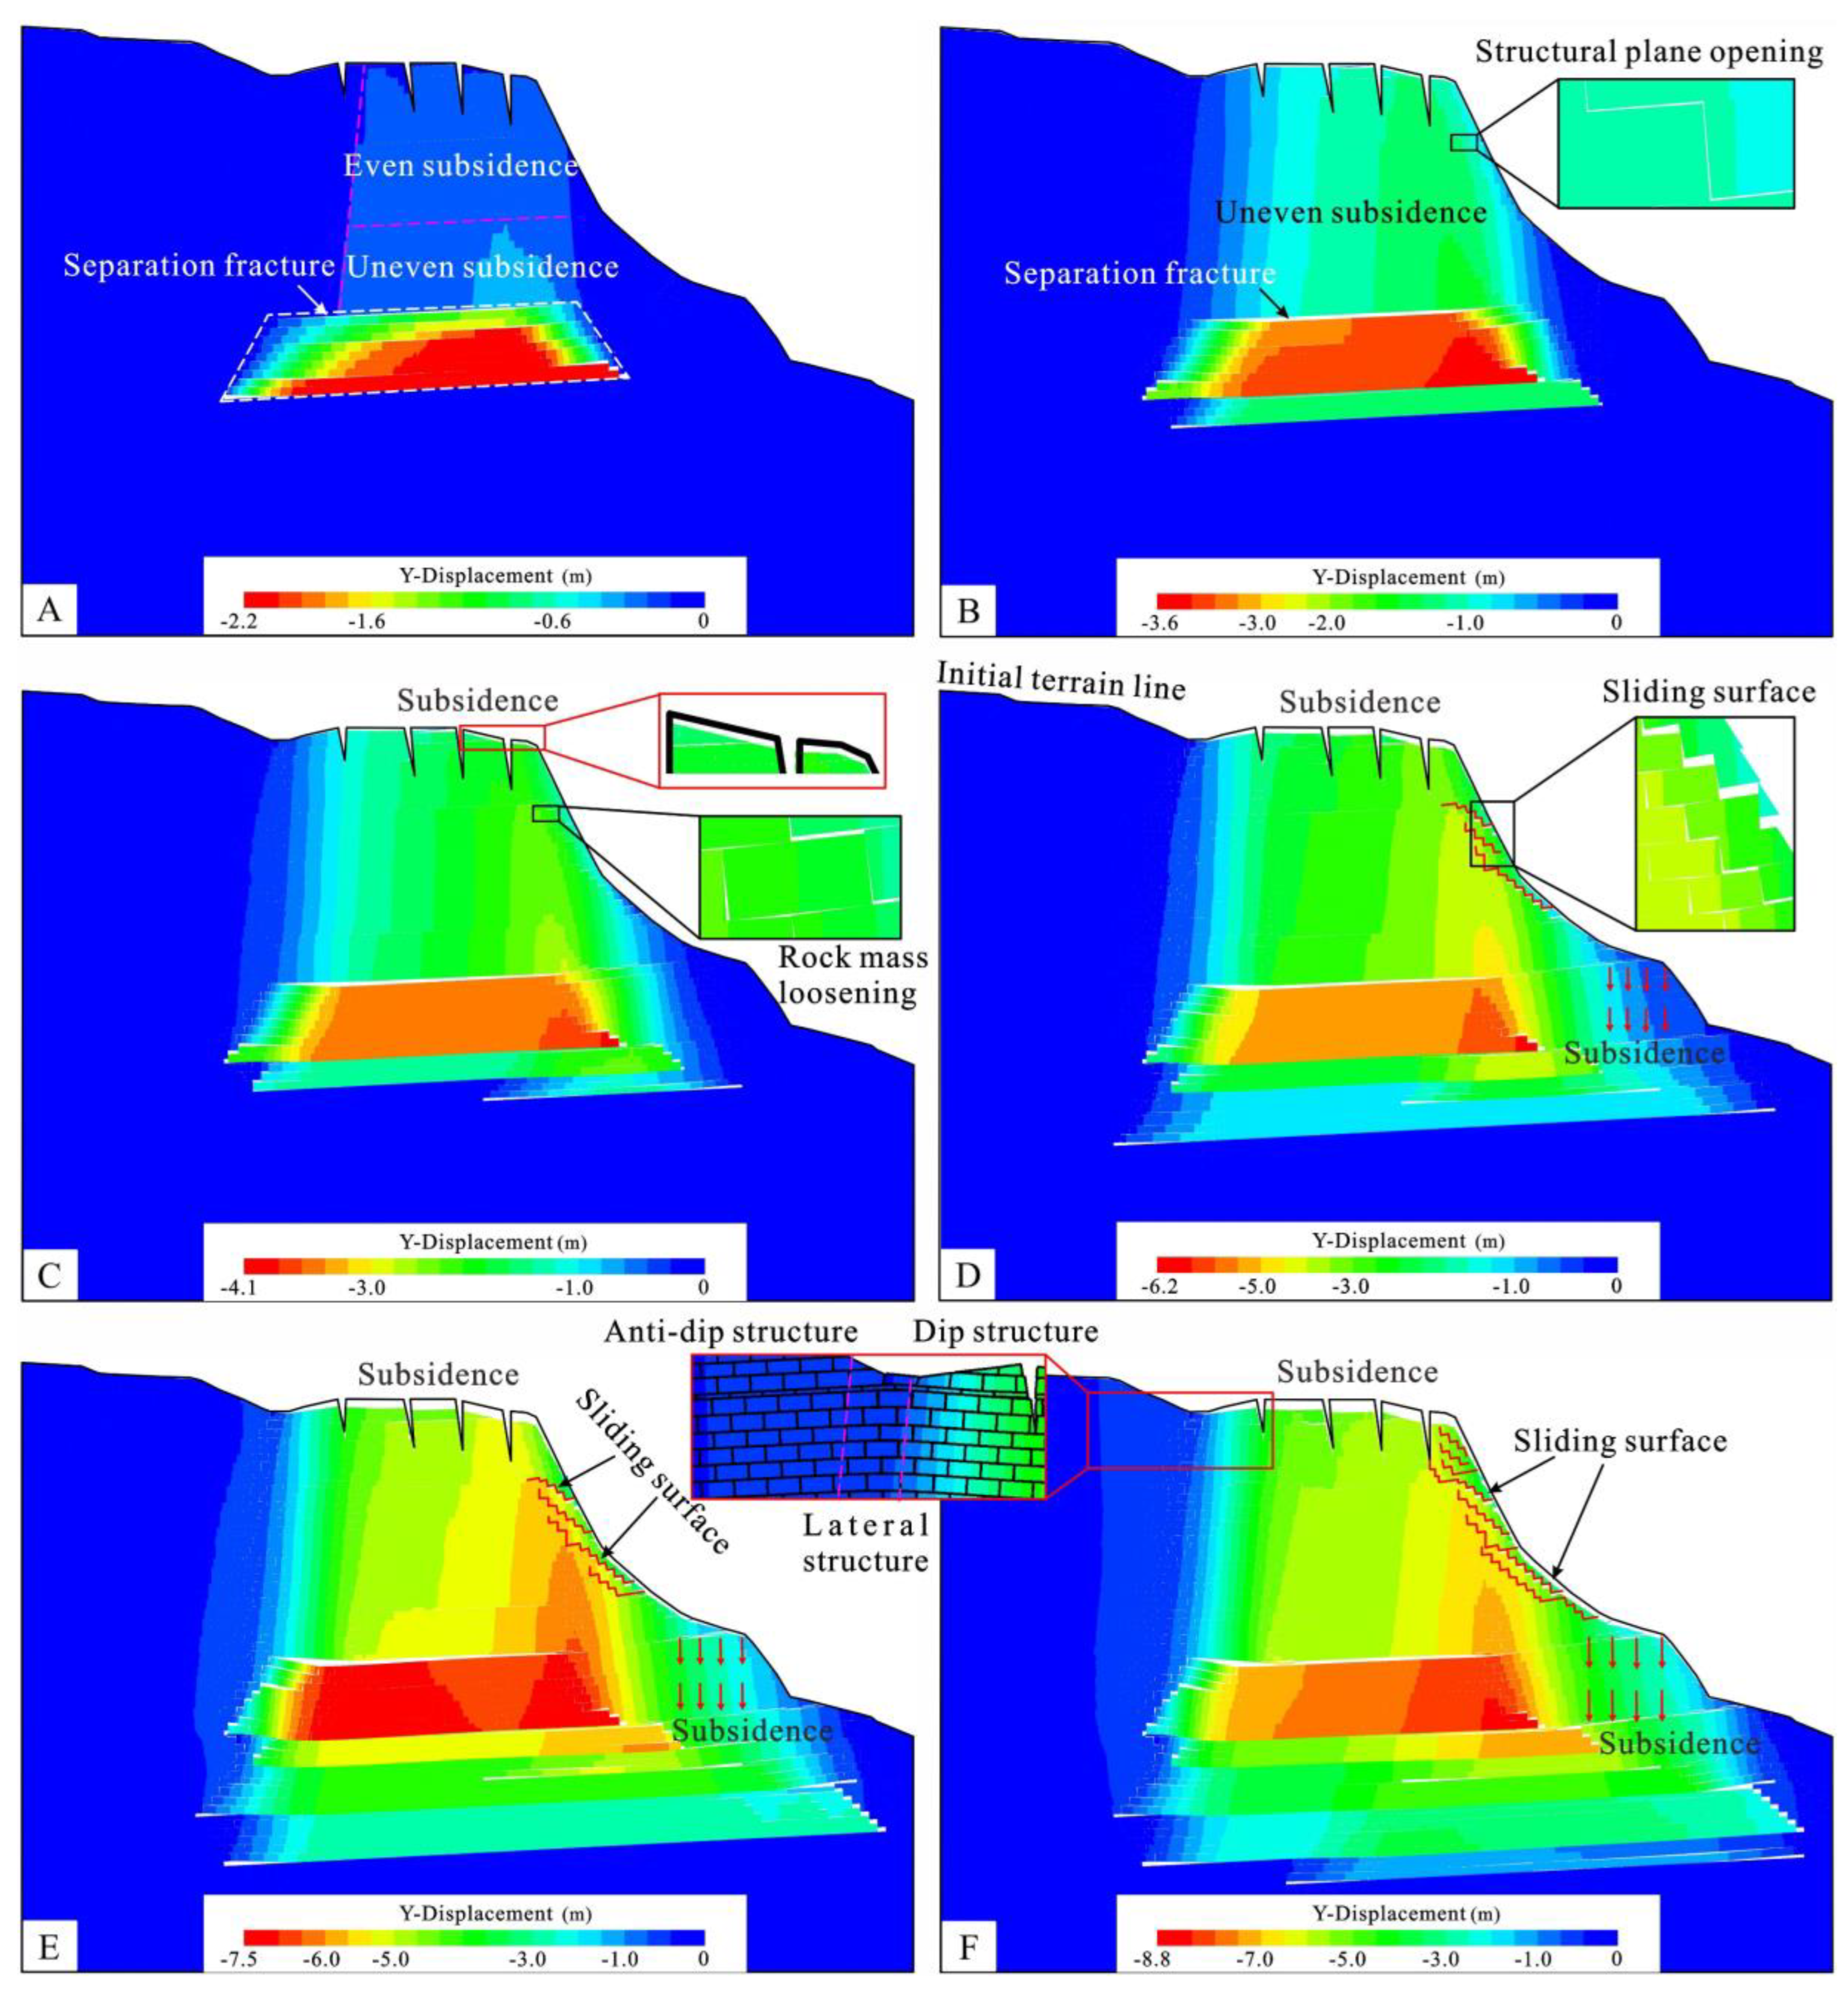
3.2. Failure Characteristics of Strata Overlying the Goaf

Figure 14A, Figure 15A and Figure 16A show the section isolines of the apparent resistivity of survey lines II-II′, III-III′, and IV-IV′, respectively. The y-axis is the elevation, and the x-axis is the horizontal distance. Blue represents low resistivity, and red indicates high resistivity. It can be seen that the electrical properties of the underlying strata along the survey lines have a layered distribution. According to the resistivity value, the strata can be divided into two zones, a high resistivity zone and a low resistivity zone. The high resistivity zone is located in the range of 1150–1200 m and has a thickness of 170–200 m. The low resistivity zone is located below the high resistivity zone. Based on the geological profiles (Figure 14B, Figure 15B and Figure 16B), it is speculated that the high resistivity zone is the intercalated sand and mudstone of the Triassic Feixianguan formation (T1f), which is dominated by hard sandstone. The underlying low resistivity zone is the Permian Upper Longtan formation (P3l) coal-measure strata, which are mainly argillaceous siltstone, fine sandstone, mudstone, and coal, and the strength of the rock mass is weak. It should be noted that in the isolines of the apparent resistivity inversion of the three survey lines, there are multiple discontinuous areas above 950–1000 m. We believe that this is mainly caused by subsidence and collapse of the overlying strata due to underground mining, which has led to the formation of a large number of fractures in the overlying rock and an abrupt change in the resistivity value. The vertical line that connects these discontinuous points is presumed to be a longitudinal fracture in the overlying rock, and the spatial development is uneven.
Figure 14A shows that the longitudinal fractures are mainly developed between measuring points 75 and 175 and between points 375 and 450. The fractures between measuring points 75 and 175 penetrate from the top of the slope through the Feixianguan formation and Longtan formation coal-measure strata, exhibiting the characteristics of deep and large longitudinal fractures. The fractures between measuring points 375 and 450 are only developed in the coal-measure strata and do not reach the surface area. According to the geological profile shown in Figure 14B, the deep and large longitudinal fracture at measuring point 175 is the main controlling fracture in the rear edge of the slope, and the deep and large longitudinal fractures between measuring points 75 and 90 indicate continuous movement of the rear edge towards the top of the slope.
Figure 15A shows that the longitudinal fractures are mainly developed between measuring points 75 and 400 and between points 500 and 525. The longitudinal fractures between points 75 and 400 penetrate from the top of the slope through the Feixianguan Formation and Longtan formation coal-measure strata, exhibiting the characteristics of deep and large longitudinal fractures. The longitudinal fractures between measuring points 500 and 525 are only developed in the deep coal-measure strata and do not reach the surface area. According to the geological profile shown in Figure 15B, the deep and large longitudinal fractures between points 200 and 225 are the main controlling fractures in the rear edge of the slope, and the deep and large longitudinal fractures between points 375 and 400 are the main controlling fractures in the foot of the slope. The deep longitudinal fractures between points 75 and 100 are a precursor to the continuous movement of the rear edge towards the top of the slope.
Figure 16A shows that the longitudinal fractures are mainly developed between measuring points 125 and 375 and between points 525 and 550. The longitudinal fractures between points 125 and 375 penetrate from the top of the slope through the Feixianguan formation and Longtan formation coal-measure strata, exhibiting the characteristics of deep and large longitudinal fractures. The longitudinal fractures between points 525 and 550 are only developed in the deep coal-measure strata and do not reach the surface area. According to the geological profile shown in Figure 16B, the deep and large longitudinal fractures between points 125 and 150 are the main controlling fractures in the rear edge of the slope, and the fractures between points 350 and 375 are the main controlling fractures in the foot of the slope. The fractures between points 225 and 250 are distributed in the slope surface of the landslide body.
In addition, the section isolines of the apparent resistivity of the three survey lines show that there are two obvious low-resistivity anomaly zones (dark blue areas) in the coal-measure strata. The coal-measure strata are vertically divided into high-low-high-low layers. According to the geological profiles shown in Figure 14B, Figure 15B and Figure 16B, it can be concluded that the low resistivity anomaly zone is mainly the goaf and the intercalated sandstone and mudstone area, which contains many fractures. Due to the downward flow of surface water and/or groundwater along the fractures, the intercalated sandstone and mudstone area and the goaf are filled with water. As a result, the electrical conductivity is higher and the resistivity is significantly lower than those of the surrounding medium, i.e., they form low resistivity anomalies.

3.3. Deformation Response Characteristics of the Mountain

3.3.1. Stress and Strain Evolution

Before the underground mining, the rock strata were in a state of compressive stress equilibrium. After mining, the stress state of the overlying strata was readjusted [39]. During underground mining, there is obvious stress concentration in some areas of the overlying strata, and the stress difference between the different areas is large. Hence, the changes in the stress in some areas is not significant. In order to illustrate the stress changes in the entirety of the overlying strata, the stress change range was limited to [−1, 1] MPa in this study. Figure 17A shows that when coal seam M1 was mined, the overlying strata in the upper part of the goaf were unloaded, and the entire seam was in the stress reduction zone. In particular, the overlying rock near the goaf rapidly changed from a compressive stress state to a tensile stress state, whereas the boundaries of the mined seam were in the compressive stress concentration area. Since the compressive stress concentration area on the right side of the goaf of coal seam M1 was close to the foot of the slope, under gravity, compressive shearing strain concentration appeared in the argillaceous soft rock area at the foot of the slope first, with a maximum value of 4.8 × 10⁻² MPa (Figure 18A). With the progressive mining of coal seams M3, M5−2, M5−3, and M7, the range of the stress-reducing area in the overlying strata expanded from bottom to top towards the top of the slope and the free face. Tensile and shear strain concentration appeared in the argillaceous soft rock area near the fissure’s tip and the slope surface (Figure 18B–E). When coal seam M10 was mined, the strata overlying the goaf were in a tensile stress state (Figure 17B). The increase in the tensile stress range caused the relatively independent shear strain concentration areas at the fissure’s tip and the slope surface to connect to each other, and the rock mass at the front of the slope experienced large-scale tensile shear failure. It should be noted that under the continuous subsidence and compression of the overlying strata, the weak mudstone area at the foot of the slope experienced a larger range of compressive shearing strain concentration, which was connected with the weak coal seam on the right side of the goaf of M1 and M3 (Figure 18F). With the continuous mining of the deep coal seams, the shear strain concentration areas at the top, surface, and foot of the slope became connected, and the overall stability of the slope decreased dramatically.

3.3.2. Fracture Propagation

Mining activities can not only cause the roof to bend and shift position but can also lead to the formation of two types of fractures in the strata above the goaf: (1) horizontal separation fractures form between the layers of the strata, and (2) longitudinal fractures form due to opening of the dominant joints perpendicular to the seams. These two types of fractures become interconnected to form a water-conducting fractured zone (WCFZ), including two types of zones, i.e., a caved zone and a fracture zone [40]. It should be noted that during underground mining, the overburden fractures induced by mining of the lower coal seam will extend to the strata overlying the goaf of the already-mined upper seams [41]. Figure 19 shows the evolution of the fractures in the overlying strata under underground mining conditions. When coal seam M1 was mined, the roof of the overlying rock adjacent to the goaf collapsed first and filled the goaf, forming an inverted trapezoidal caved zone. Different from the fracture propagation in the overlying strata during mining in plain areas [42], in this study, it was found that the fractures on two sides of the goaf propagated asymmetrically. First, the upward fracture ① propagated from the right side of the goaf to the inside of the slope, with a propagation angle of about 65°. As a result, a WCFZ with a height of 82 m was formed. Although the WCFZ did not reach the top of the slope in this mining stage, some areas at the top and foot of the slope exhibited structural plane opening (Figure 19A). With the advancement of the working face of coal seam M3, fracture zone ① continued to propagate upward and reached the top of the slope. At this time, the height of WCFZ reached a maximum value of 172 m. In addition, two more fracture zones (② and ③) formed near the left boundary of the goaf. These two fracture zones did not penetrate to the top of the slope, yet the extension direction of the structural planes in the top part of the mountain opened, and the fractures propagated to the goaf, that is, there were downward fractures (Figure 19B). When M5−2 and M5−3 were mined, the caved zone in the overlying strata continuously extended deeper, but the fracture zone above it reached the top of the slope and its height remained unchanged. We found that the overlying strata within the fracture zone exhibited an increasing degree of deformation, fracture zone ① gradually covered the free face of the entire slope, and fracture zones ② and ③ gradually reached the top of the slope. In addition, fracture zone ④ was formed (Figure 19C,D). With the mining of coal seams M7 and M10, fracture zones ①–④ all penetrated from the goaf to the top of the slope, forming steep and deep fractures parallel to the slope. Moreover, the strata overlying the goaf became more fragmented, especially in the free face area where the all of the rock was damaged (Figure 19E,F). This is consistent with the geophysical inversion results in terms of the structure of overlying strata and the fracture development (Figure 14, Figure 15 and Figure 16), and the surface deformation survey data, which showed that there were a large number of NW-trending cracks parallel to the free face at the top of the slope and that the rock mass on the slope was fragmented (Figure 12).

3.3.3. Deformation Response

The emergence of the pressure unloading space in the goaf after mining led to changes in the initial layered displacement field of the overlying strata, and the overlying strata underwent subsidence and deformation from bottom to top [43]. Under continuous underground mining, the subsidence of the overlying strata in the different areas changed dynamically. In the horizontal direction, the rock mass protruded out of the slope, and the range of protrusion and displacement increased continuously. When coal seam M1 was mined, the direct roof of the goaf separated and collapsed first, resulting in uneven subsidence of the overlying strata near the caved zone. However, the subsidence of the overlying strata near the top of the slope was uniform (Figure 20A). After coal seam M3 was mined, the area impacted by the subsidence further expanded to the top and the slope surface. At this time, all of the overlying strata were completely within the non-uniform subsidence area, and the structural planes of the hard sandstone gradually opened (Figure 20B). After coal seams M1 and M3 were mined, the areas with the largest amount of deformation in the horizontal direction were located near the boundaries of the goaf (Figure 21A,B). After coal seam M5−2 was mined, the working face of which spanned the slope shoulder area, the stability of the slope was greatly affected [44]. Specifically, the top of the slope subsided significantly, with a range of 1.5–2 m (Figure 20C). The area of soft argillaceous rock on the slope surface underwent a large amount of horizontal displacement (Figure 21C), and the structural planes of the hard sandstone opened further, indicating a loosening of the rock mass. Due to the long working face of coal seam M5−3, which spanned the shoulder and foot areas, the subsidence at the top continued to increase vertically and micro-subsidence began to appear in the foot area (Figure 20D). In the horizontal direction, the overlying strata near the free face underwent a large amount of horizontal displacement toward the outside of the slope (Figure 21D). The above subsidence and horizontal displacement caused the initial structural plane opening of the hard sandstone to connect to the soft argillaceous rock area, forming a stepped slip surface. With the mining of the coal seams M7 and M10, the uneven vertical subsidence and horizontal displacement at the top, surface, and foot of the slope continued to increase, resulting in continuous opening of the hard structural plane, which was interconnected with the soft argillaceous rock layer. The number of slip surfaces increased continuously (Figure 20E,F and Figure 21E,F). In particular, after coal seam M10 was mined, the uneven subsidence of the overlying strata was aggravated, and the stratigraphic structure of the slope changed significantly. Outside of the left boundary of the goaf, the stratigraphic structure remained unchanged, i.e., it retained the original anti-dip structure. After the transition of the lateral stratigraphic structure, the overlying strata on the right were inclined toward the outside of the slope, i.e., a dip structure (Figure 20F). This is consistent with the findings of the surface deformation survey (Figure 13H).
After the six coal seams were mined, the top of the slope moved downward significantly along the deep and large fractures. As is shown in Figure 22, there were vertical displacements (H1 and H2) between monitoring points 2 and 3 and points 3 and 4 at the top of the slope. Vertical displacements H1 and H2 were 2.1 m and 3.2 m, respectively. The maximum subsidence at the top of the slope reached 6 m, which is consistent with the signs of deformation, i.e., multiple collapse scarps, observed during the surface deformation survey (Figure 12A–D). In the horizontal direction (Figure 21 and Figure 23), the rock mass on the free face in the lower part of the slope moved horizontally toward the outside of the slope during the mining of the six coal seams, and the displacement increased sequentially, with a maximum horizontal displacement of 0.55 m, indicating slip failure towards the outside of the slope. The rock mass on the free face at the top moved horizontally toward the inside of the slope, with a maximum displacement of 0.26 m, indicating toppling failure towards the inside of the slope. This is characteristic of the typical lower part slipping and upper part toppling failure mode. It is notable that the current vertical and horizontal displacements are still in a non-convergence state. As the underground mining continues to advance, the Faer slope will continue to deform.

4. Discussion

4.1. Evolution Process

The underground mining often causes stress redistribution in the strata [15]. As the stress field continues to pass upwards from the goaf, the strain state in different regions of the soft–hard alternant mountain will also change dramatically. There is often a concentration of compressive shearing strain in the soft argillaceous rock area at the foot of the slope, and a concentration of tensile shearing strain at the fissure’s tip at the top of the slope, and in the soft argillaceous rock area on the slope surface. These areas will become potential slip surfaces. The change and transfer of stress and strain in the mountain will also cause fracture initiation, propagation and coalescence, as well as the breaking of the intact rock bridge [45]. Some studies have shown that in the karst mountainous area in Southwest China, the existence of deep and large karst fissures at the top of the slope largely determines the extension direction of the tension cracks and the location of the slope body cracking [22,46]. Actually, the propagation mode of the mining-induced fractures in the overlying strata also has certain rules, that is, they propagate asymmetrically in the two sides of the goaf (in the free face of the goaf first). In the vertical direction, the fractures propagate upward and downward simultaneously, forming a number of steeply dipping, deep and large fractures parallel to the slope surface. It is worth noting that the continuous propagation of fractures is also a process of gradual damage and deterioration of the strata strength of the mountain. In addition, the underground mining results in the formation of two types of displacement fields: uneven vertical subsidence, and horizontal protrusion of the overlying strata, and the uneven vertical subsidence will change the initial stratigraphic structure of the strata and significantly reduced the mountain’s stability (Figure 20F). Relevant studies have also shown that mining in hilly and mountainous terrains usually leads to the cracking of the overburden materials and increases the potential of slope failure, mainly due to the additional subsidence effects of the sloping ground [43].
Based on the characteristics of the stress field, strain field, fracture propagation, and deformation response of the rock mass under underground mining, the evolution process of the Faer landslide can be divided into four stages. (1) The free face of the slope was damaged via cracking. After coal seams M1 and M3 were mined, the emergence of the pressure unloading space in the goaf caused tensile deformation of the structural plane. The fractures propagated upward first, and the overlying strata underwent uneven subsidence from bottom to top. Deep and large longitudinal fractures formed in the free face area, and the slope entered a damaged state. At this time, there was a compressive shearing strain concentration area in the soft argillaceous rock area at the foot of the slope, while a tensile shearing strain concentration area was formed at the fissure’s tip at the top of the slope and in the soft argillaceous rock area on the slope surface (Figure 24A). (2) In the overlying strata subsidence and collapse stage, with the continuous mining of coal seam M5−2, the uneven subsidence of the overlying strata increased, and the structural planes of hard sandstone on the slope surface were under tension and loosened. The damaged rock mass at the top experienced tensile shearing failure along the deep and large fractures in the free face area, which caused a collapse of the slope (Figure 24B). (3) In the tensile shearing-backward toppling stage, when deep coal seam M5−3 was mined, the uneven subsidence of the overlying strata increased further. The hard structural planes connected to the soft argillaceous rock layer, forming a stepped slip surface. The weak mudstone layer on the front of the slope experienced tensile shear failure, and the hard sandstone near the free face at the top of the slope experienced backward toppling failure (Figure 24C). (4) In the multi-level sliding stage, during the mining of coal seams M7 and M10, the slope as a whole was in a damaged state. Under the combined action of the continuous uneven subsidence of the overlying strata and the horizontal protrusion from the slope, the soft rocks, such as the mudstone and coal seams, at the foot of the slope underwent compressive shearing deformation. At the same time, the structural planes on the top and the slope surface continued to open and loosen, and the soft argillaceous rock layers underwent shear slipping and became interconnected with each other, forming a multi-level stepped slip surface. The slope experienced multi-level sliding. Currently, the vertical and horizontal movements of the Faer slope have not converged, and InSAR monitoring results have also proved this phenomenon [23]. With the continuous mining of the deep coal seams, the slip surfaces at the top, slope, and foot of the slope will penetrate, causing large-scale landslides (Figure 24D). Thus, in order to more accurately achieve early warning and preparation for the occurrence of landslide disasters, it is necessary to set up appropriate monitoring program based on the evolution process of the slope, and to monitor the dynamic deformation characteristics of the key areas using interferometric synthetic aperture radar (InSAR) combined with machine learning algorithms and some slope instability probability models [47,48,49,50,51].

4.2. Formation Mechanism

In the previous studies, the mountain strata were often considered as layered rock mass, ignoring the influence of the structural plane of the rock mass and the weak rock formation on the stability of the mountain [52,53]. The actual research shows that during the underground mining process, the overlying strata of the goaf often crack along the structural planes, which is manifested as tensile loosening of the structural planes of the hard sandstone and shear slipping of the soft mudstone layer. They penetrate each other to form a stepped slip surface. In the case of a coal mining-induced landslide at Nattai North, Australia, it was also found that the mining induced stresses led to the shear and compressive failure of weak strata at the escarpment base, particularly around its toe, and the failure of the weak strata at the toe of the escarpment initiated the simultaneous forward sliding and toppling of the rock column [43].
The slope as a whole was in a state of compressive stress equilibrium before the mining under its self-weight [54]. However, under the underground mining conditions, there were obvious synergistic changes in the stress and strain fields, fracture propagation, and displacement response of the Faer slope. Specifically, during the underground mining, the stresses in the surrounding rock were readjusted, and the compressive stress of the overlying strata decreased and changed from an initial compressive state to a tensile stress state. The tensile stress caused the direct roof of the goaf to loosen and collapse. As a result, the hard structural plane of the overlying strata opened, the fractures propagated asymmetrically upward and downward, and thus, the whole overlying strata entered a damaged state. Due to the uneven subsidence of the overlying strata, deep and large longitudinal fracture zones were formed and collapse scarps appeared. Moreover, the slope protruded horizontally, and the stratigraphic structure of the slope changed. Eventually, a multi-level stepped slip surface was formed. These results are consistent with the observations of the surface deformation survey and geophysical detection. Therefore, the mechanism of the landslides in the gently dipping soft–hard alternant strata induced by underground mining can be summarized as follows: (1) loosening and collapse of the goaf roof, (2) fracture propagation in the overlying strata, (3) damage to the overlying strata, (4) tensile shear fracturing in the top, (5) subsidence of the overlying strata, (6) horizontal displacement on the free face, (7) structural planes of the hard sandstone opening and penetration under tension, (8) tensile shearing of the weak mudstone on the slope surface, (9) backward toppling of the rock mass at the top, (10) compressive shear failure of the soft rock at the foot of the slope, (11) formation of a stepped slip surface, and (12) global instability.

5. Conclusions

In this study, based on UAV photography, a surface deformation survey, geophysical detection, and numerical simulation, we analyzed the formation mechanism of the landslides in gently dipping soft–hard alternant strata induced by underground mining. The main conclusions of this study are as follows.
(1)
The mining-induced fractures in the overlying strata propagated asymmetrically in the two sides of the goaf (in the free face of the goaf first). All of the strata were in a damaged state, which provided the geological structure for future landslides.
(2)
The underground mining resulted in the formation of two types of displacement fields: uneven vertical subsidence and horizontal protrusion of the overlying strata. The subsidence and protrusion led to tensile loosening of the structural planes of the hard sandstone and shear slipping of the soft mudstone layer. They penetrated each other to form a stepped slip surface.
(3)
Under the periodic influence of underground mining, the mountain containing gently dipping soft–hard alternant strata underwent the following progressive failure modes: (1) loosening and collapse of the goaf roof, (2) fracture propagation in the overlying strata, (3) damage to the overlying strata, (4) tensile shear fracturing in the top, (5) subsidence of the overlying strata, (6) horizontal displacement on the free face, (7) structural planes of hard sandstone opening and penetration under tension, (8) tensile shearing of the weak mudstone on the slope surface, (9) backward toppling of the rock mass at the top, (10) compressive shearing failure of soft rock at the foot of the slope, (11) formation of a stepped slip surface, and (12) global instability.
In addition, for landslide disasters induced by anthropogenic factors such as underground mining, it is necessary to combine geotechnical survey, UAV photography, geophysical detection, InSAR monitoring, numerical analysis, and machine learning technology, which can be compared to verify the obtained results, in order to accurately formulate disaster prevention and mitigation strategies. It is worth noting that in the numerical simulation of this study, the slope is simplified as a two-dimensional geological body. In fact, the slope itself is a three-dimensional geological body structure. Considering the three-dimensional force of the slope will be more suitable for the actual conditions. Therefore, in the future, based on the 3D terrain data of the slope, it is feasible to use 3DEC software to build a 3D numerical model and analyze the impact of different mining stages on the stability of the mountain, which is feasible for improving the simulation accuracy and reliability.

Author Contributions

All authors contributed extensively to the present paper. Conceptualization and writing, J.L.; methodology and writing, B.L.; formal analysis and validation, K.H.; data curation, Y.G.; software, J.W.; investigation, W.W. and H.Z. All authors have read and agreed to the published version of the manuscript.

Funding

This research was funded by the National Key R&D Program of China, grant number 2018YFC1504806 and the National Science Foundation of China, grant number 42177172.

Acknowledgments

We would like to express our sincere thanks to many people whose efforts were involved in the data collection and investigation of this study. We are grateful to administrative and technical staff of the Department of Natural Resources of Guizhou Province, to Wu, Junjie, Deng, Xiaohong, Wang, Xingchun, and Zhi, Qingquan, the Institute of Geophysical and Geochemical Exploration, the Chinese Academy of Geological Sciences, for providing the technical support in geophysical exploration, to Zhao, Chaoying and Ren, Chaofeng, Chang’an University, for providing the UAV data. We also express our appreciation of the constructive comments provided by the anonymous reviewers, which was greatly beneficial for the quality of the manuscript.

Conflicts of Interest

The authors declare no conflict of interest.

References

  1. Yilmaz, I.; Marschalko, M. A leaning historical monument formed by underground mining effect: An example from Czech Republic. Eng. Geol. 2012, 133, 43–48. [Google Scholar] [CrossRef]
  2. Salmi, E.F.; Nazem, M.; Karakus, M. The effect of rock mass gradual deterioration on the mechanism of post-mining subsidence over shallow abandoned coal mines. Int. J. Rock Mech. Min. Sci. 2017, 91, 59–71. [Google Scholar] [CrossRef]
  3. Krahn, J.; Morgenstern, N.R. Mechanics of the Frank slide. In Rock Engineering for Foundations and Slopes; ASCE: Reston, VA, USA, 1976; Volume 309. [Google Scholar]
  4. Bentley, S.P.; Siddle, H.J. Landslide research in the South Wales coalfield. Eng. Geol. 1996, 43, 65–80. [Google Scholar] [CrossRef]
  5. Yang, S.; Zhang, J.; Yang, T. Guizhou Mine Geological Environment; Geological Press: Beijing, China, 2012. (In Chinese) [Google Scholar]
  6. Yang, J.; Nie, H.; Jing, Q. Preliminary analysis of mine geo-environment status and existing problems in China. Remote Sens. Land. Resour. 2017, 29, 1–7. (In Chinese) [Google Scholar]
  7. Liu, C.; Guo, Q.; Chen, H. Preliminary analysis on the causes of collapse of Yanjiao village in Nayong County, Guizhou Province. Chin. J. Geol. Hazard Control 2004, 15, 123–144. (In Chinese) [Google Scholar]
  8. Zhao, J.; Ma, Y.; Lin, B.; Lan, Z.; Shi, W. Study on the geomechanical model of the formation of the gentle anti-dip mining landslide-Taking the Madaling landslide in Guizhou Province as an example. Chin. J. Rock Mech. Eng. 2016, 35, 2217–2224. (In Chinese) [Google Scholar]
  9. Dong, X.; Pei, X.; Huang, R. The Longchangzhen collapse in Kaili, Guizhou: Characteristics and failure causes. Chin. J. Geol. Hazard Control 2015, 26, 3–9. (In Chinese) [Google Scholar]
  10. Chen, L.; Zhao, C.; Kang, Y.; Chen, H.; Yang, C.; Li, B.; Liu, Y.; Xing, A. Pre-event deformation and failure mechanism analysis of the Pusa Landslide, China with multi-sensor SAR imagery. Remote Sens. 2020, 12, 856. [Google Scholar] [CrossRef] [Green Version]
  11. Li, B.; Feng, Z.; Zhang, Q.; Zhao, C.; Yan, J.; Gao, Y. Researches on Formation Modes and Early Identification of Mega-Landslides in the Mountainous Karst Areas; Science Press: Beijing, China, 2016. (In Chinese) [Google Scholar]
  12. Ayen, O.A.; Iik, Y.; Mustafa, Y. A short review on the surficial impacts of underground mining. Sci. Res. Essays 2010, 5, 3206–3212. [Google Scholar]
  13. Grenon, M.; Caudal, P.; Amoushahi, S.; Turmel, D.; Locat, J. Analysis of a large rock slope failure on the east wall of the Lab Chrysotile mine in Canada: Back analysis, impact of water infilling and mining activity. Rock Mech. Rock Eng. 2016, 50, 403–418. [Google Scholar] [CrossRef]
  14. Benko, B.; Stead, D. The Frank slide: A reexamination of the failure mechanism. Can. Geotech. J. 1998, 35, 299–311. [Google Scholar] [CrossRef]
  15. Marschalko, M.; Yilmaz, I.; Bednarik, M.; Kubecka, K. Influence of underground mining activities on the slope deformation genesis: Doubrava Vrchovec, Doubrava Ujala and Staric case studies from Czech Republic. Eng. Geol. 2012, 147, 37–51. [Google Scholar] [CrossRef]
  16. Huang, R.; Chan, L. Human-induced landslides in China: Mechanism study and its implications on slope management. Chin. J. Rock Mech. Eng. 2004, 23, 2766–2777. (In Chinese) [Google Scholar]
  17. Li, B.; Feng, Z.; Wang, G.; Wang, W. Processes and behaviors of block topple avalanches resulting from carbonate slope failures due to underground mining. Environ. Earth Sci. 2016, 75, 694. [Google Scholar] [CrossRef]
  18. He, K.; Yin, Y.; Li, B.; Chen, C. The mechanism of the bottom-crashing rockfall of a massive layered carbonate rock mass at Zengziyan, Chongqing, China. J. Earth Syst. Sci. 2019, 128, 104. [Google Scholar] [CrossRef] [Green Version]
  19. Zhao, J.; Xiao, J.; Xiang, X.; Huang, R.; Wang, Y.; Shi, W. Failure mechanism numerical simulation of mining landslide with gentle bedding coal strata. J. China Coal Soc. 2014, 39, 424–429. (In Chinese) [Google Scholar]
  20. Lin, F.; Wu, L.Z.; Huang, R.Q.; Zhang, H. Formation and characteristics of the Xiaoba landslide in Fuquan, Guizhou, China. Landslides 2017, 15, 669–681. [Google Scholar] [CrossRef]
  21. Shi, W.; Yu, X.; Sherizadeh, T.; Sunkpal, M.; Wang, X.; Kulatilake, P.H.S.W. Deformation and failure mechanism of a collapse induced by underground mining—A study of the Pusa collapse in Guizhou Province of China. In Proceedings of the 53rd US Rock Mech/Geomech Symp, New York, NY, USA, 23–26 June 2019. [Google Scholar]
  22. Yang, Z.; Zhao, Q.; Liu, X.; Yin, Z.; Zhao, Y.; Li, X. Experimental study on the movement and failure characteristics of karst mountain with deep and large fissures induced by coal seam mining. Rock Mech. Rock Eng. 2022, 55, 4839–4867. [Google Scholar] [CrossRef]
  23. Chen, L.; Zhao, C.; Li, B.; He, K.; Ren, C.; Liu, X.; Liu, D. Deformation monitoring and failure mode research of mining-induced Jianshanying landslide in karst mountain area, China with Alos/Palsar-2 images. Landslides 2021, 18, 2739–2750. [Google Scholar] [CrossRef]
  24. Li, M.; Jiang, B.; Lin, S.; Chen, W.; Zhang, G. Response of coal seam deformation to structural evolution in Faer mining area, western Guizhou Province. J. China Coal Soc. 2011, 36, 1668–1673. (In Chinese) [Google Scholar]
  25. Su, W.; Zhang, M.; Bian, D.; Liu, Z.; Huang, J.; Wang, W.; Xu, J.; Guo, H. Phenotyping of corn plants using unmanned aerial vehicle (UAV) images. Remote Sens. 2021, 11, 2021. [Google Scholar] [CrossRef] [Green Version]
  26. Zaman-Allah, M.; Vergara, O.; Araus, J.; Tarekegne, A.; Magorokosho, C.; Zarcotejada, P.; Hornero, A.; Albà, A.; Das, B.; Craufurd, P.; et al. Unmanned aerial platform-based multi-spectral imaging for field phenotyping of maize. Plant Methods 2015, 11, 1–10. [Google Scholar] [CrossRef] [PubMed] [Green Version]
  27. Hatherly, P. Overview on the application of geophysics in coal mining. Int. J. Coal Geol. 2013, 114, 74–84. [Google Scholar] [CrossRef]
  28. GOŁĘBIOWSKI, T.; PIWAKOWSKI, B.; ĆWIKLIK, M. Application of Complex Geophysical Methods for the Detection of Unconsolidated Zones in Flood Dikes. Remote Sens. 2022, 14, 538. [Google Scholar] [CrossRef]
  29. Liang, S.; Sun, S.; Lu, H. Application of airborne electromagnetics and magnetics for mineral exploration in the Baishiquan–Hongliujing area, northwest China. Remote Sens. 2021, 13, 903. [Google Scholar] [CrossRef]
  30. Joung, I.S.; Nam, M.J.; Kim, B.; Jeong, J.; Jeong, S.; Jang, H.; Cho, S.O. A Review of the Time-domain Electromagnetic Method: Research Trends and Applications. J. Korean Soc. Miner. Energy Resour. Eng. 2022, 2022, 364–378. [Google Scholar] [CrossRef]
  31. Do, T.N.; Wu, J. Simulating a mining-triggered rock avalanche using DDA: A Case study in Nattai North, Australia. Eng. Geol. 2020, 264, 105386. [Google Scholar] [CrossRef]
  32. Lana, M.S. Numerical modeling of failure mechanisms in phyllite mine slopes in Brazil. Int. J. Min. Sci. Technol. 2014, 24, 777–782. [Google Scholar] [CrossRef]
  33. Itasca. Universal Distinct Element Code, udec 7.0; Itasca Consulting Group: Minneapolis, MN, USA, 2018. [Google Scholar]
  34. Cui, F.; Li, B.; Xiong, C.; Yang, Z.; Peng, J.; Li, J.; Li, H. Dynamic triggering mechanism of the Pusa mining-induced landslide in Nayong County, Guizhou Province, China. Geomat. Nat. Hazards Risk 2022, 13, 123–147. [Google Scholar] [CrossRef]
  35. Feng, Z.; Li, B.; Yin, Y.; He, K. Rockslides on limestone cliffs with subhorizontal bedding in the southwestern calcareous area of China. Nat Hazards. Earth Syst. Sci. 2014, 14, 2627–2635. [Google Scholar]
  36. Li, Z.; Xue, Y.; Li, S.; Zhang, L.; Wang, D.; Li, B.; Zhang, W.; Ning, K.; Zhu, J. Deformation features and failure mechanism of steep rock slope under the mining activities and rainfall. J. Mt. Sci. 2017, 14, 31–45. [Google Scholar] [CrossRef]
  37. Liu, Q.; Zhao, G.; Qian, H.; Zhao, J.; Yu, J. Discussion of easily confused nomenclatures and problems in geologic disaster numerical simulation study on deformation law of overlying rock under multi-level coal mining with slowly inclined slope. Guizhou Geol. 2019, 36, 366–374. (In Chinese) [Google Scholar]
  38. Dong, J.; Li, H.; Wang, Y.; Zhang, Y. Characteristics and monitoring-based analysis on deformation mechanism of Jianshanying landslide, Guizhou Province, southwestern China. Arab. J. Geosci. 2021, 14, 184. [Google Scholar] [CrossRef]
  39. Kalogirou, E.E.; Tsapanos, T.M.; Karakostas, V.G.; Marinos, V.P.; Chatzipetros, A. Ground fissures in the area of Mavropigi Village (N. Greece): Seismotectonics or mining activity? Acta Geophys. 2014, 62, 1387–1412. [Google Scholar] [CrossRef]
  40. Mondal, D.; Roy, P.N.S.; Kumar, M. Monitoring the strata behavior in the destressed zone of a shallow Indian longwall panel with hard sandstone cover using mine-microseismicity and borehole televiewer data. Eng. Geol. 2020, 271, 105593. [Google Scholar] [CrossRef]
  41. Li, J.; Li, B.; Gao, Y.; Cui, F.; He, K.; Li, J.; Li, H. Mechanism of overlying strata migration and failure during underground mining in the mountainous carbonate areas in southwestern China. Front. Earth Sci. 2022, 10, 874623. [Google Scholar] [CrossRef]
  42. Turney, J.E.; Amundson, A.l.; Greenman, C.; Stover, B.K. Subsidence above Inactive Coal Mines: Information for the Homeowner; Colorado Division of Reclamation, Mining and Safety: Denver, CO, USA; The Colorado Geological Survey, Department of Natural Resources: Golden, CO, USA, 2009.
  43. Fathi Salmi, E.; Nazem, M.; Karakus, M. Numerical analysis of a large landslide induced by coal mining subsidence. Eng. Geol. 2017, 217, 141–152. [Google Scholar] [CrossRef]
  44. Zhao, J.; Wan, X.; Shi, Y.; Wei, J.; Min Lee, L. Deformation behavior of mining beneath flat and sloping terrains in mountainous areas. Geofluids 2021, 2021, 6689966. [Google Scholar]
  45. Li, L.; Tang, C.; Zhao, X.; Cai, M. Block caving-induced strata movement and associated surface subsidence: A numerical study based on a demonstration model. Bull. Eng. Geol. Environ. 2014, 73, 1165–1182. [Google Scholar] [CrossRef]
  46. Yang, Z.; Jiang, Y.; Li, B.; Gao, Y.; Liu, X.; Zhao, Y. Study on the mechanism of deep and large fracture propagation and transfixion in karst slope under the action of mining. J. Geomech. 2020, 26, 459–470. (In Chinese) [Google Scholar]
  47. Huang, F.; Cao, Z.; Guo, J.; Jiang, S.; Li, S.; Guo, Z. Comparisons of heuristic, general statistical and machine learning models for landslide susceptibility prediction and mapping. Catena 2020, 191, 104580. [Google Scholar] [CrossRef]
  48. Chang, Z.; Du, Z.; Zhang, F.; Huang, F.; Chen, J.; Li, W.; Guo, Z. Landslide Susceptibility Prediction Based on Remote Sensing Images and GIS: Comparisons of Supervised and Unsupervised Machine Learning Models. Remote Sens. 2020, 12, 502. [Google Scholar] [CrossRef]
  49. Huang, F.; Zhang, J.; Zhou, C.; Wang, Y.; Huang, J.; Zhu, L. A deep learning algorithm using a fully connected sparse autoencoder neural network for landslide susceptibility prediction. Landslides 2020, 17, 217–229. [Google Scholar] [CrossRef]
  50. Huang, F.; Cao, Z.; Jiang, S.; Zhou, C.; Huang, J.; Guo, Z. Landslide susceptibility prediction based on a semi-supervised multiple-layer perceptron model. Landslides 2020, 17, 2919–2930. [Google Scholar] [CrossRef]
  51. Jiang, S.; Huang, J.; Griffiths, D.; Deng, Z. Advances in reliability and risk analyses of slopes in spatially variable soils: A state-of-the-art review. Comput. Geotech. 2022, 141, 104498. [Google Scholar] [CrossRef]
  52. Salmi, E.; Hosseinzadeh, S. Slope stability assessment using both empirical and numerical methods: A case study. Bull. Eng. Geol. Environ. 2015, 74, 13–25. [Google Scholar] [CrossRef]
  53. Porathur, J.; Srikrishnan, S.; Verma, C.; Jhanwar, J.; Roy, P. Slope stability assessment approach for multiple seams highwall mining extractions. Int. J. Rock Mech. Min. Sci. 2014, 70, 444–449. [Google Scholar] [CrossRef]
  54. Meng, Z.; Shi, X.; Li, G. Deformation, failure and permeability of coal-bearing strata during longwall mining. Eng. Geol. 2016, 208, 69–80. [Google Scholar] [CrossRef]
Figure 1. Geological setting: (A) the geographical location; (B) topography and landforms of the study area.
Remotesensing 14 06071 g001
Figure 2. (A) Geological structure of the study area and (B) geological structure of the Faer coal mine (1. Jurassic; 2. Triassic; 3. Carboni; 4. Devonian; 5. Permian; 6. Middle-Upper Permian; 7. Lower Permian; 8. City, county; 9. Normal fault; 10. Reverse fault; 11. Anticline; 12. Syncline; 13. Faer landslide; 14. Faer coal mine) (adapted from [24]). Note: The Faer landslide is located within the range of the Farer coal mine. The red frame in Figure 2A is the boundary of the Farer coal mine, and Figure 2B is the enlarged map of the red frame in Figure 2A.
Remotesensing 14 06071 g002
Figure 3. Engineering geological map of the study area (1. Quaternary; 2. Triassic Feixianguan Formation; 3. Permian Longtan Formation; 4. Goaf; 5. Landslide boundary; 6. Anticline; 7. Fault; 8. Surface cracks; 9. Houses; 10. Geological section line; 11. TEM ground survey line).
Remotesensing 14 06071 g003
Figure 4. Geological cross-section of geological section line I-I′ (1. sandstone; 2. mudstone; 3. argillaceous siltstone; 4. Triassic Feixianguan formation; 5. Permian Longtan formation; 6. coal seam; 7. coal seam number; 8. goaf; 9. fractures; 10. initial terrain line; 11. errain line after landslide; 12. sliding surface; 13. deposited material; 14. surface cracks). Note: the geological section line I-I′ is marked with a purple line segment in Figure 3.
Remotesensing 14 06071 g004
Figure 5. Flowchart dealing with the methodology.
Remotesensing 14 06071 g005
Figure 6. (A): E2000S Pegasus UAV used in this study; (B): Aerial survey module E-CAM2000.
Remotesensing 14 06071 g006
Figure 7. Typical geological phenomena controlled by the structural planes: (A) the blocky rock mass; and (B) landslide boundary controlled by structural planes (taken by UAV).
Remotesensing 14 06071 g007
Figure 8. Division of the landslide deformation area (taken by UAV). Zone I and zone II represent two deformation zones. The marked points A–H are the locations of typical deformation areas, and the specific deformation characteristics can be referred to Figures 12 and 13.
Remotesensing 14 06071 g008
Figure 9. PEM system: (A) the transmitting system; (B) the receiving system.
Remotesensing 14 06071 g009
Figure 10. Comparison of the original attenuation curves of the induced electromotive force: (A) survey line II-II′; and (B) survey line IV-IV′).
Remotesensing 14 06071 g010
Figure 11. Two-dimensional discrete element model of the Faer slope.
Remotesensing 14 06071 g011
Figure 14. Surface transient electromagnetic inversion map of survey line II-II′: (A) section isoline of the apparent resistivity; and (B) geological section. (1. Sandstone; 2. Mudstone; 3. Argillaceous siltstone; 4. Coal seam; 5. Coal seam number; 6. Goaf; 7. Stratigraphic boundary; 8. Steep and deep fractures; 9. Fracture and subsidence zone).
Remotesensing 14 06071 g014
Figure 15. Surface transient electromagnetic inversion map of survey line III-III′: (A) section isoline of the apparent resistivity; and (B) geological section. (The legend meanings are shown in Figure 14).
Remotesensing 14 06071 g015
Figure 16. Surface transient electromagnetic inversion map of survey line IV-IV′: (A) section isoline of the apparent resistivity; and (B) geological section. (The legend meanings are shown in Figure 14).
Remotesensing 14 06071 g016
Figure 17. Evolution of stress field under underground mining condition: (A) mining stages I–II; (B) mining stages I–XII. Note: the blue component means compression stress, and magenta means tensile stress.
Remotesensing 14 06071 g017
Figure 18. Evolution of the strain field under underground mining conditions: (A) mining stages I–II; (B) mining stages I–IV; (C) mining stages I–VI; (D) mining stages I–VIII; (E) mining stages I–X; and (F) mining stages I–XII. Note: the blue component that means compression stress, and magenta means tensile stress.
Remotesensing 14 06071 g018
Figure 19. Fracture propagation under underground mining conditions: (A) mining stages I–II; (B) mining stages I–IV; (C) mining stages I–VI; (D) mining stages I–VIII; (E) mining stages I–X; and (F) mining stages I–XII. ①–④ indicate the sequence of formation of the deep and large fractures.
Remotesensing 14 06071 g019
Figure 20. Evolution of vertical displacement under underground mining conditions: (A) mining stages I–II; (B) mining stages I–IV; (C) mining stages I–VI; (D) mining stages I–VIII; (E) mining stages I–X; and (F) mining stages I–XII. Note: the negative values indicate vertical downward displacement.
Remotesensing 14 06071 g020
Figure 21. Evolution of horizontal displacement under underground mining conditions: (A) mining stages I–II; (B) mining stages I–IV; (C) mining stages I–VI; (D) mining stages I–VIII; (E) mining stages I–X; and (F) mining stages I–XII. Note: the positive values indicate horizontal displacement towards the outside of the slope.
Remotesensing 14 06071 g021
Figure 22. Evolution of the vertical displacement in different areas of the slope top after mining stages I–XII.
Remotesensing 14 06071 g022
Figure 23. Evolution of the horizontal displacement of the slope surface during sequential mining stages I–XII.
Remotesensing 14 06071 g023
Figure 24. Schematic diagram of the evolution of the landslide: (A) mining stages I–IV; (B) mining stages I–VI; (C) mining stages I–VIII; and (D) mining stages I–XII. (1. mudstone; 2. coal seam and number; 3. goaf; 4. initial terrain line; 5. fractured and damaged zone; 6. uneven subsidence; 7. separation fracture; 8. terrain line after landslide; 9. multi-level stepped slip surfaces).
Remotesensing 14 06071 g024
Table 1. List of typical landslides induced by underground mining.
No.NameLocationTime of
Occurrence
Volume
(×104 m3)
Damage
1Frank landslide Alberta, Canada1903300076 deaths, and three-quarters of the Frank town was buried
2Aberfan landslideSouth Wales, UK1966-144 deaths, and two schools were destroyed
3Lianziya dangerous rock massYichang, Hubei, China196425Waterway disrupted for 82 years, threatening Yangtze shipping
4Yanchi River landslideYichang, Hubei, China198013076 deaths, and buildings were knocked down
5Nattai landslide Nattai, Australia1983, 19841400Buried land length up to 600 to 1000 m
6Blaencwm landslideSouth Wales, UK1989-Village in valley floor threatened
7Jiguanling landslideChongqing, China199440017 deaths, and the coal mine was destroyed
8Laojinshan landslideYuanyang County, Yunnan199656111 deaths, and 51 mine entrances were buried
9Dündar landslideOrhaneli, Turkish200487828 hectares of farmland was destroyed
10Zengziyan landslideChongqing, China200456Threatening villages, factories and mines, roads and water conservancy projects
11Yanjiao-zhai landslideBijie, Guizhou, China20040.644 deaths, and 12 houses destroyed
12Madaling landslideDuyun, Guizhou, China2006190Large areas of roads and farmland were destroyed
13Pusa landslide Bijie, Guizhou, China20174935 deaths, and parts of Pusa village were destroyed
Table 2. Physical and mechanical parameters of the rock mass.
LithologyDensity (kg·m−3)Bulk Modulus (GPa)Shear Modulus (GPa)Cohesion (MPa)Internal Friction Angle (°)Tensile Strength (MPa)
Sandstone27708.55.83.841.31.7
Mudstone255053.01.0533.20.66
Argillaceous
siltstone
27106.04.71.539.31.0
Coal18005.33.20.6270.2
Publisher’s Note: MDPI stays neutral with regard to jurisdictional claims in published maps and institutional affiliations.

