Abstract
Approximately 3.5 million people in Nicaragua have experienced food insecurity due to the El Niño-Southern Oscillation (ENSO)-induced drought from 2014 to 2016. It is essential to study terrestrial water storage component (TWSC) changes and their responses to ENSO to prevent the water crisis in Nicaragua influenced by ENSO. In this paper, we investigate the TWSC changes in Nicaragua and its sub-basins derived from the Gravity Recovery and Climate Experiment (GRACE)’s temporal gravity field, hydrological model, and water level data, and then determine the connection between the TWSC and ENSO from April 2002 to April 2021 by time series analysis. The research results show that: (1) The estimated TWSC changes in Nicaragua are in good agreement with the variation of precipitation and evaporation, and precipitation is the main cause of TWSC variation. (2) According to the cross-correlation analysis, there is a significant negative peak correlation between the interannual TWSC and ENSO in western Nicaragua, especially for interannual soil moisture (−0.80). The difference in peak correlation between the western and eastern sub-basins may be due to the topographic hindrance of the ENSO-inspired precipitation process. (3) The cross-wavelet analysis indicates that the resonance periods between TWSC and ENSO are primarily 2 and 4 years. These resonance periods are related to the two ENSO modes (the central Pacific (CP) mode with a quasi-2-year period and the eastern Pacific (EP) mode with a quasi-4-year period). Furthermore, their resonance phase variation may be due to the transition to ENSO mode. This study revealed the relationship between ENSO and TWSC in Nicaragua, which can provide a certain reference for water resources regulation.
1. Introduction
The Republic of Nicaragua is located south of North America and is the largest country on the isthmus of Central America [1]. In Nicaragua, the amount of renewable groundwater, surface water, and total water is approximately 59.00 km3/a, 160.91 km3/a, and 164.52 km3/a, respectively [2]. These water resources are vital for agriculture, Nicaragua’s main economic source [3,4]. Therefore, monitoring terrestrial water storage (TWS) changes is critical for water resources management in Nicaragua.
At present, the common methods used to estimate TWS include in situ measuring (well or gauging station), satellite remote sensing, numerical simulation, etc. [5,6,7]. However, in situ measuring is sparse and uneven, satellite remote sensing (infrared or microwave remote sensing) only captures information on surficial water bodies, and numerical simulation is affected by the precision of model parameters. Fortunately, these shortcomings and limitations can be addressed by the implementation of the Gravity Recovery and Climate Experiment (GRACE) and GRACE Follow-On (GRACE-FO) [8], which have provided a novel remote sensing method to monitor monthly TWS at a spatial resolution of 300 km and equivalent water height (EWH) of 1 cm [9,10]. Nevertheless, the TWS derived from GRACE/GRACE-FO contains all TWS components (TWSCs), which include canopy water, snow water equivalent, soil moisture, surface water, and groundwater [11,12]. Therefore, it is necessary to combine multisource data, such as in situ observations and satellite remote sensing observations, to quantitatively estimate regional TWSC changes, which have been widely applied in the Amazon basin [13,14], Southwest China [15], Southern Africa [16], Greenland [17], and so on.
Furthermore, TWSCs can be used to study significant climate variability in the Earth system, such as El Niño and Southern Oscillation (ENSO) [11]. ENSO is a periodic deviation in the mean sea surface temperatures in the equatorial Pacific Ocean, which can trigger extreme natural events such as floods and droughts [18]. In recent years, some studies have investigated the effects of ENSO on regional TWSC. Phillips et al. (2012) [19] indicated that TWS in tropical regions shows a strong negative correlation with ENSO. Ni et al. (2018) [20] pointed out that the strongest correlations between TWS and ENSO are found in the tropical and subtropical regions, especially in the peripheral regions of the Pacific Ocean, such as the Amazon River basin and La Plata River basin with the maximum cross-correlation coefficients up to ~0.7.
Nicaragua has suffered from irregular extreme climate patterns caused by the changes in ENSO [21]. The intensity of precipitation in Nicaragua is strongly influenced by ENSO [22,23]. Bell et al. (1999) [24] analyzed the association of La Nina events (after July 1998) with increased monsoon rains over Central America during October–December. Amador (2008) [25] indicated that the strength of ENSO affects atmospheric circulation patterns, such as the Caribbean low-level jet stream, which affects the intensity of precipitation over Central America. Munoz-Jimenez et al. (2019) [26] pointed out that Nicaragua was identified as a hot spot for significant drying conditions related to El Niño. Nevertheless, these studies on the relationship between extreme drought events and ENSO in Nicaragua primarily focused on precipitation and other climatic changes. The relationships between ENSO and TWSC changes in Nicaragua have not been discussed in detail by previous publications but will help us develop reliable drought forecasting systems and provide insights into water resources management and mitigation measures in Nicaragua [27,28].
The novelty of our work is to study the differences in the TWSC–ENSO relationship in two sub-basins, which have not been mentioned in previous studies. To investigate comprehensively the relationship between ENSO and TWSC changes in Nicaragua, various data (GRACE/GRACE-FO temporal gravity field, hydrological model, and water level data) were adopted to estimate TWSC changes from April 2002 to April 2021 in Nicaragua and its sub-basins. Subsequently, climate data (precipitation and evaporation) were employed to analyze the variation in TWSC in Nicaragua. Finally, we used the cross-correlation analysis and cross-wavelet transformation analysis to quantitate the TWSC–ENSO relationship.
2. Study Area and Data Acquisition
2.1. Study Area
Nicaragua is located in the Central American Dry Corridor, a tropical dry forest region on the Pacific Coast of Central America [26]. According to the Köppen–Geiger climate classification [29], there are three main climates in the Nicaragua region. The Pacific coastal lowlands of the central highlands and west coast have a predominantly tropical savanna climate [1,30]. The Caribbean coastal lowlands along the east coast have a tropical monsoon climate and a tropical rainforest climate.
The central highlands in Nicaragua range from 610 m to 1524 meters above sea level. Mountain topography affects the process of atmospheric flux exchange at different spatial scales [31]. In Nicaragua, groundwater and surface water isotope ratios depicted the strong orographic separation into the Caribbean and Pacific domains [32], mainly induced by the governing moisture transport from the Caribbean Sea and complex rainfall-producing systems across the mountain range. Therefore, we divided Nicaragua into two sub-basins—eastern Nicaragua and western Nicaragua (Figure 1)—based on the mountain range and Köppen–Geiger climate classification. Lake Nicaragua (8264 km2) and Lake Managua (1041 km2) are located in the western basin [33].
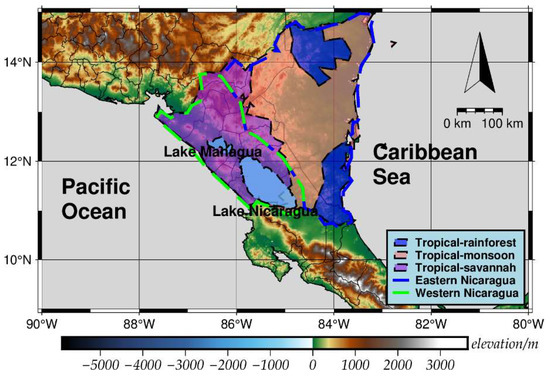
Figure 1.
Map of Nicaragua. The climate classification is based on the Köppen–Geiger climate classification [29].
In addition, the rainfall varies greatly in Nicaragua. The Caribbean lowlands are the wettest section of Central America, receiving between 2500 and 6500 mm of rain annually [1]. The western slopes of the central highlands and the Pacific lowlands receive considerably less annual rainfall, being protected from moisture-laden Caribbean trade winds by the peaks of the central highland. Under the regulation of the Caribbean low-level jet stream and the sea surface temperature of the eastern Pacific Ocean, the annual cycle of precipitation in Nicaragua is climatologically characterized by a robust bimodal distribution, normally termed the midsummer drought [34]. It is characterized by a first precipitation peak between May and June, a reduction in precipitation between July and August, and a second peak between late August and early October.
2.2. GRACE/GRACE-FO Data
We adopted both the spherical harmonic solutions and mascon solutions of GRACE/GRACE-FO to estimate the TWS changes in Nicaragua from April 2002 to April 2021. The spherical harmonic solutions are from the Institute of Geodesy at Graz University of Technology (ITSG) [35], in the form of fully normalized spherical harmonics Stokes coefficients up to degree and order 60 [36]. To obtain the residual spherical harmonic coefficients in each month, we subtract the mean gravity field on the basis of the period from January 2004 to December 2009 (same as mascon solutions) from spherical harmonic coefficients in each month. The first-degree (representing geo-center motion) spherical harmonic coefficients were determined by combing the GRACE/GRACE-FO data with numerical ocean models [37]. The GRACE/GRACE-FO C20 and C30 coefficients have been replaced by the high-precision C20 and C30 coefficients measured by satellite laser ranging data [38,39]. The P4M6 de-striping filter and a 500 km Gaussian filter are applied to suppress longitudinal stripe noise and random errors in GRACE/GRACE-FO spherical harmonic coefficients [40]. Finally, the ICE-6G_D model is employed to make the glacial isostatic adjustment (GIA) corrections [41]. In this work, we use ITSG-SH as the abbreviation for spherical harmonic solutions.
We implemented the newest release (CSR-RL06M v02) of mascon solutions provided by the Center for Space Research (CSR) in Austin [42]. In this work, we use CSR-M as the abbreviation for CSR-RL06M v02. The CSR-M solutions are the monthly global equivalent water thickness values provided in the grid with a spatial resolution of 0.25° × 0.25°. The CSR-M solutions have made the replacement and corrections consistent with the spherical harmonic solution, including C20 replacement, C30 replacement, first-degree corrections, and GIA corrections. Nicaragua is near the equator, where ellipsoid corrections have a minor impact on TWS changes [43]. Therefore, we did not consider executing an ellipsoid correction to the spherical harmonic solutions.
2.3. Hydrological Model and Satellite Altimetry
The Global Land Data Assimilation System (GLDAS) was jointly developed by the Goddard Space Flight Center (GSFC) and the National Centers for Environmental Prediction (NCEP) [44]. This model uses remote sensing satellite data and surface observational data as the inputs for four land surface process hydrological models: NOAH, VIC, CLM, and MOSAIC. Based on model simulation and data assimilation algorithms, the model outputs are the global surface state variables and the flux data. Many previous studies have proved the applicability of GLDAS to large-scale water balance analyses [45,46,47]. Based on the selection (NOAH) of Philip et al. (2012) [19] and Ni et al. (2018) [20], we employed the soil moisture outputs of the GLDAS2.1-NOAH025 model in this paper. These outputs, with a spatial resolution of 0.25° and a temporal resolution of one month, cover the same period as the GRACE/GRACE-FO model.
Schwatke et al. (2015) [48] proposed a new method to compute the inland water level time series of rivers and lakes based on an extended outlier rejection and a Kalman filter approach incorporating cross-calibrated multi-mission satellite altimeter data. These time series are available from Database for Hydrological Time Series over Inland Waters (DAHITI: https://dahiti.dgfi.tum.de). We collected water level (surface water components) time series for Lake Nicaragua (April 2002 to April 2021) and Lake Managua (July 2002 to April 2021) from DAHITI. The missing value of the two months (April and May in 2002) were interpolated by singular spectrum analysis iterative interpolation [49].
2.4. Climate Data and Climate Index
The ERA5-land is the land component of the European Centre for Medium-Range Weather Forecasts (ECMWF) ERA5 climate reanalysis. The ERA5-Land model contains detailed records of the surface water energy cycle [50]. The high spatial and temporal resolution of ERA5-Land, its extended period, and the consistency of the fields produced makes it a valuable dataset to support hydrological studies, initialize numerical weather prediction and climate models, and support diverse applications dealing with water resource, land, and environmental management [51]. The monthly mean data variables analyzed in this study include precipitation and evaporation at a spatial resolution of 0.1°. Figure 2 shows the spatial variation in the monthly average precipitation, evaporation, and the monthly average difference between precipitation and evaporation values from April 2002 to April 2021 in Nicaragua.
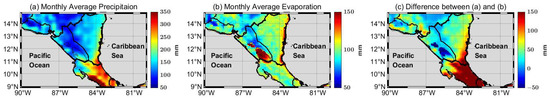
Figure 2.
The monthly average spatial values in precipitation (a), evaporation (b), and the difference (c) between precipitation and evaporation from April 2002 to April 2021.
ENSO events have been connected to climate effects (e.g., droughts and floods) by the evidence of teleconnections within the coupled ocean–atmosphere and land systems [20]. In this work, we use the Niño 3.4 index (from April 2002 to April 2021) as a measure of ENSO strength. The ENSO Niño 3.4 index is the monthly anomaly value of sea surface temperature defined in the area of Niño 3.4 (5°N–5°S, 170°W–120°W) [18]. An El Niño or La Niña event is identified if the five-month running mean of the Niño 3.4 index exceeds +0.4 °C (for El Niño, or −0.4 °C for La Niña) for at least six consecutive months [52].
3. Methods
3.1. TWS Changes Estimation
The residual spherical harmonic coefficients were obtained using the method of Wahr et al. (1998) [12] to estimate the TWS changes. To reduce the signal leakage [53], we applied a forward modeling technique of the ITSG-SH monthly TWS changes derived from ITSG-SH solutions [40]. This procedure comprises the following steps: (1) We converted the residual spherical harmonic coefficients to the GRACE/GRACE-FO-derived global mass changes (OBS) using the same filter (i.e., 500 km Gaussian and P4M6 filter). Next, we assigned the OBS to the land region of a new simulated gridded mass change (FM0). (2) We reassigned a uniform water layer to the ocean areas of FM0, negatively equaling the total mass over land to make the total ocean mass changes equal to that on land. (3) We applied the same truncation and filter as the FM0 to obtain the observation (FM1) of FM0. (4) Subsequently, we compared the FM1 and OBS. This method minimizes differences between the FM1 and OBS through an iterative approach. Consequently, we added differences to the FM0 (i.e., modeled ‘true’ mass) at each grid point. (5) The updated FM0 was regarded as the new input in step 2 until the number of iterations process (in steps 2 to 5) or the differences between FM1 and OBS were below a defined threshold.
In this paper, we set the maximum number of iterations to 20 to reduce the noise accumulation because of overiteration [54]. The modeled ‘true’ mass FM1, after going through the same filter (500 km Gaussian and P4M6 filter), provided the global TWS changes that closely resemble TWS changes derived from the ITSG-SH solutions.
Finally, the global gridded mass changes (from CSR-M and ITSG-SH) were weighted by latitude cosine to compute the TWS change time series of a particular region. The TWS changes derived from GRACE/GRACE-FO in all missing months from April 2002 to April 2021 were filled by singular spectrum analysis iterative interpolation [49].
3.2. Time Series Analysis
Because the periods of ENSO are primarily interannual variations, the linear trend, annual, and semiannual terms from each time series (TWSC and climate data in two sub-basins) need to be removed [20]. A time series can be decomposed into a linear trend, annual, semiannual, and residual term by harmonic analysis [55]:
where TS(t) is the time series; t is the time; a0, a1, a2, a3, a4, and a5 are parameters to be solved by least squares fitting; ε is the residual signal. After removing the linear trend, annual, and semiannual terms from each time series (TWSC and climate data in two sub-basins), the residuals are determined. A 13-month moving average filter is further applied to the residuals, leaving a time series X(t) mainly dominated by interannual (low-frequency) variations [56].
Subsequently, the cross-correlation ρ(τ) of X(t) and ENSO index Y(t) can be expressed as [57]:
where Y(t) is a function of the lag with Y(t) leading X(t), σXY (τ) is the cross-covariance, σXX and σYY are the respective variances of X(t) and Y(t), N is the length of time series, and the asterisk represents the complex conjugate. The value range of ρ(τ) is between −1 and 1. The peak correlation with over one year is unlikely to be a true TWSC-ENSO connection, but rather ENSO events repeat in the last decade or so [58]. Thus, we selected with the peak correlation within one year.
The cross-wavelet transformation can detect the correlation between the two time series in both time and frequency domains, combined with the wavelet transformation and cross-spectrum analysis [59]. In this study, the cross-wavelet transformation was mainly employed to investigate resonant periods between the original time series (TWSC changes, precipitation, and evaporation without decomposition) and ENSO. Grinsted et al. (2008) [60] provided the toolbox for cross-wavelet transformations. MATLAB source code is available from the web server (www.iamg.org, accessed on 24 June 2022).
3.3. Workflow
The data processing workflow for this study is shown in Figure 3.
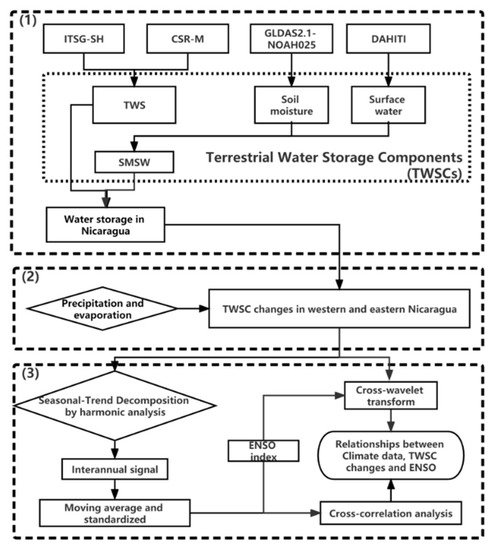
Figure 3.
The workflow in this study.
(1) To study the TWSC changes in Nicaragua, we computed the TWS changes, surface water changes, and soil moisture changes from GRACE/GRACE-FO data, water level, and the GLDAS2.1-NOAH025 model, respectively. For brevity, soil moisture and surface water are abbreviated as SMSW;
(2) Next, we analyzed the time series of TWSC changes and climate data in Nicaragua and its sub-basins;
(3) We use time series analysis (harmonic analysis, cross-correlation analysis, and cross-wavelet analysis) to study the relationship between the ENSO and each time series in Nicaragua.
4. Results
4.1. TWSC Changes in Nicaragua
Precipitation and evaporation are the significant sources of TWSC changes in Nicaragua [45,61]. We analyze the relationship between climate data (precipitation and evaporation) and TWSC changes in the time domain. Figure 4 shows the monthly variation, mean annual cycle, and annual variation for TWSC (CSR-M, ITSG-SH, and SMSW) and climate data.
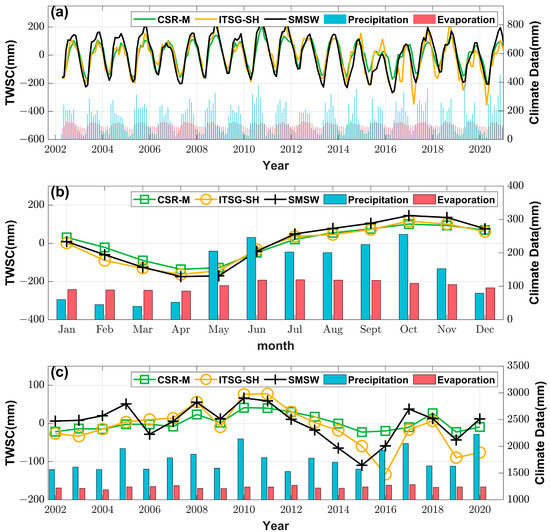
Figure 4.
(a) Monthly variation, (b) mean annual cycle, and (c) annual variation in TWSC changes (CSR-M, ITSG-SH, and SMSW) and climate data (precipitation and evaporation). The annual variation in climate data is an accumulation of one year. The annual variation in TWSC is a mean value of one year.
From Figure 4, TWSC changes are mainly regulated by precipitation in Nicaragua. When Nicaragua enters into the rainy season (from May to December, see Figure 4b), TWSC begins to increase. The mean annual cycle of precipitation from May to October was more than 200 mm, about twice the evaporation of the corresponding month. While precipitation began to decrease rapidly in October, TWSC began to decrease. Additionally, the annual variation in precipitation is consistent with TWSC changes, see Figure 4c. From 2002 to 2012, TWSC increased gradually. However, the TWSC began to decrease in 2012 and speeded up in 2014. Approximately 3.5 million people experienced food insecurity after suffering major crop losses resulting from the prolonged warm ENSO-induced drought from 2014 to the beginning of 2016 [62]. Fortunately, the following increase in annual precipitation (2016–2017) mitigated the drought timely. From 2017 to 2021, the TWSC was still decreasing slowly.
Meanwhile, we computed the annual amplitude and annual phase as well as the linear trend of TWSC (over the three above periods and the whole study period) by harmonic analysis (Table 1). From April 2002 to April 2021, the linear trends of TWSC changes derived from CSR-M, ITSG-SH, and SMSW are 0.19 mm/a, −3.67 mm/a, and −2.62 mm/a, respectively. Further, we computed the annual amplitude and annual phase in every grid point from TWSC using harmonic analysis (Figure 5).

Table 1.
Harmonic analysis of TWSC changes.
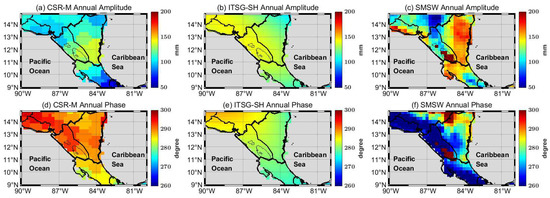
Figure 5.
The spatial variations in annual amplitude values (a–c) and annual phase values (d–f) of TWSC (CSR-M, ITSG-SH, and SMSW) from April 2002 to April 2021.
Because the size of Nicaragua (130,400 km2) was only over 30% of the GRACE/GRACE-FO actual spatial resolution (~100,000 km2) [63], the spatial variation in annual amplitude and phases of CSR-M and ITSG-SH did not show significant east–west differences as SMSW, see Figure 5. The annual phase difference between ITSG-SH (280.94°) and CSR-M (290.34°) is about 10°. The ITSG-SH is closer to SMSW in terms of annual amplitude and phase. Because the SMSW lacks groundwater components and also has some uncertainty [64], the SMSW cannot be used to evaluate two GRACE/GRACE-FO solutions in Nicaragua.
4.2. TWSC Changes in Nicaragua Sub-Basins
There are significant differences in climate (Figure 2) and SMSW (Figure 5c) between the eastern basin and western basin, so we mainly analyze changes in climate and SMSW in the two sub-basins. We computed monthly variation (Figure 6) and mean annual cycle (Figure 7) from four kinds of sources (SMSW, soil moisture, precipitation, and evaporation).
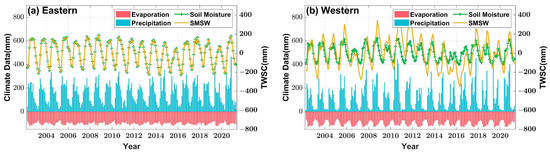
Figure 6.
The monthly variation of SMSW, soil moisture, precipitation, and evaporation in eastern (a) and western (b) Nicaragua, respectively. To better visualize the results, we multiplied the evaporation by −1.
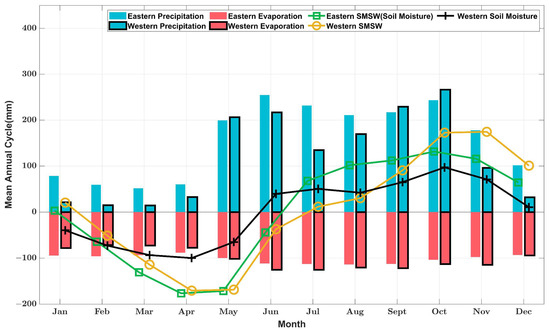
Figure 7.
The mean annual cycle of precipitation, evaporation, SMSW, and soil moisture in western and eastern Nicaragua, respectively. Soil moisture and SMSW are equivalent in eastern Nicaragua, so they use the same notation. To better visualize the results, we multiplied the evaporation by −1.
In Figure 6, the SMSW in western Nicaragua has a significant long-term period change compared with that in eastern Nicaragua. From Figure 7, the western SMSW has a larger annual variation than the eastern SMSW. Soil moisture in the two basins changed with the alternation of rainy and dry seasons. When the precipitation in the two sub-basins began to decrease after October, soil moisture in the two sub-basins also decreased rapidly. However, the western SMSW did not begin to decrease until after November. The reason for these differences in hydrological processes between western Nicaragua and eastern Nicaragua is that the two lakes (Lake Managua and Lake Nicaragua) exist in the western basin, which can preserve the water and increase evaporation [65].
4.3. Relationship between TWSC and ENSO
4.3.1. Cross-Correlation Analysis between Interannual TWSC and ENSO
To investigate the connection between TWSC changes, climate data, and ENSO in the two sub-basins, we obtained the interannual signals (CSR-M, ITSG-SH, SMSW, soil moisture, precipitation, and evaporation in Nicaragua sub-basins), as shown in Figure 8. To better visualize the results, we multiplied the ENSO index by −1 in Figure 8. The peak correlation coefficients with corresponding lags between ENSO and the interannual signals are shown in Figure 9.
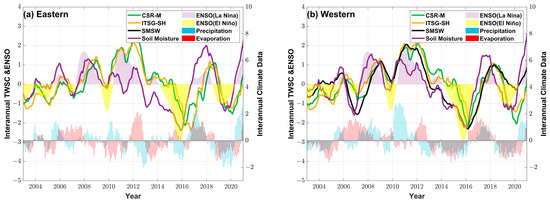
Figure 8.
The interannual signals (CSR-M, ITSG-SH, SMSW, soil moisture, precipitation, and evaporation) and the ENSO index in eastern (a) and western (b) Nicaragua.
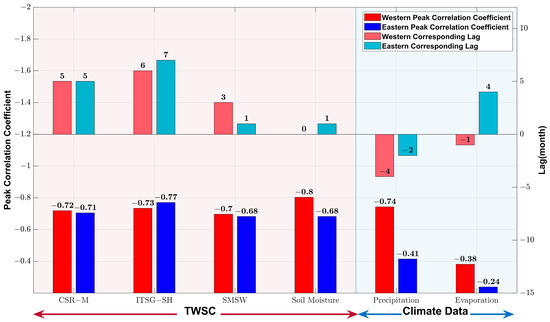
Figure 9.
The peak correlation coefficients with corresponding lags between interannual signals (CSR-M, ITSG-SH, SMSW, soil moisture, precipitation, and evaporation) and ENSO in Nicaragua sub-basins. A positive/negative value of lags means that the ENSO phase is ahead/behind the interannual signal. All the peak correlations are computed at a 95% level of confidence.
Strong La Nina events in 2008 and 2011 correspond to significant positive interannual TWSC, and strong El Niño events from 2015 to 2016 correspond to significant negative interannual TWSC in Nicaragua sub-basins (Figure 8). There is a significant negative correlation with lags between interannual TWSC and ENSO (Figure 9), especially for the interannual western soil moisture (−0.80). This connection is because ENSO can regulate climate models to affect water transport processes in Nicaragua, especially the precipitation [25]. As a rule, El Niño/La Nina produces drier/wetter conditions in the Pacific Ocean and the opposite in the Caribbean Sea [26]. Thus, the correlation (−0.74) between western precipitation and ENSO is stronger than that between eastern precipitation and ENSO. It also indicates that the ENSO signal is feeble on the Caribbean side, which is consistent with the result of Hidalgo et al. (2017) [66].
The difference in peak correlation between the two sub-basins may not only be due to the influence of other climate models with different spatial and temporal scales [22,23] but also related to the influence of the ENSO propagation process [67]. Kowal et al. (2022) [68] analyzed that precipitation spatial distribution will respond more to the slope position relative to the wind, distance to the coast, and local topography. From the view of signal propagation, when the ENSO signal passes through the alpine terrain of Nicaragua from west to east, the linear disturbance of ENSO may be weakened or delayed. This terrain hinders the linear broadcast of the ENSO signal [31].
Subsequently, we analyze the differences in peak correlation with corresponding lags caused by TWSC (Figure 9). We focus on the peak correlation with corresponding lags in western Nicaragua. With the increase of different components, the peak correlation becomes weaker, and the corresponding lags increase. Western interannual soil moisture has the strongest correlation (−0.80) without lag. With the addition of a surface water component, the peak correlation coefficient (SMSW) becomes −0.70 with lags (3 months). After adding the groundwater component, the peak correlation coefficient (TWS) is stable (−0.72 or −0.73), but the lags increase.
The difference in peak correlation for each TWSC is because ENSO acts on all the hydrological processes, including precipitation, evaporation, runoff, and others [19]. To be specific, the difference in peak correlation between SMSW and soil moisture is because the availability of surface water can affect hydrological processes such as evaporation and runoff [69]. Munoz et al. (2019) [26] analyzed that the low relief around the depression of Lake Nicaragua is likely to play a role in moisture transport. Furthermore, the difference in peak correlation with lags between SMSW and TWS (CSR-M, ITSG-SH) is due to groundwater storage changes. The response of groundwater to ENSO-induced hydrologic processes is delayed, which depends on various factors affecting infiltration and recharge rates, such as local geology, land use, and land cover [70].
4.3.2. Cross-Wavelet Analysis between TWSC and ENSO
To better analyze the resonance between ENSO and TWSC, the cross-wavelet analysis was adopted to study the connection between the original time series (TWSC and climate data without decomposition) and ENSO. The results are shown in Figure 10.
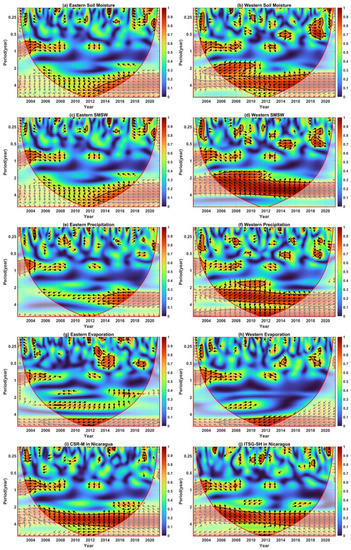
Figure 10.
The cross-wavelet transforms between ENSO and eastern soil moisture (a), SMSW (c), precipitation (e), and evaporation (g), the cross-wavelet transforms between ENSO and western soil moisture (b), SMSW (d), precipitation (f), and evaporation (h), and the cross-wavelet transforms between ENSO and TWS (CSR-M (i) and ITSG-SH (j)) in Nicaragua. The solid red lines are the edge of the influence cone. The 5% significance level against red noise is exhibited as thick lines, and the relative phase relationship is denoted as arrows (with in-phase pointing right, antiphase pointing left, and time series (TWSC changes, precipitation, and evaporation) leading ENSO by 90° pointing straight down).
In 2004–2010 and 2002–2021, a significant negative correlation (Figure 10b,d) is revealed between western TWSC (both soil moisture and SMSW) and ENSO, with a period of 2 years and 4 years, respectively. In addition, the negative correlation resonance between TWS (CSR-M and ITSG-SH in Nicaragua) and ENSO is stable, with a period of about 2~4 years from 2002 to 2021. Furthermore, western precipitation (Figure 10f) also has a similar resonance, but the resonance period shifts gradually from 2 years to 4 years in 2002–2021. In Figure 10f, the resonance period of over 5 years in 2002–2021 for the connection between western precipitation and ENSO also exists. However, this resonance is beyond the cone of influence, which is unreliable. So, we concluded that the resonance periods of TWSC and precipitation with ENSO are mainly 2 and 4 years. In addition, it should be noted that all resonance phases began to change in 2012. Compared with resonance in the western basin, the significant resonance (2~4 years) between ENSO and eastern time series (TWSC and precipitation) is only in 2012–2021.
El Niño events have been categorized into two sea surface temperature patterns, an eastern Pacific (EP) with a quasi-4-year period and a central Pacific (CP) ENSO with a quasi-2-year period [71], which refer to the respective location of the maximum positive sea surface temperature anomalies and associated convection [72,73]. According to the study by Hu et al. (2018) [74], there were mostly EP ENSO from 2002 to 2015, EP La Nina events occurred in 2005 and 2007, and EP El Niño events occurred in 2015. Therefore, we think that the above phase variation and major resonance period (2 and 4 years) in Figure 10 are correlated with the interdecadal transition of ENSO modes [74].
5. Conclusions
In this paper, we adopted various data to compute TWSC changes, precipitation, and evaporation in Nicaragua and further analyzed them in the time domain (monthly variation, annual variation, and so on) and space domain. Subsequently, the relationship between ENSO and TWSC changes in Nicaragua from April 2002 to April 2021 is studied. The conclusions are:
(1) There is a strong correlation between TWSC changes in Nicaragua and climate data (precipitation and evaporation). Moreover, precipitation is the main reason for the temporal and spatial variation of TWSC in Nicaragua;
(2) The cross-correlation analysis indicates a significant peak correlation (−0.80) between ENSO and soil moisture in the western basin, while the peak correlation coefficient between other western TWSC and ENSO was kept between −0.70 and −0.73. The difference in ENSO response between the two sub-basins may be due to the topographic hindrance of the ENSO-inspired precipitation process;
(3) The cross-wavelet analysis demonstrates that the resonance periods between TWSC and precipitation with ENSO are mainly 2 and 4 years. These resonance periods are related to two types of ENSO (EP ENSO and CP ENSO). In addition, this resonance phase variation is due to the interdecadal transition of the ENSO type.
At last, we think that the influence of terrain on TWSC may be used for signal extraction in the future [75], especially in a small-scale basin. The relationship between topographic gradient changes and TWSC changes can also be further explored to help us extract and understand geophysical signals.
Author Contributions
Conceptualization, G.J. and C.X.; methodology, G.J.; software, G.J.; validation, J.L., C.X. and X.Z.; formal analysis, C.X.; investigation, G.J.; resources, G.J.; data curation, G.J.; writing—original draft preparation, G.J.; writing—review and editing, C.X. and X.Z.; visualization, L.F.; supervision, C.X.; project administration, C.X.; funding acquisition, C.X. All authors have read and agreed to the published version of the manuscript.
Funding
This research was funded by the National Natural Science Foundation of China (Grant no. 41974014, 42274004) and the Natural Science Foundation of Guangdong Province, China (Grant no. 2022A1515010396).
Data Availability Statement
The spherical harmonic solutions were provided by ITSG from the International Centre for Global Models (http://icgem.gfz-potsdam.de/home, accessed on 1 January 2022). The mascon solutions were provided by the CSR (https://www2.csr.utexas.edu/grace/RL06_mascons.html, accessed on 11 September 2021). The water level products were provided by the DAHITI (https://dahiti.dgfi.tum.de, accessed on 8 October 2022). The GLDAS2.1 NOAH025 products used in this study were provided by the EARTHDATA (https://disc.gsfc.nasa.gov/datasets, accessed on 27 November 2021). The ERA5-land products were provided by ECMWF (https://cds.climate.copernicus.eu, accessed on 2 October 2021). The watershed boundary data of Nicaragua were provided by the Database of Global Administrative Areas (https://gadm.org/index.html, accessed on 1 April 2022). The ENSO Niño 3.4 index was provided by the National Centers for Environmental Information (https://www.ncei.noaa.gov/, accessed on 1 November 2021).
Conflicts of Interest
The authors declare no conflict of interest.
References
- Rudolph, J.D. Nicaragua, A Country Study, 2nd ed.; Foreign Area Studies, the American University: Washington, DC, USA, 1982. [Google Scholar]
- Food and Agriculture Organization of the United Nations. Available online: https://www.fao.org/faostat/zh/#data/R (accessed on 21 September 2022).
- Howells, M.; Hermann, S.; Welsch, M.; Bazilian, M.; Segerstrom, R.; Alfstad, T.; Gielen, D.; Rogner, H.; Fischer, G.; van Velthuizen, H.; et al. Integrated analysis of climate change, land-use, energy and water strategies. Nat. Clim. Change 2013, 3, 621–626. [Google Scholar] [CrossRef]
- D’Odorico, P.; Davis, K.F.; Rosa, L.; Carr, J.A.; Chiarelli, D.; Dell’Angelo, J.; Gephart, J.; MacDonald, G.K.; Seekell, D.A.; Suweis, S.; et al. The Global Food-Energy-Water Nexus. Rev. Geophys. 2018, 56, 456–531. [Google Scholar] [CrossRef]
- Ramillien, G.; Frappart, F.; Cazenave, A.; Guntner, A. Time variations of land water storage from an inversion of 2 years of GRACE geoids. Earth Planet. Sci. Lett. 2005, 235, 283–301. [Google Scholar] [CrossRef]
- Cazenave, A.; Nerem, R.S. Geophysics: Redistributing Earth’s mass. Science 2002, 297, 783–784. [Google Scholar] [CrossRef] [PubMed]
- Cox, C.M.; Chao, B.F. Detection of a large-scale mass redistribution in the terrestrial system since 1998. Science 2002, 297, 831–833. [Google Scholar] [CrossRef]
- Chen, J.; Famiglietti, J.S.; Scanlon, B.R.; Rodell, M. Groundwater Storage Changes: Present Status from GRACE Observations. Surv. Geophys 2016, 37, 397–417. [Google Scholar] [CrossRef]
- Chen, Z.W.; Zhang, X.F.; Chen, J.H. Monitoring Terrestrial Water Storage Changes with the Tongji-Grace2018 Model in the Nine Major River Basins of the Chinese Mainland. Remote Sens. 2021, 13, 1851. [Google Scholar] [CrossRef]
- Tapley, B.D.; Bettadpur, S.; Cheng, M.; Hudson, D.; Kruizinga, G. Early Results from the Gravity Recovery And Climate Experiment. In Proceedings of the AIAA/AAS Astrodynamics Specialist Conference, Big Sky, MT, USA, 3–7 August 2003. [Google Scholar]
- Li, P.; Zha, Y.; Shi, L.; Zhong, H.; Tso, C.-H.M.; Wu, M. Assessing the Global Relationships Between Teleconnection Factors and Terrestrial Water Storage Components. Water Resour. Manag. 2022, 36, 119–133. [Google Scholar] [CrossRef]
- Wahr, J.; Molenaar, M.; Bryan, F. Time variability of the Earth’s gravity field: Hydrological and oceanic effects and their possible detection using GRACE. J. Geophys. Res. Solid Earth 1998, 103, 30205–30229. [Google Scholar] [CrossRef]
- Alsdorf, D.; Han, S.-C.; Bates, P.; Melack, J. Seasonal water storage on the Amazon floodplain measured from satellites. Remote Sens. Environ. 2010, 114, 2448–2456. [Google Scholar] [CrossRef]
- Chen, J.L.; Wilson, C.R.; Tapley, B.D.; Yang, Z.L.; Niu, G.Y. 2005 drought event in the Amazon River basin as measured by GRACE and estimated by climate models. J. Geophys. Res.-Solid Earth 2009, 114, B05404. [Google Scholar] [CrossRef]
- Long, D.; Shen, Y.; Sun, A.; Hong, Y.; Longuevergne, L.; Yang, Y.; Li, B.; Chen, L. Drought and flood monitoring for a large karst plateau in Southwest China using extended GRACE data. Remote Sens. Environ. 2014, 155, 145–160. [Google Scholar] [CrossRef]
- Kolusu, S.R.; Shamsudduha, M.; Todd, M.C.; Taylor, R.G.; Seddon, D.; Kashaigili, J.J.; Ebrahim, G.Y.; Cuthbert, M.O.; Sorensen, J.P.R.; Villholth, K.G.; et al. The El Nino event of 2015-2016: Climate anomalies and their impact on groundwater resources in East and Southern Africa. Hydrol. Earth Syst. Sci. 2019, 23, 1751–1762. [Google Scholar] [CrossRef]
- Chen, J.L.; Wilson, C.R.; Tapley, B.D. Satellite gravity measurements confirm accelerated melting of Greenland ice sheet. Science 2006, 313, 1958–1960. [Google Scholar] [CrossRef]
- Rayner, N.A.; Parker, D.E.; Horton, E.B.; Folland, C.K.; Alexander, L.V.; Rowell, D.P.; Kent, E.C.; Kaplan, A. Global analyses of sea surface temperature, sea ice, and night marine air temperature since the late nineteenth century. J. Geophys. Res.-Atmos. 2003, 108, 4407–4428. [Google Scholar] [CrossRef]
- Phillips, T.; Nerem, R.S.; Fox-Kemper, B.; Famiglietti, J.S.; Rajagopalan, B. The influence of ENSO on global terrestrial water storage using GRACE. Geophys. Res. Lett. 2012, 39. [Google Scholar] [CrossRef]
- Ni, S.; Chen, J.; Wilson, C.R.; Li, J.; Hu, X.; Fu, R. Global Terrestrial Water Storage Changes and Connections to ENSO Events. Surv. Geophys 2018, 39, 1–22. [Google Scholar] [CrossRef]
- Bouroncle, C.; Imbach, P.; Rodríguez-Sánchez, B.; Medellín, C.; Martinez-Valle, A.; Läderach, P. Mapping climate change adaptive capacity and vulnerability of smallholder agricultural livelihoods in Central America: Ranking and descriptive approaches to support adaptation strategies. Clim. Change 2017, 141, 123–137. [Google Scholar] [CrossRef]
- Amador, J.A.; Duran-Quesada, A.M.; Rivera, E.R.; Mora, G.; Saenz, F.; Calderon, B.; Mora, N. The easternmost tropical Pacific. Part II: Seasonal and intraseasonal modes of atmospheric variability. Rev. Biol. Trop. 2016, 64, S23–S57. [Google Scholar] [CrossRef]
- Amador, J.A.; Rivera, E.R.; Duran-Quesada, A.M.; Mora, G.; Saenz, F.; Calderon, B.; Mora, N. The easternmost tropical Pacific. Part I: A climate review. Rev. Biol. Trop. 2016, 64, S1–S22. [Google Scholar] [CrossRef]
- Bell, G.D.; Halpert, M.S.; Ropelewski, C.F.; Kousky, V.E.; Douglas, A.V.; Schnell, R.C.; Gelman, M.E. Climate assessment for 1998. Bull. Amer. Meteorol. Soc. 1999, 80, S1–S48. [Google Scholar] [CrossRef]
- Amador, J.A. The Intra-Americas Sea Low-level Jet Overview and Future Research. In Trends and Directions in Climate Research; Gimeno, L., GarciaHerrera, R., Trigo, R.M., Eds.; Annals of the New York Academy of Sciences: San Lorenzo de El Escorial, Spain, 2008; Volume 1146, pp. 153–188. [Google Scholar]
- Munoz-Jimenez, R.; Giraldo-Osorio, J.D.; Brenes-Torres, A.; Avendano-Flores, I.; Nauditt, A.; Hidalgo-Leon, H.G.; Birkel, C. Spatial and temporal patterns, trends and teleconnection of cumulative rainfall deficits across Central America. Int. J. Climatol. 2019, 39, 1940–1953. [Google Scholar] [CrossRef]
- Othman, A.; Abdelrady, A.; Mohamed, A. Monitoring Mass Variations in Iraq Using Time-Variable Gravity Data. Remote Sens. 2022, 14, 3346. [Google Scholar] [CrossRef]
- Richey, A.S.; Thomas, B.F.; Lo, M.-H.; Reager, J.T.; Famiglietti, J.S.; Voss, K.; Swenson, S.; Rodell, M. Quantifying renewable groundwater stress with GRACE. Water Resour. Res. 2015, 51, 5217–5238. [Google Scholar] [CrossRef]
- Beck, H.E.; Zimmermann, N.E.; McVicar, T.R.; Vergopolan, N.; Berg, A.; Wood, E.F. Present and future Koppen-Geiger climate classification maps at 1-km resolution. Sci. Data 2018, 5, 180214. [Google Scholar] [CrossRef]
- Perez-Brignoli, H. A Brief History of Central America, 1st ed.; University of California Press: Berkeley, CA, USA; Los Angeles, CA, USA, 1989. [Google Scholar]
- Serafin, S.; Adler, B.; Cuxart, J.; De Wekker, S.F.J.; Gohm, A.; Grisogono, B.; Kalthoff, N.; Kirshbaum, D.J.; Rotach, M.W.; Schmidli, J.; et al. Exchange Processes in the Atmospheric Boundary Layer Over Mountainous Terrain. Atmosphere 2018, 9, 102. [Google Scholar] [CrossRef]
- Sanchez-Murillo, R.; Esquivel-Hernandez, G.; Corrales-Salazar, J.L.; Castro-Chacon, L.; Duran-Quesada, A.M.; Guerrero-Hernandez, M.; Delgado, V.; Barberena, J.; Montenegro-Rayo, K.; Calderon, H.; et al. Tracer hydrology of the data-scarce and heterogeneous Central American Isthmus. Hydrol Process 2020, 34, 2660–2675. [Google Scholar] [CrossRef]
- Plunkett, H. Nicaragua in Focus: A Guide to the People, Politics and Culture, 1st ed.; Latin American Bureau: Clun, UK, 1999. [Google Scholar]
- Zhao, Z.J.; Han, M.; Yang, K.; Holbrook, N.J. Signatures of midsummer droughts over Central America and Mexico. Clim. Dynam. 2022. [Google Scholar] [CrossRef]
- Chen, Q.; Shen, Y.; Chen, W.; Francis, O.; Zhang, X.; Chen, Q.; Li, W.; Chen, T. An Optimized Short-Arc Approach: Methodology and Application to Develop Refined Time Series of Tongji-Grace2018 GRACE Monthly Solutions. J. Geophys. Res. Solid Earth 2019, 124, 6010–6038. [Google Scholar] [CrossRef]
- Kvas, A.; Behzadpour, S.; Ellmer, M.; Klinger, B.; Strasser, S.; Zehentner, N.; Mayer-Guerr, T. ITSG-Grace2018: Overview and Evaluation of a New GRACE-Only Gravity Field Time Series. J. Geophys. Res. Solid Earth 2019, 124, 9332–9344. [Google Scholar] [CrossRef]
- Swenson, S.; Chambers, D.; Wahr, J. Estimating geocenter variations from a combination of GRACE and ocean model output. J. Geophys. Res.-Solid Earth 2008, 113, B08410. [Google Scholar] [CrossRef]
- Loomis, B.D.; Rachlin, K.E.; Wiese, D.N.; Landerer, F.W.; Luthcke, S.B. Replacing GRACE/GRACE-FO C-30 With Satellite Laser Ranging: Impacts on Antarctic Ice Sheet Mass Change. Geophys. Res. Lett. 2020, 47, e2019GL085488. [Google Scholar] [CrossRef]
- Cheng, M.; Tapley, B.D.; Ries, J.C. Deceleration in the Earth’s oblateness. J. Geophys. Res. Solid Earth 2013, 118, 740–747. [Google Scholar] [CrossRef]
- Jin, S.; Zou, F. Re-estimation of glacier mass loss in Greenland from GRACE with correction of land-ocean leakage effects. Glob. Planet. Change 2015, 135, 170–178. [Google Scholar] [CrossRef]
- Peltier, W.R.; Argus, D.F.; Drummond, R. Comment on “An Assessment of the ICE-6G_C (VM5a) Glacial Isostatic Adjustment Model“ by Purcell et al. J. Geophys. Res.-Solid Earth 2018, 123, 2019–2028. [Google Scholar] [CrossRef]
- Save, H.; Bettadpur, S.; Tapley, B.D. High-resolution CSR GRACE RL05 mascons. J. Geophys. Res. Solid Earth 2016, 121, 7547–7569. [Google Scholar] [CrossRef]
- Li, J.; Chen, J.; Li, Z.; Wang, S.-Y.; Hu, X. Ellipsoidal Correction in GRACE Surface Mass Change Estimation. J. Geophys. Res.-Solid Earth 2017, 122, 9437–9460. [Google Scholar] [CrossRef]
- Rodell, M.; Houser, P.; Jambor, U.; Gottschalck, J.; Mitchell, K.; Meng, C.-J.; Arsenault, K.; Cosgrove, B.; Radakovich, J.; Bosilovich, M. The global land data assimilation system. Bull. Amer. Meteorol. Soc. 2004, 85, 381–394. [Google Scholar] [CrossRef]
- Syed, T.H.; Famiglietti, J.S.; Rodell, M.; Chen, J.; Wilson, C.R. Analysis of terrestrial water storage changes from GRACE and GLDAS. Water Resour. Res. 2008, 44, W02433. [Google Scholar] [CrossRef]
- Landerer, F.W.; Swenson, S.C. Accuracy of scaled GRACE terrestrial water storage estimates. Water Resour. Res. 2012, 48. [Google Scholar] [CrossRef]
- Lenczuk, A.; Weigelt, M.; Kosek, W.; Mikocki, J. Autoregressive Reconstruction of Total Water Storage within GRACE and GRACE Follow-On Gap Period. Energies 2022, 15, 4827. [Google Scholar] [CrossRef]
- Schwatke, C.; Dettmering, D.; Bosch, W.; Seitz, F. DAHITI—An innovative approach for estimating water level time series over inland waters using multi-mission satellite altimetry. Hydrol. Earth Syst. Sci. 2015, 19, 4345–4364. [Google Scholar] [CrossRef]
- Li, W.; Wang, W.; Zhang, C.; Wen, H.; Zhong, Y.; Zhu, Y.; Li, Z. Bridging Terrestrial Water Storage Anomaly During GRACE/GRACE-FO Gap Using SSA Method: A Case Study in China. Sensors 2019, 19, 4144. [Google Scholar] [CrossRef] [PubMed]
- Olauson, J. ERA5: The new champion of wind power modelling? Renew. Energy 2018, 126, 322–331. [Google Scholar] [CrossRef]
- Munoz-Sabater, J.; Dutra, E.; Agusti-Panareda, A.; Albergel, C.; Arduini, G.; Balsamo, G.; Boussetta, S.; Choulga, M.; Harrigan, S.; Hersbach, H.; et al. ERA5-Land: A state-of-the-art global reanalysis dataset for land applications. Earth Syst. Sci. Data 2021, 13, 4349–4383. [Google Scholar] [CrossRef]
- Trenberth, K.E. The definition of EL Nino. Bull. Amer. Meteorol. Soc. 1997, 78, 2771–2778. [Google Scholar] [CrossRef]
- Fenoglio-Marc, L.; Kusche, J.; Becker, M. Mass variation in the Mediterranean Sea from GRACE and its validation by altimetry, steric and hydrologic fields. Geophys. Res. Lett. 2006, 33, 19. [Google Scholar] [CrossRef]
- Zhou, H.; Dai, M.; Wang, P.; Wei, M.; Tang, L.; Xu, S.; Luo, Z. Assessment of GRACE/GRACE Follow-On Terrestrial Water Storage Estimates Using an Improved Forward Modeling Method: A Case Study in Africa. Front. Earth Sci. 2022, 9, 796723. [Google Scholar] [CrossRef]
- Cui, L.; Zhang, C.; Yao, C.; Luo, Z.; Wang, X.; Li, Q. Analysis of the Influencing Factors of Drought Events Based on GRACE Data under Different Climatic Conditions: A Case Study in Mainland China. Water 2021, 13, 2575. [Google Scholar] [CrossRef]
- Chen, W.; Zhong, M.; Feng, W.; Zhong, Y.; Xu, H. Effects of two strong ENSO events on terrestrial water storage anomalies in China from GRACE during 2005-2017. Chinese J. Geophys. Chin. Ed 2020, 63, 141–154. [Google Scholar]
- Zou, F.; Tenzer, R.; Fok, H.S.; Nichol, J.E. Recent Climate Change Feedbacks to Greenland Ice Sheet Mass Changes from GRACE. Remote Sens. 2020, 12, 3250. [Google Scholar] [CrossRef]
- Zhang, Z.; Chao, B.F.; Chen, J.; Wilson, C.R. Terrestrial water storage anomalies of Yangtze River Basin droughts observed by GRACE and connections with ENSO. Glob. Planet. Change 2015, 126, 35–45. [Google Scholar] [CrossRef]
- Grinsted, A.; Moore, J.C.; Jevrejeva, S. Application of the cross wavelet transform and wavelet coherence to geophysical time series. Nonlinear Process. Geophys. 2004, 11, 561–566. [Google Scholar] [CrossRef]
- Cooper, G.R.J.; Cowan, D.R. Comparing time series using wavelet-based semblance analysis. Comput. Geosci. 2008, 34, 95–102. [Google Scholar] [CrossRef]
- Crowley, J.W.; Mitrovica, J.X.; Bailey, R.C.; Tamisiea, M.E.; Davis, J.L. Annual variations in water storage and precipitation in the Amazon Basin. J. Geodesy 2008, 82, 9–13. [Google Scholar] [CrossRef]
- Herrera, D.; Ault, T. Insights from a New High-Resolution Drought Atlas for the Caribbean Spanning 1950-2016. J. Clim. 2017, 30, 7801–7825. [Google Scholar] [CrossRef]
- Ni, S.; Chen, J.; Wilson, C.R.; Hu, X. Long-Term Water Storage Changes of Lake Volta from GRACE and Satellite Altimetry and Connections with Regional Climate. Remote Sens. 2017, 9, 842. [Google Scholar] [CrossRef]
- Chen, J.L.; Wilson, C.R.; Tapley, B.D.; Scanlon, B.; Guntner, A. Long-term groundwater storage change in Victoria, Australia from satellite gravity and in situ observations. Glob. Planet. Change 2016, 139, 56–65. [Google Scholar] [CrossRef]
- Wang, W.; Lee, X.; Xiao, W.; Liu, S.; Schultz, N.; Wang, Y.; Zhang, M.; Zhao, L. Global lake evaporation accelerated by changes in surface energy allocation in a warmer climate. Nat. Geosci. 2018, 11, 410–414. [Google Scholar] [CrossRef]
- Hidalgo, H.G.; Alfaro, E.J.; Quesada-Montano, B. Observed (1970–1999) climate variability in Central America using a high-resolution meteorological dataset with implication to climate change studies. Clim. Change 2017, 141, 13–28. [Google Scholar] [CrossRef]
- Hidalgo, H.G.; Duran-Quesada, A.M.; Amador, J.A.; Alfaro, E.J. The Caribbean Low-Level Jet, the Inter-Tropical Convergence Zone and Precipitation Patterns in the Intra-Americas Sea: A Proposed Dynamical Mechanism. Geogr. Ann. Ser. A Phys. Geogr. 2015, 97, 41–59. [Google Scholar] [CrossRef]
- Kowal, K.M.; Slater, L.J.; Van Loon, A.F.; Birkel, C. SEAS5 skilfully predicts late wet-season precipitation in Central American Dry Corridor excelling in Costa Rica and Nicaragua. Int. J. Climatol. 2022, 42, 4953–4971. [Google Scholar] [CrossRef]
- Yao, C.L.; Luo, Z.C.; Wang, H.H.; Li, Q.; Zhou, H. GRACE-Derived Terrestrial Water Storage Changes in the Inter-Basin Region and Its Possible Influencing Factors: A Case Study of the Sichuan Basin, China. Remote Sens. 2016, 8, 444. [Google Scholar] [CrossRef]
- Joshi, N.; Kalra, A. Analyzing the Association between ENSO and Groundwater Rise in the South Atlantic-Gulf Region in the Southeastern United States. Hydrology 2021, 8, 119. [Google Scholar] [CrossRef]
- Zhang, W.; Li, S.; Jin, F.-F.; Xie, R.; Liu, C.; Stuecker, M.F.; Xue, A. ENSO Regime Changes Responsible for Decadal Phase Relationship Variations Between ENSO Sea Surface Temperature and Warm Water Volume. Geophys. Res. Lett. 2019, 46, 7546–7553. [Google Scholar] [CrossRef]
- Cai, W.; Santoso, A.; Collins, M.; Dewitte, B.; Karamperidou, C.; Kug, J.-S.; Lengaigne, M.; McPhaden, M.J.; Stuecker, M.F.; Taschetto, A.S.; et al. Changing El Nino-Southern Oscillation in a warming climate. Nat. Rev. Earth Environ. 2021, 2, 628–644. [Google Scholar] [CrossRef]
- Geng, T.; Cai, W.; Wu, L.; Santoso, A.; Wang, G.; Jing, Z.; Gan, B.; Yang, Y.; Li, S.; Wang, S.; et al. Emergence of changing Central-Pacific and Eastern-Pacific El Nino-Southern Oscillation in a warming climate. Nat. Commun 2022, 13, 6616. [Google Scholar] [CrossRef] [PubMed]
- Hu, C.D.; Zhang, C.Y.; Yang, S.; Chen, D.K.; He, S.P. Perspective on the northwestward shift of autumn tropical cyclogenesis locations over the western North Pacificfrom shifting ENSO. Clim. Dynam 2018, 51, 2455–2465. [Google Scholar] [CrossRef]
- Pu, L.; Fan, D.; You, W.; Jiang, Z.; Yang, X.; Wan, X.; Nigatu, Z.M. Analysis of mass flux variations in the southern Tibetan Plateau based on an improved spatial domain filtering approach for GRACE/GRACE-FO solutions. Int. J. Remote Sens 2022, 43, 3563–3591. [Google Scholar] [CrossRef]


Publisher’s Note: MDPI stays neutral with regard to jurisdictional claims in published maps and institutional affiliations. |
© 2022 by the authors. Licensee MDPI, Basel, Switzerland. This article is an open access article distributed under the terms and conditions of the Creative Commons Attribution (CC BY) license (https://creativecommons.org/licenses/by/4.0/).